The State of Democracy in Sub-Saharan Africa
30
1 The State of Democracy in Sub-Saharan Africa Robert H. Bates Department of Government, Harvard University, 1737 Cambridge Street, Cambridge, MA 02138 Ghada Fayad OXCARRE, Department of Economics, University of Oxford, Manor Road, Oxford, OX1 3UQ Anke Hoeffler* Centre for the Study of African Economies, Department of Economics, University of Oxford, Manor Road, Oxford, OX1 3UQ *Corresponding Author August 2012 We would like to thank the editor, three anonymous referees, Tim Besley, Rick van der Ploeg, Steven Poelhekke, as well as participants at seminars in the department of Economics, Oxford; Political Science at University College London and the CSAE 2011 conference, Oxford, for comments on earlier drafts. The usual disclaimer applies.
Transcript of The State of Democracy in Sub-Saharan Africa
1
The State of Democracy in Sub-Saharan Africa
Robert H. Bates
Department of Government, Harvard University, 1737 Cambridge Street, Cambridge,
MA 02138
Ghada Fayad
OXCARRE, Department of Economics, University of Oxford, Manor Road, Oxford, OX1
3UQ
Anke Hoeffler*
Centre for the Study of African Economies, Department of Economics, University of Oxford,
Manor Road, Oxford, OX1 3UQ
*Corresponding Author
August 2012
We would like to thank the editor, three anonymous referees, Tim Besley, Rick van der Ploeg, Steven
Poelhekke, as well as participants at seminars in the department of Economics, Oxford; Political
Science at University College London and the CSAE 2011 conference, Oxford, for comments on
earlier drafts. The usual disclaimer applies.
2
Abstract
Africa experienced a wave of democratization over the past 20 years and this increase in democracy,
we find, positively and significantly affects income per capita. Our dynamic panel data results suggest
that countries only slowly converge to their long-run income values as predicted by current
democracy levels, however: African countries may therefore be currently too democratic relative to
their income levels. In keeping with this possibility, a significant number of countries experience
political ‘back sliding’: elections are won by the use of illicit tactics, term limits on political leaders
have been overturned and there have been unconstitutional seizures of power.
Keywords: Income, democracy, Sub-Saharan Africa, Dynamic panel data.
JEL Classification: C23, O11, O17, O55
3
1. Introduction
In this paper we examine the state of democracy in Sub-Saharan Africa and its impact on
Africa’s economic performance.
Following 1989 the region experienced a wave of democratization: most countries held
elections and legalized multi-party systems and many introduced term limits for their leaders.
Subsequently, Africa’s economies grew at a rate not witnessed since the time of
independence. We offer evidence of a causal relationship between democratization and
economic performance. We also offer evidence that the democratic impulse may have
weakened and economic growth now arises from economic forces external to Africa rather
than from political forces within.
Section 2 provides a brief overview of the literature on the relationship between income and
democracy and the place of Africa within it. In Section 3 we discuss our methods and data
and, in Section 4, our statistical results. We find that for Sub-Saharan Africa democracy
‘Granger’ causes income. We then quantify the long- as well as the short-run relationship
between democracy and income. Our error-correction mechanism predicts a slow adjustment
to the long-run equilibrium, which, we suggest, implies that recent levels of democracy may
be too high for prevailing levels of income. In support of this conjecture, we present recent
evidence on political ‘back sliding. Section 5 concludes.
4
2. Background
The analysis of democracy in Africa can usefully be placed within the larger literature on
income and democracy. Seymour Martin Lipset reported a strong and positive correlation
between income per capita and democracy in a global cross section of nations (Lipset 1959).
He suggested that economic development causes a series of profound social changes that
result in democracy. Doing so, he not only lay the foundations of modernization theory in
comparative politics but also defined a major portion of the contemporary agenda in political
economy, with its focus on the relationship between political institutions and economic
development.1
The new institutionalists (e.g. North and Thomas 1973; North 1981; North 1990) take a
different view: Unlike Lipset they suggest that good institutions cause development (see also
Barro, 1996). The impact of the new institutionalism extends beyond academic circles. By
way of illustration, consider the work by Burnside and Dollar (2000), who suggested that aid
is only growth enhancing in environments blessed with good institutions. In response to
institutionalist arguments, donors began to offer aid selectively, i.e. to countries with good
governance.2 As a result, in Africa, a number of countries received less aid.
Dissenting from both schools, recent contributors suggest that there is no relationship
between income and democracy. Przeworski et al (2000) failed to find a significant
relationship between the level of income per capita and the likelihood of transition to
democracy. While Boix and Stokes (2003) and Epstein et al (2006) have challenged
Przeworski et al’s finding, it has subsequently been replicated by Acemoglu, Johnson,
Robinson and Yared (2008), henceforth AJRY. While they concede that there is a positive
1 See the contributions to Helpman, E., Ed. (2008).
2 The analysis by Burnside and Dollar (2000) has been discussed and re-examined in a large number of papers.
Key articles include Dalgaard and Hansen (2001), Dalgaard et al (2004) and Rajan and Subramanian (2008).
Roodman (2007) and Beynon (2002, 2003) provide excellent and accessible overviews of the issues.
5
correlation between democracy and income, they claim that there is no evidence for a causal
link. Their panel regressions show that higher incomes do not lead to higher levels of
democracy. They interpret their findings as evidence “that political and economic political
development paths are interwoven” (AJRY: 836) and that at “certain critical junctures”
(AJRY: 813) societies embarked on divergent political-economic development paths. A result
of these divergent processes is that some countries end up democratic and rich while others
remain autocratic and poor. While this appears plausible, their interpretation may rest on
weak foundations: Gundlach and Paldam (2009) argue that AJRY find no relationship
between democracy and income due to the statistical methods they apply.
The study of Africa has both much to learn and much to contribute to these debates. From
them, it can learn how best to measure the relationship between political change and
economic performance: an issue that we confron in the section that follows. In addition, it
can help to adjudicate the debate over Lipset’s conjecture, evenexploring the state of
democracy in Sub-Saharan Africa.
3. Methods and Data
Past work has either examined a cross-section of countries (Lipset, 1959) or panels
containing a large number of countries (‘large n’) but a small number of years (‘small t’) (e.g.
Barro 1996, 1999; AJRY). We focus on the relationship between income and democracy,3
measures of which exist for most countries and extend back to 1960. By comparison with the
methods employed by previous researchers, our estimator makes more efficient use of time
series data. Our ability to make greater use of the temporal dimension of the data enables us
3 Lipset (1959) included a series of other factors in his conception of “modernity,” such as urbanization,
education, and literacy.

6
(1) to investigate the direction of causality and (2) to examine the long and short-run relation
between income and democracy in a panel error correction model.
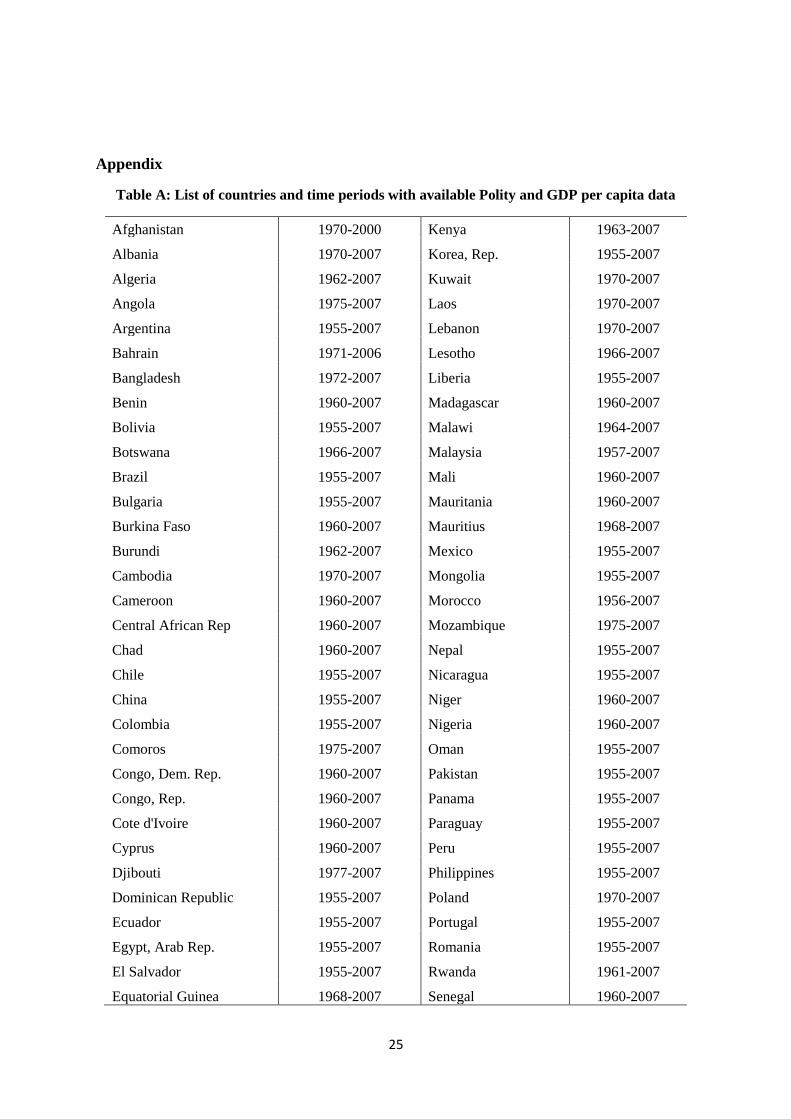
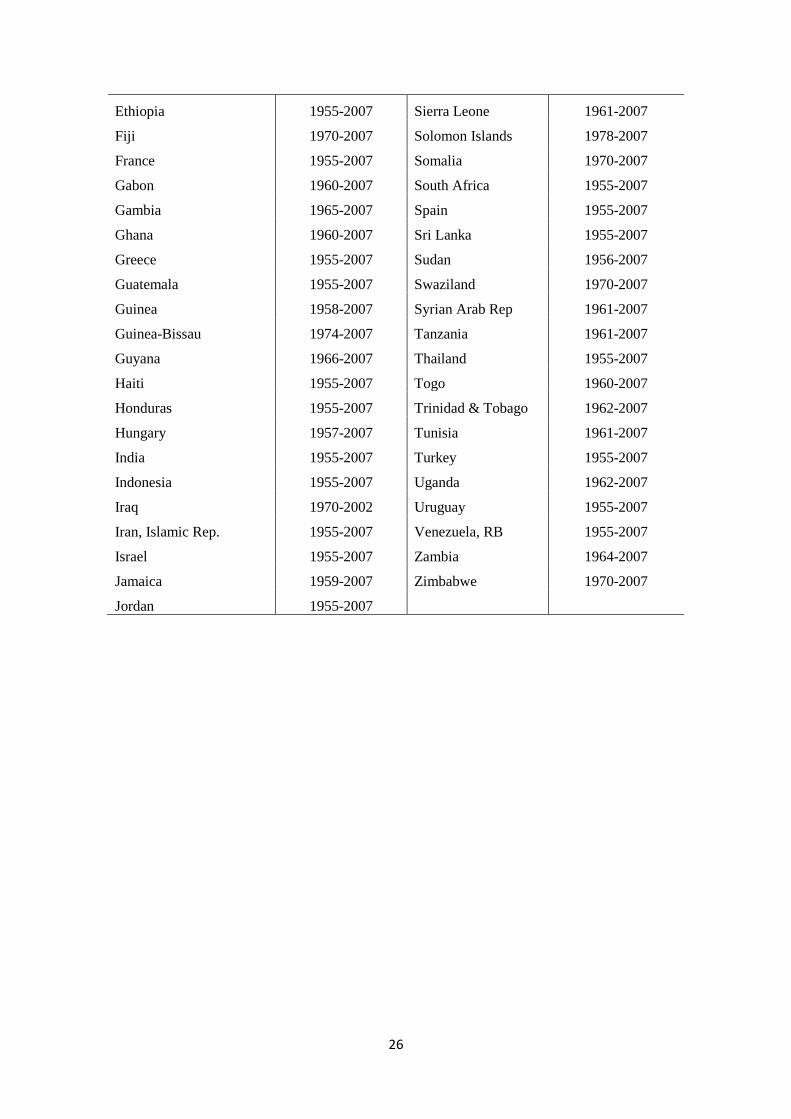
3.1 Data
We use the Penn World Tables' (PWT 6.3) chain weighted real GDP per capita series and the
Polity IV democracy index which distributes over a range spanning the interval between
perfect autocracies (score of -10) and perfect democracies (score of 10). Our sample includes
105 countries, 42 of which are in Sub-Saharan Africa4. Figure 1 shows that on average
incomes and polity scores have risen over time. While incomes have grown relatively
smoothly, in the late 1980s, the polity index jumped discontinuously from -0.4 in 1989 to 1.9
in 1992. As seen in Figure 2, there are important regional differences in the movement
toward democracy. Latin America democratized prior to the fall of Communism. Africa and
the Middle East both democratized after 1990. The polity scores then diverged, with those in
Sub-Saharan improving more rapidly.
--- Figures 1&2 about here ---
3.2 Methods: Granger Causality Tests and Pooled Mean Group (PMG) Estimation
We begin by entering into the first of the debates outlined above and ask: Does income cause
democracy or does the causal relationship run the other way ‘round? We use ‘Granger
causality’ tests to tackle this question5. The idea of ‘Granger causality’ is that if income
causes democracy then (1) income should help to predict democracy and (2) democracy
should not help to predict income. To test the null hypothesis that ‘income does not cause
4 The sample size is limited by the method we employ. We use Pooled Mean Group (PMG) estimation which
computes coefficients for each country separately. Thus we can only include countries with sufficiently long
time series and cannot include countries with no time variation in the dependent variable. 5 For a textbook description of this method see for example Wooldridge (2009).
7
democracy’ we regress democracy, d, against lagged values of democracy and lagged values
of income, y (‘the unrestricted regression’):
.
We then regress democracy only against lagged values of democracy (‘the restricted
regression’):
A simple F test can then be used to determine whether the lagged values of income contribute
significantly to the explanatory power of the ‘unrestricted model’. If they do, we reject the
null hypothesis and conclude that income ‘Granger’ causes democracy.
We also test the null hypothesis that ‘democracy causes income’:
versus
.
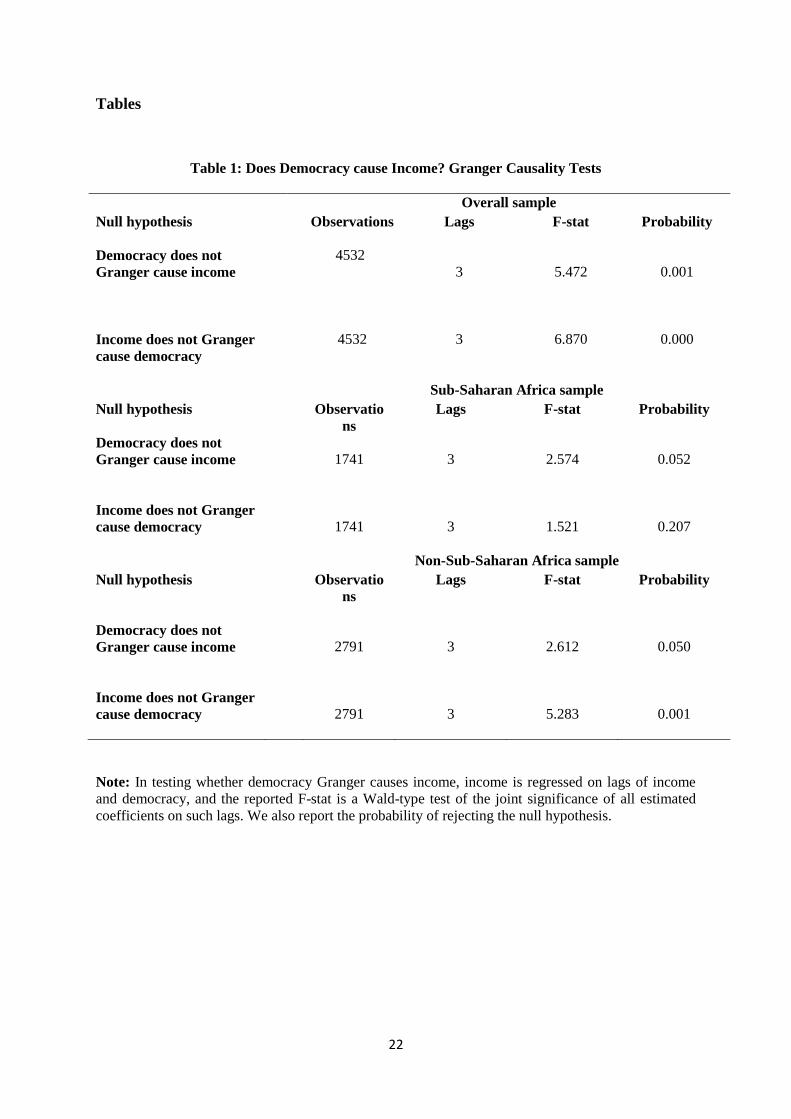
As Table 1 shows, for the global and non-Sub-Saharan Africa samples, Granger tests indicate
that for the global sample causality between income and democracy runs in both directions.
But for the Sub-Saharan Africa portion of the sample they indicate that democracy ‘Granger’
causes income. Our findings thus indicate that while income and democracy are positively
related in the global sample, the relationship is not causal, but that in Sub-Saharan Africa,
democratization has produced higher incomes.
--- Table 1 about here ---
Having established the possibility of causality, we estimate the short and long term
relationship between income and democracy, focusing primarily on Africa. We could follow
AJRY and use either pooled OLS or fixed effects estimation. However, we decide to use an
8
augmented version of the Pooled Mean Group (PMG) estimator of Pesaran et al (1999) for a
number of reasons. The end of the Cold War resulted in an exogenous worldwide wave of
democratization and we want to analyze the dynamic response of incomes and democracy
levels across countries.6 This analytic focus requires the use of a dynamic panel estimation
technique that allows us to make full use of the available time series data. Furthermore, OLS
as well as fixed effects estimation assume that the parameters are homogenous across the
panel, i.e. all of the countries respond to changes in the same way. In contrast, the PMG
estimator not only allows us to account for country and year effects but also for parameter
heterogeneity across panel members. We now discuss our choice of estimator in more detail.
In their critique of AJRY, Gundlach and Paldam (2009) suggest that the inclusion of time and
country fixed effects purged useful information in panel data estimation, thereby predisposing
them to fail in their search for a relationship between income and democracy. Their argument
highlights an important methodological dilemma: Including country specific fixed effects
eliminates useful informative variation from the data; but excluding them introduces omitted
variable bias. Employing an augmented version of the PMG estimator of Pesaran et al
(1999), we confront – and surmount – this dilemma. While taking into account country and
year effects, we relax the assumption of cross-sectional parameter homogeneity. Even while
controlling for omitted variables, we thereby extract information from sources of variation
that, with their methods, AJRY had perforce to ignore.
The PMG estimator allows intercepts, slope coefficients and error variances to vary across
countries. More specifically, it allows the short-run coefficients to vary across countries,
while restricting long-run relationships to be homogeneous. In the context of this research,
6 A model describing the short run response of variables to an exogenous change to their equilibrium values is
provided by Dornbusch (1976). In this ‘Overshooting Model’ variables respond by over-adjusting before
returning to their (new) long run equilibrium.
9
the estimator “assumes” that in the short run – or while adjusting to a common long-run
equilibrium – each country’s political institutions respond differently to income shocks.
Because it allows for heterogeneous intercepts, the PMG estimator can incorporate country-
specific fixed effects. But because it estimates the model for each country separately, it
cannot allow the inclusion of year fixed effects. To correct for potential cross-section
dependence in the estimated errors, we – as do Binder and Offermanns (2007) – therefore
augment the model with the cross-sectional averages of the dependent variable and
regressors.7
To summarize formally, let itd represent democracy and ity represent income per capita for
country i at time t , and
N
i
ittyNy
1
1,
N
i
itt dNd1
1respectively represent their cross-
sectional averages. The ECM with p lags on both the dependent and explanatory variables
then is:
it
p
j
jtiij
p
j
jtiij
p
j
jtiij
p
j
jtiij
ttititiiit
ydvyd
yddyy
1
0
,
1
0
,
1
0
,
1
1
,
1, )(
(1)
Crucially, the error term it is identically and independently distributed across i and t even in
the presence of common time effects. Country intercepts -- unobserved country heterogeneity
– are captured by the term i .
The second part of equation (1) includes the lagged changes of income and democracy; the
coefficients represent the short-run adjustment terms and are assumed to vary across
countries. We do not report the short-run coefficients below. The first part of equation (1)
captures the common long-run relationship between income and democracy. The slope
7 For more detail on the estimation methods please refer to Fayad et al (2011). To minimize any bias resulting
from possible endogeneity and to ensure that the regression residuals are serially uncorrelated, we augment our
model with lags of the regressors and dependent variable.
10
coefficients -- , , and -- measure the long-run response of income to democracy, world
income and world democracy. is the error correction coefficient and indicates the speed of
adjustment If the system is dynamically stable and converges to a long-run equilibrium, then
this coefficient will be negative and less than one in absolute value. We report these long-run
coefficients below.
Starting with an initial estimate of the long-run parameters, the PMG estimator calculates
estimates of error-correction and other short-run coefficients (including country-specific
intercepts and error variances) as the averages of the estimated parameters for each cross-
section. It then employs these average estimates to update its estimates of the long-run
parameters, repeating the process until convergence is achieved.
4. Results
The results of our analysis confirm the existence of a positive relationship between the level
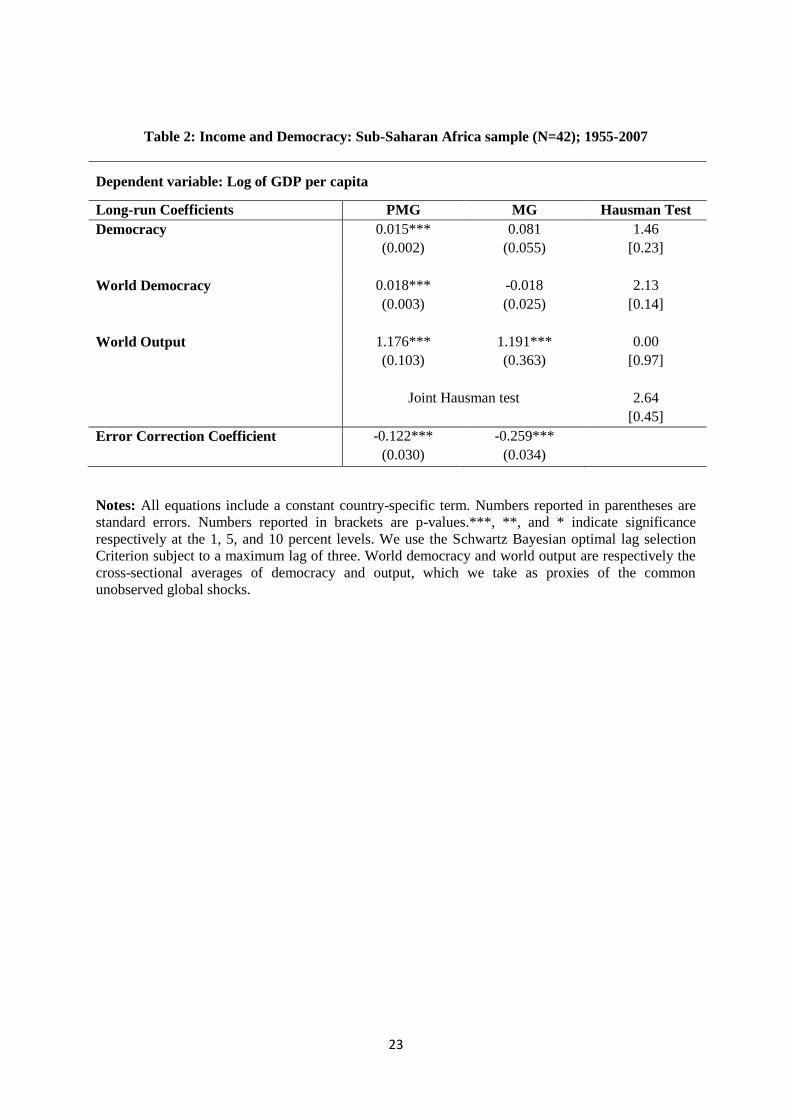
of democracy and income in Sub-Saharan Africa (Table 3). 8
They suggest that a one-unit
increase in democracy leads to a 1.5% increase in per capita income. Given that the average
of the Polity index rose by roughly 9 points, 1977-2008, this implies an increase in per capita
income of over 10 percentage points, a large number, but roughly in line with what actually
occurred. While the sign and significance of the coefficients on the measures of global trends
remind us that the performance of Africa’s economies is shaped by international forces, the
sign and significance of the coefficient on income lends support to what the Granger causality
8 Note that we also report the related mean group (MG) estimator (Pesaran and Smith, 1995) which allows for
complete (short-run and long-run) parameter heterogeneity across panel cross-sections. Using the difference
between the two sets of estimates, we employ a Hausman-type test to assess the assumption of long run
homogeneity. Using this test, we cannot reject the assumption of long run homogeneity.
11
test implies: that in Africa domestic political institutions affect the performance of
economies.9
--- Tables 2 and 3 about here ---
4.1 Why Africa?
With the data at hand, we are not in a position to explain why political reform led to
economic growth in the African but not in other portions of the global sample. We are in a
position to offer hypotheses, however. Our favourite is based on the high degree of urban
bias that was exhibited by Africa’s authoritarian regimes and the realization that
democratization led to the enfranchisement of a largely rural electorate.
As summarized in Ndulu et al (2008), the economic policies of many African regimes were
characterized (inter alia) by:
Tariff policies that protected domestic manufacturing (but not agriculture).
Industrial regulations that conferred market power on the purchasers of agricultural
products rather than on the producers of manufactured goods.
Over-valuation of their domestic currencies exchange rate.
Given that manufacturing received offsetting protection from foreign products, the last of
these measures further tilted relative prices in favour of the urban sector. Taken together, the
policies were therefore biased against agriculture – the largest single industry in most of
Africa’s economies in Africa. One result was slow growth. The estimates reported in Ndulu
et al (2008) suggest that governments that adopted this mixture of policies lowered their
country’s rate of growth by nearly two percentage points per annum 1960-2000.
9 Turn to Radelet (2010) for a clear and well-argued discussion of 17 political and economic “success stories” in
Africa.
12
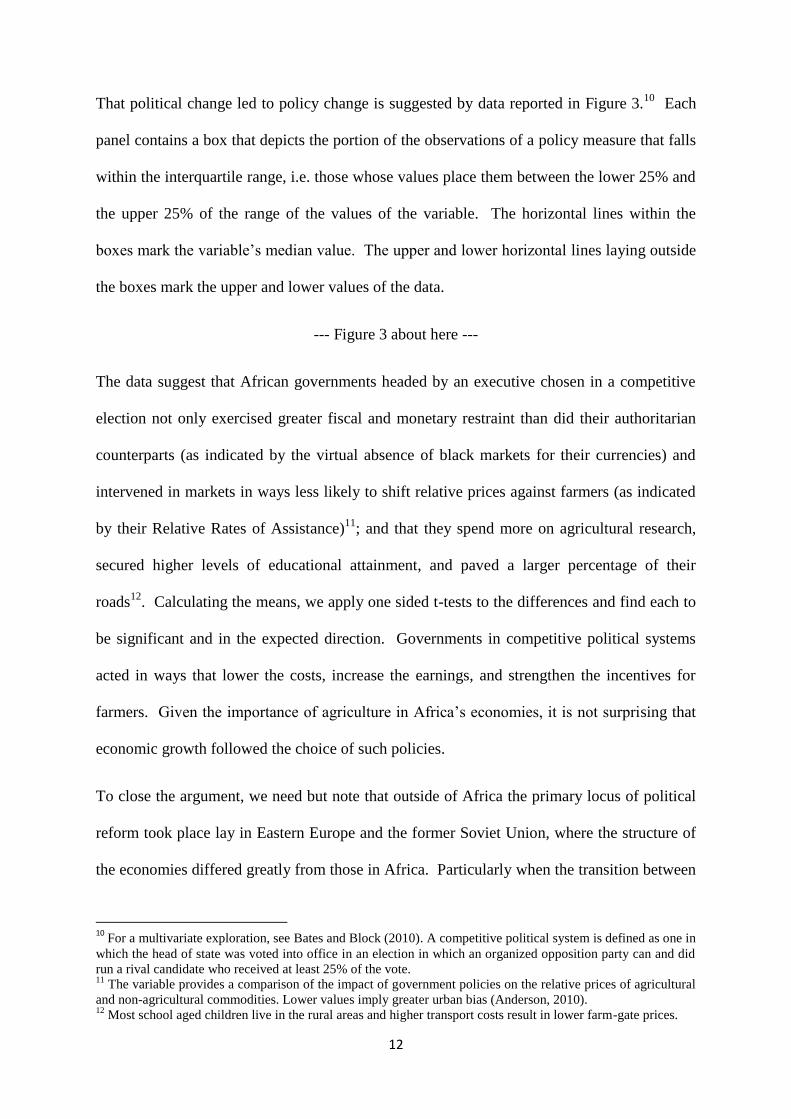
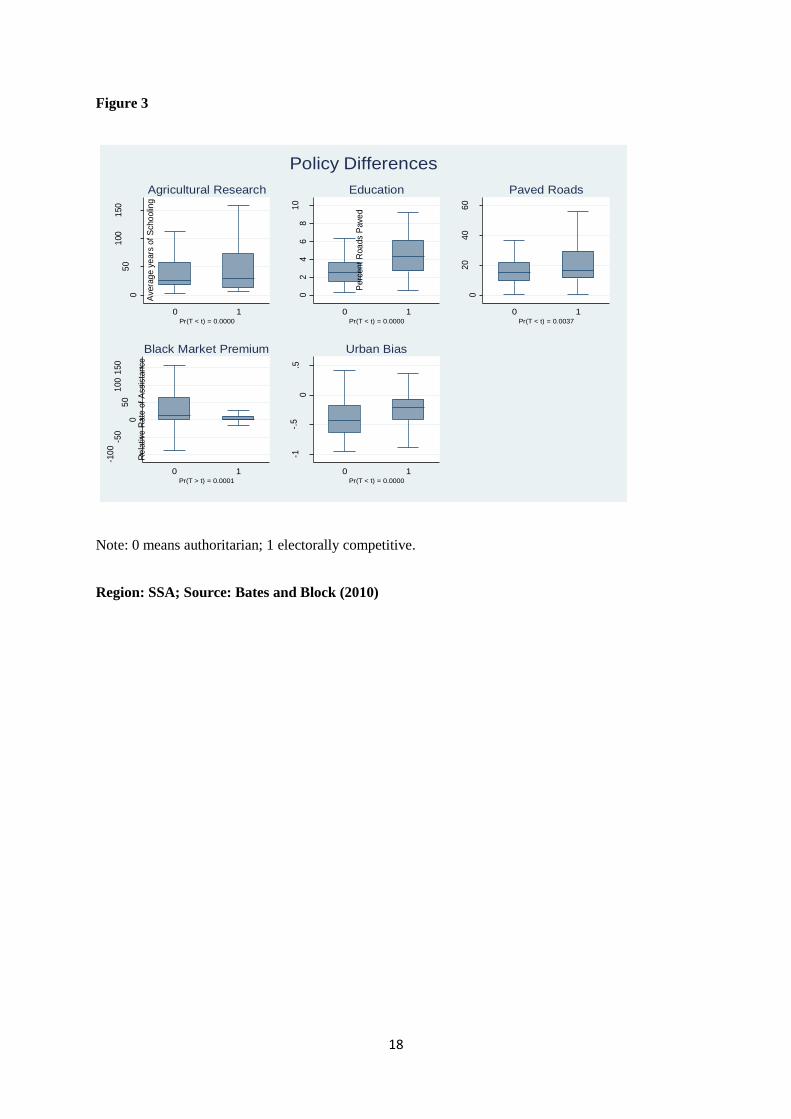
That political change led to policy change is suggested by data reported in Figure 3.10
Each
panel contains a box that depicts the portion of the observations of a policy measure that falls
within the interquartile range, i.e. those whose values place them between the lower 25% and
the upper 25% of the range of the values of the variable. The horizontal lines within the
boxes mark the variable’s median value. The upper and lower horizontal lines laying outside
the boxes mark the upper and lower values of the data.
--- Figure 3 about here ---
The data suggest that African governments headed by an executive chosen in a competitive
election not only exercised greater fiscal and monetary restraint than did their authoritarian
counterparts (as indicated by the virtual absence of black markets for their currencies) and
intervened in markets in ways less likely to shift relative prices against farmers (as indicated
by their Relative Rates of Assistance)11
; and that they spend more on agricultural research,
secured higher levels of educational attainment, and paved a larger percentage of their
roads12
. Calculating the means, we apply one sided t-tests to the differences and find each to
be significant and in the expected direction. Governments in competitive political systems
acted in ways that lower the costs, increase the earnings, and strengthen the incentives for
farmers. Given the importance of agriculture in Africa’s economies, it is not surprising that
economic growth followed the choice of such policies.
To close the argument, we need but note that outside of Africa the primary locus of political
reform took place lay in Eastern Europe and the former Soviet Union, where the structure of
the economies differed greatly from those in Africa. Particularly when the transition between
10
For a multivariate exploration, see Bates and Block (2010). A competitive political system is defined as one in
which the head of state was voted into office in an election in which an organized opposition party can and did
run a rival candidate who received at least 25% of the vote. 11
The variable provides a comparison of the impact of government policies on the relative prices of agricultural
and non-agricultural commodities. Lower values imply greater urban bias (Anderson, 2010). 12
Most school aged children live in the rural areas and higher transport costs result in lower farm-gate prices.

13
socialist and market-based economies was impeded by the actions of large firms and their
allies in the bureaucracy (Hellman 1998), it remained politically attractive to continue to
advocate policies that favored consumers over producers in the post-socialist economies.
Beneath this argument lie assumptions about “the African voter,” and, in particular, that rural
voters are willing and able to respond to policy positions rather than, say, communal appeals.
A rapidly growing number of studies suggest that while individual voters might prefer
candidates who come from their ethnic group, many fail to find the opportunity to vote in
accord with that preference.13
Researchers also find that evaluations of the economy play a
major role in voting decisions, Given these findings, politicians whose fates rest in the hands
of a rural electorate might well be loath to advocate policies that favor urban consumers over
rural producers.14
4.2 Reasons for caution
The results also suggest several reasons for concern. When the sample is disaggregated by
time period (Table 3), the coefficient relating democracy to income appears to decline,
suggesting that the relationship between the level of democracy and income has eroded.15
Troubling too is the magnitude of the error correction coefficient (Table 2): -0.122, which
implies that the response slow, taking nearly a decade to accomplish.16
13
It is not possible for parties to generate the quantity and mixture of candidates to satisfy such preferences. 14
See Mattes and Piombo (1999), Posner and Simon (2002), Gibson and Long (2012) and Hoffman and Long
(2012). 15
Indeed, the data in Table 3 suggest that Africa’s current economic growth appears now to be propelled by
growth abroad – as in China and India, for example—rather than by political reform at home. 16
These results are robust to the inclusion of foreign aid as a percent of GDP as an additional covariate.
Inspection of the estimates of the individual country error correction coefficient suggests that Angola, Burkina
Faso, Gabon, Gambia, Ghana, Guinea Bissau, Liberia, Malawi, Mali, Mauritania, Mozambique, Nigeria,
Rwanda and Tanzania exhibit higher than average values, suggesting that income adjusts more quickly to its
long-run value, given their current level of democracy. Rwanda, Mauritania, Ghana and Gambia have error
correction coefficients three or more times higher than the average. The reasons for this dispersion continue to
intrigue - and to elude - us.
14
Taken together – and possibly over-interpreting – these findings may be suggesting that
political reform left Africa “too democratic,” given the level of income. They may imply that
the continent has begun to regress to its expected value of democracy, not by growing
economically but rather by becoming less democratic. While confirming the political origins
of economic growth in Africa, our results thus also suggest their fragile nature.
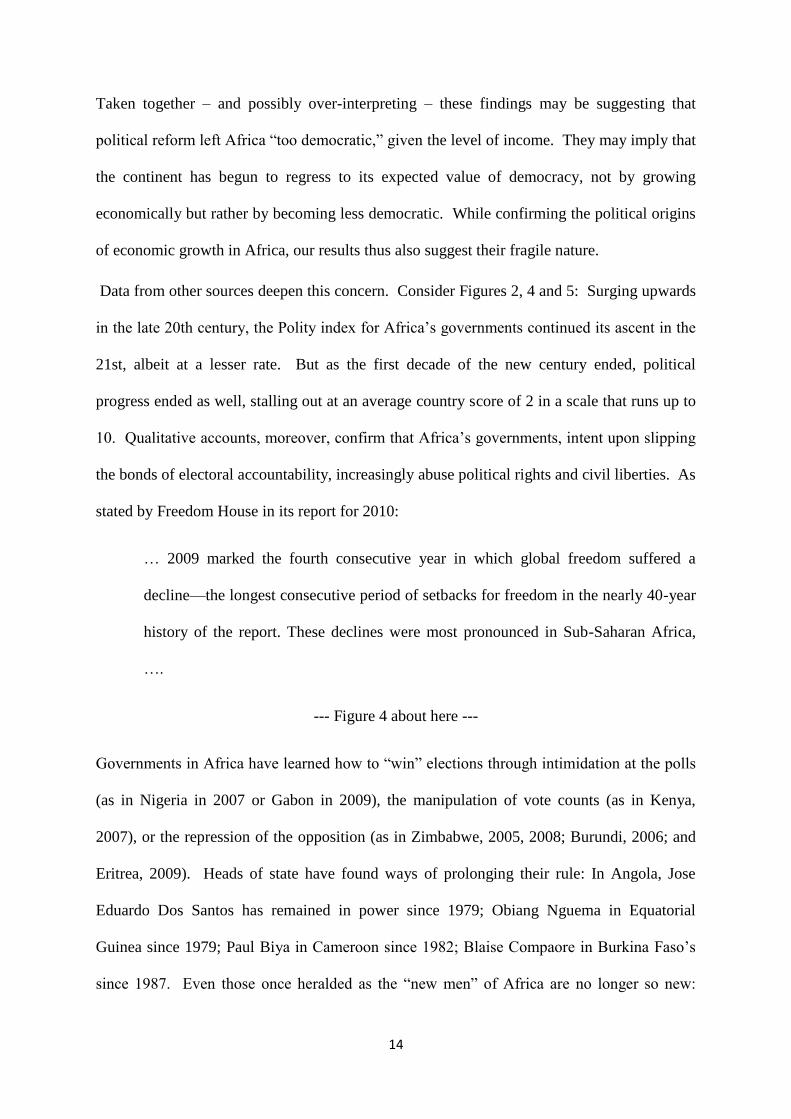
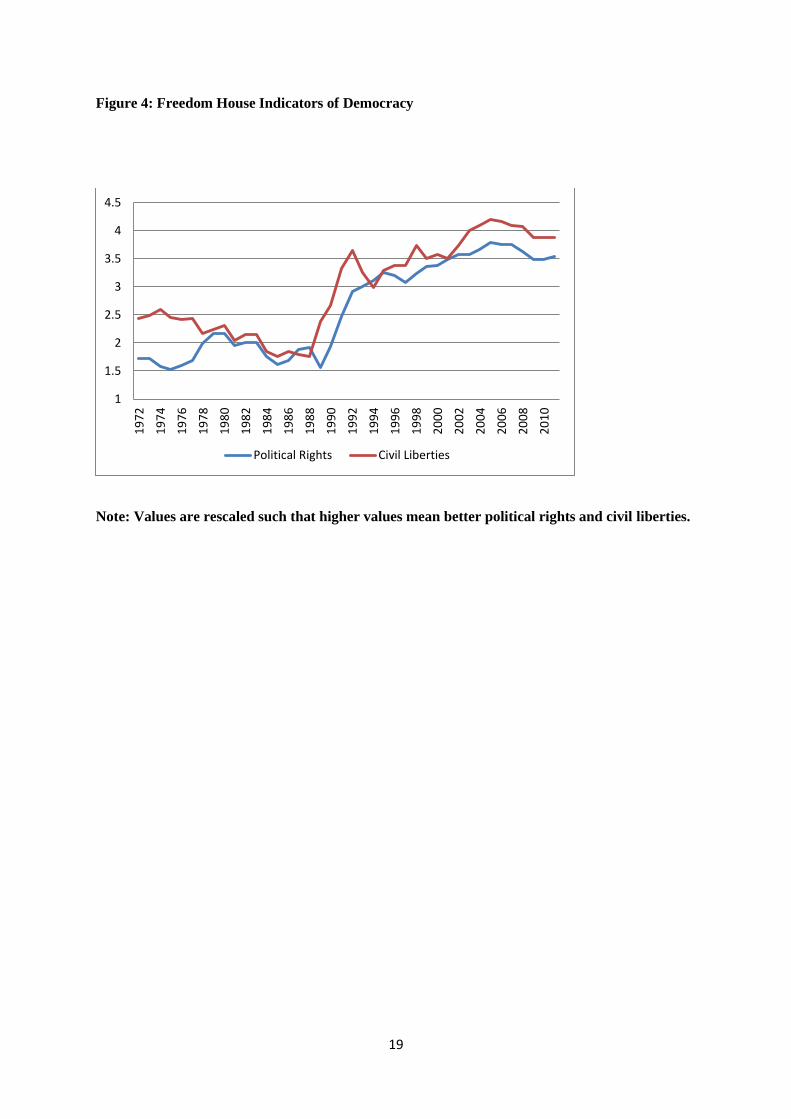
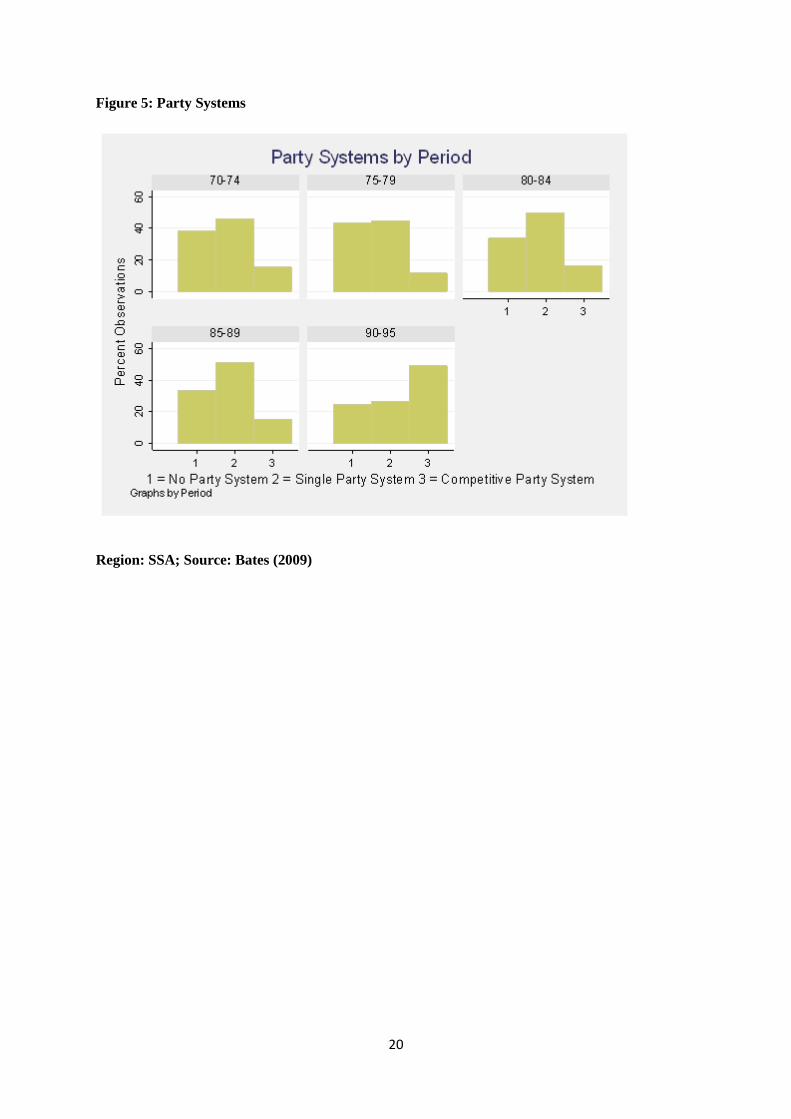
Data from other sources deepen this concern. Consider Figures 2, 4 and 5: Surging upwards
in the late 20th century, the Polity index for Africa’s governments continued its ascent in the
21st, albeit at a lesser rate. But as the first decade of the new century ended, political
progress ended as well, stalling out at an average country score of 2 in a scale that runs up to
10. Qualitative accounts, moreover, confirm that Africa’s governments, intent upon slipping
the bonds of electoral accountability, increasingly abuse political rights and civil liberties. As
stated by Freedom House in its report for 2010:
… 2009 marked the fourth consecutive year in which global freedom suffered a
decline—the longest consecutive period of setbacks for freedom in the nearly 40-year
history of the report. These declines were most pronounced in Sub-Saharan Africa,
….
--- Figure 4 about here ---
Governments in Africa have learned how to “win” elections through intimidation at the polls
(as in Nigeria in 2007 or Gabon in 2009), the manipulation of vote counts (as in Kenya,
2007), or the repression of the opposition (as in Zimbabwe, 2005, 2008; Burundi, 2006; and
Eritrea, 2009). Heads of state have found ways of prolonging their rule: In Angola, Jose
Eduardo Dos Santos has remained in power since 1979; Obiang Nguema in Equatorial
Guinea since 1979; Paul Biya in Cameroon since 1982; Blaise Compaore in Burkina Faso’s
since 1987. Even those once heralded as the “new men” of Africa are no longer so new:
15
Meles Zewani, Yoweri Museveni, and Isaias Afwerki have held the Presidency of their
respective states for an average of 19 years.
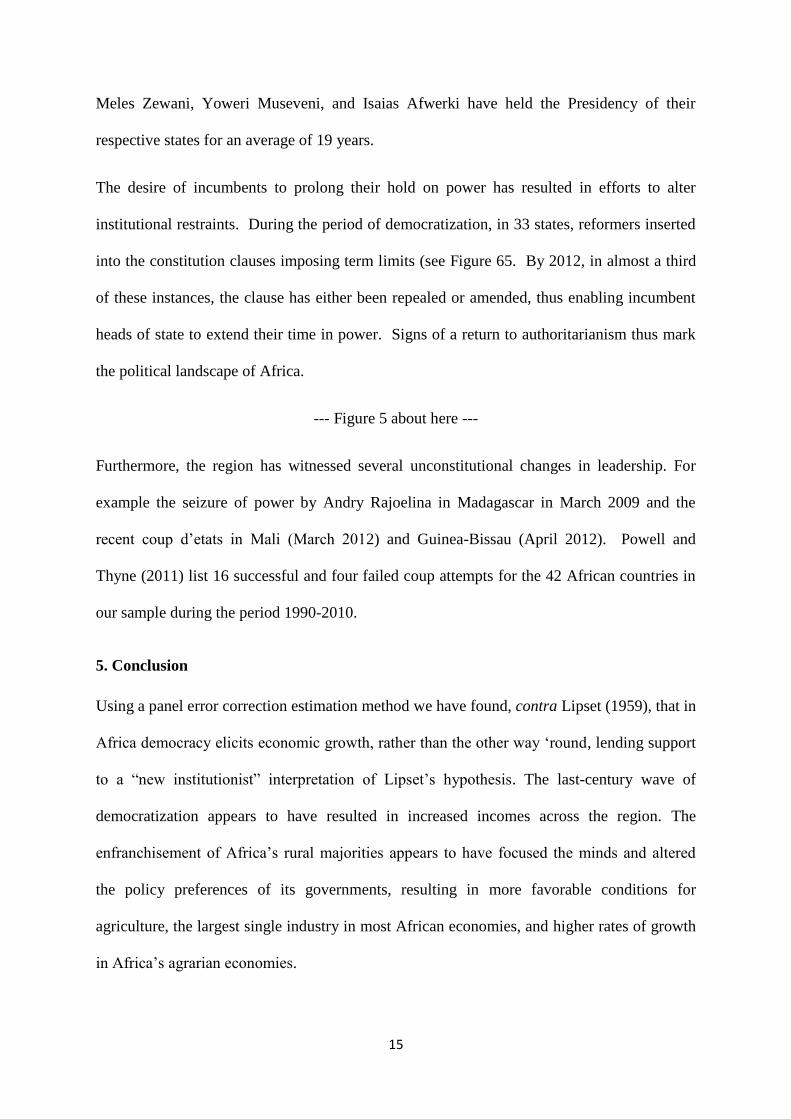
The desire of incumbents to prolong their hold on power has resulted in efforts to alter
institutional restraints. During the period of democratization, in 33 states, reformers inserted
into the constitution clauses imposing term limits (see Figure 65. By 2012, in almost a third
of these instances, the clause has either been repealed or amended, thus enabling incumbent
heads of state to extend their time in power. Signs of a return to authoritarianism thus mark
the political landscape of Africa.
--- Figure 5 about here ---
Furthermore, the region has witnessed several unconstitutional changes in leadership. For
example the seizure of power by Andry Rajoelina in Madagascar in March 2009 and the
recent coup d’etats in Mali (March 2012) and Guinea-Bissau (April 2012). Powell and
Thyne (2011) list 16 successful and four failed coup attempts for the 42 African countries in
our sample during the period 1990-2010.
5. Conclusion
Using a panel error correction estimation method we have found, contra Lipset (1959), that in
Africa democracy elicits economic growth, rather than the other way ‘round, lending support
to a “new institutionist” interpretation of Lipset’s hypothesis. The last-century wave of
democratization appears to have resulted in increased incomes across the region. The
enfranchisement of Africa’s rural majorities appears to have focused the minds and altered
the policy preferences of its governments, resulting in more favorable conditions for
agriculture, the largest single industry in most African economies, and higher rates of growth
in Africa’s agrarian economies.
16
Focusing on Africa itself, we have learned that the re-introduction of competitive electoral
systems appears to have enhanced the level of income. However, the data appear also to
suggest that the political origins of Africa’s growth remain fragile. And, indeed, in a large
number of countries these reforms appear embattled: elections are won by the use of illicit
tactics, term limits have been challenged and, in some instances, abolished; and
unconstitutional leadership turnovers remain distressingly commonplace. Given the long-
term relationship between income and democracy, recent democracy levels may in Africa
have been too high to be sustainable; and international rather than internal forces – such as
the level of global income -- may determine its economic future.

17
Figures
Figure 1: Global Democracy and Income
Figure 2: Average Regional Democracy Scores
0
1000
2000
3000
4000
5000
6000
7000
8000
-3
-2
-1
0
1
2
3
4
5
year
19
62
19
65
19
68
19
71
19
74
19
77
19
80
19
83
19
86
19
89
19
92
19
95
19
98
20
01
20
04
20
07
Po
lity
Sco
re
Polity Income per capita
-10
-8
-6
-4
-2
0
2
4
6
8
19
60
19
63
19
66
19
69
19
72
19
75
19
78
19
81
19
84
19
87
19
90
19
93
19
96
19
99
20
02
20
05
20
08
Po
lity
Sco
re
ssa latin mena asia
18
Figure 3
Note: 0 means authoritarian; 1 electorally competitive.
Region: SSA; Source: Bates and Block (2010)
05
01
00
150
R &
D E
xpen
ditu
re
0 1Pr(T < t) = 0.0000
Agricultural Research
02
46
81
0
Ave
rag
e y
ears
of
Sch
oolin
g
0 1Pr(T < t) = 0.0000
Education
02
04
06
0
Perc
en
t R
oa
ds
Pave
d
0 1Pr(T < t) = 0.0037
Paved Roads
-10
0-5
0
05
01
00
150
Inde
x of
Ove
rva
lua
tion
0 1Pr(T > t) = 0.0001
Black Market Premium
-1-.
50
.5
Re
lative
Rate
of
Ass
ista
nce
0 1Pr(T < t) = 0.0000
Urban Bias
Policy Differences
19
Figure 4: Freedom House Indicators of Democracy
Note: Values are rescaled such that higher values mean better political rights and civil liberties.
1
1.5
2
2.5
3
3.5
4
4.5
19
72
19
74
19
76
19
78
19
80
19
82
19
84
19
86
19
88
19
90
19
92
19
94
19
96
19
98
20
00
20
02
20
04
20
06
20
08
20
10
Political Rights Civil Liberties
20
Figure 5: Party Systems
Region: SSA; Source: Bates (2009)

21
Figure 6: Term Limits in Sub-Saharan Africa
No
No
No
Yes
Yes
Yes
Yes
Does the constitution provide a two term limit for the presidency?
Has that term limit been reached?
Was there an attempt to amend the constitution?
Did it succeed?
Cote d’Ivoi.
Eq. Guinea
Gambia
Guinea-Biss.
Angola
Burundi
C.A.R.
Congo Rep.
Djibouti
D.R.C
Benin
Cape Verde
Ghana
Kenya
Mali
Mozambique
Malawi
Nigeria
Burkina Faso
Cameroon
Chad
Gabon
Guinea
Namibia
Niger
Adapted and extended to March 2012 from Posner and Young (2007). 1 Seychelles has a three term limit.
No
22
Tables
Table 1: Does Democracy cause Income? Granger Causality Tests
Overall sample
Null hypothesis
Observations Lags F-stat Probability
Democracy does not
Granger cause income
4532
3
5.472
0.001
Income does not Granger
cause democracy
4532 3 6.870 0.000
Sub-Saharan Africa sample
Null hypothesis
Observatio
ns
Lags F-stat Probability
Democracy does not
Granger cause income
1741
3
2.574
0.052
Income does not Granger
cause democracy
1741
3
1.521
0.207
Non-Sub-Saharan Africa sample
Null hypothesis Observatio
ns
Lags F-stat Probability
Democracy does not
Granger cause income
2791
3
2.612
0.050
Income does not Granger
cause democracy
2791
3
5.283
0.001
Note: In testing whether democracy Granger causes income, income is regressed on lags of income
and democracy, and the reported F-stat is a Wald-type test of the joint significance of all estimated
coefficients on such lags. We also report the probability of rejecting the null hypothesis.
23
Table 2: Income and Democracy: Sub-Saharan Africa sample (N=42); 1955-2007
Dependent variable: Log of GDP per capita
Long-run Coefficients PMG MG Hausman Test
Democracy 0.015*** 0.081 1.46
(0.002) (0.055) [0.23]
World Democracy 0.018*** -0.018 2.13
(0.003) (0.025) [0.14]
World Output 1.176*** 1.191*** 0.00
(0.103) (0.363) [0.97]
Joint Hausman test 2.64
[0.45]
Error Correction Coefficient -0.122*** -0.259***
(0.030) (0.034)
Notes: All equations include a constant country-specific term. Numbers reported in parentheses are
standard errors. Numbers reported in brackets are p-values.***, **, and * indicate significance
respectively at the 1, 5, and 10 percent levels. We use the Schwartz Bayesian optimal lag selection
Criterion subject to a maximum lag of three. World democracy and world output are respectively the
cross-sectional averages of democracy and output, which we take as proxies of the common
unobserved global shocks.

24
Table 3: Augmented PMG estimation; Sub-Saharan Africa sample;1955-2007 with 1989 cut-off
Dependent variable: Log of GDP per capita
PMG Long-run Coefficients 1955-1989
(N=32)
1
1978-1989
(N=19)
2
1989-2007
(N=41)
3
Democracy 0.008** 0.003*** -0.001
(0.004) (0.001) (0.001)
World Democracy 0.053** 0.012** -0.002
(0.022) (0.005) (0.002)
World Output 1.309*** 0.644*** 0.700***
(0.208) (0.157) (0.051)
Error Correction Coefficient -0.200*** -0.524*** -0.212***
(0.034) (0.110) (0.043)
Notes: All equations include a constant country-specific term. Numbers reported in parentheses are
standard errors. Numbers reported in brackets are p-values.***, **, and * indicate significance
respectively at the 1, 5, and 10 percent levels. For brevity we only report PMG results. The small time
series dimension allowed us to impose a common lag of one on income and democracy instead of
suing optimal lag selection criteria. World democracy and world output are respectively the cross-
sectional averages of democracy and output, which we take as proxies of the common unobserved
global shocks. The cross-sectional dimension varies for each column since over each time period the
countries who happen to have constant polity scores drop out.
25
Appendix
Table A: List of countries and time periods with available Polity and GDP per capita data
Afghanistan 1970-2000 Kenya 1963-2007
Albania 1970-2007 Korea, Rep. 1955-2007
Algeria 1962-2007 Kuwait 1970-2007
Angola 1975-2007 Laos 1970-2007
Argentina 1955-2007 Lebanon 1970-2007
Bahrain 1971-2006 Lesotho 1966-2007
Bangladesh 1972-2007 Liberia 1955-2007
Benin 1960-2007 Madagascar 1960-2007
Bolivia 1955-2007 Malawi 1964-2007
Botswana 1966-2007 Malaysia 1957-2007
Brazil 1955-2007 Mali 1960-2007
Bulgaria 1955-2007 Mauritania 1960-2007
Burkina Faso 1960-2007 Mauritius 1968-2007
Burundi 1962-2007 Mexico 1955-2007
Cambodia 1970-2007 Mongolia 1955-2007
Cameroon 1960-2007 Morocco 1956-2007
Central African Rep 1960-2007 Mozambique 1975-2007
Chad 1960-2007 Nepal 1955-2007
Chile 1955-2007 Nicaragua 1955-2007
China 1955-2007 Niger 1960-2007
Colombia 1955-2007 Nigeria 1960-2007
Comoros 1975-2007 Oman 1955-2007
Congo, Dem. Rep. 1960-2007 Pakistan 1955-2007
Congo, Rep. 1960-2007 Panama 1955-2007
Cote d'Ivoire 1960-2007 Paraguay 1955-2007
Cyprus 1960-2007 Peru 1955-2007
Djibouti 1977-2007 Philippines 1955-2007
Dominican Republic 1955-2007 Poland 1970-2007
Ecuador 1955-2007 Portugal 1955-2007
Egypt, Arab Rep. 1955-2007 Romania 1955-2007
El Salvador 1955-2007 Rwanda 1961-2007
Equatorial Guinea 1968-2007 Senegal 1960-2007
26
Ethiopia 1955-2007 Sierra Leone 1961-2007
Fiji 1970-2007 Solomon Islands 1978-2007
France 1955-2007 Somalia 1970-2007
Gabon 1960-2007 South Africa 1955-2007
Gambia 1965-2007 Spain 1955-2007
Ghana 1960-2007 Sri Lanka 1955-2007
Greece 1955-2007 Sudan 1956-2007
Guatemala 1955-2007 Swaziland 1970-2007
Guinea 1958-2007 Syrian Arab Rep 1961-2007
Guinea-Bissau 1974-2007 Tanzania 1961-2007
Guyana 1966-2007 Thailand 1955-2007
Haiti 1955-2007 Togo 1960-2007
Honduras 1955-2007 Trinidad & Tobago 1962-2007
Hungary 1957-2007 Tunisia 1961-2007
India 1955-2007 Turkey 1955-2007
Indonesia 1955-2007 Uganda 1962-2007
Iraq 1970-2002 Uruguay 1955-2007
Iran, Islamic Rep. 1955-2007 Venezuela, RB 1955-2007
Israel 1955-2007 Zambia 1964-2007
Jamaica 1959-2007 Zimbabwe 1970-2007
Jordan 1955-2007

27
Table D: Data description and sources
Variable Description Source
Income per capita
Data measured as log real GDP
per capita (chain weighted
method) from Penn World
Tables 6.3.
http://pwt.econ.upenn.edu/
Democracy
Polity IV index ranging from -10
for perfect autocracies to +10 for
perfect democracies.
http://www.systemicpeace.org/po
lity/polity4.htm
28
References
Acemoglu, D., Johnson, S., Robinson, J.A., Yared, P., 2008. Income and Democracy.
American Economic Review, 98 (3), 808-842.
Anderson, K. 2010. Distortions to Agricultural Incentives: A Global Perspective, 1955-2007.
London, Palgrave Macmillan.
Barro, R., 1996. Democracy and Growth. Journal of Economic Growth, 1 (1), 1-27.
Barro R., 1999. Determinants of Democracy. Journal of Political Economy, 107 (6), 158-182.
Bates R. H. 1981. Markets and States in Tropical Africa. Berkeley and Los Angeles:
Universty of California Press,
Bates, R. H., 2008. When Things Fell Apart. Cambridge University Press: New York.
Bates, R. H., 2009. Political Reform. In Ndulu, B. J., O'Connell, S., Bates, R.H., Collier, P.,
Saludo, C. (Eds), The Political Economy of Economic Growth in Africa, 1960-2000.
Cambridge, Cambridge University Press.
Bates, R. H., Block, S., 2010. Revisiting African Agriculture: Institutional Change and
Productivity Growth. Cambridge MA, Weatherhead Center.
Becker, G., 1983. A Thoery of Competitition among Pressure Groups for Political Influence.
The Quarterly Journal of Economics, 98, 371-400.
Besley, T. and T. Persson, 2011. Pillars of Prosperity: The Political Economics of
Development Clusters. Princeton University Press.
Beynon, Jonathan. 2003. Poverty Efficient Aid Allocations – Collier/Dollar Revisited,
Economic and Statistics Analysis Unit, November 2003 ESAU Working Paper 2, Overseas
Development Institute, London.
Beynon, J. (2002), ‘Policy implications for aid allocations of recent research on aid
effectiveness and selectivity’, in Arvin, B.M. (ed.), New Perspectives on Foreign Aid and
Development, Praeger, Westport,CT.
Binder, M., Offermanns, C.J., 2007. International investment positions and exchange rate
dynamics: a dynamic panel analysis. CFS Working Paper No. 2007/23.
Boix, C., Stokes, S., 2003. Endogenous Democratization. World Politics 55(4): 517-549.
Bratton, M. and N. van de Walle (1997). Democratic Experiments in Africa. Cambridge,
Cambridge University Press.
Burnside, C., and D. Dollar. 2000. Aid, Growth and Policies, American Economic Review
90(4), 847-868.
Dalgaard, C.-J. and Hansen, H. 2001. ‘On aid, growth and good policies’, Journal of
Development Studies. vol. 37, pp. 17–41.

29
Dalgaard, Carl-Johan, Henrik Hansen, and Finn Tarp. 2004. “On the Empirics of Foreign Aid
and Growth,” The Economic Journal 114(496):191–216.
Dornbusch, R. 1976. Expectations and Exchange Rate Dynamics. Journal of Political
Economy 84 (6): 1161–1176.
Dunning, T., 2004. Conditioning the Effects of Aid: Cold War Politics, Donor Credibility,
and Democracy in Africa. International Organization, 58 (2), 409-423.
Epstein, D., Bates, R.H., Goldstone, J., Kristensen, I., O’Halloran, S. 2006. Democratic
Transitions. American Journal of Political Science, 50 (3), 551-569.
Fayad, G., Bates, R. H. and A. Hoeffler. 2011. Income and Democracy: Lipset's Law
Inverted. OxCarre Research Paper 61
http://www.oxcarre.ox.ac.uk/images/stories/papers/ResearchPapers/oxcarrerp201161.pdf
Gibson, C. and J. D. Long 2012. Ethnicity, Performance, and Elections in Africa: An
Experimental Approach. Mimeo.
Gundlach, E., Paldam, M., 2009. The Agricultural and Democratic Transitions. Causality and
the Roundup Model. Kiel Institute for the World Economy Working Paper No. 1521.
Helpman, E., 2008. Institutions and Economic Performance. Princeton NJ, Princeton
University Press.
Hoffman, B. D. and J. D. Long (2012). "Parties, Ethnicity and Voting in African Elections."
Comparative Political Studies Forthcoming.
Huntington, S., 1991. The Third Wave. Norman OK, University of Oklahoma Press.
Lipset, S.M., 1959. Some Social Requisites of Democracy: Economic Development and
Political Legitimacy. The American Political Science Review, 53 (1), 69-105.
Mattes, R. and J. Piombo 1999. Opposition Parties and the Voters in South Africa's General
Election of 1999. Democratization 8(3): 101-128.
Ndulu, B. J., O'Connell, S.A., S., Bates, R.H., Collier, P., Saludo, C. (Eds.), 2008. The
Political Economy of Economic Growth in Africa, 1960-2000. New York, Cambridge
University Press.
North, D. C., 1981. Structure and Change in Economic History. New York, Norton.
North, D. C., 1990. Institutions, Institutional Change, and Economic Performance. New
York, Cambridge University Press.
North, D. C. and R. P. Thomas, 1973. The Rise of the Western World. Cambridge, Cambridge
University Press.
Olson, M., 1971. The Logic of Collective Action. New York, Schoken Books.
Pesaran, M.H., Shin, Y. and R. Smith, 1999. Pooled Mean Group Estimation of Dynamic
Heterogeneous Panels. Journal of the American Statistical Association, 94 (446), 621-634.
30
Posner, D. N. and D. J. Simon 2002. Economic Conditions and Incumbent Support in Africa's
New Democracies. Comparative Political Studies 35(3): 313-336.
Posner, D. and D. Young, 2007. The Institutionalization of Political Power in Africa. Journal
of Democracy 18(3): 126-140.
Powell, J. M. and C. L. Thyne, 2011. Global instances of coups from 1950 to 2010: A new
dataset. Journal of Peace Research 48(2), 249-259.
Przeworski A., Alvarez, M.A., Cheibub, J.A., Limongi, F., 2000. Democracy and
Development: Political Institutions and Well-Being in the World, 1950-1990, Cambridge
University Press: Cambridge UK.
Radelet, S. 2010. Emerging Africa: How 17 Countries Are Leading the Way. Washington
DC, Center for Global Development.
Rajan, R. G. and A. Subramanian. 2008. Aid and Growth: What Does the Cross-Country
Evidence Really Show? Review of Economics and Statistics 90(4), pp.643–665.
Roodman, David. 2007. Macro Aid Effectiveness Research: A Guide for the Perplexed,
Center for Global Development. Working Paper Number 134, December 2007.
Wooldridge. J.M. 2009. Introductory Econometrics: A Modern Approach. 4th
ed. Thomson,
Ohio.
World Bank. 1991. Governance and Development. Washington DC, The World Bank.