The State of App Downloads and Monetization Report : Global Q2 2015
15
The State of App Downloads and Monetization InMobi Insights Page Q2 2015 | July 2015
Transcript of The State of App Downloads and Monetization Report : Global Q2 2015

The State of App Downloads and Monetization
InMobi Insights Page
Q2 2015 | July 2015

Table of Contents
Insights
Key Metrics by Region and OS
App Installs - Deep Dive
App Monetization - Deep Dive
1
2
3
4

Cost per Install (CPI) Index
The cost incurred by an advertiser to get an app installed by a user on his or her device. All cost data in this presentation is indexed to the Global CPI on the InMobi Network.
Country CPI Index = --------------------- X 100Country CPI Global CPI
If an imaginary country Krypton’s CPI = $0.53, and Global CPI = $2.1, then
Krypton CPI Index = ------------- X 100 = 25$0.53$2.1
3

CPI and eCPMs by Region
OS Share of Ad Impressions by Region
OS Share of Ad Installs by Region
CPI and eCPMs by OS
Y-on-Y Growth in Ad Impressions
Y-on-Y Growth in App Installs
Key Metrics by Region and OS2
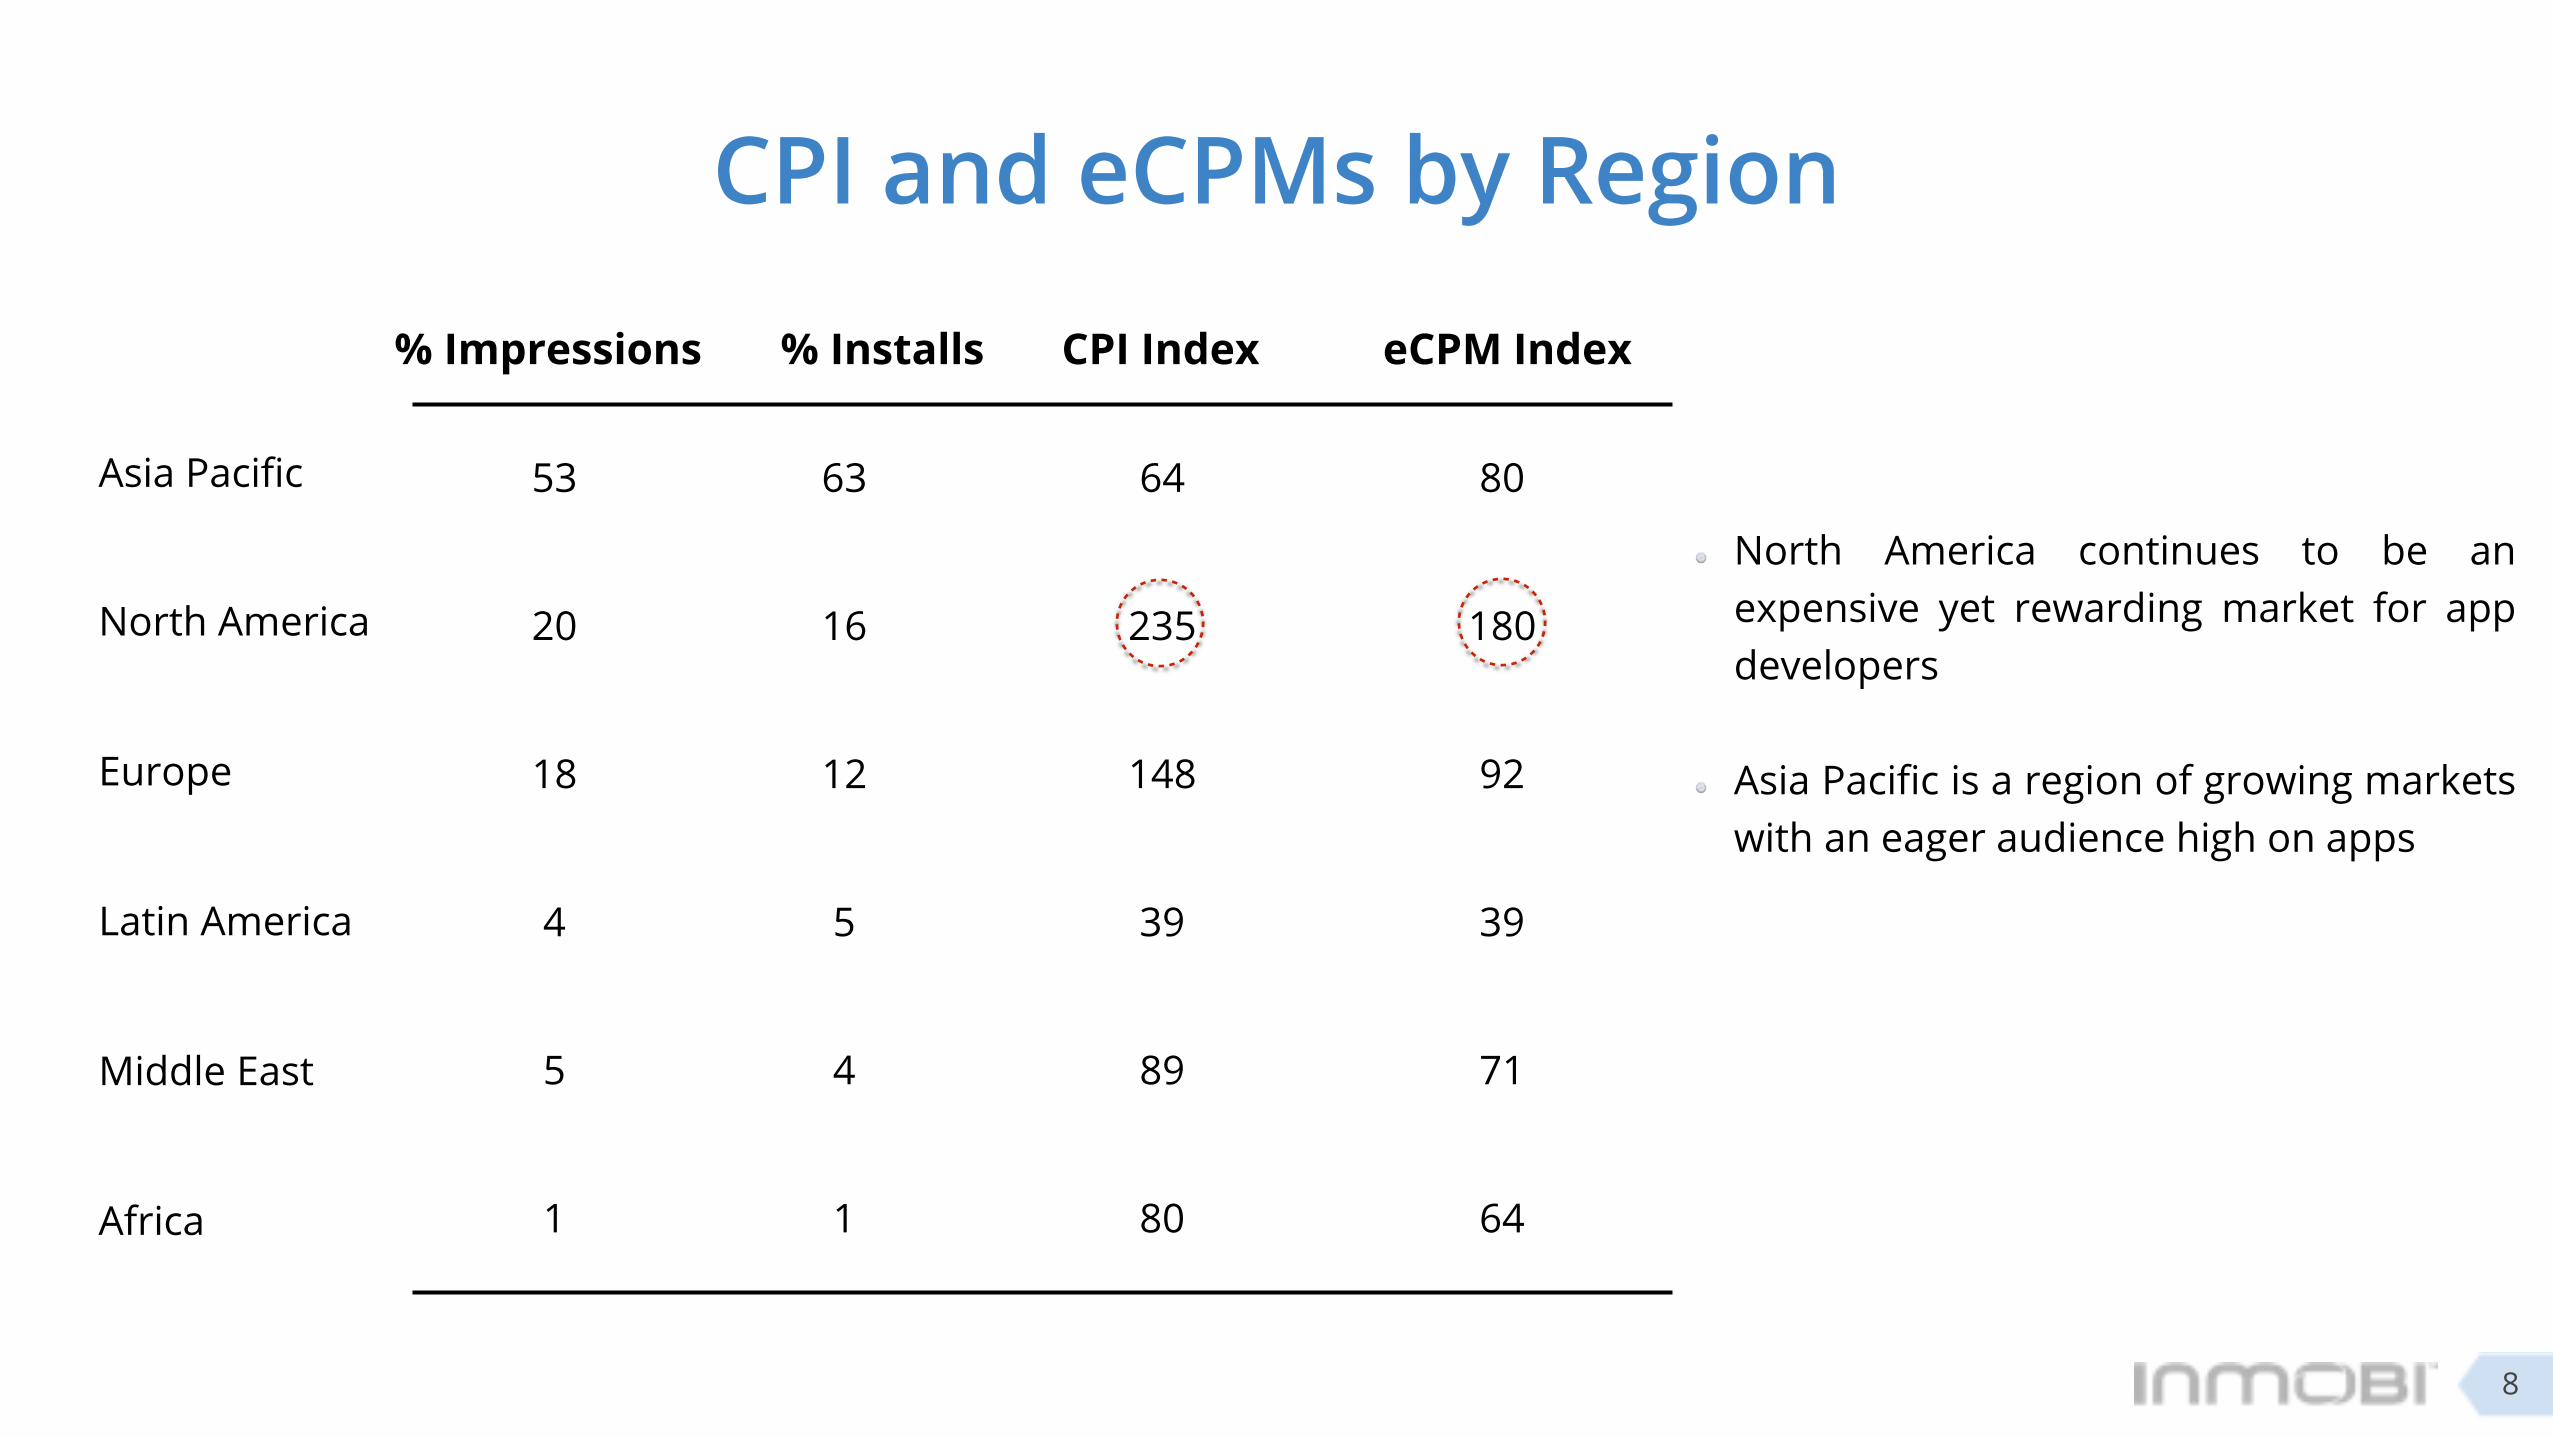
53 63 64 80
20 16 235 180
18 12 148 92
4 5 39 39
5 4 89 71
1 1 80 64
Asia Pacific
North America
Europe
Latin America
Middle East
Africa
% Impressions eCPM Index% Installs CPI Index
North America continues to be anexpensive yet rewarding market for appdevelopers
Asia Pacific is a region of growing marketswith an eager audience high on apps
CPI and eCPMs by Region
8

13% Y-on-Y Growth in Ad Impressions
Q1 2014 Q2 2014 Q3 2014 Q4 2014 Q1 2015 Q2 2015
Asia Pacific North America Europe Latin America Middle East Africa
Gro
wth
in A
d Im
pres
sion
s Latin America has the highest increase in mobile traffic since Q2 2014 driven by increase smartphone penetration
12%
21%
21%
-1% 47%
25%
-9%25%
16%
41% -16% 42%2% 13% 19%21% -60% -35%
12
-17%
-14%
-18%
-60% -19% -20%
0%
-18%-9%
52% 29% -11%
X% = % change over previous Quarter

Fastest Growing Markets
CPI in Key Markets
Per Capita Installs by Markets
Cost per Install by OS
iOS Premium Over Android
App Install by Category
CPI and App Install Growth by Category
App Installs - Deep Dive3
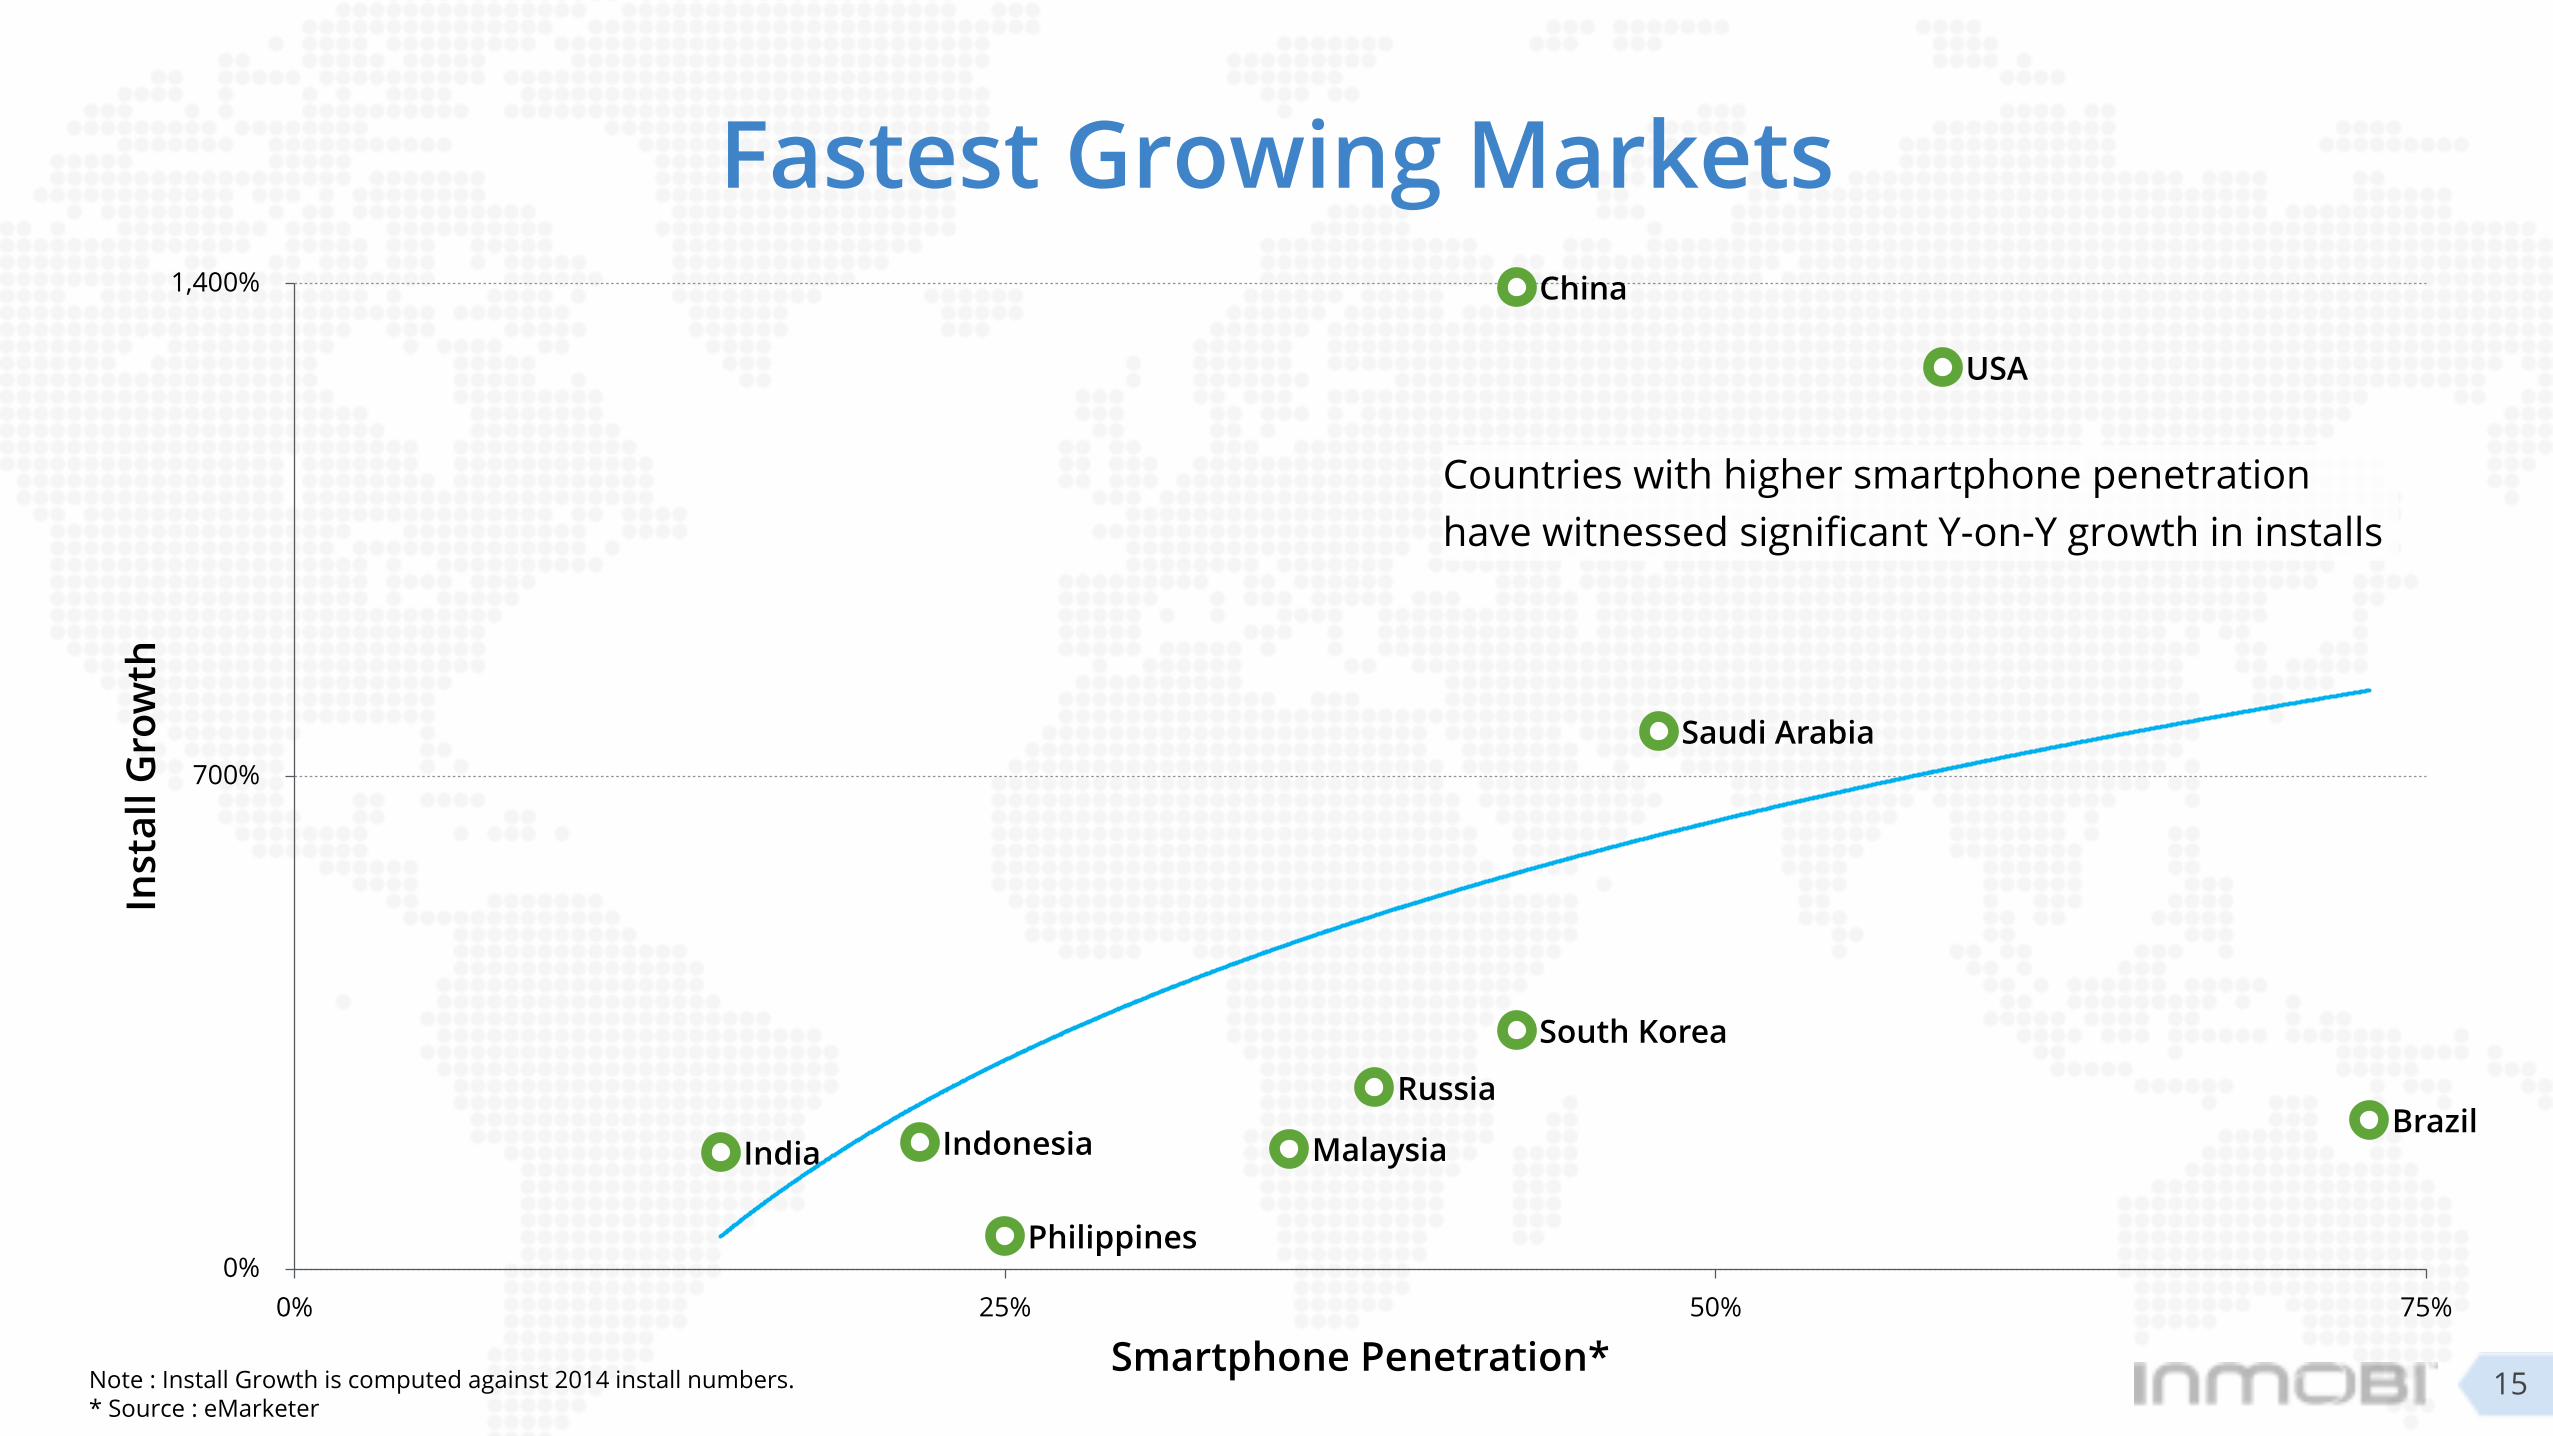
Fastest Growing Markets
Indonesia
USA
China
Philippines
India Malaysia
RussiaBrazil
South Korea
Saudi Arabia
0%
700%
1,400%
0% 25% 50% 75%
Inst
all G
row
th
Smartphone Penetration*Note : Install Growth is computed against 2014 install numbers. * Source : eMarketer
15
Countries with higher smartphone penetration have witnessed significant Y-on-Y growth in installs

App Install by Category
65%
15%
6%
5%
0% 8%
GamesmCommerceCommunicationTravelEntertainmentOthers72%
8%
6%
5%4% 4%
Q2 2014
Q2 2015
20
• App installs grew 104% between Q2‘14 and Q2’15. Games continue to lead the app install craze.
• Entertainment surely made its presence felt in 2015

Ad Impressions by Device Type
Tablets Outperform Smartphones
In-App Ads eCPM = 3x of Mobile Web
Top 5 Publisher Categories by eCPM
Top 3 Ad categories that work for Publishers
eCPM and Smartphone Penetration
eCPM and CPI
4 App Monetization - Deep Dive
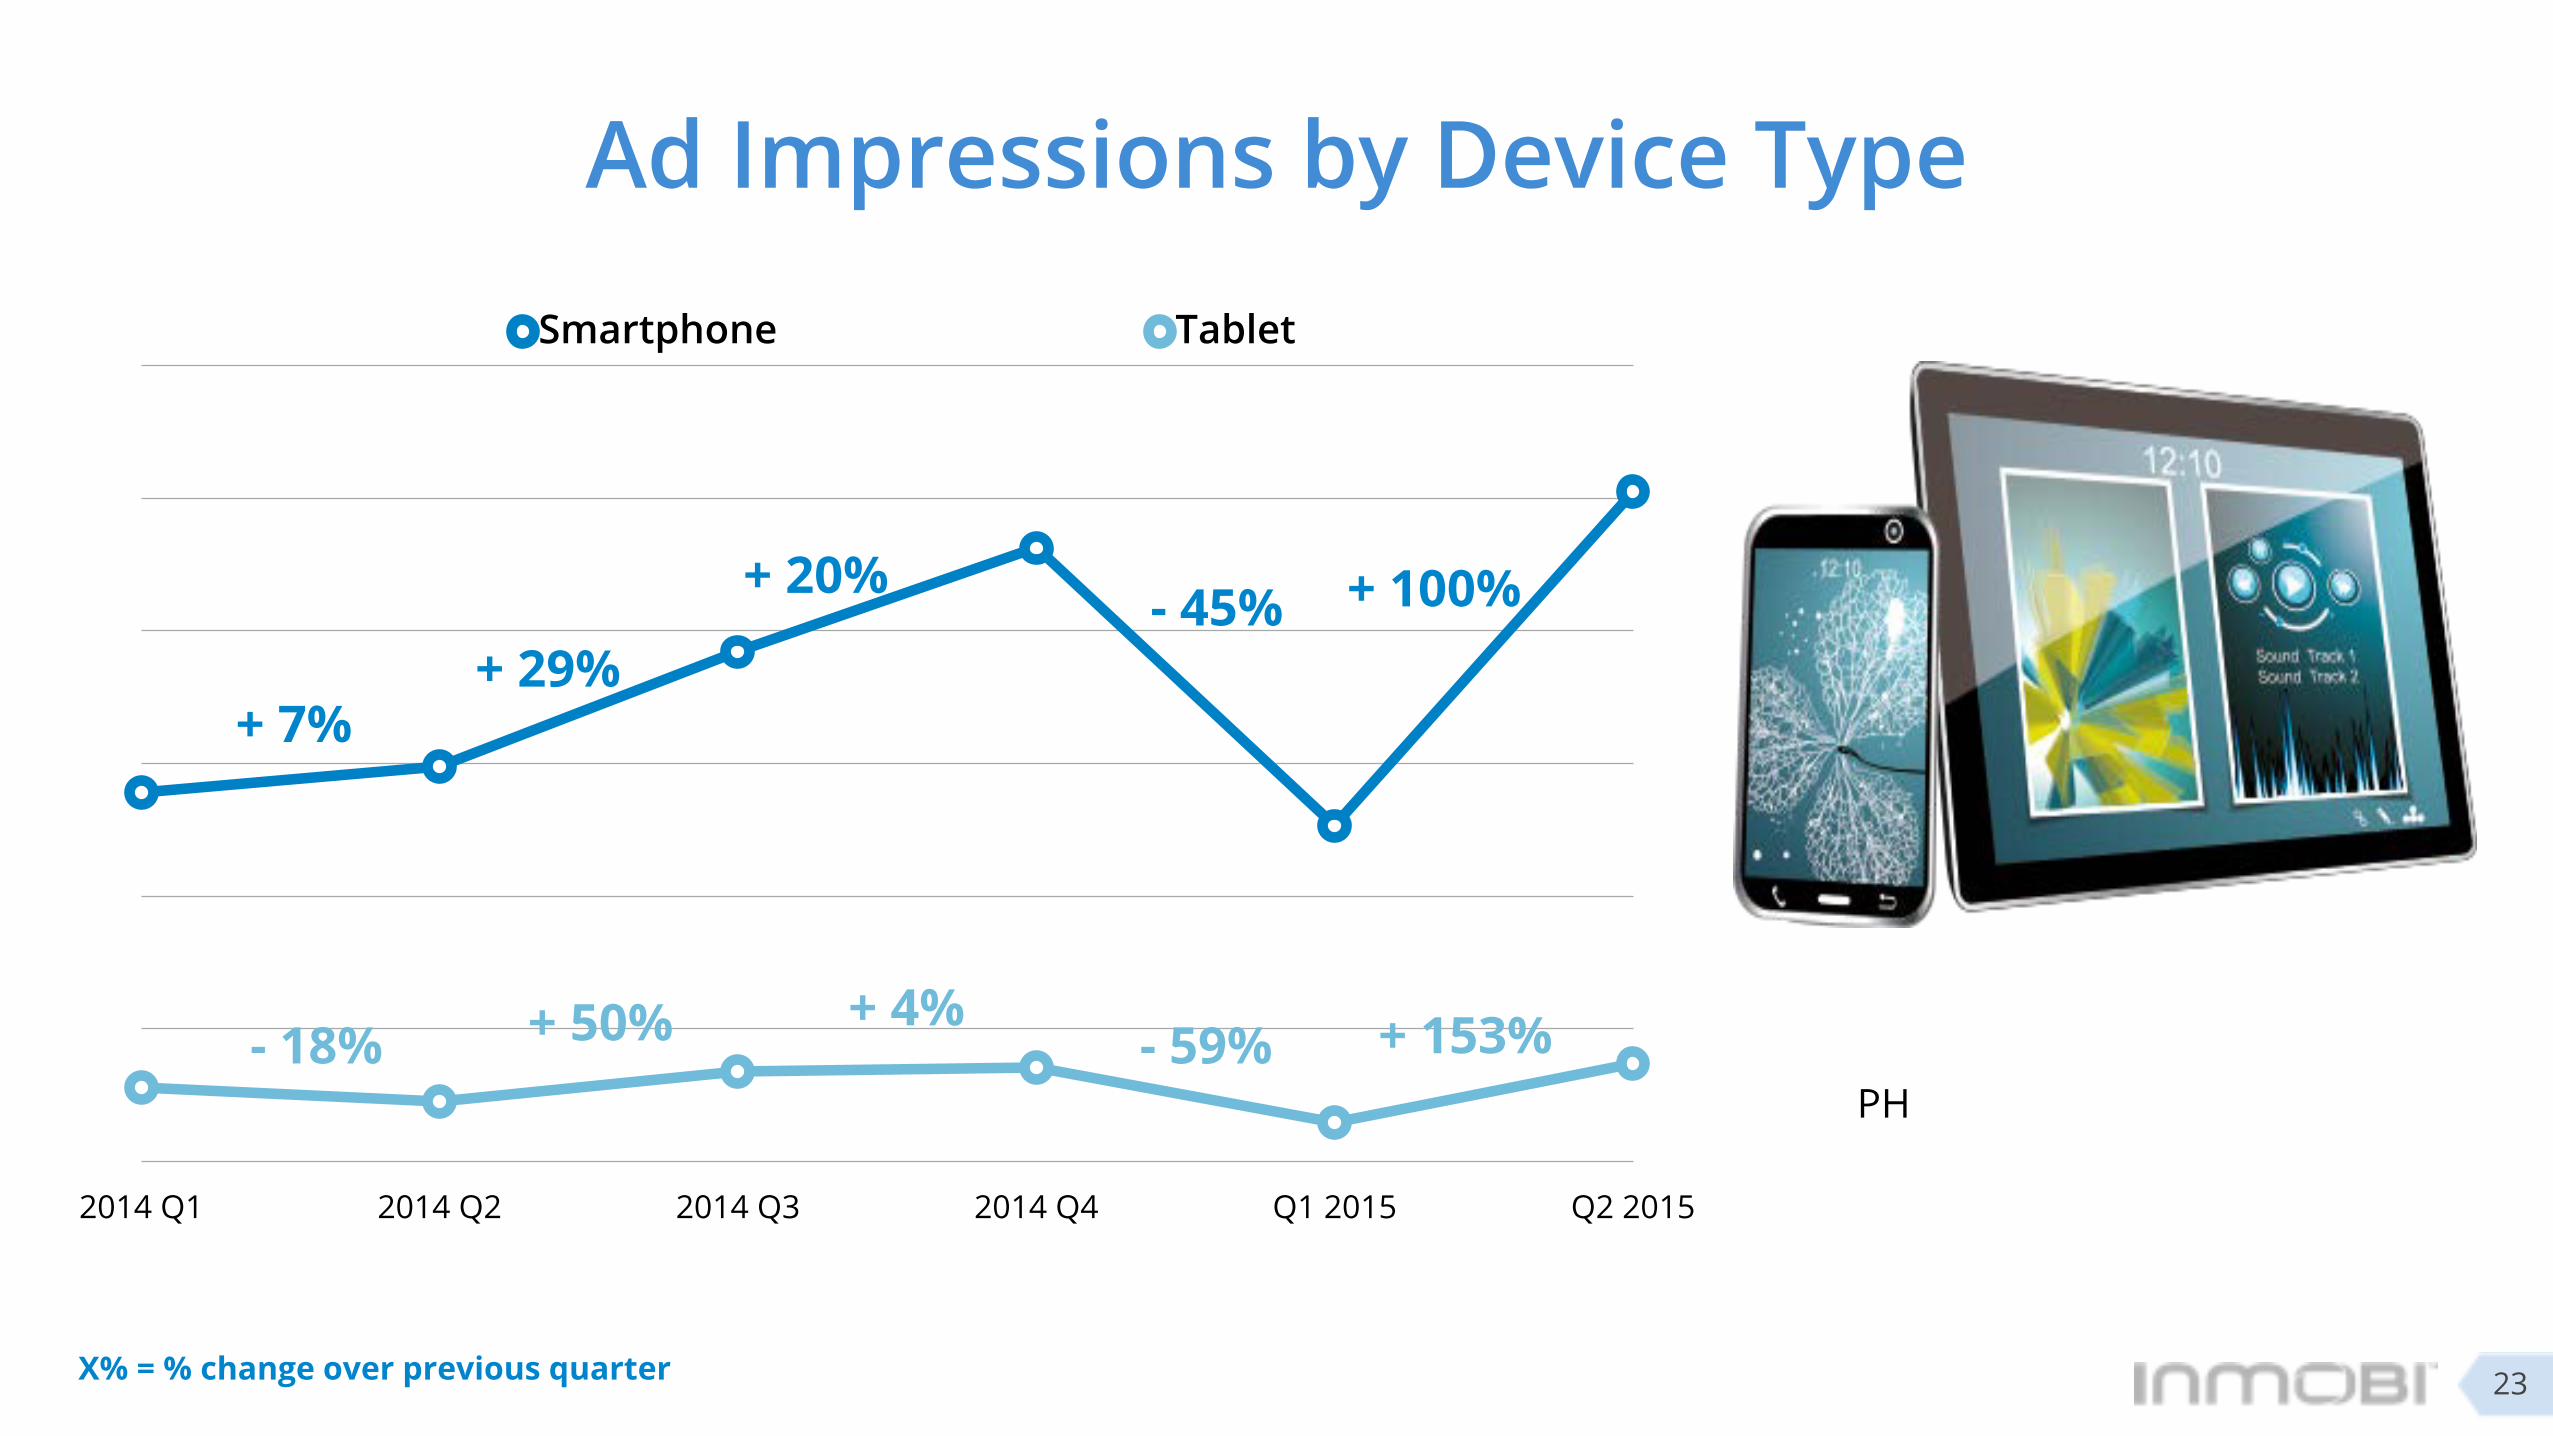
2014 Q1 2014 Q2 2014 Q3 2014 Q4 Q1 2015 Q2 2015
Smartphone Tablet
Ad Impressions by Device Type
+ 29%
+ 20%
- 18% + 50% + 4%
PH
23
- 45% + 100%
- 59% + 153%
X% = % change over previous quarter
+ 7%

67 69
116 105
CTR Index eCPM Index
Smartphone
Tablet
84 127
117 130
CTR Index eCPM Index
Smartphone
Tablet
Tablets earned higher eCPMS though the gap between smartphones and tablets was the least in the case of iOS.
Tablets Outperform Smartphones
24
72 87
116 118
CTR Index eCPM Index
Smartphone
Tablet
All OS

Top 5 Publisher Categories by eCPM
Education trumped Games to earn app developers the highest eCPMs
225 166 131 75 68
Education Games Entertainment Lifestyle Tools
26
Want More?
27
Download the complete report NOW!Download the infographics NOW!

THANK YOU
REACH US AT: [email protected]/insights
FOLLOW US ON:
twitter @inmobi
facebook.com/inmobi
linkedin.com/company/inmobi