The State of Agricultural Commodity Markets
55
2004 The State of Agricultural Commodity Markets
Transcript of The State of Agricultural Commodity Markets

2004
The State of Agricultural Commodity Markets

Copies of FAO publications can be requested from:
SALES AND MARKETING GROUP
Information DivisionFood and Agriculture Organization of the United NationsViale delle Terme di Caracalla00100 Rome, Italy
E-mail: [email protected]: (+39) 06 57053360Web site: http://www.fao.org

2004
The State of Agricultural Commodity Markets

Produced by theEditorial Production and Design GroupPublishing Management ServiceFAO
The designations employed and the presentation ofmaterial in this information product do not imply the expression of any opinion whatsoever on the partof the Food and Agriculture Organization of the United Nations concerning the legal or developmentstatus of any country, territory, city or area or of itsauthorities, or concerning the delimitation of itsfrontiers or boundaries.
ISBN 92-5-105133-X
All rights reserved. Reproduction and disseminationof material in this information product for educationalor other non-commercial purposes are authorizedwithout any prior written permission from thecopyright holders provided the source is fullyacknowledged. Reproduction of material in thisinformation product for resale or other commercialpurposes is prohibited without written permission ofthe copyright holders. Applications for such permission should beaddressed to: ChiefPublishing Management ServiceInformation Division FAO Viale delle Terme di Caracalla, 00100 Rome, Italy
or by e-mail to: [email protected]
© FAO 2004
Photographs:FAO/18350/P. Cenini, FAO/18191/H. Wagner,FAO/19174/M.Marzot, FAO/17720/A. Conti,FAO/20831/R. Messori

4 About this report
6 Foreword
8 Recent developments and long-term trends
8 Current conditions and recent developments on agricultural commodity markets10 Long-term trends reveal structural changes 12 Changing terms of trade for agricultural commodities
14 Food import bills
14 Changing consumption patterns and international trade16 Food import bills strain economies18 Sources of variation in food import bills of least developed countries
20 Agricultural export earnings
20 The risks of dependency on commodity exports22 Barriers to trade in developed countries – tariffs, tariff escalation and producer
support
26 Changing patterns of agricultural trade
26 The evolution of trade in primary and processed agricultural products 28 Commodity trade and regional integration among developing countries30 Market concentration and vertically integrated food chains
32 Conclusions, challenges and policy responses
36 References
38 Annex
38 Table 1. Commodity prices in real terms 39 Table 2. Production of selected commodities by ten largest producers42 Table 3. Exports of selected commodities by ten largest exporters45 Table 4. Imports of selected commodities by ten largest importers48 Table 5. Terms of trade in agriculture and versus manufactures49 Table 6. Shares of individual commodity groups in total agricultural exports and
imports in each country group50 Table 7. Growth rates in export and import unit values, by country group51 Table 8. Variability in nominal export and import unit values
52 FAO Commodities and Trade Division publications, 2003–04
The State of Agricultural Commodity Markets 2004 3
Contents

The State of Agricultural CommodityMarkets 2004 is the first issue of anew biennial publication that is
intended to expand FAO’s existing series of“State of …” reports. While the findings andconclusions presented rely on technicalanalysis by FAO commodity and tradespecialists, this is not a technical report.Rather, it aims to present commoditymarket issues in an objective, transparentand accessible way to the attention of awider public, including policy-makers,commodity market observers and all thoseinterested in commodity marketdevelopments and their impact ondeveloping countries.
A particular goal is to raise awareness ofthe impact that developments oncommodity markets have on thelivelihoods and food security of hundreds ofmillions of people in the developing world,as well as on the economies of dozens ofdeveloping countries that depend oncommodity exports for a substantialportion of their export earnings.
The report is divided into four mainsections, supplemented by tables thatprovide basic data on current conditionsand historical trends for commodity pricesand terms of trade.
The first section, Recent developmentsand long-term trends, considers trends andvolatility in agricultural commodity pricesand discusses current conditions andrecent developments against thisbackground.
The second section focuses on Foodimport bills. It looks at the changing patternof food imports as developing countrieshave shifted from being net exporters to netimporters of food and other agriculturalproducts. The section also examines theimpact of international food pricemovements on the food import bills ofdeveloping countries in general and theleast developed countries in particular.
The third section, Agricultural exportearnings, looks at the continuingimportance of agricultural exports for theeconomies of many developing countries.
This section examines the implications ofdeclining commodity prices and pricevolatility for commodity-dependentcountries and investigates how tariffs andsubsidies have impeded growth inagricultural exports from developingcountries.
The fourth and final section exploresChanging patterns of agricultural trade,with particular attention to theirimplications for commodity-dependentfarmers and countries in the developingworld. Issues addressed in this sectioninclude the shift in trade from primary toprocessed agricultural products, thegrowing importance and potential forcommodity trade and regional tradeagreements among developing countries,and the impact of increasing marketconcentration as agricultural commoditychains are increasingly dominated by a fewtransnational trading, processing anddistribution companies.
About this report
The State of Agricultural Commodity Markets 2004 4

The State of Agricultural Commodity Markets 2004 5
Acknowledgements
The State of Agricultural CommodityMarkets 2004 was prepared by a team fromthe Commodities and Trade Division ofFAO, led by Alexander Sarris and DavidHallam, and under the general guidance ofHartwig de Haen, Assistant DirectorGeneral, Economic and Social Departmentof FAO.
Material for Section 1 on Recentdevelopments and long-term trends wasprovided by commodity specialists in theCommodities and Trade Division:Abdolreza Abbassian, Pedro Arias,Boubaker BenBelhassen, Concha Calpe,Kaison Chang, Merritt Cluff, Michael Griffin,Ali Gurkan, David Hallam, Pascal Liu,Shakib Mbabaali, Brian Moir, NancyMorgan, Paul Pilkauskas, Adam Prakash,George Rapsomanikis, Shangnan Shui,and Peter Thoenes. The statistical dataunderlying the analyses and many of thegraphics were compiled by the statisticalclerks in the Division: Gianni Borgianelli,Laura Cattaneo, Claudio Cerquiglini,Daniela Citti, Julie Claro, Dino Forzinetti,John Heine, Massimo Iafrate, DanielaMargheriti, Patrizia Masciana, VincenzoMazzucca, Marco Milo, Mauro Pace andBarbara Senfter.
The annex tables providing supportingdata were assembled by Pedro Arias andJulie Claro.
Material for Section 2 on Food importbills was drafted by Ali Gurkan, MerrittCluff, Adam Prakash, and Piero Conforti.
Section 3 on Agricultural exportearnings was prepared by Pedro Arias,Shakib Mbabaali, George Rapsomanikisand David Hallam.
Material for Section 4 on Changingpatterns of agricultural trade was providedby Nasredin Elamin, Hansdeep Khaira andHarmon Thomas.
All of the above reviewed andcommented on draft material. Furtherhelpful comments on earlier drafts werereceived from a number of other FAOprofessionals in the Economic and SocialDepartment, in particular: Jelle Bruinsma,Deep Ford, Ted Gillin, Haluk Kasnakoglu,Panos Konandreas, Ramesh Sharma,Prakash Shetty, Josef Schmidhuber, JacobSkoet and Randy Stringer.
The report was edited by David Hallamwith assistance from Pedro Arias andAndrew Marx.
Long-term trends and short-termshocks on agricultural commoditymarkets affect us all. They have a
direct impact not only on the prices of thefood we eat and the clothes we wear but onthe economic well-being of households,communities and entire nations thatdepend on commodity exports. Lessdirectly but just as inexorably, they affectthe viability of rural communities andlifestyles, the pace of migration to urbanareas and the prospects for sustainabledevelopment.
The impact is greatest on hundreds ofmillions of people and on many of thepoorest countries in the developing world.An estimated 2.5 billion people in thedeveloping world depend on agriculture fortheir livelihoods. For many of them, the saleof agricultural commodities or employmentin producing and processing commoditiesfor export represent their only sources ofcash income. More than 50 developingcountries, including a majority of the leastdeveloped countries (LDCs), depend onexports of three or fewer agriculturalcommodities, typically tropical products,for between 20 and 90 percent of theirforeign exchange earnings. However, manyLDCs are also net food importers, spendingmore than half their export earnings oncommodity markets purchasing foodimports to make up for shortfalls indomestic production. For these people andcountries, developments on internationalcommodity markets may literally spell thedifference between feast and famine.
Declining prices, distorted markets
The long-term trend in real prices foragricultural commodities has beendownwards but prices have also shownmarked variability around that trend. In the second half of the1990s, prices of a number of commodities exported bydeveloping countries fell to their lowestlevels since the Great Depression of the1930s. The price of coffee plummeted 70
percent between 1997 and 2001,threatening the livelihoods of an estimated25 million people who depend on coffeeand triggering food emergencies in severalcountries in Africa and Central America.On the other hand, the lower prices forbasic foods enabled many poorconsumers, especially in urban areas, tomeet their food needs at lower cost and togain access to more nutritious diets.
Although commodity markets haverebounded in recent months, anddramatically so in the case of cereals, realprices in general continue their long-termdownward trend. Many farmers andexporting countries still find themselvestrapped by their dependency – producingand exporting more but earning less thanthey did in the past. At the same time, food-importing countries have benefited from thedownward trend, but are concerned by thevariability and short-term increases ininternational food prices.
Many reasons can be cited for the long-term decline and short-term volatility of realcommodity prices. Much of the steadydownward trend appears to be structural,reflecting the basic forces of supply anddemand that drive markets: global supplieshave grown more rapidly than demand,fuelled by increased productivity and theemergence of major new producers.
Advances in agricultural productivitythrough improved technology potentiallybenefit both producers and consumers. Theformer stand to gain from lower costs andimproved competitiveness, and the latterfrom lower prices. But it has mainly beenproducers in better-endowed and more-developed regions that have been able totake advantage of productivity gains tostrengthen their position on world markets.The LDCs have seen their share of worldagricultural trade shrink, even as theirdependency on it has remained far higherthan that of other developing countries.
The main beneficiaries of lower foodprices have been consumers in developedcountries and in urban areas of developingcountries. However, for the vast majority of
Foreword
The State of Agricultural Commodity Markets 2004 6

the world’s poor and hungry people wholive in rural areas of developing countriesand depend on agriculture, losses in incomeand employment caused by declines in theprices of the products they market generallyoutweigh the benefits of lower food priceswhen commodity prices fall.
The problem of oversupply has beenexacerbated by government policies in bothdeveloped and developing countries thathave severely distorted agriculturalmarkets.
Tariffs on agricultural imports indeveloped and developing countries haveimpeded growth in agricultural exports fromdeveloping countries. Tariff escalation,where higher tariffs apply to goods exportedat more advanced stages of processing, hasreduced opportunities for developingcountries to export higher-value processedgoods whose prices have beenconsiderably more stable than those forbasic commodities.
In addition to tariffs, farmers indeveloping countries must contend withcompetition from highly subsidized andhighly mechanized producers in theindustrialized countries. Producer support tofarmers in developed countries currentlyadds up to more than US$230 billion peryear, almost 30 times the amount providedas aid for agricultural development todeveloping countries.
Tariffs and other barriers have alsoslowed the growth of trade amongdeveloping countries. South–south tradecould expand rapidly, particularly whereincome growth is high and consumptionlevels remain low. But tariff barriers amongdeveloping countries can be higher thanthose imposed on imports by developedcountries.
Another development in agriculturalcommodity markets has been theincreasing concentration of market powerin the hands of a few transnationalcorporations. Just three companies nowcontrol almost half the coffee roasting in theworld, for example, and the 30 largestsupermarket chains control almost one-third of grocery sales worldwide.
Such transnational enterprises havehelped some smallholders integrate into theglobal market and have helped in thetransfer of modern production anddistribution technology. However, it is amatter of concern that marketconcentration has left others with littlemarket power: FAO’s Panel of Eminent
Experts on Ethics in Food and Agriculturewarned four years ago that “there areserious power imbalances arising from theconcentration of economic power in thehands of a few”.
Making commodity markets work for all
Agricultural commodity prices have shownsigns of recovery in recent months.However, that recovery does not appear tobe secure and the long-term prospects forcommodity-dependent farmers andcountries in the developing world are notbright. On the other hand, further short-term commodity price rises for basic foodsare likely, and may threaten livelihoods inmany low-income food-deficit countries.
Agricultural commodity prices remainhighly volatile, and the tendency for growthin the supply of agricultural commodities tooutpace growth in demand at given pricespersists. High tariffs and subsidies indeveloped countries still hamper marketaccess and depress prices. While tradeamong developing countries is growingfaster than trade between developing anddeveloped countries, opportunities forincreased trade among developingcountries are still undermined by tradebarriers. For some commodities, trade,processing and retailing have becomedominated by a small number oftransnational corporations, and the marketpower of farmers and exporting countrieshas become relatively limited. Concern hasbeen expressed at the apparently smallshare of developing country producers inthe final value of their production.
The commodity market crisis of the1990s has focused attention on all of theseproblem areas and has highlighted the needfor new approaches to resolving many ofthem.
Take the example of price volatility. Pastefforts to deal with the problem emphasizedmeasures to stabilize prices or revenuesdirectly, by managing buffer stocks orproviding compensation to countries thatsuffered from unforeseen shortfalls inexport earnings. For the most part and for avariety of reasons, these measures failed.New approaches aim less at preventingprice swings than at helping farmers andconsumers protect themselves against theirimpact through schemes such as market-based price insurance or forward-pricingsystems.
Efforts to address the long-term problemof excess production of traditional exportcrops must focus both on increasingdemand and controlling supplies of somecommodities and on reducing thevulnerability of farmers and countries thatdepend on these commodities.Diversification strategies that would allowfarmers to shift to growing higher-valuecrops or to producing and trading value-added processed goods can contribute toreducing both supplies and dependency.
Action must also be taken to improveour understanding of the impact thatincreasing concentration in commoditychains has had on competition, prices andthe share of final retail value that goes tofarmers and exporters of agriculturalproducts. Careful monitoring and furtheranalysis are urgently needed, along withsupport for efforts by exporters to increasetheir collective market power. Analysismust also be devoted to understanding howdeclining world prices of basic foodcommodities, as well as the changingmarket structures, affect the food security of the poor in both rural and urban areas.
With the launch of The State ofAgricultural Commodity Markets, FAOhopes to contribute to informed discussionand decisive action in all of these areas. This report will provide a biennial review ofimportant trends in commodity marketsand will highlight major policy issues andoptions for action.
Given the significant role that agriculturalcommodities play in all of our lives and theirvital importance for millions of the world’shardest working and most vulnerablepeople, increased attention and concertedaction are long overdue.
Jacques DioufFAO Director-General
The State of Agricultural Commodity Markets 2004 7

After a steep and prolonged declinein the prices of many agriculturalcommodities to historic lows from
the late 1990s through 2001, prices onworld markets have rebounded, or at leastlevelled off, over the past two years.
The recent recovery reflects reducedsupplies of some commodities andstronger demand for others, as marketshave responded to chronic oversupply andfalling prices caused by changes intechnology, consumer preferences, andmarket structures, policies and institutions.A variety of short-term factors have alsocontributed to the recovery, including theweaker exchange rate for the United Statesdollar, which is used to denominate manycommodity prices.
Fragile recovery for tropical beverages and sugar
Between 1997 and 2001, coffee prices fellby almost 70 percent, plummeting belowthe cost of production in many countries.This steep decline left coffee prices lowerthan they had been 30 years earlier, even in nominal terms, and precipitated foodemergencies in several countries in Africaand Central America that depend heavilyon coffee exports. Coffee prices havestrengthened gradually over the past twoyears as producers, especially in LatinAmerica, have responded to falling pricesby reducing supplies.
Cocoa prices followed a similar trend but rallied earlier, starting in 2000. Therecovery in cocoa prices began to falter bylate 2003, however, as supplies started torise again. The market has been weakenedfurther by competition from “cocoa butterequivalent”, as the European Union (EU)relaxed its regulations on the use of fatsderived from other sources to replace someof the cocoa butter in chocolates.
Tea prices have also been under pressure,as production ran ahead of demandgrowth, reaching record levels in 2003.
Record production and surplus stockshave also continued to pressure world
sugar prices in the second half of the2003/04 crop year.
Horticultural product prices remain sensitive to market balance
Increased supplies from Latin America andsluggish demand depressed banana pricesin 2003. Frozen concentrated orange juiceprices were similarly influenced, althoughfresh fruit prices were shored up byreduced production. While demand growthhas been significant for tropical fruits, pricelevels remain sensitive to market balance.
Fibres and raw materials rebound
Shifts in the price trends for mostagricultural raw materials have been lessdramatic and there has been morevariation among individual commodities.Nevertheless, a broadly similar pattern ofrecovery has emerged in most cases.
Cotton, rubber, jute, sisal and abacaprices have all benefited recently fromstronger demand and slower supplygrowth. Prices for hides and skins, on theother hand, declined through 2003 inresponse to weak demand and increasedsupply.
Cereals and oilcrops register gains
International prices for most cereals surgedduring the second half of 2003, reflectingtight market conditions. In the case of rice,the tightness was exacerbated by theimposition of restrictions on exports inIndia and Myanmar. For wheat, reductionsin exportable supplies in the EU and theCommonwealth of Independent Statesfuelled the price rise. Coarse grain pricescontinued to receive underlying supportfrom sharply reduced exports by China,near-record low stocks in the United Statesand continuing increases in soybeanprices.
The picture for oilseeds is ratherdifferent. In the past few years, prices haveimproved steadily from the low levels
Current conditions and recent developments on agricultural commodity markets
Rec
ent d
evel
opm
ents
and
long
-ter
m tr
ends
The State of Agricultural Commodity Markets 2004 8

recorded in 1999–2000 and producershave responded with a robust increase inproduction. The increase in prices wastriggered mainly by a sustained growth indemand that outstripped the expansion insupplies.
With demand firm and stocks atrelatively low levels, both global output and
prices for oilcrop products are expected tocontinue to rise in the short term.
Dairy prices strong but animal diseasesdisrupt the market for meat
Market balance is also currently favourableto dairy product prices. International prices
have been bolstered in recent months bylimited export supplies and sustainedimport demand. Higher prices areexpected to be maintained during 2004.
The international market for meats, onthe other hand, continues to be disruptedby animal disease outbreaks. During thefirst half of 2004, approximately one-thirdof global meat exports were affected byoutbreaks of avian flu or by identified casesof bovine spongiform encephalopathy(BSE). Import bans on poultry and beeffrom disease-affected countries are leadingto higher prices for products originatingfrom disease-free zones. Constrainedexport supplies of meat are also pushingup prices for other animal protein products.
Long-term decline continues
In general, it appears that the balancebetween supply and demand of agriculturalcommodities has improved, and with it theprospects for commodity prices after thesharp and persistent decline during the late1990s. In spite of the recent strengthening,however, agricultural commodity pricesgenerally remain close to historicallydepressed levels – and their longer-termdecline relative to the prices ofmanufactured goods continues.
This secular downward trend is analysedfurther in the following sections of thisreport. For the latest informationconcerning commodity prices and trade,readers are referred to the Commoditiesand Trade Division pages on the FAO Website at http://www.fao.org/es/ESC/en/index.html.
The State of Agricultural Commodity Markets 2004 9
Recent trends in world prices of selected commodities, 1991–2003
Tropical beverages
US$/tonne3 500
3 000
2 500
2 000
1 500
1 000
500
Meat and meat products
4 0003 5003 0002 5002 0001 5001 000
500
Oilseeds, oils/fats and cakes/meals
Index (1990–92 = 100)200
175
150
125
100
75
50
Fibres
US$/tonne2 500
2 000
1 500
1 000
500
0
Sugar
US$/tonne
1991 1993 1995 1997 1999 2001 2003 1991 1993 1995 1997 1999 2001 2003
1991 1993 1995 1997 1999 2001 2003 1991 1993 1995 1997 1999 2001 2003
1991 1993 1995 1997 1999 2001 2003 1991 1993 1995 1997 1999 2001 2003
Cereals
40035030025020015010050
300
250
200
150
100
CoffeeTeaCocoa
US$/tonne US$/tonneMaizeWheatRice
LambPork
BeefChicken
SeedsOils/FatsCakes/Meals
Dairy
US$/tonne2 500
2 000
1 500
1 000
Fruits
US$/tonne2 500
2 000
1 500
1 000
5001991 1993 1995 1997 1999 2001 2003 1991 1993 1995 1997 1999 2001 2003
ButterSkim milkproducts
BananasCitrus
Source: FAO
CottonAbacaSisalJute
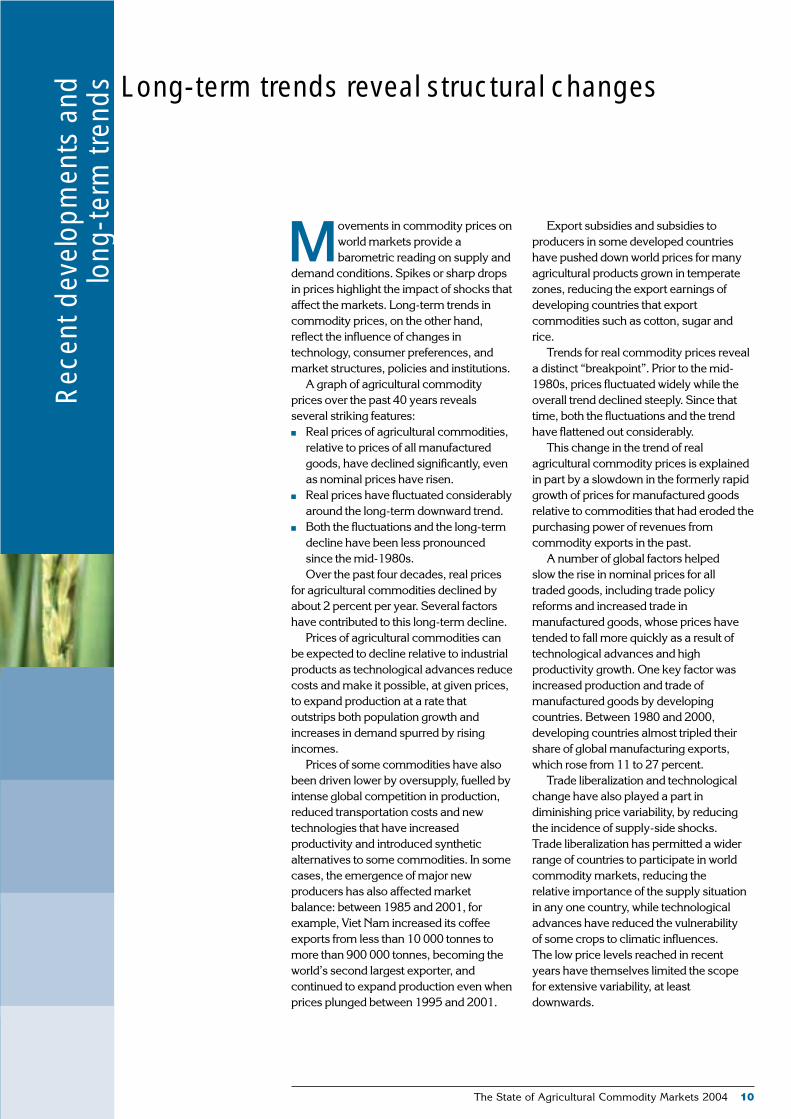
Movements in commodity prices onworld markets provide abarometric reading on supply and
demand conditions. Spikes or sharp dropsin prices highlight the impact of shocks thataffect the markets. Long-term trends incommodity prices, on the other hand,reflect the influence of changes intechnology, consumer preferences, andmarket structures, policies and institutions.
A graph of agricultural commodityprices over the past 40 years revealsseveral striking features:■ Real prices of agricultural commodities,
relative to prices of all manufacturedgoods, have declined significantly, evenas nominal prices have risen.
■ Real prices have fluctuated considerablyaround the long-term downward trend.
■ Both the fluctuations and the long-termdecline have been less pronouncedsince the mid-1980s.Over the past four decades, real prices
for agricultural commodities declined byabout 2 percent per year. Several factorshave contributed to this long-term decline.
Prices of agricultural commodities canbe expected to decline relative to industrialproducts as technological advances reducecosts and make it possible, at given prices,to expand production at a rate thatoutstrips both population growth andincreases in demand spurred by risingincomes.
Prices of some commodities have alsobeen driven lower by oversupply, fuelled byintense global competition in production,reduced transportation costs and newtechnologies that have increasedproductivity and introduced syntheticalternatives to some commodities. In somecases, the emergence of major newproducers has also affected marketbalance: between 1985 and 2001, forexample, Viet Nam increased its coffeeexports from less than 10 000 tonnes tomore than 900 000 tonnes, becoming theworld’s second largest exporter, andcontinued to expand production even whenprices plunged between 1995 and 2001.
Export subsidies and subsidies toproducers in some developed countrieshave pushed down world prices for manyagricultural products grown in temperatezones, reducing the export earnings ofdeveloping countries that exportcommodities such as cotton, sugar andrice.
Trends for real commodity prices reveala distinct “breakpoint”. Prior to the mid-1980s, prices fluctuated widely while theoverall trend declined steeply. Since thattime, both the fluctuations and the trendhave flattened out considerably.
This change in the trend of realagricultural commodity prices is explainedin part by a slowdown in the formerly rapidgrowth of prices for manufactured goodsrelative to commodities that had eroded thepurchasing power of revenues fromcommodity exports in the past.
A number of global factors helped slow the rise in nominal prices for all traded goods, including trade policyreforms and increased trade inmanufactured goods, whose prices havetended to fall more quickly as a result oftechnological advances and highproductivity growth. One key factor wasincreased production and trade ofmanufactured goods by developingcountries. Between 1980 and 2000,developing countries almost tripled theirshare of global manufacturing exports,which rose from 11 to 27 percent.
Trade liberalization and technologicalchange have also played a part indiminishing price variability, by reducingthe incidence of supply-side shocks. Trade liberalization has permitted a widerrange of countries to participate in worldcommodity markets, reducing the relative importance of the supply situationin any one country, while technologicaladvances have reduced the vulnerability of some crops to climatic influences.The low price levels reached in recent years have themselves limited the scopefor extensive variability, at leastdownwards.
Long-term trends reveal structural changesR
ecen
t dev
elop
men
ts a
ndlo
ng-t
erm
tren
ds
The State of Agricultural Commodity Markets 2004 10

Impacts differ for both commodities and countries
Although real prices for all agriculturalcommodities have declined over the past40 years, the rate of decline has variedfrom one commodity to another. Rawmaterials, tropical beverages, oilcrops, and cereals have experienced the steepestdeclines. The fall in real prices has beenleast severe for horticultural products, meat and dairy. Some developingcountries have managed to take advantageof these trends by shifting production andtrade into these higher-value sectors. Bydoing so, they have reduced theirdependence on products whose prices
have fallen more sharply and remainedhighly erratic.
For the most part, it has been the moreadvanced and prosperous developingcountries that have managed to do this.Developing countries other than LDCshave more than doubled the share ofhorticultural, meat and dairy products intheir agricultural exports. At the same time,they reduced their reliance on tropicalbeverages and raw materials, bringing theshare of these products in their totalagricultural exports down from more than55 percent in the early 1960s to around 30percent in 1999–2001. But in the LDCs,dependence on these products for theiragricultural export earnings actually
increased from 59 percent to 72 percentduring the same period.
Many LDCs rely heavily on a fewcommodities whose prices not only havefallen sharply but have been highly erratic,further complicating economic planning anddevelopment. Over the past 40 years, priceshave been most volatile for tropicalbeverages and raw materials – the samecommodity groups that have experiencedsome of the steepest long-term declines.Overall, variability from trend levels has beenhighest for agricultural commodities tradedby LDCs and other developing countries andhas been lowest for agricultural productstraded by developed countries, both forexports and for imports.
The State of Agricultural Commodity Markets 2004 11
Agricultural commodity prices, 1961–2002
200
150
100
50
01961 1966 1971 1976 1981 1986 1991 1996 2002
* Real prices deflated by export unit values of all merchandise exports** MUV = Manufactures export unit value
Real prices* for agricultural commodities have declined by almost 50percent over the past 40 years, even though nominal prices have risen.Both trends have slowed significantly since the 1980s.
Index (1991–92 = 100)
Nominal prices
Real prices*
Real price trend
MUV**
Real prices* for agricultural commodity groups, 1961–2002
Source: FAO
1961 1966 1971 1976 1981 1986 1991 1996 2002* Agricultural commodity prices on world markets deflated by
export unit values of all merchandise exports
Index (1991–92 = 100)
SugarHorticultureTropical beveragesRaw materials
CerealsOilcropsMeatDairy
350
300
250
200
150
100
50
0
Changing composition of commodity groups in total agricultural exports, by country grouping
Variability of commodity trade unitvalues, 1961–2001
Price volatility has been greatest for agriculturalcommodities traded by developing countries.
30
25
20
15
10
5
0
Varia
tion
arou
nd tr
endl
ine
(per
cent
)
Exports ImportsSource: FAO
Least developed countries
Other developing countries
Developed countries
More advanced developing countries have been able to reduce theirreliance on tropical beverages, raw materials and sugar, the prices of which have suffered steep declines on world markets. But least developed countries have become more dependent on thesecommodities.
Source: FAO
Percentage of total agricultural exports
50
40
30
20
10
0
1961–63
1999–2001
LDCs ODCsMeat
LDCs ODCsHorticulture
LDCs ODCsSugar
LDCs ODCsTropical
beverages
LDCs ODCsRaw
materials
Source: FAOLDCs = least developed countries; ODCs = other developing countries

For developing countries that dependheavily on commodity exports forforeign exchange, the cash price is
analytically less revealing than is thepurchasing power it provides. Thatpurchasing power is reflected by the“barter” terms of trade – the ratio of pricesof exported goods to the prices of imports.As this ratio diminishes, the quantity ofimports that can be purchased from agiven quantity of exports also shrinks.
For countries where agricultural tradeaccounts for a large proportion of totaltrade, movements in the terms of trade ofagriculture can have importantimplications for the affordability of foodimports and for food security. This isparticularly true for LDCs and some otherdeveloping countries. During thecommodity price boom of the mid-1970sand early 1980s, the prices of agriculturalexports of developing countries increasedmore quickly than the prices of theiragricultural (mainly food) imports. Sincethe mid-1980s, this trend has reversed.Many of these countries have sufferedsevere losses from deteriorating terms oftrade, both between agricultural exportsand imports and between the agriculturalcommodities they export and themanufactured goods they import.
At the aggregate level, terms of tradewithin the agriculture sector worldwideneither rose nor fell significantly between1961 and 2002. However, looking at termsof trade separately for countries in differentincome groups reveals that developingcountries experienced large and persistentfluctuations.
From the mid-1980s to the present,terms of trade for both the LDCs and forother developing countries havedeteriorated significantly. For the LDCs, for example, agricultural terms of trade fell by half from a peak in 1986 to a low in 2001. Because many of these countriesdepend on commodity exports to finance food imports, a decline in terms of trade for agriculture threatens foodsecurity.
For developed countries, on the otherhand, there has been no long-term trend interms of trade in agriculture, and onlyminor fluctuations have occurred duringthe past 40 years.
Changing barter terms of trade betweenagriculture and manufactures
If deteriorating terms of trade in agriculturehave hurt the balance of payments andincreased the debt burden of manydeveloping countries, the fall in terms oftrade between agricultural commoditiesand manufactured imports has been evenmore persistent and more damaging.Between 1961 and 2001, the averageprices of agricultural commodities sold byLDCs fell by almost 70 percent relative tothe price of manufactured goodspurchased from developed countries.
A decline over time in the barter terms oftrade between primary goods andmanufactured goods, with a consequenttransfer of income from developing todeveloped countries, was noted some 50years ago by economists Raul Prebisch andHans Singer. They explained this in termsof the tendencies for economic growth toincrease the demand for manufacturedgoods more than for primary products, andfor productivity to increase more rapidly forprimary products, thus driving the prices ofprimary products lower relative to those ofmanufactured goods. One recent studyfound that productivity increased 20percent faster in agriculture than inmanufacturing worldwide, and more than100 percent faster in developing countriesthan in developed countries.
Most data do indicate a long-termdecline in the barter terms of trade.However, the rate of decline varies and,depending on the time period chosen,fluctuations in the data can make it difficultto distinguish trends from shorter-termvariability. While there is a clear decliningtrend in the terms of trade for agricultureversus manufactures over the wholeperiod, the nature of the trend clearly
Changing terms of trade for agriculturalcommodities
Rec
ent d
evel
opm
ents
and
long
-ter
m tr
ends
The State of Agricultural Commodity Markets 2004 12

changes in the mid-to-late 1980s, and forthe 1990s no significant downward trend isapparent.
Impact of declining terms of trade on developing countries
Although it may be difficult to confirm andquantify a long-term global trend usingstatistical data, there is no doubt that termsof trade for agricultural exports from manydeveloping countries have declinedsignificantly. The decline has been mostpronounced for the countries that canafford it least. Even during the 1990s, whilethe terms of trade for developed and otherdeveloping countries remained relativelystable, they plummeted by 25 percent forthe LDCs.
A decline in the agricultural terms oftrade can be counteracted by increases inthe quantity produced and exported so asto maintain or increase the real value ofexport earnings. In fact, for developingcountries as a group, increases in thequantity of agricultural exports have morethan offset the effect of declining realexport prices, such that the real value oftheir export earnings has risen by nearly 30percent in the last two decades. In otherwords, their “agricultural income terms oftrade” have increased. However, theevolution of the income terms of tradevaried considerably among LDCs andother developing countries. For LDCs,export earnings failed to increase, andrising import prices further eroded theirpurchasing power. Real agricultural exportearnings of LDCs fell by more than 30percent over the same period. Over the last
40 years their income terms of trade havefallen by half.
The region that has suffered most fromdeclining terms of trade is sub-SaharanAfrica. Since the 1970s, their deteriorationhas led to a substantial reduction in thepurchasing power of all African commodity
exports. World Bank estimates suggest thatbetween 1970 and 1997 declining terms oftrade cost non-oil-exporting countries inAfrica the equivalent of 119 percent of theircombined annual gross domestic product(GDP) in lost revenues. Export quantitieshave not grown sufficiently to cover the loss.
The State of Agricultural Commodity Markets 2004 13
Barter terms of trade in agriculture: ratio of export toimport unit values
Source: FAO
Income terms of trade for agriculture
Source: FAO
Barter terms of trade for agriculture versus manufactures:indexed ratios of agricultural export unit values tomanufacturing export unit values of developed countries
300
250
200
150
100
50
Index (1990–91 = 100)
Least developed countries
Other developing countries
Developed countries
Decline in African agriculturalcommodity terms of trade, 1960–2000
Index (1990 = 100)
200
150
100
50
Source: UNCTAD
Terms of trade by commodity group,1975–2000
150
100
50
0
Source: UNCTAD
1975 1980 1985 1990 1995 2000
1961 1966 1971 1976 1981 1986 1991 1996 2002
300
250
200
150
100
50
Index (1990–91 = 100)
Least developed countries
Other developing countries
Developed countries
1961 1966 1971 1976 1981 1986 1991 1996 2002Source: FAO
Index (1970 = 100)
Oilseeds
Raw materials
Tropical beverages
1960
1965
1970
1975
1980
1985
1990
1995
1998
1999
2000
Least developed countries(billion US$)
Other developing and developed countries (billion US$)
1961 1966 1971 1976 1981 1986 1991 1996 2002
109876543210
200180160140120100806040200
LDCs
Other developing countries
Developed countries

Over the course of the past 40 years,the net flow of agriculturalcommodities between developed
and developing countries has reverseddirection. In the early 1960s, developingcountries had an overall agricultural tradesurplus of almost US$7 billion per year. Bythe end of the 1980s, however, this surplushad disappeared. During most of the 1990sand early 2000s, developing countrieswere net importers of agricultural products.FAO has projected that this agriculturaltrade deficit is likely to widen markedly.
The change has been even morepronounced for the LDCs, which over thesame period have changed from being netexporters to significant net importers ofagricultural commodities. By the end of the1990s, imports by the LDCs were morethan double their exports.
Food imports grow rapidly
Global trade in foodstuffs has grown rapidlyand changed radically over recent decades.Between 1970 and 2001, gross world foodimports, measured in terms of calorieequivalents, rose by almost 60 percent. Butthis growth differed markedly among bothcountry and commodity groups.
Gross imports of food by developingcountries grew by 115 percent over thisperiod. Imports by developed countries,which already import a higher proportionof their food, grew by 45 percent. A closerlook at the data reveals that food importsby developing countries increased rapidlyduring the 1970s, grew more slowly duringthe 1980s and accelerated again over the1990s. This pattern holds true both for thevolume of food imports and for the ratio offood imports to availability forconsumption per capita. The expansion offood imports meant that the food tradesurplus of US$1 billion of developingcountries was transformed into a deficit ofmore than US$11 billion during this period.Moreover, this trend is expected tocontinue: according to FAO projections, bythe year 2030, the net food trade deficit ofdeveloping countries is expected to swell tomore than US$50 billion in constant1997–99 US$.
Despite substantial differences in thetrade and dietary profiles of developed anddeveloping countries, imports of particularcommodities appear to be evolving in asimilar manner.
Among the five broad food commoditygroups – cereals, edible oils, animal
Changing consumption patterns and international trade
Food
impo
rt b
ills
The State of Agricultural Commodity Markets 2004 14
Agricultural trade balance of least developed countries, 1961–2002
10 0009 0008 0007 0006 0005 0004 0003 0002 0001 000
0
Since the late 1980s, the least developed countries have become major net importers of agriculturalproducts.
Mill
ion
US
$
Net surplus
Net deficit
Source: FAO
Agricultural imports Agricultural exports
1961 1966 1971 1976 1981 1986 1991 1996 2002

products, sugar, and fruit and vegetables – cereal foodstuffs once dominatedinternational trade. Now, however, theshare of cereals in total agricultural importshas fallen below 50 percent in developingcountries and below one-third in developedcountries. While the share of cereal importshas declined, both developed anddeveloping countries are importing greaterquantities of higher-value and processedfoods, particularly edible oils, livestockproducts and fruits and vegetables.
The falling relative importance of cerealtrade has masked divergent trends amongdifferent grains. Trade shares of the“premium” cereals – wheat and rice – haveregistered strong growth, but caloriedependence on traded coarse grains hasdecreased sharply.
The relative importance of importedsugar also has been in long-term decline.With expanded production and use of non-cane sugar and other sweeteners, sugarimports by developed countries have fallen.
Changing diets, changing trade
Changes in patterns of production,advances in technology and changes indomestic and trade policies play animportant role in determining the structureof international trade. However, the dietsand preferences of consumers and thedemands of an increasingly concentratedfood industry have driven many of the shiftsin trade among commodities. These havebeen further influenced by globalization and
the spreading presence of the fast-foodindustry in developing countries.
Income growth, relative price changes,urbanization and shifts in consumerpreference have altered dietary patterns inboth the developed and developingcountries. When people have more moneyto spend, they add more variety and moreexpensive and high-value foods to theirdiets. These changes are reflected in boththe volume and the composition of worldtrade in agricultural commodities.
Expenditures on foodstuffs andresponses to income changes differbetween developing and developedcountries. In the latter, most consumerscan already afford the foods they prefer.When their incomes rise, changes in theirdiets and food purchases are thereforerelatively small.
In developing countries, on the otherhand, rising incomes have an immediateand pronounced impact on diets andconsequently on trade in both commoditiesand processed foods, as people adjust theirbudgets to include higher-value food items.Similarly, declining real food prices haveallowed poor consumers access toimproved diets at existing income levels.
Since the mid-1970s, for example, percapita meat consumption in developingcountries has more than doubled. Over thesame period, these countries havechanged from being net exporters of morethan 500 000 tonnes of meat to netimporters of more than 1.2 million tonnes.FAO has estimated that over the next 30
years people in the developing world willincrease the quantity of meat, dairyproducts and oils in their diets by 30percent or more. Per capita consumption ofcereals in these countries is not expected tochange, although total cereal use perperson may continue to rise owing to thegrowing use of coarse grains as feed.
In addition to rising incomes, rapidurbanization has contributed to changes inlifestyles, food preferences and the structureof commodity trade. As their numbers andpurchasing power have grown, city-dwellers have increased demand not onlyfor more dietary diversity, but also forproducts that require less time to prepare.Imports of high-value and processed foodproducts have risen to meet this demand. A growing problem of overnutrition andobesity in both developed and developingcountries has appeared alongside theexisting problem of undernutrition.
According to United Nations estimates,the world’s urban population is expected toincrease by 70 percent over the next threedecades. Most of this growth will take placein developing countries, particularly inAfrica and Asia. As recently as 1985,almost 70 percent of the population indeveloping countries lived in rural areas; by the year 2020, more than half of these 6 billion people are expected to live incities. Their higher incomes and urbanlifestyles are likely to bring about furtherchanges in the structure of global imports,accelerating the trend towards higher-valueand processed foodstuffs.
The State of Agricultural Commodity Markets 2004 15
Changes in per capita foodconsumption in developing countries
80
70
60
50
40
30
20
10
0
Consumption of meat, oils, and dairy productshas increased rapidly. Cereal consumption hasnot.
Percentage change
Source: FAO
* Projected
1975–85 1985–98 1998–2015*
Cereals
Sugar
Oilseeds
Meat
Dairy
Urbanization in developingcountries, 1960–2030
By the year 2020, a majority of the more than 6 billion people in the developing world will livein cities.
Source: United Nations
Rural
Urban
4.5
4
3.5
3
2.5
2
1.5
1
0.5
0
Food import bills by country group,1990–2000
120
100
80
60
40
20
0
During the 1990s, developing countriesincreased their nominal food imports by 43 percent and low-income food-deficitcountries by 54 percent.
Billion US$
Source: FAO
* LIFDCs = low-income food-deficit countries;LDCs = least developed countries
Developed Developing LIFDCs* LDCs*countries countries
1995–2000
1990–94
Projected
1960 1970 1980 1990 2000 2010 2020 2030
Billion people

Recent increases in food importshave been particularly significantamong many of the countries that
are most vulnerable to food insecurity. For developing countries as a whole, thevolume of gross food imports grew at anannual rate of 5.6 percent – far higher thanthe 1.9 percent annual growth in developedcountries.
The economic performance ofindividual developing countries played animportant part in determining how quicklythey increased their food imports duringthe 1990s. Countries that recorded strongoverall economic growth, as measured byper capita GDP, increased food importsmore quickly. Rapid growth in theagriculture sector had the opposite effect.Where agricultural value added per capitagrew more quickly, food imports generallydid not.
Neither of these effects is surprising.Food production responds relatively slowlyto changes in demand, as it takes sometime for farmers to increase plantings,harvests or herd sizes. Expansion ofdomestic production can also be hindered
by inherent weaknesses in domestic foodproduction and distribution systems.Examples of such weaknesses include lowproductivity, inefficiencies in supply chainsand marketing systems needed to reachurban consumers, and lack ofcompetitiveness with imported supplies – especially where the latter may havebenefited from developed countrysubsidies. Thus, when incomes anddemand rise rapidly, imports can scale upmore quickly than domestic production.More rapid growth in the agriculture sector,on the other hand, often increases theavailability of domestic foods, reducing thedemand for imports.
Paying for food imports can strain theresources of countries where economicgrowth lags and foreign exchange earningsare limited. Examining how large a slicefood import bills take out of GDP andexport earnings (total merchandiseexports) provides a way of gauging thelevel of “stress” food imports mayrepresent.
Over the past three decades, the shareof gross food import bills in GDP more than
Food import bills strain economiesFo
od im
port
bills
The State of Agricultural Commodity Markets 2004 16
Share of gross food imports (excluding food aid) in total apparent food consumption, 1970–2001
Since 1970, the proportion of imported food in total food consumption (in kcal terms) has increased indeveloping countries.
Percentage
1970 1975 1980 1985 1990 1995 2000
25
20
15
10
5
0
Other developing countries
Low-income food-deficit countries
Least developed countries
Source: FAO

doubled for an average developing country.The increase was most pronounced for theLDCs, where the value of food imports rosefrom about 1 percent of their GDP to over 4 percent. This means that the growth ofgross food import bills has outstrippedoverall economic growth in developingcountries, straining their economicresources.
Comparing the cost of gross foodimports with export earnings reveals thestrain food bills may place on foreignexchange. It also reveals that over the past30 years the countries most vulnerable tofood insecurity (the LDCs) have spent, on average, an increasing share of theirlimited foreign exchange earnings toimport food. In the early 1970s, they spentaround 43 percent of their export earningson commercial food imports, with the otherdeveloping countries spending around 36 percent. Since that time, however, theaverage share for the LDCs increased to 54 percent but declined to 24 percent forthe other developing countries.
Food imports and food aid
In addition to spending an increasing shareof their GDP and foreign exchangeearnings on food imports, LDCs are alsomajor recipients of food aid. When lessfood aid flows to countries that suffer from food shortages, it might be expectedthat commercial food imports would
increase – and the data tend to confirm thatthis is the case.
When the value of food aid increased asa share of total food imports during theearly 1980s, LDCs spent a significantlysmaller share of their GDP and exportearnings on commercial food imports.Since the mid-1980s, however, this trendhas reversed. The value of food aid hasdeclined significantly compared with the
total value of food imports. LDCs appear tohave compensated by dedicating a largershare of domestic resources to boostingcommercial food imports and maintainingnational food security.
The State of Agricultural Commodity Markets 2004 17
Share of food imports in GDP in developing countries, 1970–2001
Since 1970, the share of GDP spent on food imports has increased sharply in developing countries.Among the least developed countries the share has almost tripled.
Percentage
6
5
4
3
2
1
0
Least developed countries
Other developing countries
Share of food import bills in total value of merchandise exports, 1970–2001
Percentage
Source: FAO
1970 1975 1980 1985 1990 1995 2000
1970 1975 1980 1985 1990 1995 2000
90
80
70
60
50
40
30
20
10
0
Least developed countries
Other developing countries
Share of food aid in total value offood imports by least developedcountries, 1970–2001
Food aid accounted for an increasing share oftotal food imports in least developed countriesthrough the mid-1980s, but has declined sincethen.
1970 1975 1980 1985 1990 1995 2000
30
25
20
15
10
5
0
Source: FAO
Percentage
Source: FAO
Since 1990, least developed countries have spent between 50 and 80 percent of the foreign exchangeearned from exports to import food.
Variations in food import bills resultfrom variations in both the pricesand the quantities of food imported.
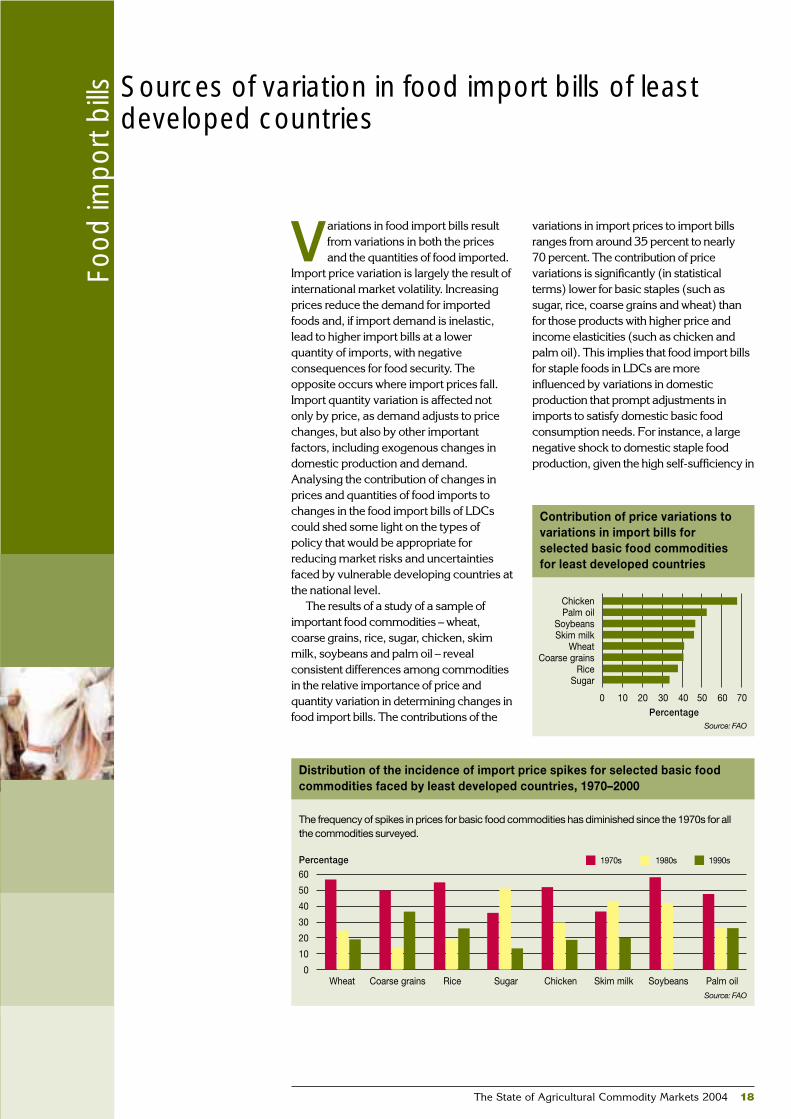
Import price variation is largely the result ofinternational market volatility. Increasingprices reduce the demand for importedfoods and, if import demand is inelastic,lead to higher import bills at a lowerquantity of imports, with negativeconsequences for food security. Theopposite occurs where import prices fall.Import quantity variation is affected notonly by price, as demand adjusts to pricechanges, but also by other importantfactors, including exogenous changes indomestic production and demand.Analysing the contribution of changes inprices and quantities of food imports tochanges in the food import bills of LDCscould shed some light on the types ofpolicy that would be appropriate forreducing market risks and uncertaintiesfaced by vulnerable developing countries atthe national level.
The results of a study of a sample ofimportant food commodities – wheat,coarse grains, rice, sugar, chicken, skimmilk, soybeans and palm oil – revealconsistent differences among commoditiesin the relative importance of price andquantity variation in determining changes infood import bills. The contributions of the
variations in import prices to import billsranges from around 35 percent to nearly 70 percent. The contribution of pricevariations is significantly (in statisticalterms) lower for basic staples (such assugar, rice, coarse grains and wheat) thanfor those products with higher price andincome elasticities (such as chicken andpalm oil). This implies that food import billsfor staple foods in LDCs are moreinfluenced by variations in domesticproduction that prompt adjustments inimports to satisfy domestic basic foodconsumption needs. For instance, a largenegative shock to domestic staple foodproduction, given the high self-sufficiency in
Sources of variation in food import bills of leastdeveloped countries
Food
impo
rt b
ills
The State of Agricultural Commodity Markets 2004 18
Distribution of the incidence of import price spikes for selected basic foodcommodities faced by least developed countries, 1970–2000
Wheat Coarse grains Rice Sugar Chicken Skim milk Soybeans Palm oil
60
50
40
30
20
10
0
Percentage
Contribution of price variations tovariations in import bills forselected basic food commoditiesfor least developed countries
0 10 20 30 40 50 60 70
ChickenPalm oil
SoybeansSkim milk
WheatCoarse grains
RiceSugar
Percentage
The frequency of spikes in prices for basic food commodities has diminished since the 1970s for allthe commodities surveyed.
1970s 1980s 1990s
Source: FAO
Source: FAO

basic foods of most LDCs, translates into alarge increase in demand for imports. Giventhe inelastic food-security consumptionneeds of LDCs, such large increases inimport demand are not influenced greatlyby international prices. From a policyperspective, these findings suggest thatmeasures designed to address instability indomestic markets for basic food staplesmay play a relatively greater role inreducing instability in their food import bills.
However, measures to cope with theeffects of international price instability maystill be an important component of anoverall strategy to address the uncertaintythat is inherent in food import bills. Importprice changes have a strong influence onLDC food import bills and, with so much oftheir limited foreign exchange earningsbeing spent on food imports, LDCs areparticularly vulnerable to unexpected pricespikes and instability in international foodmarkets. A price spike is defined as anunpredictable extreme price increasebeyond what could be expected as anormal response to the evolution of pricesand quantities. Spikes in internationalprices for basic foods can impose seriousstrains on foreign exchange reserves,especially when they occur simultaneouslywith negative shocks in domestic foodproduction.
Although the number of price spikes hasdiminished for many basic foodcommodities since the 1970s, many LDCshave suffered from extreme price volatility,with a large number of spikes in the pricesof basic food commodities they mustimport to ensure the food security of theirpopulation.
Most of these spikes coincided withmajor events that affected food productionand markets worldwide, such as the “globalfood crisis” of 1974–75. Others, however,coincided with important policy decisions inmajor industrialized regions, such aschanges in domestic support policies in theUnited States and the EU that exacerbatedprice changes in international marketsresulting from normal supply and demandvariations.
Over the past 30 years, the food importbills of LDCs have grown much faster thanboth their overall economies and theirexport earnings. LDCs have alsoexperienced much greater volatility in theirfood import bills, particularly in relation totheir overall economic growth and exportearnings. The combination of high and
unpredictable food import bills undoubtedlystrains the ability of some LDCs to ensurefood security at a national level.
Sudden changes in the markets triggeredby major policy decisions appear to havehad a measurable and potentially damagingimpact on these vulnerable countries.Analysis of these price spikes and theirrelation to decisions on agricultural andtrade policies taken by developed countries highlights the need to assess the
potential impacts of the latter on LDCsduring international policy deliberations,such as those in the World TradeOrganization (WTO), and to plan measuresto mitigate them. In addition, steps should betaken to reduce the vulnerability of LDCsand ensure their access to a steady supply of food on international markets byaddressing problems of short-term worldprice volatility.
The State of Agricultural Commodity Markets 2004 19
Food imports, economic development and food security
Source: FAO
Percentage
0 5 10 15 20 25 30
* Averages for countries grouped by prevalence of undernourishment
Food imports as a share of merchandise exports
Food aid as a share of food imports
Food imports as a share ofapparent consumption
Food insecure(prevalence ofundernourishment > 15 percent)
Relatively food secure(prevalence ofundernourishment < 15 percent)
Average value of food-trade-related variables for least developed countries grouped by prevalence of undernourishment, 1999–2001*
Developing countries that suffer from
widespread hunger tend to depend heavily
on agriculture for employment and incomes
and on exports of agricultural commodities
for foreign exchange revenues. Even though
their populations tend to be predominantly
rural and their economies agricultural,
these countries also rely increasingly on
food imports and spend a high proportion
of their foreign exchange earnings to
purchase them.
Analysis of a wide range of variables
related to economic and agricultural
development, food imports and food
insecurity suggests that the nature and
degree of involvement in international trade
by developing countries are associated with
levels of hunger and food insecurity in
developing countries.
The relationships between food imports,
involvement in international trade and food
security can be demonstrated by dividing
developing countries into two broad groups,
based on the proportion of their population
that is chronically hungry. Countries where
more than 15 percent of the population is
undernourished are classified as food
insecure. Those where the prevalence of
undernourishment is less than 15 percent are
considered to be relatively food secure.
Statistical analysis reveals that food
insecurity is highly correlated with a composite
index based on three indicators related to the
structure of their international trade – the
share of food imports in total merchandise
exports, the share of food aid in food imports
and the share of total food imports in calories
available for consumption.
It appears that countries where hunger is
widespread spend a far higher proportion of
their export earnings on food imports.
Despite this heavy expenditure of limited
foreign exchange, however, these food-
insecure countries cover a smaller share of
their apparent consumption from food
imports. This suggests that food-insecure
countries might import even more food to
cover shortfalls in domestic production and
ensure food security if they were not
constrained by limited export earnings. It also
suggests that the need to expend such a high
proportion of foreign exchange resources on
food imports may reduce the ability of these
food-insecure countries to invest in other
areas that would stimulate development and
reduce their long-term vulnerability.

Many developing countries dependon exports of a small number ofagricultural commodities, even a
single commodity, for a large share of theirexport revenues. This concentration leavessuch countries highly vulnerable tounfavourable market or climaticconditions. A drought or a drop in prices onthe international markets can quickly draintheir foreign exchange reserves, stifle theirability to pay for essential imports andplunge them into debt.
As many as 43 developing countriesdepend on a single commodity for morethan 20 percent of their total revenues frommerchandise exports. Most of thesecountries are in sub-Saharan Africa or LatinAmerica and the Caribbean and depend onexports of sugar, coffee, cotton lint orbananas. Most suffer from widespreadpoverty. More than three-quarters of these43 countries are classified as LDCs, where per capita GDP is less than US$900per year.
Furthermore, recent data show that fewof the countries concerned are reducingtheir commodity dependency. In 14 of thecountries, dependency on a singleagricultural commodity actually increased
between 1986–88 and 1997–99, and onlyseven countries succeeded in reducingtheir reliance on a single commodity. Overthe past 20 years, real prices for many ofthe commodities these countries dependupon have fluctuated widely and fallensignificantly overall (see page 11).
Declines and fluctuations in exportearnings have battered income, investmentand employment in these countries and leftmany of them deeply in debt. TheInternational Monetary Fund (IMF) andWorld Bank have classified 42 countries asHeavily Indebted Poor Countries (HIPCs).Thirty-seven of these rely on primarycommodities for more than half of theirmerchandise export earnings. More thanhalf the world’s cocoa and more than aquarter of its coffee are produced incountries classified as HIPCs.
The high cost of declining prices
Most agricultural commodities haveexperienced a downward trend in realprices, and the long-term forecasts are notencouraging. According to World Bankestimates for 2015, although real prices of
The risks of dependency on commodity exports A
gric
ultu
ral e
xpor
t ear
ning
s
The State of Agricultural Commodity Markets 2004 20
Exporting more coffee, earning less
Source: FAO
1985 1990 1995 2001
Export volume Export value1985 1990 1995 2001
1501209060300
Since coffee prices peaked in the mid-1980s,countries that depend on coffee for more than20 percent of their export earnings haveincreased the volume of coffee they trade by26 percent. But their income from coffeeexports has fallen by almost a third.
Cotton exports grow but income lags
Source: FAO
1985 1990 1995 2001
Export volume Export value
1985 1990 1995 2001
1501209060300
During the 1990s, countries that depend oncotton exports for more than 20 percent oftheir trade revenues increased the volume ofexports by over 40 percent. But theirrevenues fell by 4 percent following a steepdrop in cotton prices.
Index (1989–91 = 100) Index (1989–91 = 100)

Dependence on agricultural export earnings from a single commodity, 1997/99
Forty-three developing countries depend on exports of a single agricultural commodity for more than 20 percent of their total revenues from merchandiseexports. Most of them suffer from widespread poverty, with more than three-quarters classified as least developed countries. Most common among thecommodities they depend upon are coffee, cocoa, cotton, sugar and bananas.
most agricultural commodities areprojected to rise above current levels, theywould still remain below their mid-1990speaks.
For some developing countries, thecollapse of commodity prices wastraumatic, triggering rising ruralunemployment and a steep decline inexport earnings. Lower income fromexports has jeopardized their ability to payfor food imports, particularly in countrieswhere food import bills account for a highshare of the GDP.
If prices for the ten most important (in terms of export values) agriculturalcommodities exported by developingcountries had risen in line with inflationsince 1980, these exporters would havereceived around US$112 billion more in2002 than they actually did. This is morethan twice the total amount of aiddistributed worldwide.
The high cost of price volatility
Although the extent of volatility has declinedover the last 20 years, prices of manyagricultural commodities remain highlyvolatile. Spikes or drops in prices can betriggered by a drought or a bumper crop.They are prolonged and deepened by thefact that both supply and demand forcommodities, especially perennials,respond slowly to price changes.
When stocks are low and prices high,farmers can increase their planting, but theycannot compress the time it takes for cropsto ripen to harvest. In the case of perennialcrops such as coffee or cocoa, that can takeyears. When farmers eventually do increase
production, prices fall as supplies quicklyoutgrow demand in importing countries,given that demand does not growsignificantly in response to lower prices. The result is a pattern of short-lived boomsfollowed by lingering slumps.
Overall, instability tends to be higher foragricultural raw materials and tropicalbeverages than for temperate-zoneproducts. The former are key commoditiesfor export earnings in developing countries.
Declining prices and price volatility costboth farmers and governments in thedeveloping world dearly. A steep orprolonged slump in commodity prices canmake debt repayment difficult, turning short-term borrowing into long-term debt. A recentIMF/World Bank publication cited a sharpdrop in the prices of key export commoditiesas the main reason why the ratio of debt toexports had worsened dangerously in 15heavily indebted poor countries.
Because exports provide the foreignexchange needed to repay debts, the debt-to-exports ratio is often used togauge whether debts are sustainable. The report noted that the countries inquestion depended on exports of cotton,coffee, cashews, fish and copper, all ofwhich had experienced steep pricereductions.
Some countries have managed to limit,at least temporarily, the adverse effects offalling real prices on export earnings andincomes through productivityimprovements and cost reduction.However, widespread adoption of cost-reducing innovations can add to thedownward pressure on prices for all, whilethose exporters not sharing in productivityincreases (often the LDCs) may findthemselves squeezed between fallingprices and costs that are higher thanaverage.
The State of Agricultural Commodity Markets 2004 21
Percentage share of export earnings in total merchandise exports
0 5 10 15 20 25 30 35 0 10 20 30 40 50 60 70 80 0 10 20 30 40 50 60 0 5 10 15 20 25 30 35 40
MauritiusSwaziland
FijiGuyana
BelizeCuba
Sugar
HondurasGuatemala
RwandaUgandaEthiopiaBurundi
Coffee
Central African Rep.TogoMali
BeninChad
Burkina Faso
Cotton
Costa RicaPanamaEcuador
DominicaSt Vincent
St Lucia
Bananas
Instability of nominal world pricesfor selected commodities, 1986–99
Source: FAO
Beef Coarse Wheat Cocoa Sugar Coffeegrains
25
20
15
10
5
0
Average of annual deviationfrom trend (percent)
Commodities traded by developing countriestend to be more volatile than temperate zoneproducts exported by developed countries.
Decline in nominal prices forselected commodities, 1980–2000
Source: IMF
0
-20
-40
-60
-80
Several of the commodities exported bycommodity-dependent countries haveexperienced steep declines over the past twodecades.
Source: FAO
Bananas Tea Coconut Cotton Coffee Cocoa Sugaroil
Percentage

The high level of agriculturalprotection in both developed anddeveloping countries and the high
level of domestic support in the formerhave impeded growth in agriculturalexports from developing countries. Withthe WTO Agreement on Agriculture, theUruguay Round of trade negotiationsinitiated the process of reducing barriers toagricultural trade. But the level ofprotection remains high.
For Organisation for Economic Co-operation and Development (OECD)countries, the average bound tariff foragricultural products is 60 percent,compared with an average rate of 5percent for industrial goods. Averageapplied tariffs on agricultural imports fromdeveloping countries, are estimated to be12 percent in the United States, 20 percentin the EU, 17.5 percent in Canada and 22percent in Japan. (Of course, theseaverages can only give a broad indicationof relative tariff incidence, and will beinfluenced by the commodity and countrycomposition of trade flows.) At the sametime, preferential trade arrangementsoffered by some developed countries,
particularly for the LDCs, have providedmany opportunities for these countries toexpand and diversify their exports. Thesehave increasingly included duty-free andquota-free access to imports from LDCs asunder the EU’s “Everything but Arms”initiative. However, trade preferences havebeen underutilized in many cases. Tariffsapplied by developing countries can alsobe high and are a constraint on theexpansion of trade among them.
Tariff peaks hit hard
Average tariffs faced by developingcountries may be low, but “tariff peaks” thatare substantially higher than the average areapplied for a number of the commoditiesthey export, such as sugar and horticulturalproducts. For each commodity group, thedeveloped countries have more tariff peaksand higher average peak tariffs than thedeveloping countries. According to theWTO, the highest tariff peaks on agriculturalimports in developed countries are as highas 350 percent for tobacco, 277 percent forchocolate, 171 percent for oilseeds, and 134percent for poultry.
According to FAO estimates, if tariffswere reduced by 40–60 percent indeveloped countries and 25–40 percent indeveloping countries, with tariff peaksbeing subjected to the biggest cuts,
Barriers to trade in developed countries – tariffs, tariff escalation and producer support
Agr
icul
tura
l exp
ort e
arni
ngs
The State of Agricultural Commodity Markets 2004 22
Developed countries’ tariffs onagricultural and non-agriculturalproducts by region, 1997
35302520151050
Tariffs levied by industrial countries on imports from each region (percent)
Developed countries levy much higher tariffson agricultural exports from developingcountries than on those from other developedcountries.
East Latin Middle South Sub- IndustrialAsia America East Asia Saharan
Africa
Source: World Bank
Agricultural products
Non-agricultural products
MFN tariff peaks in developedcountry markets on agriculturalimports from developing countries*
400
300
200
100
0
Percentage
* Ad valorem tariffs only** MFN = most favoured nation
Source: WTO
Poultry Chocolate Oilseeds Tobacco
Average weightedMFN tariff**
MaximumMFN tariff**

agricultural exports of LDCs could increaseby as much as 18 percent.
Tariff escalation deters diversification
Exports from developing countries are alsofaced with tariff escalation, in which highertariffs are levied on goods exported at moreadvanced stages of processing. Tariffescalation is pervasive for manyagricultural commodity chains – thesequences of processing steps throughwhich a basic commodity such as cocoabeans is transformed into a final productsuch as chocolate.
A recent FAO study of 16 commoditychains concluded that 12 suffer from tariffescalation, mostly at the first stage ofprocessing. The study also found that tariffescalation is particularly pronounced incommodity sectors (such as meat, sugar,fruit, coffee, cocoa, and hides and skins)that are important to many of the poorestdeveloping countries.
The food-processing industry includessome of the highest levels of tariff escalationand tariff peaks. Tariffs on fully processedfoods in many cases are more than doublethe tariffs on the basic food commodities.This is seen as one reason for the limitedinvolvement of developing countries inexporting processed products. Anotherrecent study by FAO found that fordeveloping countries about 57 percent ofagricultural export earnings came fromprocessed agricultural products comparedwith 68 percent in developed countries. ForLDCs the share of processed products inagricultural exports amounted to only 20percent. However, tariff escalationdiscourages investment in agriculturalprocessing in developing countries andblunts efforts to reduce dependence onprimary commodities and diversify intomore highly valued products. There are, ofcourse, other reasons, including domesticsupply constraints and entry barriers arisingfrom concentration in international markets,which discourage vertical diversification intothe production of value-added forms ofcommodities by developing countries.
Reducing tariff escalation has beenidentified as one of the most importantmarket access issues in the current WTOnegotiations on agriculture. Thirteen of the45 negotiating proposals that have beensubmitted called for substantial reductionsin tariff escalation, particularly in thedeveloped countries.
Subsidiesin developed countries
While tariffs have generally been falling,other policies that may further limit exportsfrom developing countries have not beensubstantially modified. For example,although the value of such support hasdeclined in both nominal and real terms,export subsidies and domestic support in some developed countries haveremained high and have depressed priceson world markets, eroding the incomes and market share of producers in non-subsidizing developing countries anddraining the foreign exchange reserves ofmany countries that depend heavily oncommodity exports.
Total support to farmers in the OECDcountries adds up to more than US$200billion per year. Support has beenparticularly high for products such as rice,sugar, milk, wheat and meat. As the WorldBank recently observed, “although officialexport subsidies may be small andshrinking, effective export subsidiescreated by domestic support areincreasing”. The extent to which domesticsupport has an impact on world marketprices for agricultural commoditiesobviously depends on the form thatsupport takes and the extent to which it is“decoupled”.
In the case of cotton, while there are noexport subsidies in the United States andthe EU, various forms of direct support
The State of Agricultural Commodity Markets 2004 23
Support to agricultural producers indeveloped countries
250
200
150
100
50
0
Farm support in the developed countries totalsmore than US$200 billion per year and hasdeclined only marginally since the late 1980s.
1986–88
2000–02
EU USA Japan OECD
RiceSugar
MilkWheat
Sheep meatBeef and veal
MaizeOilseedsPig meat
PoultryEggs
Source: OECD
0 10 20 30 40 50 60 70 80 90
Tariff escalation on coffee andcocoa products in some developedcountries
30
25
20
15
10
5
0
Tariffs on selected products (percent)
Tariffs on processed coffee and cocoaproducts exported to developed countries arefar higher than tariffs on raw beans.
Source: FAO
EU USA JapanEU USA Japan
Tariff escalation with level ofprocessing in developed countries
30
25
20
15
10
5
0
Tariffs on raw and processed goods (percent)
Developed countries impose far higher tariffson processed goods, making it difficult fordeveloping countries to export higher-valueproducts.
Source: World Bank
Raw
Intermediate
Final
Canada Japan USA EU
Source: OECD
Billion US$
Coffee, rawCoffee,roasted
CocoabeansCocoabutterChocolate
OECD average as percentage of value of gross farm receipts
Subsidies to agricultural producersin OECD countries: producersupport estimate (average 2000–02)

allow farmers to produce cotton that is thenexported at prices below the costs ofproduction. The cost of competing withexports of heavily subsidized cotton fromthese countries has been high for cottonfarmers and cotton-exporting countries inthe developing world (see box). Similarly,with subsidies to sugar beet farmerstotalling more than US$2.2 billion per year,the EU has become the world’s largestexporter of sugar. European sugar isexported at prices that are 75 percentbelow its production cost.
Constraints in developing countries
Tariffs, subsidies and other trade-distortingpolicies in developed countries have to alarge extent eroded the market share andrevenues of exports by developingcountries. But policies, priorities andconditions within the developing countriesthemselves have also contributed to theirloss of competitiveness and inability todiversify into more profitable and lessvolatile sectors.
During the 1980s and 1990s, manydeveloping countries dismantled the statemarketing boards that had previouslyexerted monopoly control over domestictrade and prices for agriculturalcommodities. Farmers were no longercompelled to sell at prices set far below thevalue of their produce on world markets.Cocoa farmers in Ghana, for example,received only 6 percent of the export priceof cocoa in the early 1980s. Now they get
more than 40 percent. Elimination of whatamounted to confiscatory taxation onagriculture has restored incentives forfarmers to increase investment andproduction.
In many cases, however, the abolition ofmarketing boards has left an institutionalvacuum. Farmers often relied upon theboards for credit, fertilizer and other inputs,and for access to extension and training.Now that the boards are gone, in manycases neither government nor the privatesector has taken on these roles.
Smallholders in many developingcountries have been confronted by loss ofaccess to credit and soaring prices forinputs. Poor market infrastructure andinformation channels leave them vulnerableto price volatility and exploitation by tradingcompanies that have often stepped in toreplace the state monopoly with a privateone. At the same time, public expendituresin agriculture have dwindled. In manycountries, both yields and quality ofcommodities have fallen since themarketing boards were abolished.
Meeting challenges and opportunities
Lack of access to credit, extension andgood market information threatensfarmers’ ability to break their dependenceon traditional primary commodities anddiversify into higher-value agriculturalexports. In recent years, demand for fruits,vegetables and other non-traditionalagricultural exports (NTAEs) has grown,
Agr
icul
tura
l exp
ort e
arni
ngs
The State of Agricultural Commodity Markets 2004 24
Production and net imports of sugarin the European Union, Japan andthe United States, 1965–2002
35
30
25
20
15
10
5
0
-5
Million tonnes
High protection and support for sugar in thedeveloped countries have increased domesticproduction and reduced net imports.
Source: FAO
Production
Net imports
1965
1969
1973
1977
1981
1985
1989
1993
1997
2001
Support as share of farm-gateprices
80706050403020100
Percentage
Tariffs, quotas and domestic support tofarmers account for around 30–50 percent offarmers’ revenues in OECD countries. Whiletariffs have decreased since the late 1980s,direct subsidies to producers have grown.
Domestic support
Border protection (tariffs, quotas)
EU USA OECD
1986– 1999– 1986– 1999– 1986– 1999–1988 2001 1988 2001 1988 2001
Source: World Bank

while prices for commodities traditionallyexported by developing countries havestagnated or declined.
But shifting to new crops and marketsrequires training and investment. Newentrants to the NTAE market must alsomeet the high quality standards and strictdelivery deadlines set by the supermarketsand large retailers who dominate themarket for these goods.
Small producers in developing countries face increasing marginalizationunless they adjust to these conditions. To enter the fresh fruit and vegetable sector, for example, small farmers need toestablish marketing groups, developcommunications systems and acquire the training and tools to deliver theirproduce washed, trimmed, cut, graded andlabelled.
While some small producers havemanaged this transition effectively, the challenges are proving difficult.In general, it has been the more affluentfarmers and certain more affluentdeveloping countries that have succeededin diversifying into NTAEs. The LDCs, onthe other hand, have seen their share ofboth NTAEs and total agricultural exportscontinue to decline.
The State of Agricultural Commodity Markets 2004 25
1501209060300
-30-60
Percentage change
Overall, developing countries have increasedtheir share of exports in rapidly growingsubsectors such as fruits, vegetables andseafood enough to make up for losses ofmarket share and revenues in other agriculturalproducts. Least developed countries have not.Much of the least developed countries’ gains inseafood came from developed-country fleetsfishing in their waters.
Fruits and Fish and All agriculturevegetables seafood plus fish
Developing country and leastdeveloped country shares in worldagricultural exports, 1980–81 to2000–01
50
-5-10-15-20-25-30-35
Percentage change
Government expenditure on agriculture hasfallen in proportion to total governmentspending in all developing regions except Eastand Southeast Asia.
Latin Sub- Near East and SouthAmerica Saharan East Southeast Asiaand the Africa and North Asia
Caribbean Africa
Share of expenditure on agriculturein total government expenditures indeveloping regions, 1990–92 to1996–98
Source: FAO
Leastdevelopedcountries
Alldevelopingcountries
Source: FAO
Cotton subsidies in developed countries depress world prices, national economies and rural livelihoods
Source: FAO
United States domestic support for cotton and gross national incomes for selected West African countries
4.54
3.53
2.52
1.51
0.50
Billion US$
Domestic Benin Burkina Central Chad Mali Togosupport 2001/02 Faso African Rep.
25 000 cotton farmers
Pop. 6 m Pop. 11 m
Pop. 4 mPop. 8 m
Pop. 11 m
Pop. 5 m
More than 10 million people in Central and
West Africa depend on cotton production for
their livelihoods and food security. For many
countries in the region, cotton exports
provide the main source of foreign exchange
revenues and rural employment. In 2001,
cotton accounted for more than 50 percent of
the total agricultural exports and 2.5–6.7
percent of the GDP of Benin, Burkina Faso,
Chad, Mali and Togo.
Working small plots of 1–2 hectares and
relying on manual labour, farmers in West
Africa rank among the lowest-cost producers
of cotton in the world. Since the mid-1990s,
however, they have been battered by a
collapse in cotton prices and by competition
with cotton exports from the United States.
Production costs in the United States are
three times higher than those in West Africa.
But United States cotton farmers also benefit
from US$3–4 billion per year in direct support
– more than the entire GDP of Burkina Faso,
where 2 million people depend on cotton
production.
Between 1998 and 2001, as cotton prices
slumped to record lows, cotton production in
the United States grew by more than 40
percent and the volume of exports doubled.
The collapse of cotton prices is estimated
to have cost eight West African countries
nearly US$200 million in lost annual export
revenues. The cost to millions of rural
households for which cotton is the only
source of cash income has also been high.
One recent study by the World Health
Organization found that West African
households that grew cotton in addition to
maize had better nutrition and higher
incomes. When cotton production grew by
175 percent between 1993 and 1998, poverty
decreased by 16 percent.
Cotton subsidies in the developed
countries are not the only reason that cotton
prices have fallen for domestic producers in
some developing countries. In some cases,
domestic policies have also penalized cotton
producers. Moreover, technological change
and competition from artificial fibres have
been pushing the world cotton price down
over the past 50 years. However, a study by
FAO suggests that eliminating all domestic
support – not only support notified to the
WTO – would increase world cotton prices by
5–11 percent, and would prompt an
expansion in African exports of at least 9
percent and possibly as much as 38 percent.

Over the past 20 years, the value ofworld trade in processed agriculturalproducts grew more quickly than
trade in primary agricultural products.Exports of processed agricultural productsgrew 6 percent per year during the period1981–2000, compared with 3.3 percent forprimary products. As a result, the share ofprocessed products in total agricultural tradeincreased from 60 percent in 1981–1990 to66 percent in 1991–2000. Growth rates havebeen exceptionally high (above the averageof 6 percent) for the processed forms ofcereals, fruit, vegetables, pulses, tropicalbeverages and poultry products.
A number of factors have contributed tothe decreasing share of primarycommodities in agricultural trade. On thedemand side, rising incomes globally andchanging lifestyles have promptedconsumers to spend an increasing share of their incomes on manufactured andprocessed goods. On the supply side,continuous improvements in packagingand processing technologies as well aslower transport costs and reductions inbarriers to trade have increasinglyfacilitated trade in processed products. The high costs associated with processing,
packaging, advertising, marketing anddistribution mean that the share of theprimary commodity in the value (price) ofthe final processed product has inevitablydiminished. The use of agricultural rawmaterials in other sectors of the economyhas also diminished with the developmentof synthetic alternatives.
Although some developing countriesincreased their share of world exports ofprocessed agricultural products, thedeveloped countries captured most of therapidly growing trade in this sector. Many developing countries, particularly the LDCs, still depend heavily on exports of primary agricultural products. The share of developing countries in world exports of processed agricultural productsdecreased from 27 percent in 1981–1990to 25 percent in 1991–2000. For the LDCs as a group, their share in processedagricultural exports fell from a negligible0.7 percent to 0.3 percent over the sameperiod.
Developing countries lose ground
Developing countries’ shrinking share ofexports of processed products has been
The evolution of trade in primary and processed agricultural products
Cha
ngin
g pa
tter
ns o
fag
ricul
tura
l tra
de
The State of Agricultural Commodity Markets 2004 26
Share of cocoa-producingdeveloping countries in primary andprocessed cocoa products
The top ten cocoa-producing countries exportmore than 85 percent of the world’s cocoabeans but only 2 percent of the chocolate.
Percentage share of top tencocoa-producing countries in
world exports
0 20 40 60 80 100
Cocoa beans
Cocoa butter
Cocoa powder
Chocolate
Source: FAO
Changes in shares of roast coffee incoffee exports, 1975–80 to1998–2002
The share of roast coffee in total coffee exportsjumped from 3 to 16 percent between 1975–80and 1998–2002. But the share of the top tencoffee-producing countries in these exportsplummeted from 8 to 2 percent.
0 5 10 15
Share of roast coffee intotal coffee exports
Share of top ten coffee-producing countries in
roast coffee exports
Source: FAO
1975–80
1998–2002 Percentage

particularly evident in such products ascocoa and coffee. The share of the top tencocoa-producing developing countries inworld exports has declined as the stage ofprocessing has increased. While the shareof chocolate exports in total cocoa traderose from 22 percent in 1975–80 to 58percent in 1998–2002, the share of thesecountries in chocolate exports declinedfrom 2.4 percent to 2 percent during thesame period.
Similarly, the top ten coffee-producingdeveloping countries’ share in green coffeeexports remained unchanged at about 67percent between 1975–80 and
1998–2002, but their share in roastedcoffee declined from 8.5 to 1.8 percentduring the same period.
Market access and market entry barriersin importing countries have limited theability of developing countries to expandexports of their processed products. Tariffescalation, in particular, constitutes a majorbarrier to market access for most of theprocessed agricultural exports ofdeveloping countries.
Several studies have shown thatagricultural commodity chains, particularlythose of high-value crops and processedproducts, are increasingly dominated by a
few transnational enterprises anddistribution companies with significantmarket power.
Internal supply constraints also limit theability of many developing countries,particularly LDCs, to take advantage ofopportunities to trade processedagricultural products. These includeobsolete technology; inadequate transport,storage and marketing infrastructure;inadequate legal and regulatoryframeworks; and trade and economicpolicies that are biased against agricultureand exports.
The State of Agricultural Commodity Markets 2004 27
Value and share of primary andprocessed agricultural products,1981–90 to 1991–2000
Global trade in processed agricultural productsgrew faster than trade in primary products overthe past 20 years.
Valu
e of
wor
ldag
ricul
tura
l exp
orts
(bill
ion
US
$)
Source: FAO
Developing and developed country shares in exports of primary and processed agricultural products, 1981–90 to 1991–2000
Developed countries increased their share in world exports of processed agricultural products from 73 to 75 percent over the past 20 years. Developing countries saw their share shrink from 27 to 25 percent.
Percentage share in world agricultural exports, all commodities
1981–90
1991–2000
1981–90
1991–2000
1981–90
1991–2000
Developedcountries
Developingcountries
Leastdevelopedcountries
Processed
Primary
Source: FAO
0 10 20 30 40 50 60 70 80
Share of primary and processed products in worldagricultural exports, 1981–90 to 1991–2000
The share of many primary products in total agricultural exports hasdeclined, even as the share of processed goods made from the sameproducts has increased.
Primary products Processed products
Percentage
0 2 4 6 8 10 0 1 2 3 4 5 6
Percentage
Cereals
Tropical beverages
Oilseeds, oils andother products
Tobacco
Vegetables
FruitsFibre crops andraw materials
Source: FAO
Growers’ share in coffee export revenues declines as consuming countries’ increases
After increasing to more than 20 percent during the 1970s and early 1980s,the growers’ share of coffee export revenues has fallen by almost half.During the same period, the share of consuming countries has increasedto more than 80 percent.
Percentage share of export revenues
1965 1970 1975 1980 1985 1990 1995 2000
100
80
60
40
20
0
Source: Kaplinsky and Fitter, 2001
350300250200150100500
Share of all agricultural exports
1981–90 1991–2000
Processed
Primary
1981–90 1991–2000
Growers
Post-farmproducing countries
Transport andweight loss
Consumingcountries

Much attention has understandablyfocused on tariffs and other trade barriers that limit
developing countries’ commodity exportsto the developed world. But several studies have suggested that in the long run developing countries stand to gain agreat deal from reducing barriers toagricultural trade among themselves as well.
Since the mid-1980s, agricultural trade among developing countries has grown rapidly, at an annual rate of 8.8 percent, outstripping the 4.2 percentincrease in shipments to developedcountries. The share of agricultural exportsthat move between developing countrieshas increased by more than one-third, from 31 percent to 44 percent.
Much of this increased trade took place between neighbours in developingregions. Latin America registered the most rapid growth in intraregional trade,with an increase of more than 90 percent in the proportion of exports shipped to other countries in the region.
Regional trade agreements
The proliferation of regional tradeagreements (RTAs) has contributed toreducing trade barriers and stimulatingtrade among developing countries. Inmany developing regions, RTAs are seenas a vehicle for promoting and diversifyingtrade. This is particularly true of thoseagreements that have reduced tariffs andother barriers to agricultural trade withintheir regions. A recent FAO studyconcluded that regional trade agreementshad been the main trigger for rapid growth of agricultural trade within LatinAmerica.
Some of the RTAs among poorerdeveloping countries, however, have notseen significant growth in agricultural trade.Many have been hampered by majorstructural and policy obstacles, includinginadequate transport and communicationfacilities and poor information aboutmarkets and investment opportunities. The lack of standardized packing, gradingand quality control systems at regional
Commodity trade and regional integration amongdeveloping countries
Cha
ngin
g pa
tter
ns o
fag
ricul
tura
l tra
de
The State of Agricultural Commodity Markets 2004 28
Increase in agricultural trade amongdeveloping countries, 1985–90 to1996–2001
The share of agricultural exports fromdeveloping countries that went to other developing countries increased from 31 to 44 percent between 1985–90 and1996–2001.
Share of developing country agricultural exports to:
Developing countries
Developed countries
Central and Eastern European countries
Source: FAO
1985–90 1996–200131% 44%
59%10% 52%4%
Intraregional trade amongdeveloping countries, 1985–90 to1996–2001
Intraregional trade increased as a share of total agricultural trade in all developing regionsbetween 1985–90 and 1996–2001.
Percentage share of intraregional trade in total agricultural trade
Source: FAO
50
40
30
20
10
0
1996–20011985–90
Latin Africa West East and America Asia South Asia
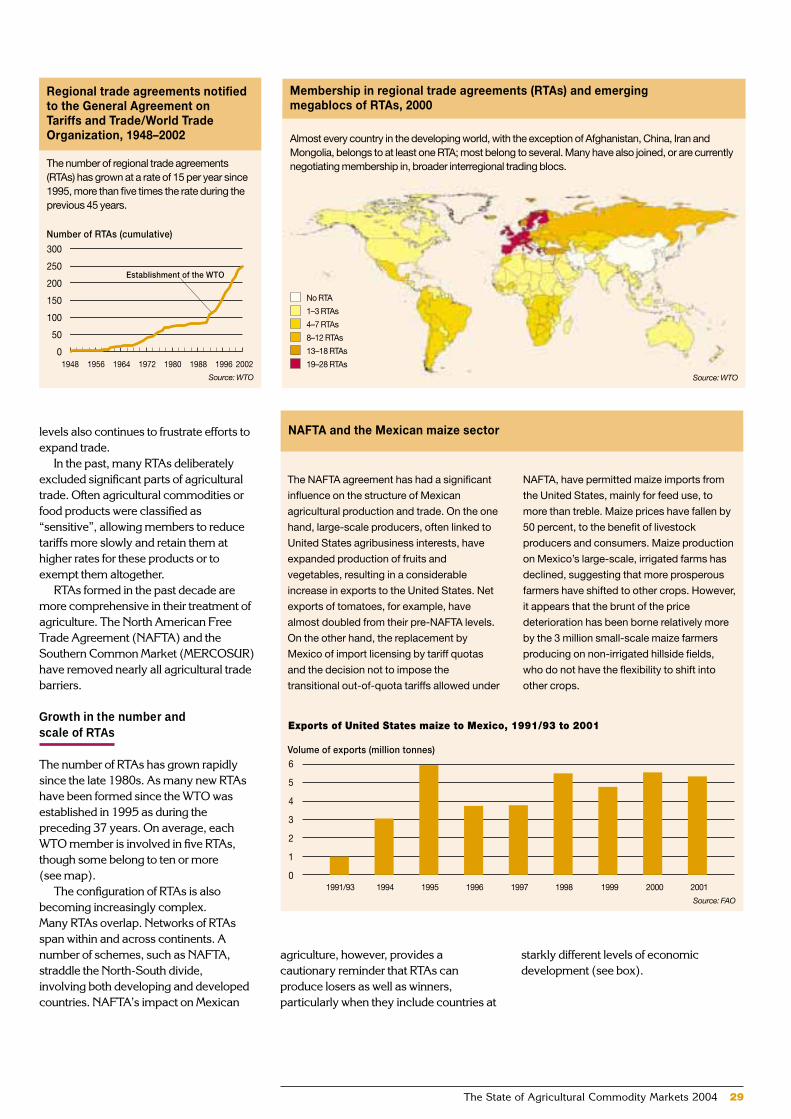
starkly different levels of economicdevelopment (see box).
levels also continues to frustrate efforts to expand trade.
In the past, many RTAs deliberatelyexcluded significant parts of agriculturaltrade. Often agricultural commodities orfood products were classified as“sensitive”, allowing members to reducetariffs more slowly and retain them athigher rates for these products or toexempt them altogether.
RTAs formed in the past decade aremore comprehensive in their treatment ofagriculture. The North American FreeTrade Agreement (NAFTA) and theSouthern Common Market (MERCOSUR)have removed nearly all agricultural tradebarriers.
Growth in the number and scale of RTAs
The number of RTAs has grown rapidlysince the late 1980s. As many new RTAshave been formed since the WTO wasestablished in 1995 as during thepreceding 37 years. On average, eachWTO member is involved in five RTAs,though some belong to ten or more (see map).
The configuration of RTAs is alsobecoming increasingly complex. Many RTAs overlap. Networks of RTAsspan within and across continents. Anumber of schemes, such as NAFTA,straddle the North-South divide, involving both developing and developedcountries. NAFTA’s impact on Mexican
agriculture, however, provides a cautionary reminder that RTAs canproduce losers as well as winners,particularly when they include countries at
The State of Agricultural Commodity Markets 2004 29
Regional trade agreements notifiedto the General Agreement on Tariffs and Trade/World TradeOrganization, 1948–2002
The number of regional trade agreements(RTAs) has grown at a rate of 15 per year since1995, more than five times the rate during theprevious 45 years.
Number of RTAs (cumulative)
Source: WTO
300
250
200
150
100
50
01948 1956 1964 1972 1980 1988 1996 2002
Establishment of the WTO
NAFTA and the Mexican maize sector
Exports of United States maize to Mexico, 1991/93 to 2001
6
5
4
3
2
1
0
Volume of exports (million tonnes)
The NAFTA agreement has had a significant
influence on the structure of Mexican
agricultural production and trade. On the one
hand, large-scale producers, often linked to
United States agribusiness interests, have
expanded production of fruits and
vegetables, resulting in a considerable
increase in exports to the United States. Net
exports of tomatoes, for example, have
almost doubled from their pre-NAFTA levels.
On the other hand, the replacement by
Mexico of import licensing by tariff quotas
and the decision not to impose the
transitional out-of-quota tariffs allowed under
NAFTA, have permitted maize imports from
the United States, mainly for feed use, to
more than treble. Maize prices have fallen by
50 percent, to the benefit of livestock
producers and consumers. Maize production
on Mexico’s large-scale, irrigated farms has
declined, suggesting that more prosperous
farmers have shifted to other crops. However,
it appears that the brunt of the price
deterioration has been borne relatively more
by the 3 million small-scale maize farmers
producing on non-irrigated hillside fields,
who do not have the flexibility to shift into
other crops.
Membership in regional trade agreements (RTAs) and emerging megablocs of RTAs, 2000
Almost every country in the developing world, with the exception of Afghanistan, China, Iran andMongolia, belongs to at least one RTA; most belong to several. Many have also joined, or are currentlynegotiating membership in, broader interregional trading blocs.
Source: WTO
No RTA
1–3 RTAs
4–7 RTAs
8–12 RTAs
13–18 RTAs
19–28 RTAs
1991/93 1994 1995 1996 1997 1998 1999 2000 2001
Source: FAO

Agricultural commodity chains,particularly those of high-valuecrops and processed products, are
increasingly dominated by transnationaltrading, processing and distributioncompanies. On its way from farmer toconsumer, for example, nearly 40 percentof the world’s coffee is traded by just fourcompanies and 45 percent is processed byjust three coffee-roasting firms.
Increasingly, these large companiesdominate world agricultural commoditymarkets and wield direct and increasinginfluence on what is produced, and how. Asthe UNCTAD World Investment Report2001 noted, this can bring significantadvantages as a result of economiclinkages established through sourcing fromdomestic producers, the development ofnew suppliers and the upgrading of existingones. Reliable quantities and consistentquality are key to the business operationsof the transnational companies and theyhave developed their relationships withsuppliers so as to ensure them. Thisincludes collaboration in productdevelopment, technology transfer andtraining, contract farming and financialassistance. For some producers andexporters, therefore, these changes are
opening up unprecedented opportunities.However, without assistance to improvetheir efficiency and competitiveness, manysmallholders and domestic traders willstruggle to meet the new marketrequirements.
The increasing dominance of largecompanies can be seen at three levels – the exporting developing countries, the international markets and the retailmarkets of importing countries.
Large companies dominate export trade in developing countries
In exporting developing countries,particularly following the elimination ofmany marketing boards, large companieswith warehousing and shipping facilitieshave been able to exploit their financial andlogistical advantages. Many now buyproduce directly from farmers, specifyingtheir requirements and prices. Intensifiedcompetition favours those farmers andtraders with access to cheaper finance andgood logistics. Larger enterprises haveadvantages in both respects.
In Kenya, for example, exports of fruits,vegetables and cut flowers have becomethe second biggest source of foreign
Market concentration and vertically integrated food chains
Cha
ngin
g pa
tter
ns o
fag
ricul
tura
l tra
de
The State of Agricultural Commodity Markets 2004 30
Concentration of market power in the global coffee chain
Four companies control almost 40 percent of global trade in coffee and only three roasters (Philip Morris, Nestlé and Sara Lee) control 45 percent of the global market.
Source: UK Food Group
4 international traders:Neumann, Volcafe,
ECOM, Dreyfus(39%)
25 millionfarmers and
workers
3 roasters:Philip Morris,
Nestlé, Sara Lee(45%)
500 millionconsumers
30 grocers:Wal-Mart, Carrefour, Ahold, Kroger, Metro Group,
Target, Tesco, Costco, Albertsons, Rewe, Aldi, JCPenney,Safeway (USA), ITM, Kmart, Walgreens, Ito-Yokado,
Edeka, Auchan, Sainsbury’s, Aeon, Tengelmann, CVS, Leclerc, Schwartz Group, Casino, Delhaize Group,
Daiei, Publix, Rite Aid(33%)

exchange. The industry earns US$300million per year and employs more than 70 000 people. However, as the scale ofexports has grown, the number of suppliersand the share produced by smallholdersand shipped by small- and medium-sizeddomestic exporters has shrunk.
Prior to the horticultural export boom in the 1990s, smallholders produced 70 percent of fruits and vegetablesexported from Kenya. By the end of the1990s, 40 percent of the produce wasgrown on farms owned or leased directly byimporters in the developed countries andanother 42 percent was produced on largecommercial farms. Smallholders’ share ofthis lucrative business had dwindled to just 18 percent. Among exporters, sevenlarge companies controlled more than 75 percent of the market.
Concentration in international trade
At the international level, a few verticallyintegrated companies have gainedincreasing control over agricultural trade. In cocoa, the number of trading houses inLondon shrank from 30 in 1980 to aroundten in 1999. Similarly, the six largestchocolate manufacturers account for 50 percent of world sales.
A handful of vertically integratedcompanies now dominate the production,distribution and international trade of bothoilseeds and oils. Just three globalcompanies control 80 percent of thesoybean crushing market in Europe andmore than 70 percent in the United States.
Grain trading, storage, processing andmilling is also dominated by a few bigcompanies. Three or four companiescontrol 60 percent of the terminal grain-handling facilities, 61 percent of the flourmilling, 81 percent of the maize exportsand 49 percent of the ethanol production inthe United States.
Supermarkets dominate retailing
At the retail level, supermarkets havegrown rapidly in both developed anddeveloping countries. In Latin America, forexample, supermarkets increased theirshare of food retailing from less than 20percent in 1990 to 60 percent in 2000.Worldwide, the top 30 supermarket chainsnow control almost one-third of grocerysales. At the national level, the five biggestretailers control between 30 and 96 percent
of food retailing in the EU and the UnitedStates.
Supermarkets’ domination of themarket gives them significant leverageover production, distribution and trade,including through direct involvement withdeveloping country suppliers. To simplifyoperations, most supermarkets prefer towork with a limited number of supplierswho have the resources to meet theirquality requirements and deliveryschedules.
As in the example of Kenyanhorticulture cited above, a few largecommercial producers typically benefitfrom this expanded trade. The majority ofsmallholders are left out.
The farmers’ share in final product prices
Much attention has been focused on theapparently small share of farmers and
The State of Agricultural Commodity Markets 2004 31
Share of final sales value accruingto different links in the coffee valuechain
Source: Africa Beverage Project
Share of retail value of bananasretained by each actor in the chain
Source: UK Food Group
Retailer 22%
Farm 10%
Ex-farmprocessing 21%
Export agent 8%Insurance/freight 2%
Globalbuyer 8%
Roaster 29%
Plantationworker 2% Plantation
owner 10%
Ripener/distributor 17%
Retailer 40%
Internationaltradingcompany 31%
producing countries in the revenueseventually derived from their exports.
Growers’ prices do typically represent asmall fraction of the retail price for finishedproducts, ranging from as low as 4 percentfor raw cotton to 28 percent for cocoa.
Even with bananas, which requirealmost no processing, international tradingcompanies, distributors and retailers claim88 percent of the retail price; less than 12percent goes to the producing countriesand barely 2 percent to the plantationworkers.
However, without knowing the coststructure of marketing and distribution, it isdifficult to judge what an “appropriate”farmers’ share might be. It is also inevitablethat a greater value-added content in thefinal product will reduce this share. Moreimportant is the absolute value of the returnto farmers. More detailed analyses ofcommodity value chains are needed toestablish whether margins are competitive.
Global expansion of the five largesttransnational food retailers,1980–2001
Between 1980 and 2001, each of the fivelargest global supermarket chains expandedthe number of countries where it operates by atleast 270 percent.
Number of countries operational
Source: UK Food Group
35302520151050
Carrefour Ahold Metro Wal-Mart Tesco(France) (Netherlands) (Germany) (USA) (UK)
1980
2001
Product concentration ratios inUnited States food manufacturing,2002
A handful of companies control more than 50 percent of most agricultural markets in thedeveloped countries.
Concentration ratio of four largest firms(percent)
* Three largest firms
Source: Hendrickson and Heffernan, 2002
100
80
60
40
20
0Beef Grain Corn Flour Soybean
packers terminals exports* milling crushing

Farmers and countries that depend oncommodity exports have to contendwith the long-term decline and short-
term volatility of real commodity prices oninternational markets. The long-termdecline in real prices reflects the tendencyfor productivity and production to grow at afaster rate than demand. Volatility reflectsthe impact of exogenous factors such asthe weather. These problems areexacerbated by market distortions, arisingfrom tariffs and subsidies in developedcountries, tariffs in developing countriesand the market power in some commoditysupply chains of large transnationalcorporations. These distortions also limitaccess to lucrative markets and hinderattempts to secure a greater share of thefinal product price on the part of producersand exporting countries.
Production gains outstrip demand
Average yields for the major agriculturalexport commodities increased by almostone-third over the past two decades. At thesame time, major new producers enteredthe market for several commodities –Viet Nam and coffee, for example.
While increased productivity and newproducers fuel rapid increases in supplies,demand for commodities rises slowly, evenin the face of falling prices and risingconsumer incomes. In the 1990s, trade inprimary commodities grew at less thanone-third of the rate for trade inmanufactured goods.
Volatility in international commodityprices can blur longer-term price trendsthat should lead to adjustments in supplyand demand. Furthermore, on the supplyside, farmers cannot scale production up ordown quickly when prices change,especially where perennial crops areconcerned. Production, therefore, can bemaintained even in the face of fallingprices, exacerbating problems of marketimbalance. On the demand side, lowerprices generally do not stimulate
consumers in developed countries toincrease their purchases of foods and othercommodity-based products significantly.Many commodity-based products areviewed as necessities that must bepurchased regardless of variations in theprice. In any case, changes in commodityprices can be barely perceivable at retail,as the price of basic commodities typicallyrepresents a small fraction of the final retailprice for processed goods. In developingcountries, where the degree of processingmay be smaller, demand for the basicproduct can increase more quickly inresponse to lower world prices. In many ofthese countries, however, a variety ofpolicy interventions may imply thatdomestic prices do not reflect world pricetrends.
Coping with problems of oversupply
In the 1970s and 1980s, governmentsattempted to address commodity priceproblems through international commodityagreements (ICAs) to stabilize prices. TheICAs relied on export quota agreements orstock management, but are generallyregarded to have failed in their mission ofmaintaining stable, remunerative prices.By the end of the 1980s most haddisbanded or had shifted their focus toexchanging information and improvingmarket transparency.
The collapse of commodity prices in thelate 1990s revived interest in controllingsupplies through “producer-onlyagreements”. In the case of coffee, forexample, producing countries forged analliance that attempted to hold backexports and push up prices. Maintainingdiscipline among members proved difficult,however, particularly when faced withaggressive competition from non-member“free riders”.
The difficulties of sustaining cooperativemarket interventions have stimulatedinterest in price insurance, forward-pricingsystems and other schemes to manage the
Challenges and policy responsesC
oncl
usio
ns
The State of Agricultural Commodity Markets 2004 32

risks of commodity price volatility. Whilepromising, the institutional arrangementsfor their widespread application remain tobe established.
In the long run, oversupply of somecommodities can best be eliminated byreducing production in highly protectedand high-cost markets whilesimultaneously improving demand throughpoverty alleviation and income growth inpoorer countries. In developed countriesthis implies taking land and labour out ofproduction of oversubsidized commoditiesand enabling producers to shift to othersources of employment and income. Inmarkets free of tariffs, subsidies and otherdistortions, the first producers to exit shouldbe those with the highest production costs.In some cases, such as cotton, sugar, dairyand rice, these may be farmers in the EU orthe United States who have benefited fromample subsidies, rather than farmers inLDCs who strive to produce high-qualityproducts at lower cost. However, theelimination of OECD farm support will notautomatically lead to increased exportsfrom LDCs. The main immediatebeneficiaries are likely to be non-subsidizing developed country exportersand some of the more advanceddeveloping countries.
Diversification can provide producers indeveloping countries with a way to escapefrom dependence on commodities forwhich supplies have outgrown demand.However, this can happen only if farmershave a wide range of alternative options,including higher-value crops, processing ofbasic commodities into value-added forms,and non-agricultural activities.Furthermore, diversification requiresaccess to the credit, training and otherresources they would need to takeadvantage of these opportunities.
Several developing countries havebecome successful exporters of fruits,vegetables and other non-traditionalproducts. For the most part, however, it hasbeen large-scale commercial farmers incountries with more developed
infrastructures who have benefited. Smallproducers and the LDCs have been less able to mobilize the investment andtraining required to shift to new crops andmeet the high quality standards and strictdelivery deadlines of supermarkets.Building the institutional structures that will help smallholders to participate inthese developments is a challenge thatremains.
Processing basic commodities intovalue-added forms is another way in whichproducers can diversify and increase theirshare of the final product value. Thedifference in value between the basiccommodity and the consumer product can be large. However, opportunities forsuch vertical diversification are oftenblocked by tariff escalation, particularly indeveloped countries, and by barriers toentry arising from concentrated marketstructures.
Demand-side solutions for oversupply problems
Problems of oversupply can also beaddressed from the other side of themarket, with measures aimed at boostingdemand in consuming countries.
Generic promotion campaigns haveproven effective in stimulating demand forsome commodities. Unlike advertising forspecific products and brands, genericpromotion aims to increase aggregatedemand for a commodity such as bananasor tea. A long-running campaignpromoting bananas as a source of energycontributed to a threefold increase inconsumption in the United Kingdom,making them the most popular fresh fruit in the country.
Similar generic promotion campaignscould boost consumer demand for othercommodities. Without careful analysis andplanning, however, processors and retailers may reap most of the benefits,leaving little or nothing for farmers indeveloping countries. Finding aninstitutional manager for such programmes
and a means of financing them thatminimizes free-rider problems can also bea challenge.
Consumer concerns about food safety,environmental issues and social justicehave created another niche of opportunity.Farmers selling certified organic and “FairTrade” products tend to enjoy bettermarket access and higher prices thanconventional farmers. While the marketshare of certified foods remains small, salesof these products have been growingsteadily and rapidly. Certification can alsobring further benefits to farmers inenhancing their bargaining position andaccess to credit.
Despite these benefits, small-scalefarmers in developing countries face manyobstacles when trying to take advantage ofsocial and environmental certification.Conversion to organic farming requiresinvestment and training. At least initially, itmay also raise production costs and reduceyields.
While farmers may be able to recouptheir investment by selling to premiummarkets, the certification process itself canbe costly, especially for small farmers indeveloping countries that lack localcertification bodies and must rely onforeign agencies. Extensive requirementsfor record-keeping and traceability mayalso pose serious problems for small-scaleproducers. As a result, some certificationprogrammes tend to favour largecommercial farms. The Fair Trade system,which was established specifically to helpsmall producers in developing countries,currently reaches a very limited market indeveloped countries.
Eliminatingmarket distortions
Problems of oversupply on worldcommodity markets have beenexacerbated by government policies andmarket concentration. High agriculturaltariffs and producer subsidies in developedcountries limit market access and depress
The State of Agricultural Commodity Markets 2004 33

Con
clus
ions
The State of Agricultural Commodity Markets 2004 34
commodity prices. Developing countrymarkets for agricultural products are thefastest-growing but are also generallyheavily protected.
In many cases, domestic supportinsulates farmers in developed countriesfrom market forces, encouraging them toexpand production even when prices arelow and allowing them to export at pricessubstantially below their costs ofproduction. The United States and the EUrank as the world’s largest exporters ofcotton, wheat, maize, skim milk powderand sugar. These commodities areexported at prices below those that wouldprevail under undistorted markets, and insome cases at prices below productioncosts.
With world market prices defined atthese artificially low levels, farmers indeveloping countries suffer from lostmarket share and unfair competition inlocal markets. Subsidies also distort thecost structures in several producingcountries and give less-efficient producersan incentive to expand production. Theburden of oversupply is transferred tofarmers in developing countries, eventhough they are able to produce at lowercosts. At the same time, liberalization couldhave a negative impact on food-importingdeveloping countries, as the removal oftariffs and subsidies would lead to higherfood prices and import bills.
Control of commodity value chains by asmall number of powerful corporations canalso drive down commodity prices anderode the share of the final product pricethat goes to producers. When marketsbring together large numbers of competingsuppliers against a handful of large-scalebuyers, the buyers are likely to have mostleverage in setting prices. When the buyersare also linked to processors and retailersin vertically integrated commodity chains,they are in a strong position to capture agreater share of the value of the finalproduct for traders, processors andretailers. On the other hand, it must beacknowledged that given, the substantial
economies of scale present in mostsegments of the food industry, linksbetween large transnational companiesand small producers may offer a way out ofmarginalization for poor rural producers inLDCs.
Studies have shown that whencommodity prices rise, the higher price isquickly passed along to consumers. Butwhen commodity prices fall, retail pricesrarely follow suit. Since the early 1990s, forexample, even as coffee prices haveplummeted, the value of global retail salesof coffee has more than doubled. The shareof those sales received by coffee-exportingcountries fell from around 35 percent toless than 10 percent.
An agenda for action
Addressing problems of oversupply andeliminating market distortions will require avariety of actions at the national andinternational levels.
In the context of the WTO negotiations,priority must be given to reducingagricultural tariffs, producer support andexport subsidies in developed countriesand to eliminating tariff escalation thatpenalizes exports of processed goods fromdeveloping countries. At the same time,developing countries should reduce tariffsin order to encourage trade amongdeveloping countries and to allow theirconsumers to benefit from lower worldprices. Special attention must be given tothe LDCs, many of which depend heavilyon commodity exports and food imports.Measures that could be taken to helpdeveloping countries take advantage ofcommodity markets include: ■ building capacity to take advantage of
trading opportunities and to participateeffectively in trade negotiations;
■ addressing the erosion of tradepreferences for low-income economiesand the possible case for compensatingthem for any loss of these preferences inthe context of ongoing tradeliberalization;

■ mobilizing resources to support genericpromotion campaigns, diversificationinto non-traditional agricultural exportsand adding value by exportingprocessed goods;
■ designing programmes at national andinternational levels to help farmersinsure against shocks that coulddamage their crops or undermine priceson international markets. Weatherinsurance, forward-pricing systems andmarket-based price insurance are someof the schemes that have been proposedto deal with the inherent volatility ofagricultural commodity markets;
■ improving the flow of information toproducers and traders aboutopportunities for contractualarrangements with supermarkets andthe technical requirements for organicagriculture and Fair Trade certification;
■ designing international programmes toincrease the flow of resources toagriculture and rural development,increasing the competitiveness ofagriculture and developing non-agricultural sectors that will providealternative sources of employment andincome;
■ supporting cooperatives and otheractions by producers to organizecommercially in order to increase theirleverage in markets dominated bypowerful transnational corporations;
■ ensuring that farmers have access to theinformation, training, credit and otherresources they need to diversify intohigher-value crops, processing or otherincome-generating activities;
■ increasing investments to improve theproductivity of domestic foodproduction in developing countries andmake it more competitive with foodimports.
The State of Agricultural Commodity Markets 2004 35

The State of Agricultural Commodity Markets 2004 is based mainly on data and analysisprovided by FAO’s Commodities and Trade Division (ESC), and on statistical informationprovided by FAOSTAT. Specific references cited for sections of this issue included thefollowing:
Pages 12–13
Prebisch, R. 1950. The economic development of Latin America and its principalproblems. New York, USA, United Nations.
Singer, H. 1950. The distribution of gains between investing and borrowing countries.American Economic Review, 40: 473–485.
Martin, W. & Mitra, D. 1999. Productivity growth and convergence in agriculture andmanufacturing. World Bank Working Paper No. 2171. Washington, DC, WorldBank.
World Bank. 2000. Can Africa claim the 21st century? New York, USA, OxfordUniversity Press.
UNCTAD. 2003. Economic development in Africa: trade performance and commoditydependence. New York and Geneva, United Nations.
Pages 14–15
FAO. 2003. World agriculture: towards 2015/2030 – an FAO perspective, edited by J. Bruinsma. London, FAO and Earthscan.
Pages 16–17
Gürkan, A.A, Balcombe, K. & Prakash, A. Food import bills: experiences, factorsunderpinning changes and policy implications for food security of least developedand net food-importing developing countries. In FAO. Commodity Market Review2003–2004, pp. 19–38. Rome.
Pages 20–21
FAO. 2003 . World agriculture: towards 2015/2030 – an FAO perspective, edited by J. Bruinsma. London, FAO and Earthscan.
IMF & World Bank. 2002. Initiative for heavily indebted poor countries – status ofimplementation. Washington, DC.
UNCTAD. 2003. Economic development in Africa: trade performance and commoditydependence. New York and Geneva, United Nations.
Oxfam International. 2002. Rigged rules and double standards: trade, globalisation, andthe fight against poverty, by K. Watkins and P. Fowler. Oxford, UK.
Pages 22–25
World Bank. 2003. Global economic prospects 2004: realizing the development prospectsof the Doha Agenda. Washington, DC.
Oxfam International. 2002. Cultivating poverty: the impact of US cotton subsidies onAfrica. Oxfam Briefing Paper No. 30. Oxford, UK.
Ref
eren
ces
The State of Agricultural Commodity Markets 2004 36

OECD. 2003. Agricultural Policies in OECD Countries: Monitoring and Evaluation 2003.Paris.
Oxfam International. 2002. Rigged rules and double standards: trade, globalisation, andthe fight against poverty, by K. Watkins and P. Fowler. Oxford, UK.
Poonyth, D. & Sharma, R. 2003. The impact of the Doha Development Round of tradenegotiations on developing countries: a review and applications. In FAO.Commodity Market Review 2003–2004, pp. 77–99. Rome.
Elamin, N. & Khaira, H. 2003. Tariff escalation in agricultural commodity markets. InFAO. Commodity Market Review 2003–2004, pp. 101–120. Rome.
Poonyth, D., Sarris, A., Sharma, R. & Shui, S. 2003. The impact of domestic and tradepolicies on the world cotton market. FAO Commodity and Trade Policy ResearchWorking Paper No. 8. Rome.
Pages 26–27
Kaplinsky, R. and Fitter, R. 2001. Who gains from product rents as the coffee marketbecomes more differentiated? A value chain analysis. Brighton, UK, Institute ofDevelopment Studies, University of Sussex.
Pages 28–29
Audley, J., Papademetriou, D., Polaski, S. & Vaughan, S. 2003. NAFTA’s promise andreality: lessons from Mexico for the hemisphere. New York, USA, CarnegieEndowment for International Peace.
WTO. 2000. Mapping of regional trade agreements. WT/REG/W41. Geneva.
Pages 30–31
UNCTAD. World Investment Report 2001: Promoting Linkages. Geneva, United Nations.Vorley, B. 2003. Food, Inc.: corporate concentration from farm to consumer. London, UK
Food Group. Hendrickson, M. & Heffernan, W. 2002. Concentration of agricultural markets. Columbia,
MO, USA, Department of Rural Sociology, University of Missouri.Reardon, T.C., Timmer, P., Barrett, C. & Berdegue, J. 2003. The rise of supermarkets in
Africa, Asia and Latin America. American Journal of Agricultural Economics,85(5): 1140–1146.
The State of Agricultural Commodity Markets 2004 37
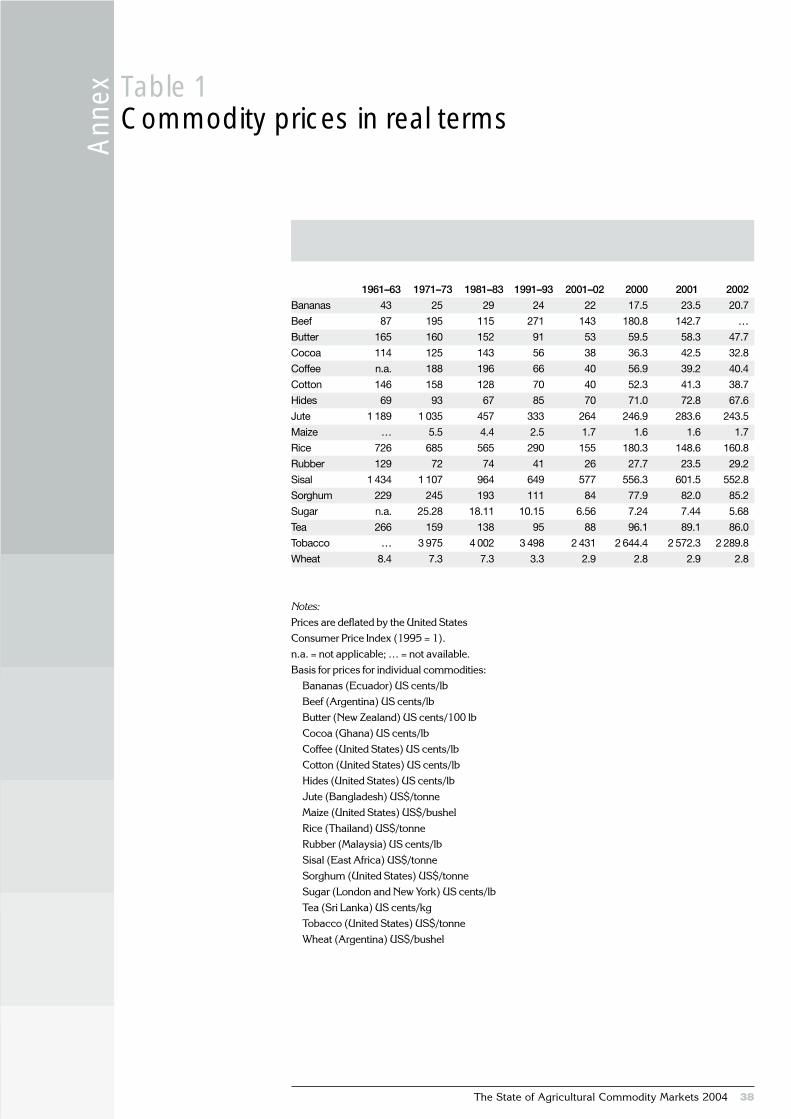
Notes:
Prices are deflated by the United StatesConsumer Price Index (1995 = 1).n.a. = not applicable; … = not available.Basis for prices for individual commodities:
Bananas (Ecuador) US cents/lbBeef (Argentina) US cents/lbButter (New Zealand) US cents/100 lbCocoa (Ghana) US cents/lbCoffee (United States) US cents/lbCotton (United States) US cents/lbHides (United States) US cents/lbJute (Bangladesh) US$/tonneMaize (United States) US$/bushelRice (Thailand) US$/tonneRubber (Malaysia) US cents/lbSisal (East Africa) US$/tonneSorghum (United States) US$/tonneSugar (London and New York) US cents/lbTea (Sri Lanka) US cents/kgTobacco (United States) US$/tonneWheat (Argentina) US$/bushel
Table 1Commodity prices in real terms
Ann
ex
The State of Agricultural Commodity Markets 2004 38
1961–63 1971–73 1981–83 1991–93 2001–02 2000 2001 2002
Bananas 43 25 29 24 22 17.5 23.5 20.7
Beef 87 195 115 271 143 180.8 142.7 …
Butter 165 160 152 91 53 59.5 58.3 47.7
Cocoa 114 125 143 56 38 36.3 42.5 32.8
Coffee n.a. 188 196 66 40 56.9 39.2 40.4
Cotton 146 158 128 70 40 52.3 41.3 38.7
Hides 69 93 67 85 70 71.0 72.8 67.6
Jute 1 189 1 035 457 333 264 246.9 283.6 243.5
Maize … 5.5 4.4 2.5 1.7 1.6 1.6 1.7
Rice 726 685 565 290 155 180.3 148.6 160.8
Rubber 129 72 74 41 26 27.7 23.5 29.2
Sisal 1 434 1 107 964 649 577 556.3 601.5 552.8
Sorghum 229 245 193 111 84 77.9 82.0 85.2
Sugar n.a. 25.28 18.11 10.15 6.56 7.24 7.44 5.68
Tea 266 159 138 95 88 96.1 89.1 86.0
Tobacco … 3 975 4 002 3 498 2 431 2 644.4 2 572.3 2 289.8
Wheat 8.4 7.3 7.3 3.3 2.9 2.8 2.9 2.8

The State of Agricultural Commodity Markets 2004 39
Table 2Production of selected commodities
by ten largest producers
2001 2002 2003 Share of world total 2001–2003
(thousand tonnes) (percentage)
Cereals
China, Mainland 396 482 397 988 377 045 19
United States 325 480 298 787 348 645 16
India 243 375 211 750 236 313 11
European Union (15) 202 526 214 972 191 082 10
Brazil 56 478 50 237 65 426 3
Russian Federation 83 320 84 849 65 397 4
Indonesia 59 808 61 106 62 670 3
Canada 43 329 36 288 50 129 2
Bangladesh 38 014 39 528 39 683 2
Viet Nam 34 270 36 958 37 546 2
World 2 107 954 2 031 540 2 067 618 100
Oilcrops
United States 16 979 15 749 14 307 14
China, Mainland 15 129 15 390 15 920 13
Malaysia 13 483 13 546 14 956 12
Indonesia 11 287 13 225 13 085 11
Brazil 7 688 8 476 10 207 8
European Union (15) 7 764 7 323 7 691 7
India 7 651 7 055 7 974 7
Argentina 6 405 7 130 7 970 6
Canada 2 532 2 366 3 351 2
Nigeria 2 352 2 359 2 359 2
World 112 088 114 545 120 894 100
Meat
China, Mainland 63 339 65 870 67 857 27
United States 37 811 39 195 39 106 16
European Union (15) 36 010 36 433 36 184 15
Brazil 15 167 16 605 17 059 7
India 5 566 5 762 6 038 2
Mexico 4 636 4 808 4 883 2
Russian Federation 4 430 4 690 4 975 2
Canada 4 121 4 268 4 277 2
Argentina 3 810 4 058 4 163 2
Australia 3 885 3 801 3 847 2
World 237 845 246 257 249 851 100
Continued
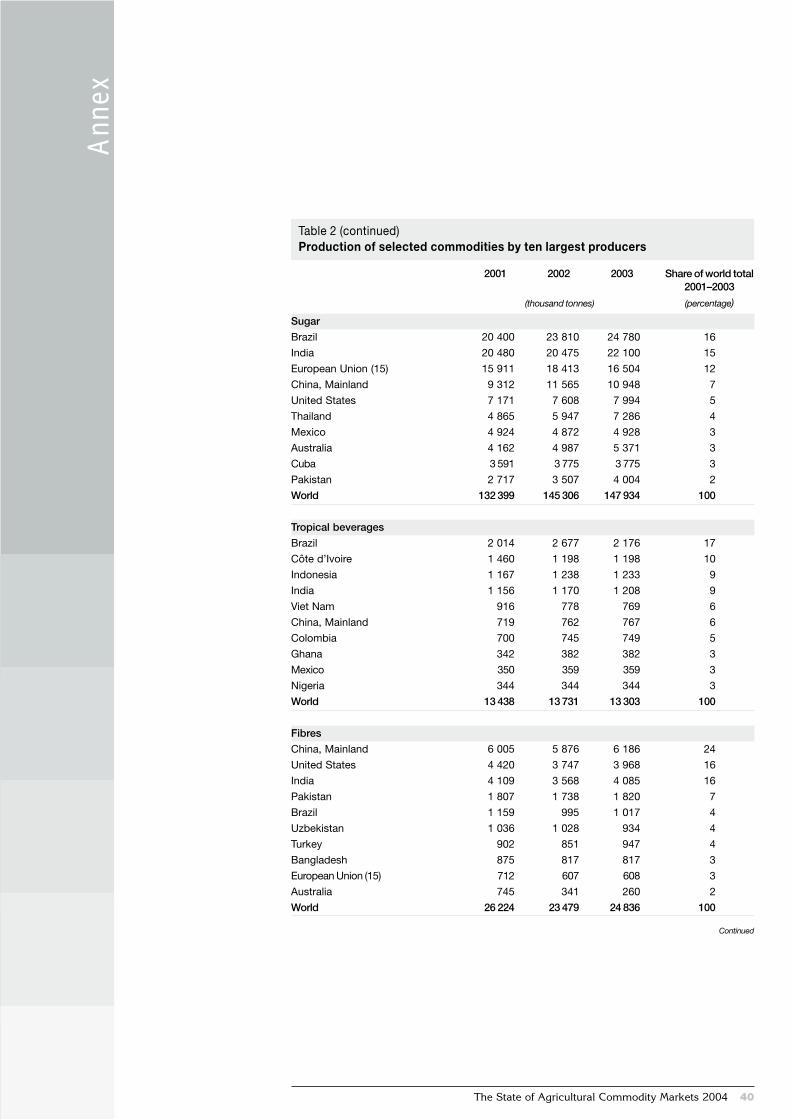
2001 2002 2003 Share of world total 2001–2003
(thousand tonnes) (percentage)
Sugar
Brazil 20 400 23 810 24 780 16
India 20 480 20 475 22 100 15
European Union (15) 15 911 18 413 16 504 12
China, Mainland 9 312 11 565 10 948 7
United States 7 171 7 608 7 994 5
Thailand 4 865 5 947 7 286 4
Mexico 4 924 4 872 4 928 3
Australia 4 162 4 987 5 371 3
Cuba 3 591 3 775 3 775 3
Pakistan 2 717 3 507 4 004 2
World 132 399 145 306 147 934 100
Tropical beverages
Brazil 2 014 2 677 2 176 17
Côte d’Ivoire 1 460 1 198 1 198 10
Indonesia 1 167 1 238 1 233 9
India 1 156 1 170 1 208 9
Viet Nam 916 778 769 6
China, Mainland 719 762 767 6
Colombia 700 745 749 5
Ghana 342 382 382 3
Mexico 350 359 359 3
Nigeria 344 344 344 3
World 13 438 13 731 13 303 100
Fibres
China, Mainland 6 005 5 876 6 186 24
United States 4 420 3 747 3 968 16
India 4 109 3 568 4 085 16
Pakistan 1 807 1 738 1 820 7
Brazil 1 159 995 1 017 4
Uzbekistan 1 036 1 028 934 4
Turkey 902 851 947 4
Bangladesh 875 817 817 3
European Union (15) 712 607 608 3
Australia 745 341 260 2
World 26 224 23 479 24 836 100
Ann
ex
The State of Agricultural Commodity Markets 2004 40
Table 2 (continued)Production of selected commodities by ten largest producers
Continued
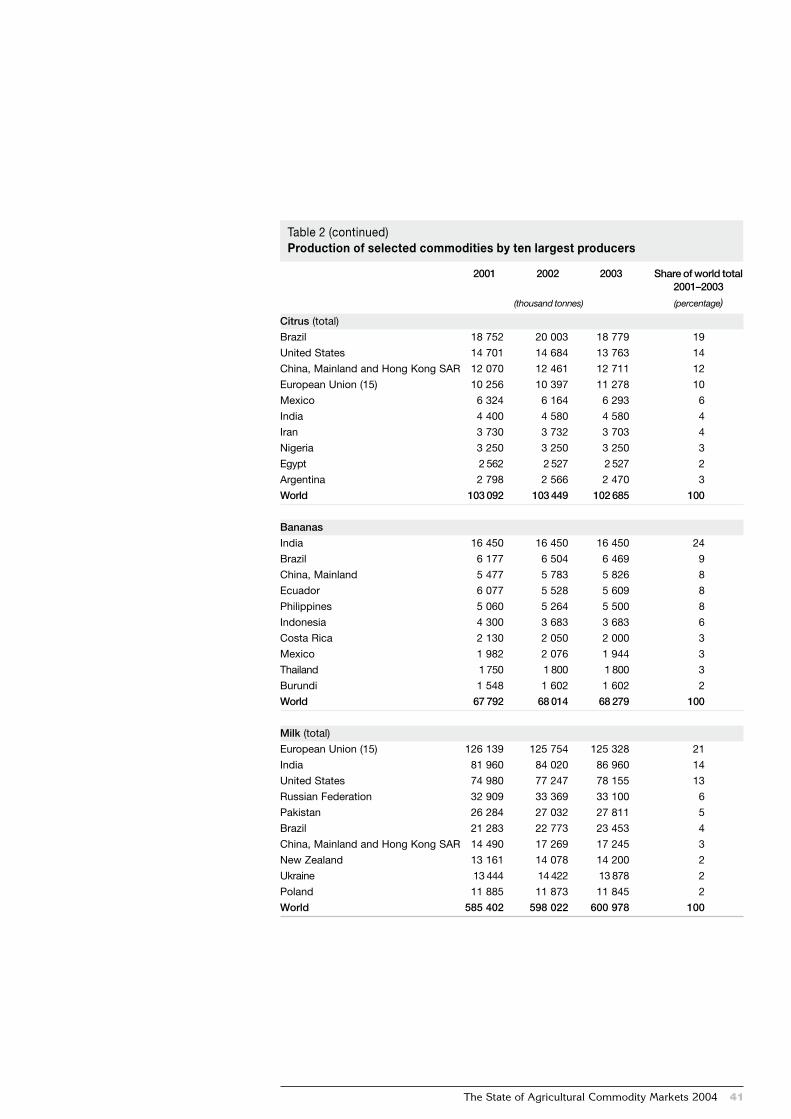
2001 2002 2003 Share of world total 2001–2003
(thousand tonnes) (percentage)
Citrus (total)
Brazil 18 752 20 003 18 779 19
United States 14 701 14 684 13 763 14
China, Mainland and Hong Kong SAR 12 070 12 461 12 711 12
European Union (15) 10 256 10 397 11 278 10
Mexico 6 324 6 164 6 293 6
India 4 400 4 580 4 580 4
Iran 3 730 3 732 3 703 4
Nigeria 3 250 3 250 3 250 3
Egypt 2 562 2 527 2 527 2
Argentina 2 798 2 566 2 470 3
World 103 092 103 449 102 685 100
Bananas
India 16 450 16 450 16 450 24
Brazil 6 177 6 504 6 469 9
China, Mainland 5 477 5 783 5 826 8
Ecuador 6 077 5 528 5 609 8
Philippines 5 060 5 264 5 500 8
Indonesia 4 300 3 683 3 683 6
Costa Rica 2 130 2 050 2 000 3
Mexico 1 982 2 076 1 944 3
Thailand 1 750 1 800 1 800 3
Burundi 1 548 1 602 1 602 2
World 67 792 68 014 68 279 100
Milk (total)
European Union (15) 126 139 125 754 125 328 21
India 81 960 84 020 86 960 14
United States 74 980 77 247 78 155 13
Russian Federation 32 909 33 369 33 100 6
Pakistan 26 284 27 032 27 811 5
Brazil 21 283 22 773 23 453 4
China, Mainland and Hong Kong SAR 14 490 17 269 17 245 3
New Zealand 13 161 14 078 14 200 2
Ukraine 13 444 14 422 13 878 2
Poland 11 885 11 873 11 845 2
World 585 402 598 022 600 978 100
The State of Agricultural Commodity Markets 2004 41
Table 2 (continued)Production of selected commodities by ten largest producers

Table 3Exports of selected commodities by ten largest exportersA
nnex
The State of Agricultural Commodity Markets 2004 42
2001 2002 2003 Share of world total 2001–2003
(thousand tonnes) (percentage)
Cereals
United States 87 358 84 227 82 204 31
European Union (15) 65 426 55 159 54 772 22
Argentina 23 728 23 309 19 584 8
Australia 21 826 18 894 19 344 7
Canada 22 885 21 523 14 666 7
China, Mainland 13 831 8 837 14 916 5
Thailand 6 207 8 227 7 538 3
Ukraine 1 286 5 311 12 175 2
Russian Federation 1 263 3 425 13 532 2
India 2 822 5 432 9 570 2
World 272 858 262 871 279 557 100
Oilseeds
United States 28 358 30 205 29 005 41
Brazil 11 519 15 684 15 978 20
Argentina 4 662 7 640 6 634 9
European Union (15) 5 662 5 437 6 096 8
Canada 5 482 5 490 3 864 7
Australia 2 304 2 114 1 863 3
Paraguay 1 820 2 361 404 2
China, Mainland 804 940 1 020 1
Russian Federation 1 285 302 121 1
Hungary 510 331 466 1
World 67 909 75 149 69 016 100
Meat
European Union (15) 10 026 9 585 10 297 40
United States 4 694 4 851 4 433 19
Brazil 1 550 2 310 3 022 9
Australia 1 599 1 676 1 642 7
Canada 1 187 1 315 1 480 5
China, Mainland 779 900 917 3
New Zealand 857 816 802 3
China, Hong Kong SAR 862 746 662 3
Thailand 403 524 565 2
Argentina 358 192 370 1
World 24 357 24 801 26 245 100
Continued

The State of Agricultural Commodity Markets 2004 43
2001 2002 2003 Share of world total 2001–2003
(thousand tonnes) (percentage)
Sugar
Brazil 6 692 11 528 13 852 26
European Union (15) 8 858 8 467 7 444 20
Thailand 4 241 3 335 4 205 10
Cuba 3 237 2 382 2 663 7
Australia 4 172 3 551 129 6
South Africa 1 474 1 538 1 165 3
Guatemala 1 260 1 130 1 360 3
India 349 1 541 1 790 3
Colombia 1 065 928 1 183 3
Turkey 609 933 118 1
World 39 892 42 108 41 920 100
Tropical beverages
Côte d’Ivoire 1 422 1 249 1 149 14
Brazil 973 1 260 1 559 14
Viet Nam 790 999 793 9
Indonesia 777 652 789 8
European Union (15) 567 547 556 6
Colombia 509 561 581 6
India 363 329 346 4
Ghana 366 221 312 3
Sri Lanka 287 294 291 3
China, Mainland 231 261 264 3
World 9 472 9 144 9 304 100
Fibres
United States 1 754 2 145 2 480 27
Australia 1 333 1 499 1 118 17
Uzbekistan 740 760 740 9
European Union (15) 754 690 754 9
Bangladesh 335 236 302 4
Syrian Arab Republic 230 244 280 3
Benin 244 152 183 2
China, Mainland 300 59 159 2
Turkmenistan 249 151 109 2
Côte d’Ivoire 205 131 147 2
World 7 936 7 712 7 983 100
Table 3 (continued)Exports of selected commodities by ten largest exporters
Continued
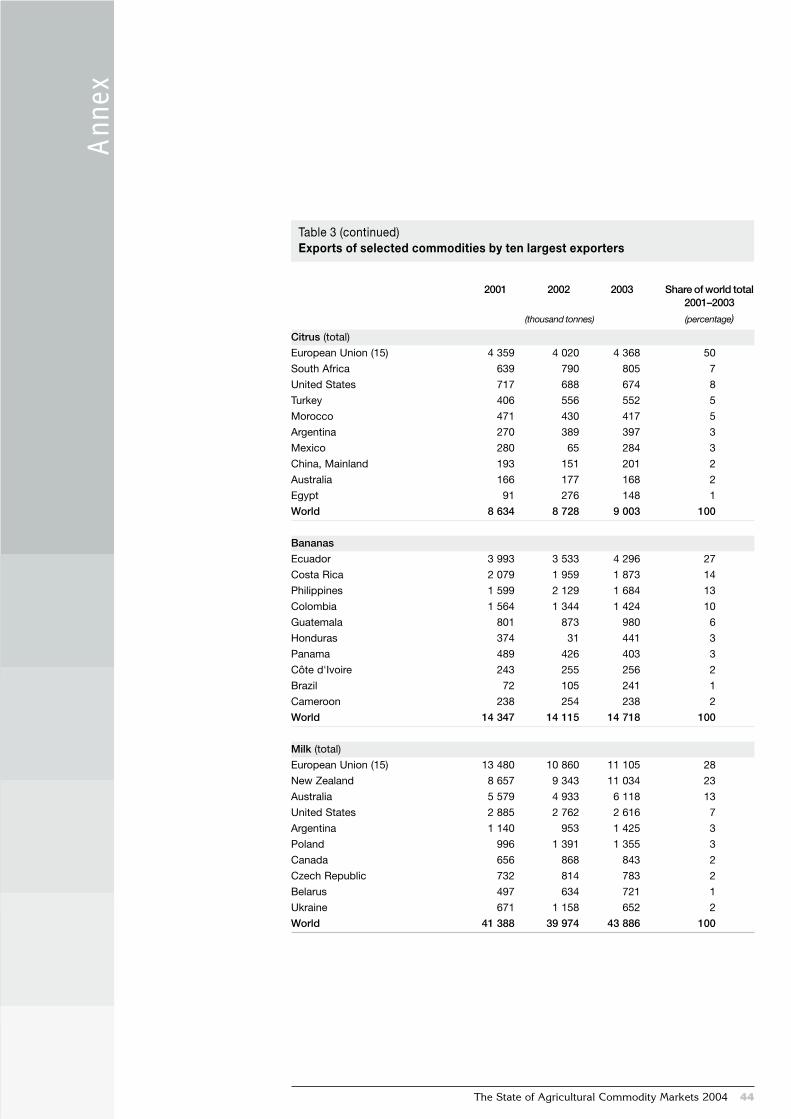
Ann
ex
The State of Agricultural Commodity Markets 2004 44
2001 2002 2003 Share of world total 2001–2003
(thousand tonnes) (percentage)
Citrus (total)
European Union (15) 4 359 4 020 4 368 50
South Africa 639 790 805 7
United States 717 688 674 8
Turkey 406 556 552 5
Morocco 471 430 417 5
Argentina 270 389 397 3
Mexico 280 65 284 3
China, Mainland 193 151 201 2
Australia 166 177 168 2
Egypt 91 276 148 1
World 8 634 8 728 9 003 100
Bananas
Ecuador 3 993 3 533 4 296 27
Costa Rica 2 079 1 959 1 873 14
Philippines 1 599 2 129 1 684 13
Colombia 1 564 1 344 1 424 10
Guatemala 801 873 980 6
Honduras 374 31 441 3
Panama 489 426 403 3
Côte d'Ivoire 243 255 256 2
Brazil 72 105 241 1
Cameroon 238 254 238 2
World 14 347 14 115 14 718 100
Milk (total)
European Union (15) 13 480 10 860 11 105 28
New Zealand 8 657 9 343 11 034 23
Australia 5 579 4 933 6 118 13
United States 2 885 2 762 2 616 7
Argentina 1 140 953 1 425 3
Poland 996 1 391 1 355 3
Canada 656 868 843 2
Czech Republic 732 814 783 2
Belarus 497 634 721 1
Ukraine 671 1 158 652 2
World 41 388 39 974 43 886 100
Table 3 (continued)Exports of selected commodities by ten largest exporters

The State of Agricultural Commodity Markets 2004 45
Table 4Imports of selected commodities
by ten largest importers
2001 2002 2003 Share of world total 2001–2003
(thousand tonnes) (percentage)
Cereals
European Union (15) 40 491 44 701 53 619 17
Japan 27 012 26 239 26 605 10
Mexico 14 065 15 303 14 092 5
Korea, Republic of 12 801 12 385 13 389 5
Egypt 9 655 9 244 10 322 4
Brazil 10 478 8 857 7 809 3
Iran, Islamic Rep. of 9 928 9 852 6 551 3
Algeria 7 509 6 682 8 611 3
Indonesia 6 863 4 776 7 927 2
China, Taiwan Province of 6 324 6 500 6 576 2
World 269 920 260 660 276 894 100
Oilseeds
European Union (15) 23 855 28 049 27 021 36
China, Mainland 13 405 15 708 11 954 19
Japan 7 548 7 458 7 550 10
Mexico 5 413 5 865 5 708 8
China, Taiwan Province of 2 351 2 487 2 586 3
Korea, Republic of 1 695 1 574 1 717 2
Thailand 1 357 1 409 1 574 2
Indonesia 1 436 1 273 1 507 2
Canada 691 1 133 1 172 1
Brazil 825 857 1 057 1
World 68 974 75 608 72 506 100
Meat
European Union (15) 8 327 8 361 8 683 35
Japan 2 696 2 707 2 583 11
Russian Federation 1 280 2 342 2 669 9
United States 1 832 1 883 1 967 8
China, Hong Kong SAR 1 400 1 290 1 177 5
Mexico 1 081 1 150 1 233 5
China, Mainland 1 043 854 800 4
Korea, Republic of 536 438 638 2
Canada 482 545 570 2
Saudi Arabia 419 407 447 2
World 23 449 24 099 25 447 100
Continued

Ann
ex
The State of Agricultural Commodity Markets 2004 46
2001 2002 2003 Share of world total 2001–2003
(thousand tonnes) (percentage)
Sugar
Russian Federation 4 842 5 566 4 619 13
European Union (15) 3 902 4 728 4 780 12
Japan 1 566 1 534 1 478 4
Korea, Republic of 1 463 1 516 1 527 4
United States 1 413 1 344 1 419 4
Indonesia 1 654 1 376 1 029 4
Malaysia 1 187 1 275 1 482 3
United Arab Emirates 971 1 127 1 356 3
Nigeria 775 1 267 1 304 3
Canada 873 1 183 1 189 3
World 36 097 39 972 39 292 100
Tropical beverages
European Union (15) 3 992 4 093 4 063 45
United States 1 857 1 688 1 580 19
Japan 490 491 502 6
Russian Federation 247 237 258 3
Canada 200 212 184 2
Malaysia 132 174 204 2
Poland 171 180 157 2
Algeria 114 96 121 1
Pakistan 111 107 99 1
Switzerland 94 99 98 1
World 9 002 8 962 8 906 100
Fibres
European Union (15) 1 319 1 250 1 233 16
Mexico 707 734 750 9
Indonesia 563 763 630 8
Turkey 749 489 599 8
Korea, Republic of 419 454 470 6
Thailand 423 434 433 6
Japan 453 408 393 5
India 280 466 377 5
United States 357 335 279 4
China, Taiwan Province of 278 265 346 4
World 7 955 7 785 7 538 100
Table 4 (continued)Imports of selected commodities by ten largest importers
Continued

The State of Agricultural Commodity Markets 2004 47
2001 2002 2003 Share of world total 2001–2003
(thousand tonnes) (percentage)
Citrus (total)
European Union (15) 4 157 4 179 4 334 49
United States 351 309 391 4
Russian Federation 458 539 668 6
Poland 364 366 355 4
Japan 238 222 204 3
Saudi Arabia 312 273 348 4
Canada 344 327 352 4
China, Hong Kong SAR 259 247 256 3
Ukraine 76 99 119 1
Romania 77 82 86 1
World 8 507 8 498 9 062 100
Bananas
United States 4 030 3 840 3 906 28
European Union (15) 3 298 3 203 3 287 23
Japan 1 078 990 936 7
Russian Federation 502 612 649 4
Canada 398 405 417 3
China, Mainland 593 413 347 3
Poland 285 270 240 2
Argentina 339 330 229 2
United Arab Emirates 98 126 214 1
Sweden 186 182 205 1
World 14 436 13 640 13 920 100
Milk (total)
European Union (15) 3 062 2 833 2 712 8
China, Mainland 2 245 2 063 2 626 6
Mexico 2 310 2 779 2 581 7
United States 1 952 1 870 2 032 5
Algeria 1 552 1 808 1 976 5
Japan 1 676 1 683 1 635 4
Philippines 1 713 1 596 1 581 4
Russian Federation 1 007 1 599 1 454 4
Malaysia 1 292 1 260 1 327 3
Thailand 1 140 1 126 1 291 3
World 37 881 37 093 38 728 100
Table 4 (continued)Imports of selected commodities by ten largest importers

Developed Least developed Other developing Countries Worldcountries countries countries in transition agricultural
exportAgricultural Manufactures** Agricultural Manufactures** Agricultural Manufactures** Agricultural Manufactures** prices
imports* imports* imports* imports* (deflated)***
1961–62 102 105 120 190 115 175 134 209 128
1970–72 99 112 121 175 125 169 157 229 129
1980–82 94 109 120 165 125 164 130 188 127
1990–92 100 100 100 100 100 100 100 100 100
2000–02 104 89 86 76 97 90 114 91 92
2002 105 92 84 70 98 89 115 93 94
Table 5Terms of trade in agricultureand versus manufacturesA
nnex
The State of Agricultural Commodity Markets 2004 48
Notes:
* Prices of agricultural exports relative to pricesof agricultural imports. Prices are unit values.For agriculture, unit values are the summation ofweighted commodity unit export values. Weightsare computed by dividing the export value ofeach commodity by its share in the total value ofagricultural exports in the country group underconsideration. The coefficients are subsequentlyindexed to the base period 1990–92 = 100. Thesame methodology applies for unit value ofimports.** Prices of exported agricultural productsrelative to the prices of exported manufacturedproducts. These are estimated in the same wayas in the previous note, but the denominator isthe unit value of manufacturing exports.*** World agricultural export prices. These areunit values of exports, estimated as above anddeflated by the unit value of world manufacturingexports with the base 1990–92 = 100.

The State of Agricultural Commodity Markets 2004 49
Table 6Shares (in value) of individual commodity groups
in total agricultural exports and imports in each country group (percentage)
Export shares 1961–63 Import shares 1961–63
Least Other Transition Developed Least Other Transition Developeddeveloped developing countries countries developed developing countries countriescountries countries countries countries
Cereals 16 8 30 33 41 48 23 15
Oilcrops 20 11 8 13 13 10 8 14
Meat 1 4 16 12 4 3 4 10
Dairy 0 0 5 8 4 5 1 4
Sugar 2 14 11 3 14 8 12 7
Horticulture 2 7 6 9 3 4 5 10
Tropical beverages 21 27 0 2 7 6 5 16
Raw materials 38 29 24 20 15 17 41 24
All agricultural 100 100 100 100 100 100 100 100
Export shares 1999–2001 Import shares 1999–2001
Least Other Transition Developed Least Other Transition Developeddeveloped developing countries countries developed developing countries countriescountries countries countries countries
Cereals 5 11 19 16 40 27 12 8
Oilcrops 14 26 16 14 24 24 15 15
Meat 1 9 15 21 4 9 14 20
Dairy 0 1 11 11 5 7 4 8
Sugar 4 7 3 3 9 5 11 2
Horticulture 4 15 6 14 2 6 13 20
Tropical beverages 28 15 7 7 3 4 12 13
Raw materials 43 16 25 15 13 19 19 13
All agricultural 100 100 100 100 100 100 100 100

Table 7Growth rates in export and import unitvalues, by country group (percentage)A
nnex
The State of Agricultural Commodity Markets 2004 50
Exports Imports
Least Developing Developed Least Developing Developeddeveloped countries countries developed countries countriescountries countries
Cereals –3.18 –2.79 –2.50 –2.84 –2.79 –2.05
Oilcrops –2.34 –2.88 –2.06 –3.37 –2.78 –2.37
Meat –1.69 –1.34 –1.51 –2.91 –2.77 –1.01
Dairy –2.48 –1.50 –0.45 –1.08 –0.80 –0.26
Sugar –1.44 –2.43 –1.56 –2.42 –2.12 –1.21
Horticulture –1.38 –1.35 –0.56 –3.13 –0.96 –0.84
Tropical beverages –2.74 –2.59 –0.92 –2.29 –2.74 –1.58
Raw materials –2.67 –2.20 –1.50 –2.79 –1.19 –2.02
All agricultural –1.35 –2.52 –1.58 –2.73 –2.36 –1.56
Note:
Growth rates have been calculated by fitting alogarithmic trend to each unit value index overthe period 1961–2001. Nominal value indiceshave been deflated by the United StatesConsumer Price Index (1995 = 1).

The State of Agricultural Commodity Markets 2004 51
Table 8Variability in nominal export and import unit values
(coefficients of variation) (percentage)
Exports Imports
Least Developing Developed Least Developing Developeddeveloped countries countries developed countries countriescountries countries
Cereals 23.2 23.2 20.3 20.7 23.9 19.2
Oilcrops 22.3 22.6 18.3 24.9 21.6 19.1
Meat 18.1 13.8 13.2 20.1 17.2 11.7
Dairy 24.4 7.9 7.3 5.5 5.2 8.4
Sugar 22.5 38.6 29.2 36.4 37.7 20.8
Horticulture 12.1 4.2 5.8 33.9 9.7 3.3
Tropical beverages 35.1 32.7 17.3 21.8 16.8 28.2
Raw materials 26.7 23.1 13.9 26.6 14.0 21.2
All agricultural 27.0 22.6 14.1 20.1 19.2 15.4
Note:
Coefficients of variation have been calculatedusing the variation around an estimatedlogarithmic trend line over the period1961–2001.

Commodity Market Review 2003–2004 (2004)
FAO Commodities and Trade Technical Papers
5. Voluntary standards and certification for environmentally and socially responsibleagricultural production and trade (2004)
4. The European market for organic and fair-trade products from West Africa (2004)3. The market for non traditional agricultural exports (2004)2. Environmental and social standards, certification and labelling for cash crops (2003)1. Medium-term prospects for agricultural commodities: projections to the year 2010
(2003)
FAO Commodity Studies
2. Issues in the global tobacco economy: selected case studies (2003)1. The world banana economy 1985–2002 (2003)
FAO Commodity and Trade Policy Research Working Papers
200410.Agricultural trade liberalization in the Doha round. Alternative scenarios and trategic
interactions between developed and developing countries (P. Conforti and L. Salvatici)9. The EU cotton policy regime and the implications of the proposed changes for producer
welfare (G. Karagiannis)8. The impact of domestic and trade policies on the world cotton market (D. Poonyth,
A. Sarris, R. Sharma and S. Shui)7. Price transmission in selected agricultural markets (P. Conforti)6. The marketing potential of date palm fruits in the European market (P. Liu)5. World markets for organic citrus and citrus juices: current market situation and
medium-term prospects (P. Liu)4. Agricultural policy indicators (T. Josling and A. Valdés; also issued as ESA Working
Paper No. 2004/4)
20033. Quantifying appropriate levels of the WTO bound tariffs on basic food products in the
context of the Development Box proposals (R. Sharma)2. The WTO and environmental and social standards, certification and labelling in
agriculture (C. Dankers)1. The Brazilian ethanol programme: impacts on world ethanol and sugar markets
(T. Koizumi)
Further information on all publications listed above is available on the FAO Commoditiesand Trade Division’s Web pages (at http://www.fao.org/es/ESC/en/index.html).
FAO Commodities and Trade Divisionpublications, 2003–04
The State of Agricultural Commodity Markets 2004 52

T echnical developments that increase productivity and reduce costs mean that thelong-term trend in real agricultural commodity prices on international markets isgradually downwards but that trend is dominated by significant short-term
variability. Many developing countries, and especially the least developed countries,continue to depend on just a few agricultural commodities for the bulk of their exportearnings. For them, commodity price variability has a strong impact on incomes,employment and government revenues, compromising macroeconomic planning anddevelopment efforts more generally. However, developing countries are also as a groupincreasingly reliant on food imports. The least developed countries are already net foodimporters. In these circumstances, falling international food prices are obviouslybeneficial but increasing reliance on imported food also means greater exposure to thevariability in international food prices and hence food import bills.
Developing countries need to contend with variability of international commodity pricesin their efforts to increase their export earnings or manage their food import bills. At thesame time, they must also contend with the market distortions introduced by the importtariffs and export and production subsidies used by both developed and developingcountries, and by the market power in many commodity value chains of largetransnational companies. The traditional international responses to commodity marketinstability based on market interventions or compensation schemes are not currentlyfavoured and new approaches are needed. These new approaches, such as market-based price risk management, are aimed less at preventing price swings than at helpingproducers and consumers predict and manage better their adverse impacts.
The State of Agricultural Commodity Markets 2004 is the first issue of a new biennialpublication that aims to present commodity market issues in an objective and accessibleway to policy-makers, commodity market observers and all those interested inagricultural commodity market developments and their impacts on developingcountries. It is intended to raise awareness of the impacts of international commodityprice movements on the livelihoods and food security of hundreds of millions of people inthe developing world as well as the economies of dozens of developing countries thatdepend on commodity exports for a substantial part of their export earnings or on foodimports for a substantial share of their available food supplies.
2004The State of Agricultural Commodity Markets
9 7 8 9 2 5 1 0 5 1 3 3 7
TC/M/Y5419E/1/12.04/2000
ISBN 92-5-105133-X