The SQL Injection Threat Study - dbcybertech.com · Ponemon Institute© Research Report 1 1 The SQL...
17
The SQL Injection Threat Study Ponemon Institute© Research Report Sponsored by DB Networks Independently conducted by Ponemon Institute LLC Publication Date: April 2014
-
Upload
phungtuyen -
Category
Documents
-
view
213 -
download
0
Transcript of The SQL Injection Threat Study - dbcybertech.com · Ponemon Institute© Research Report 1 1 The SQL...

The SQL Injection Threat Study
Ponemon Institute© Research Report
Sponsored by DB Networks Independently conducted by Ponemon Institute LLC Publication Date: April 2014

Ponemon Institute© Research Report
1
1
The SQL Injection Threat Study Presented by Ponemon Institute, April 2014
Part 1. Introduction Ponemon Institute is pleased to present the findings of The SQL Injection Threat Study sponsored by DB Networks. The purpose of this research is to understand how organizations respond to the SQL injection threat and their awareness about different approaches to managing this risk. The study surveyed 595 individuals who work in IT and IT security. The majority of respondents are familiar with core IDS technologies that detect rogue SQL statements on the network that connect the web application to the database. SQL injections have been defined as being used to attack data driven applications, in which malicious SQL statements are inserted into an entry field for execution (e.g. to dump the database contents to the attacker). SQL injections exploit security vulnerabilities in an application’s software. SQL injection is most commonly known as an attack vector through public facing websites but can be used to attack SQL databases in a variety of ways. The most salient findings are shown below: The SQL threat is taken seriously because 65 percent of organizations represented in this
study experienced a SQL injection attack that successfully evaded their perimeter defenses in the last 12 months.
Almost half of respondents (49 percent) say the SQL injection threat facing their company is
very significant. On average, respondents believe 42 percent of all data breaches are due, at least in part, to SQL injections.
Many organizations are not familiar with the techniques used by cyber criminals. Less than
half of respondents (46 percent) are familiar with the term Web Application Firewalls (WAF) bypass. Only 39 percent of respondents are very familiar or familiar with the techniques cyber criminal use to get around WAF perimeter security devices.
BYOD makes understanding the root causes of an SQL injection attack more difficult. Fifty-
six percent of respondents say determining the root causes of SQL injection is becoming more difficult because of the trend for employees to use their personally owned mobile devices (BYOD) in the workplace. Another challenge, according to 41 percent of respondents, is increasing stealth and/or sophistication of cyber attackers.
Expertise and the right technologies are critical to preventing SQL injection attacks. While
respondents see the SQL threat as serious, only 31 percent say their organization’s IT security personnel possess the skills, knowledge and expertise to quickly detect a SQL injection attack and 34 percent agree that they have the technologies or tools to quickly detect a SQL injection attack.
Measures to prevent SQL injection attacks are also lacking. Despite concerns about the threat, 52 percent do not take such precautions as testing and validating third party software to ensure it is not vulnerable to SQL injection attack.
Organizations move to a behavioral analysis solution to combat the SQL injection threat.
Eighty-eight percent of respondents view behavioral analysis either very favorably or favorably.

Ponemon Institute© Research Report
2
2
Part 2. Key Findings In this section we provide an analysis of the key findings. The complete audited results are presented in the appendix of this report. We organized the report according to these themes: The scope of the SQL injection threat Why the SQL injection threat remains pervasive Moving to behavioral analysis to combat the SQL injection threat The scope of the SQL injection threat SQL attacks are pervasive. As shown in Figure 1, 65 percent of respondents say their organization experienced one or more SQL injection attacks that evaded its firewalls and other perimeter defenses in the past year. On average, it took approximately 140 days to detect the attack. Forty percent of respondents say it took about six months or longer to detect. To contain the attack took an average of 68 days. Figure 1. One or more SQL injection attacks on the past 12 months
The SQL threat is taken seriously. Almost half of respondents (49 percent) say the SQL injection threat facing their company is very significant, according to Figure 2. Only 5 percent say they do not see SQL injections as a threat. Figure 2. The SQL injection threat facing your company today 1 = no threat to 10 = significant threat
65%
30%
5%
0%
10%
20%
30%
40%
50%
60%
70%
Yes No Unable to determine
5% 11% 12%
23%
49%
0%
10%
20%
30%
40%
50%
60%
1 to 2 3 to 4 5 to 6 7 to 8 9 to 10

Ponemon Institute© Research Report
3
3
According to Figure 3, most respondents say the SQL injections are increasing (38 percent of respondents) or staying at the same level (45 percent of respondents). Figure 3. The state of SQL injection attacks
Why the SQL injection threat remains pervasive Many organizations are not familiar with the techniques used by cyber criminals. Less than half of respondents (46 percent) are familiar with the term Web Application Firewalls (WAF) bypass. As shown in Figure 4, only 39 percent of respondents are very familiar or familiar with the techniques cyber criminal use to get around WAF perimeter security devices. Figure 4. Familiarity with the bypass techniques cyber criminals use
4%
13%
38%
45%
0% 5% 10% 15% 20% 25% 30% 35% 40% 45% 50%
Unable to determine
SQL injection attacks are decreasing
SQL injection attacks are increasing
SQL injection attacks are staying at the same level
12%
27%
44%
17%
0%
5%
10%
15%
20%
25%
30%
35%
40%
45%
50%
Very familiar Familiar Not familiar No knowledge
Ponemon Institute© Research Report
4
4
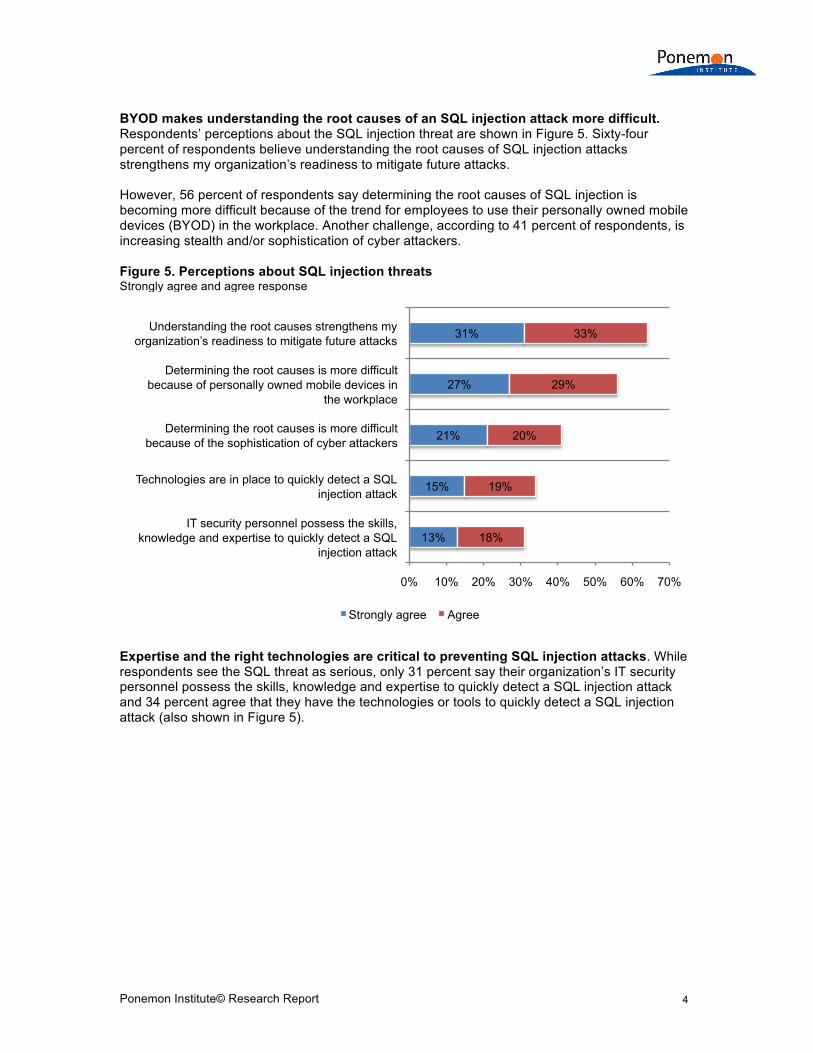
BYOD makes understanding the root causes of an SQL injection attack more difficult. Respondents’ perceptions about the SQL injection threat are shown in Figure 5. Sixty-four percent of respondents believe understanding the root causes of SQL injection attacks strengthens my organization’s readiness to mitigate future attacks. However, 56 percent of respondents say determining the root causes of SQL injection is becoming more difficult because of the trend for employees to use their personally owned mobile devices (BYOD) in the workplace. Another challenge, according to 41 percent of respondents, is increasing stealth and/or sophistication of cyber attackers. Figure 5. Perceptions about SQL injection threats Strongly agree and agree response
Expertise and the right technologies are critical to preventing SQL injection attacks. While respondents see the SQL threat as serious, only 31 percent say their organization’s IT security personnel possess the skills, knowledge and expertise to quickly detect a SQL injection attack and 34 percent agree that they have the technologies or tools to quickly detect a SQL injection attack (also shown in Figure 5).
13%
15%
21%
27%
31%
18%
19%
20%
29%
33%
0% 10% 20% 30% 40% 50% 60% 70%
IT security personnel possess the skills, knowledge and expertise to quickly detect a SQL
injection attack
Technologies are in place to quickly detect a SQL injection attack
Determining the root causes is more difficult because of the sophistication of cyber attackers
Determining the root causes is more difficult because of personally owned mobile devices in
the workplace
Understanding the root causes strengthens my organization’s readiness to mitigate future attacks
Strongly agree Agree

Ponemon Institute© Research Report
5
5
Measures to prevent SQL injection attacks are also lacking. Despite concerns about the threat, 52 percent do not take such precautions as testing and validating third party software to ensure it is not vulnerable to SQL injection attack, according to Figure 6. Figure 6. Third party software is tested and validated to ensure it is not vulnerable
As shown in Figure 7, 44 percent of respondents say their organization uses professional penetration testers to identify vulnerabilities in their information systems but only 35 percent of these organizations include testing for SQL injection vulnerabilities. Figure 7. Professional penetration testers are used to identify vulnerabilities
12%
30%
52%
6%
0%
10%
20%
30%
40%
50%
60%
Yes, most third-party software
Yes, some third-party software
No Unsure
44%
50%
6%
0%
10%
20%
30%
40%
50%
60%
Yes No Unsure

Ponemon Institute© Research Report
6
6
More monitoring for active databases is needed. Figure 8 reveals that one-third of respondents say they either scan continuously or daily for active databases. However, 25 percent scan irregularly and 22 percent do not scan at all. Figure 8. How often does your company scan for active databases? Extrapolated average = 16 days
22%
25%
6%
2%
4%
3%
5%
13%
20%
0% 5% 10% 15% 20% 25% 30%
We don’t scan
Irregular intervals
Annually
Semi-annually
Quarterly
Monthly
Weekly
Daily
Continuously

Ponemon Institute© Research Report
7
7
Moving to a behavioral analysis solution to combat the SQL injection threat In this research we define behavioral analysis technology for securing database transactions as a technology that automatically creates a model of proper SQL behavior. Each SQL statement attempting to access the database is tested against the behavioral model. Any activity that deviates from the established behavioral model is flagged as a likely security event. Behavioral analysis provides immediate protection against zero-day threats. Organizations are adopting behavioral analysis. According to Figure 9, 88 percent of respondents view behavioral analysis either very favorably or favorably. Figure 9. Current opinion about behavioral analysis approach for detecting SQL injection
40%
48%
12%
0%
10%
20%
30%
40%
50%
60%
Very favorable Favorable Not favorable

Ponemon Institute© Research Report
8
8
Sixty percent of respondents say their organizations have or will within the next two years replace its signature-based IT security systems with behavioral analysis-based systems, as shown in Figure 10. Most will be used on client systems (64 percent of respondents) followed by on the perimeter network (56 percent of respondents). Figure 10. How will behavioral analysis-based systems be used? More than one response permitted
2%
36%
49%
56%
64%
0% 10% 20% 30% 40% 50% 60% 70%
Other
For web application security
For database transaction security
On the perimeter network
On client systems

Ponemon Institute© Research Report
9
9
Part 3. Methods
A sampling frame of 16,520 experienced IT and IT security practitioners located in the United States were selected as participants to this survey. Table 1 shows 701 total returns. Screening and reliability checks required the removal of 106 surveys. Our final sample consisted of 595 surveys (3.6 percent response rate). Table 1. Sample response Freq Pct% Sampling frame 16,520 100.0% Total returns 701 4.2% Rejected or screened surveys 106 0.6% Final sample 595 3.6%
Pie Chart 1 reports the respondent’s organizational level within participating organizations. By design, 58 percent of respondents are at or above the supervisory levels. Pie Chart 1. Current position level within the organization
Pie Chart 2 reports that 61 percent of respondents report directly to the CIO or head of corporate IT, 19 percent report to the CISO/CSO or head of corporate IT and 11 percent report to the business unit leader or general manager. Pie Chart 2. Direct reporting channel
2%
16%
23%
17%
36%
3% 3%
Executive/VP Director Manager Supervisor Staff/technician Administrative Consultant/contractor
61% 19%
11%
4% 3%
2%
CIO or head of corporate IT CISO/CSO or head of IT security Business unit leader or general manager Head of compliance or internal audit COO or head of operations CFO, controller or head of finance

Ponemon Institute© Research Report
10
10
Pie Chart 3 reports the industry classification of respondents’ organizations. This chart identifies financial services (19 percent) as the largest segment, followed by public sector (12 percent), retail (10 percent), and health & pharmaceuticals (9 percent). Pie Chart 3. Primary industry classification
As shown in Pie Chart 4, 81 percent of respondents are from organizations with a global headcount of 1,000 or more employees. Pie Chart 4. Full-time headcount of the global organization
19%
12%
10%
9% 8%
7%
6%
6%
5%
5% 3%
2% 2% 2%
4% Financial services Public sector Retail Health & pharmaceuticals Services Industrial Consumer products Energy & utilities Technology & software Transportation Communications Hospitality Entertainment & media Education & research Other
19%
22%
34%
13%
5% 7%
Less than 1,000
1,000 to 5,000
5,001 to 10,000
10,001 to 25,000
25,001 to 75,000
More than 75,000

Ponemon Institute© Research Report
11
11
Part 4. Caveats to this study There are inherent limitations to survey research that need to be carefully considered before drawing inferences from findings. The following items are specific limitations that are germane to most web-based surveys. Non-response bias: The current findings are based on a sample of survey returns. We sent
surveys to a representative sample of individuals, resulting in a large number of usable returned responses. Despite non-response tests, it is always possible that individuals who did not participate are substantially different in terms of underlying beliefs from those who completed the instrument.
Sampling-frame bias: The accuracy is based on contact information and the degree to which
the list is representative of individuals who are IT or IT security practitioners. We also acknowledge that the results may be biased by external events such as media coverage. Finally, because we used a web-based collection method, it is possible that non-web responses by mailed survey or telephone call would result in a different pattern of findings.
Self-reported results: The quality of survey research is based on the integrity of confidential
responses received from subjects. While certain checks and balances can be incorporated into the survey process, there is always the possibility that a subject did not provide accurate responses.

Ponemon Institute© Research Report
12
12
Appendix: Detailed Survey Results
The following tables provide the frequency or percentage frequency of responses to all survey questions contained in this study. Some of these questions indicated with an asterisk will be discussed in a second report. All survey responses were captured in February 2014.
Survey response Freq Pct% Total sampling frame 16520 100.0% Total returns 701 4.2% Rejected or screened surveys 106 0.6% Final sample 595 3.6% Part 1. SQL injection and database security Q1. How familiar are you with core IDS technologies that detect rogue SQL statements on the network that connect the web application to the database? Pct% Very familiar 33% Familiar 57% Not familiar 10% Total 100% Q2. How familiar are you with the term weaponized SQL injection attack? Pct% Very familiar 19% Familiar 33% Not familiar 48% Total 100% Q9. What is your opinion about the above-mentioned behavioral analysis approach for detecting SQL injection? Pct% Very favorable 40% Favorable 48% Not favorable 12% Unsure 0% Total 100% Q10a. Is your company replacing or planning to replace, its signature-based IT security systems with behavioral analysis based systems? Pct% Yes, already replaced 12% Yes, planning to replace within the next 12 months 20% Yes, planning to replace within the next 24 months 20% Yes, planning to replace more than 24 months from now 6% No 40% Unsure 2% Total 100% Q10b. If yes, how will behavioral analysis-based systems be used? Please select all that apply. Pct% On client systems 64% On the perimeter network 56% For web application security 36% For database transaction security 49% Other (please specify) 2% Total 207%

Ponemon Institute© Research Report
13
13
Q11. How often does your company scan for active databases? Pct% Continuously 20% Daily 13% Weekly 5% Monthly 3% Quarterly 4% Semi-annually 2% Annually 6% Irregular intervals 25% We don’t scan 22% Total 100% Q12a. Do you know the term “WAF Bypass”? Pct% Yes 46% No 54% Total 100% Q12b. If yes, how familiar are you with bypass techniques cyber criminals use to get around Web Application Firewalls (WAF)? Pct% Very familiar 12% Familiar 27% Not familiar 44% No knowledge 17% Total 100% Q14. How would you rate the rate SQL injection threat facing your company today. Please use the following 10-point scale from 1 = no threat to 10 = significant threat. Pct% 1 to 2 5% 3 to 4 11% 5 to 6 12% 7 to 8 23% 9 to 10 49% Total 100% Q15. Does your company test and validate third party software to ensure it is not vulnerable to SQL injection attack? Pct% Yes, most third-party software 12% Yes, some third-party software 30% No 52% Unsure 6% Total 100% Q16a. Does your organization use professional penetration testers to identify vulnerabilities in your information systems? Pct% Yes 44% No 50% Unsure 6% Total 100% Q16b. If yes, does the penetration test include testing for SQL injection vulnerabilities? Pct% Yes 35% No 56% Unsure 9% Total 100%

Ponemon Institute© Research Report
14
14
Q17. In your opinion, what percentage of data breaches are due, at least in part, to SQL injection? Pct% Zero 0% 1 to 10% 11% 11 to 25% 23% 26 to 50% 31% 51 to 75% 23% 76 to 100% 12% Total 100% Q19a. In the past 12 months, did your company experience one or more SQL injection attacks that evaded its firewalls and other perimeter defenses? Pct% Yes 65% No 30% Unable to determine 5% Total 100% Q19b. If yes, how long did it take to detect this attack (on average)? Pct% Within 1 hour 2% Within 1 day 5% Within 1 week 13% Within 1 month 15% Within 3 months 20% Within 6 months 21% Within 12 months 10% More than 1 year 9% Unable to determine 5% Total 100% Q19c. If yes, how long did it take to contain this attack (on average)? Pct% Within 1 hour 6% Within 1 day 18% Within 1 week 23% Within 1 month 21% Within 3 months 10% Within 6 months 8% Within 12 months 7% More than 1 year 2% Unable to determine 5% Total 100% Q20. Please select the one statement that best describes your opinion about the state of SQL injection attacks? Pct% SQL injection attacks are increasing 38% SQL injection attacks are decreasing 13% SQL injection attacks are staying at the same level 45% Unable to determine 4% Total 100%

Ponemon Institute© Research Report
15
15
Q21. Please check all the data security standards that your organization complies with? Please check all that apply. Pct% Various US state privacy and data protection laws 82% Payment Card Industry DSS 69% Various national privacy and data protection laws 63% European Union Privacy Directive 55% Sarbanes–Oxley Act (SOX) 44% Federal Information Processing Standards (FIPS) 34% Gramm Leach Bliley (GLBA) Security Standard 20% Health Insurance Portability and Accounting Act (HIPAA) 19% ISO 27001/27002 16% Federal Information Security Management Act (FISMA) 12% DoD Directive 8500.1 8% North American Electric Reliability Corporation NERC CIP 6% ISO 17799 5% Other (please specify) 5% Total 438% Part 3. Attributions Please rate the following five (5) statements using the five-point scale provided below each item.
Strongly agree Agree
Q23. My organization has the technologies or tools to quickly detect a SQL injection attack. 15% 19% Q24. My organization’s IT security personnel possess the skills, knowledge and expertise to quickly detect a SQL injection attack. 13% 18% Q25. Understanding the root causes of SQL injection attacks strengthens my organization’s readiness to mitigate future attacks. 31% 33% Q26. Determining the root causes of SQL injection is becoming more difficult because of the increasing stealth and/or sophistication of cyber attackers. 21% 20% Q27. Determining the root causes of SQL injection is becoming more difficult because of the trend for employees to use their personally owned mobile devices in the workplace (a.k.a. BYOD). 27% 29% Part 4. Organization and respondents’ demographics D1. What best describes your position level within the organization? Pct% Executive/VP 2% Director 16% Manager 23% Supervisor 17% Staff/technician 36% Administrative 3% Consultant/contractor 3% Other 0% Total 100% D2. What best describes your direct reporting channel? Pct% CEO/executive committee 0% COO or head of operations 3% CFO, controller or head of finance 2% CIO or head of corporate IT 61% Business unit leader or general manager 11% Head of compliance or internal audit 4% CISO/CSO or head of IT security 19% Total 100%

Ponemon Institute© Research Report
16
16
D3. What best describes your organization’s primary industry classification? Pct% Financial services 19% Public sector 12% Retail 10% Health & pharmaceuticals 9% Services 8% Industrial 7% Consumer products 6% Energy & utilities 6% Technology & software 5% Transportation 5% Communications 3% Other 3% Hospitality 2% Entertainment & media 2% Education & research 2% Defense contractor 1% Total 100% D4. What range best describes the full-time headcount of your global organization? Pct% Less than 1,000 19% 1,000 than 5,000 22% 5,001 to 10,000 34% 10,001 to 25,000 13% 25,001 to 75,000 5% More than 75,000 7% Total 100%
Ponemon Institute
Advancing Responsible Information Management Ponemon Institute is dedicated to independent research and education that advances responsible information and privacy management practices within business and government. Our mission is to conduct high quality, empirical studies on critical issues affecting the management and security of sensitive information about people and organizations.
As a member of the Council of American Survey Research Organizations (CASRO), we uphold strict data confidentiality, privacy and ethical research standards. We do not collect any personally identifiable information from individuals (or organization identifiable information in our business research). Furthermore, we have strict quality standards to ensure that subjects are not asked extraneous, irrelevant or improper questions.