The SQL Injection Threat & Recent Retail Breaches … · · 2018-05-11The SQL Injection Threat &...
15
The SQL Injection Threat & Recent Retail Breaches Ponemon Institute© Research Report Sponsored by DB Networks Independently conducted by Ponemon Institute LLC Publication Date: June 2014
Transcript of The SQL Injection Threat & Recent Retail Breaches … · · 2018-05-11The SQL Injection Threat &...
The SQL Injection Threat & Recent Retail Breaches
Ponemon Institute© Research Report
Sponsored by DB Networks Independently conducted by Ponemon Institute LLC Publication Date: June 2014
Ponemon Institute© Research Report
1
1
The SQL Injection Threat & Recent Retail Breaches Presented by Ponemon Institute, June 2014
Part 1. Introduction Ponemon Institute is pleased to present its second report on the SQL injection threat, sponsored by DB Networks. In this report, we explore what IT security professionals think about the likely attack chain of recent data breaches involving major retailers such as Target, Michaels and Neiman Marcus. The first report focused on how organizations respond to the SQL injection threat and their awareness about different approaches to managing this risk. The study surveyed 595 individuals who work in IT and IT security. The majority of respondents are familiar with core IDS technologies that detect rogue SQL statements on the network that connect the web application to the database. Sixty-nine percent of respondents say their organization must comply with Payment Card Industry Data Security Standard (PCI DSS). As such, a majority of the respondents are very familiar with and required to comply with the security requirements for retailers who accept payment cards. SQL injections have been defined as being used to attack data driven applications, in which malicious SQL statements are inserted into an entry field for execution (e.g. to dump the database contents to the attacker). SQL injections exploit security vulnerabilities in an application’s software. SQL injection is most commonly known as an attack vector through public facing websites but can be used to attack SQL databases in a variety of ways. Background on retail breaches Details of the recent retailers network intrusion and data breach haven’t been readily forth coming from either the retailers who were breached or the U.S. Secret Service in charge of the breach investigations. As a result, security professionals are left to piece together the attack chain details based on the nascent amount of information that has been shared thus far. Target, for example, has revealed the credentials from an HVAC contractor were compromised. Those compromised credentials they claim initiated the attack chain that ultimately resulted in two major breaches. While certainly an interesting factoid, that information actually offers little insight into the events that ultimately resulted in the breach of 40 million credit cards and another 70 million database records containing personally identifiable information (PII). The HVAC vendor credentials only provided access to Target’s vendor billing and invoicing system. It’s a rather long leap from those systems into Target’s POS systems. How that feat was accomplished hasn’t been made public. Further, a report by BusinessWeek revealed that Target’s IT security systems were able to identify the hackers suspicious activity multiple times during the attack. But unfortunately those alerts were not agreed upon by Target’s IT security staff. Some of the key takeaways from this study include: § Fifty percent of respondents believe cyber syndicates are to blame for the large retail data
breaches. Only 16 percent believe an individual perpetrated the attack. § Many respondents believe notification of victims is better later than sooner. Thirty-six percent
of respondents would prefer to wait to notify victims until a thorough investigation was conducted.
§ SQL injection threat was one of the components of these retail breaches. Fifty-three percent of respondents say SQL injections were used to steal sensitive and confidential information.
§ Sixty-five percent of respondents say continuous monitoring of the database network followed by advanced database activity monitoring are the best approaches to avoiding a mega data breach.

Ponemon Institute© Research Report
2
2
Part 2. Key Findings Respondents believe that a cyber criminal syndicate was likely responsible in recent incidents against national retail organizations. In the case of Target, initial reports indicated that an individual Russian teenager was the perpetrator of the data breach. However, as shown in Figure 1, 50 percent of respondents felt that attacks against Target, Neiman Marcus, Michaels and others were actually the work of a cyber criminal syndicate. Only 15 percent responded that an individual a “lone wolf hacker” was the likely culprit. Eleven percent responded that nation-state actors were likely responsible. Figure 1. The most likely attacker in recent incidents against national retail organizations
Respondents’ perceptions about notification response time varies. A contentious topic among retail customers is the time required for the notification of a breach of payment card data and/or personal information. IT security professionals understand what’s a reasonable timeframe given their understanding of the process required to identify the scope of a particular data breach and precisely whose information has actually been breached. Thirty-six percent of respondents believe there should be no specific timeframe and notification should occur only after a thorough investigation has concluded. However, 53 percent say response time should be faster (34 percent + 17 percent + 2 percent). As shown in Figure 2, 34 percent say notification should take place in less than a month, 17 percent say it should be less than a week and 2 percent say less than three days. Figure 2. How soon should victims be notified of a data breach?
50%
23%
15% 11%
1% 0%
10%
20%
30%
40%
50%
60%
Cyber syndicates Hacktivists Lone wolf hacker Nation-state attackers
Other
2%
11%
17%
34%
36%
0% 5% 10% 15% 20% 25% 30% 35% 40%
Less than 3 days
Within a few months
Less than a week
Less than a month
As long as it takes to perform a thorough investigation

Ponemon Institute© Research Report
3
3
According to reports, the 70 million PII records in the Target attack were compromised as the result of a database breach. The attackers compromised data storage to automatically distribute POS malware used to steal the payment card data. In this portion of the study we asked respondents for their perceptions about database security and SQL injections. More monitoring for active databases is needed. Figure 3 reveals that one-third of respondent’s say they either scan continuously or daily for active databases. However, 25 percent scan irregularly and 22 percent do not scan at all. Figure 3. How often does your company scan for active databases? Extrapolated average = 16 days
SQL injection was considered by respondents to be one of the components of these attacks. According to Figure 4, 57 percent (36 percent + 21 percent) of respondents believe the likelihood that the attacks against the U.S. retailers involved SQL injection was 51 percent or greater. Figure 4. Likelihood that recent attacks against national retail organizations involved SQL injection as one component of the attack
22%
25%
6%
2%
4%
3%
5%
13%
20%
0% 5% 10% 15% 20% 25% 30%
We don’t scan
Irregular intervals
Annually
Semi-annually
Quarterly
Monthly
Weekly
Daily
Continuously
5%
15%
23%
36%
21%
0%
5%
10%
15%
20%
25%
30%
35%
40%
1 to 10% 11 to 25% 26 to 50% 51 to 75% 76 to 100%
Ponemon Institute© Research Report
4
4
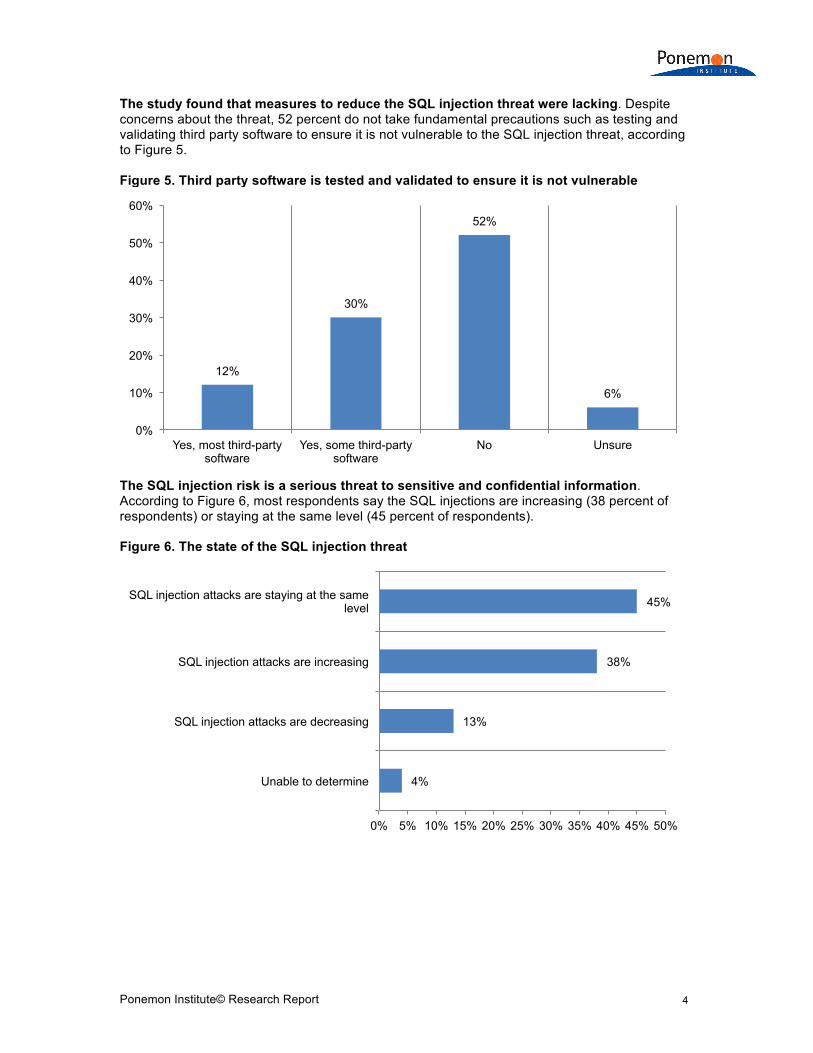
The study found that measures to reduce the SQL injection threat were lacking. Despite concerns about the threat, 52 percent do not take fundamental precautions such as testing and validating third party software to ensure it is not vulnerable to the SQL injection threat, according to Figure 5. Figure 5. Third party software is tested and validated to ensure it is not vulnerable
The SQL injection risk is a serious threat to sensitive and confidential information. According to Figure 6, most respondents say the SQL injections are increasing (38 percent of respondents) or staying at the same level (45 percent of respondents). Figure 6. The state of the SQL injection threat
12%
30%
52%
6%
0%
10%
20%
30%
40%
50%
60%
Yes, most third-party software
Yes, some third-party software
No Unsure
4%
13%
38%
45%
0% 5% 10% 15% 20% 25% 30% 35% 40% 45% 50%
Unable to determine
SQL injection attacks are decreasing
SQL injection attacks are increasing
SQL injection attacks are staying at the same level

Ponemon Institute© Research Report
5
5
Expertise and the right technologies are critical to preventing the SQL injection threat to databases. While respondents see the database threat as serious, only 34 percent indicated that they have the technologies or tools to quickly detect the SQL injection threat. Further, only 31 percent say their organization’s IT security personnel do not presently possess the skills, knowledge and expertise to detect SQL injections, as shown in Figure 7. Figure 7 Perceptions about the ability to prevent the SQL injection threat
How companies allocate their IT security budget. Respondents were asked to provide the percentage of IT security budget allocated to each IT security category. Figure 8 reveals that network security represents 40 percent of the budget, web server security represents 23 percent, database security represents19 percent, and 14 percent is allocated for client security. Figure 8. Investment applied to security areas
13%
15%
18%
19%
0% 5% 10% 15% 20% 25% 30% 35% 40%
IT security personnel possess the skills, knowledge and expertise to quickly detect a SQL
injection attack
Technologies are in place to quickly detect a SQL injection attack
Strongly agree Agree
40%
23%
19%
14%
4%
0%
5%
10%
15%
20%
25%
30%
35%
40%
45%
Network security Web server security
Database security Client security Other

Ponemon Institute© Research Report
6
6
What respondents believe are the best IT security approaches to avoid retail breaches that affected Target, Neiman Marcus, Michaels and others. As shown in Figure 9, continuous monitoring of the database network ranked the highest and was cited by 65 percent of the respondents. Additional countermeasures cited by respondents included advanced database activity monitoring (56 percent), database encryption (49 percent), chip and pin technology for payment cards (45 percent), data leak prevention (39 percent) and finally IT staff education (18 percent). Figure 9. Best approaches to avoid a breach against retail organizations
Other key findings include the following1: § Sixty-five percent of organizations represented in this study experienced a SQL injection
attack that successfully evaded their perimeter defenses in the last 12 months. § Almost half of respondents (49 percent) say the SQL injection threat facing their company is
very significant. On average, respondents believe 42 percent of all data breaches are due, at least in part, to SQL injections.
§ Many organizations are not familiar with the techniques used by cyber criminals. Less than
half of respondents (46 percent) are familiar with the term Web Application Firewalls (WAF) bypass. Only 39 percent of respondents are very familiar or familiar with the techniques cyber criminal use to get around WAF perimeter security devices.
§ BYOD makes understanding the root causes of an SQL injection threat more difficult. Fifty-six
percent of respondents say determining the root causes of SQL injection is becoming more difficult because of employees’ use of personally owned mobile devices (BYOD) in the workplace. Another challenge, according to 41 percent of respondents, is increasing stealth and/or sophistication of cyber attackers.
§ Expertise and the right technologies are critical to preventing the SQL injection threat. While
respondents see the SQL threat as serious, only 31 percent say their organization’s IT security personnel possess the skills, knowledge and expertise to quickly detect SQL injection threats and 34 percent agree that they have the technologies or tools to quickly detect a SQL injection threat.
1 These findings are presented in the full report, The SQL Injection Threat Study, April 2014.
3%
18%
39%
45%
49%
56%
65%
0% 10% 20% 30% 40% 50% 60% 70%
Other
IT staff education
Data leak prevention
Chip & pin technology for credit and debit cards
Database encryption
Advanced database activity monitoring
Continuous monitoring of the database network

Ponemon Institute© Research Report
7
7
§ Measures to prevent the SQL injection threat are also lacking. Despite concerns about the threat, 52 percent do not take such precautions as testing and validating third party software to ensure it is not vulnerable to SQL injections.
§ More organizations are adopting behavioral analysis solutions to combat the SQL injection
threat. Eighty-eight percent of respondents view behavioral analysis either very favorably or favorably.

Ponemon Institute© Research Report
8
8
Part 3. Methods
A sampling frame of 16,520 experienced IT and IT security practitioners located in the United States were selected as participants to this survey. Table 1 shows 701 total returns. Screening and reliability checks required the removal of 106 surveys. Our final sample consisted of 595 surveys (3.6 percent response rate). Table 1. Sample response Freq Pct% Sampling frame 16,520 100.0% Total returns 701 4.2% Rejected or screened surveys 106 0.6% Final sample 595 3.6%
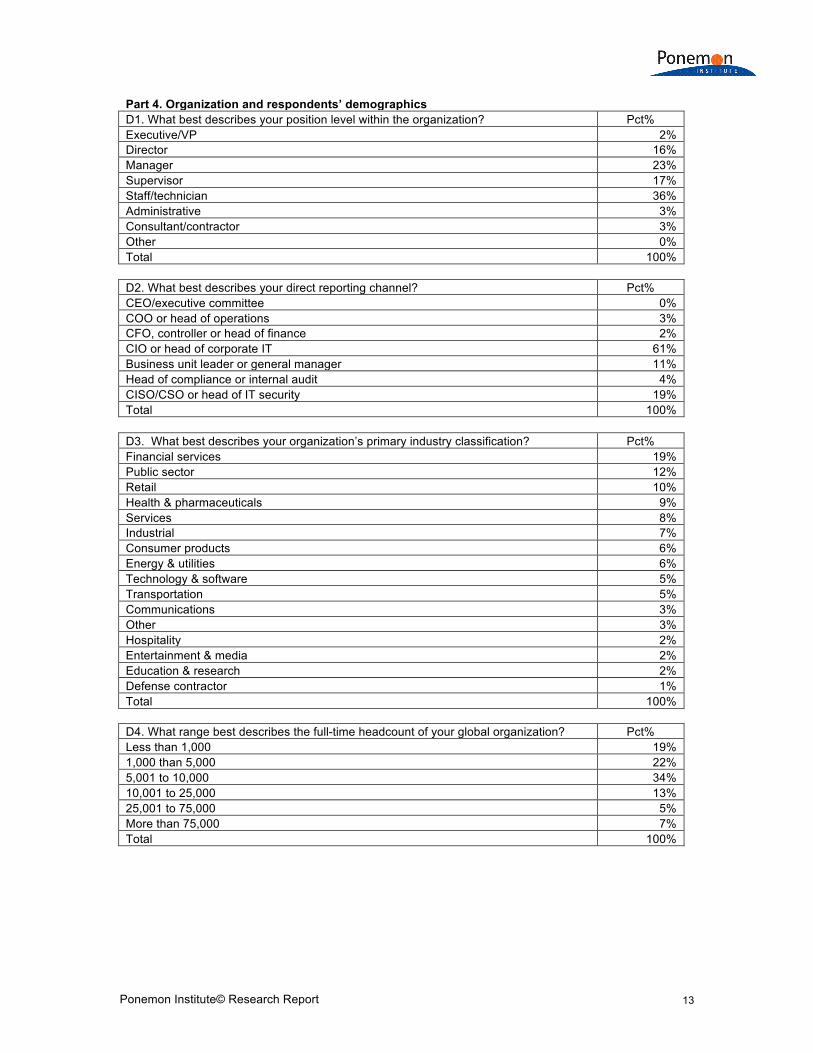
Pie Chart 1 reports the respondent’s organizational level within participating organizations. By design, 58 percent of respondents are at or above the supervisory levels. Pie Chart 1. Current position level within the organization
Pie Chart 2 reports that 61 percent of respondents report directly to the CIO or head of corporate IT, 19 percent report to the CISO/CSO or head of corporate IT and 11 percent report to the business unit leader or general manager. Pie Chart 2. Direct reporting channel
2%
16%
23%
17%
36%
3% 3%
Executive/VP Director Manager Supervisor Staff/technician Administrative Consultant/contractor
61% 19%
11%
4% 3%
2%
CIO or head of corporate IT CISO/CSO or head of IT security Business unit leader or general manager Head of compliance or internal audit COO or head of operations CFO, controller or head of finance

Ponemon Institute© Research Report
9
9
Pie Chart 3 reports the industry classification of respondents’ organizations. This chart identifies financial services (19 percent) as the largest segment, followed by public sector (12 percent), retail (10 percent), and health & pharmaceuticals (9 percent). Pie Chart 3. Primary industry classification
As shown in Pie Chart 4, 81 percent of respondents are from organizations with a global headcount of 1,000 or more employees. Pie Chart 4. Full-time headcount of the global organization
19%
12%
10%
9% 8%
7%
6%
6%
5%
5% 3%
2% 2% 2%
4% Financial services Public sector Retail Health & pharmaceuticals Services Industrial Consumer products Energy & utilities Technology & software Transportation Communications Hospitality Entertainment & media Education & research Other
19%
22%
34%
13%
5% 7%
Less than 1,000
1,000 to 5,000
5,001 to 10,000
10,001 to 25,000
25,001 to 75,000
More than 75,000

Ponemon Institute© Research Report
10
10
Part 4. Caveats to this study There are inherent limitations to survey research that need to be carefully considered before drawing inferences from findings. The following items are specific limitations that are germane to most web-based surveys. Non-response bias: The current findings are based on a sample of survey returns. We sent
surveys to a representative sample of individuals, resulting in a large number of usable returned responses. Despite non-response tests, it is always possible that individuals who did not participate are substantially different in terms of underlying beliefs from those who completed the instrument.
Sampling-frame bias: The accuracy is based on contact information and the degree to which
the list is representative of individuals who are IT or IT security practitioners. We also acknowledge that the results may be biased by external events such as media coverage. Finally, because we used a web-based collection method, it is possible that non-web responses by mailed survey or telephone call would result in a different pattern of findings.
Self-reported results: The quality of survey research is based on the integrity of confidential
responses received from subjects. While certain checks and balances can be incorporated into the survey process, there is always the possibility that a subject did not provide accurate responses.

Ponemon Institute© Research Report
11
11
Appendix: Detailed Survey Results
The following tables provide the frequency or percentage frequency of responses to all survey questions contained in this study. Some of these questions indicated with an asterisk will be discussed in a second report. All survey responses were captured in February 2014.
Survey response Freq Pct% Total sampling frame 16520 100.0% Total returns 701 4.2% Rejected or screened surveys 106 0.6% Final sample 595 3.6%
Part 1. SQL injection and database security Q5. In your opinion, what is the probability or likelihood that recent attacks against national retail organizations including Target, Neiman Marcus, Michaels and others involved SQL injection as one component or dimension of the attack? Pct% Zero 0% 1 to 10% 5% 11 to 25% 15% 26 to 50% 23% 51 to 75% 36% 76 to 100% 21% Total 100%
Q6. In your opinion, who was the most likely attacker in recent incidents against national retail organizations including Target, Neiman Marcus, Michaels and others? Pct% Lone wolf hacker 15% Cyber syndicates 50% Hacktivists 23% Nation-state attackers 11% Other (please specify) 1% Total 100%
Q7. In your opinion, what is the best approach(s) to avoid a breach such as the recent incidents against national retail organizations including Target, Neiman Marcus, Michael Stores and others? Please check all that apply. Pct% Continuous monitoring of the database network 65% Data leak prevention 39% IT staff education 18% Advanced database activity monitoring 56% Database encryption 49% Chip & pin technology for credit and debit cards 45% Other (please specify) 3% Total 275%
Q8. How soon do you believe retailers should notify victims of a data breach involving the loss or theft of personal information such as in the case of Target, Neiman Marcus, Michaels and others? Pct% Less than 3 days 2% Less than a week 17% Less than a month 34% Within a few months 11% As long as it takes to perform a thorough investigation 36% Total 100%

Ponemon Institute© Research Report
12
12
Q11. How often does your company scan for active databases? Pct%
Continuously 20% Daily 13% Weekly 5% Monthly 3% Quarterly 4% Semi-annually 2% Annually 6% Irregular intervals 25% We don’t scan 22% Total 100%
Q15. Does your company test and validate third party software to ensure it is not vulnerable to SQL injection attack? Pct%
Yes, most third-party software 12% Yes, some third-party software 30% No 52% Unsure 6% Total 100%
Q20. Please select the one statement that best describes your opinion about the state of SQL injection attacks? Pct%
SQL injection attacks are increasing 38% SQL injection attacks are decreasing 13% SQL injection attacks are staying at the same level 45% Unable to determine 4% Total 100%
Q21. Please check all the data security standards that your organization complies with? Please check all that apply. Pct%
Various US state privacy and data protection laws 82% Payment Card Industry DSS 69% Various national privacy and data protection laws 63% European Union Privacy Directive 55% Sarbanes–Oxley Act (SOX) 44% Federal Information Processing Standards (FIPS) 34% Gramm Leach Bliley (GLBA) Security Standard 20% Health Insurance Portability and Accounting Act (HIPAA) 19% ISO 27001/27002 16% Federal Information Security Management Act (FISMA) 12% DoD Directive 8500.1 8% North American Electric Reliability Corporation NERC CIP 6% ISO 17799 5% Other (please specify) 5% Total 438%
Part 3. Attributions Please rate the following five (5) statements using the five-point scale provided below each item.
Strongly agree Agree
Q23. My organization has the technologies or tools to quickly detect a SQL injection attack. 15% 19% Q24. My organization’s IT security personnel possess the skills, knowledge and expertise to quickly detect a SQL injection attack. 13% 18%
Ponemon Institute© Research Report
13
13
Part 4. Organization and respondents’ demographics D1. What best describes your position level within the organization? Pct%
Executive/VP 2% Director 16% Manager 23% Supervisor 17% Staff/technician 36% Administrative 3% Consultant/contractor 3% Other 0% Total 100%
D2. What best describes your direct reporting channel? Pct% CEO/executive committee 0% COO or head of operations 3% CFO, controller or head of finance 2% CIO or head of corporate IT 61% Business unit leader or general manager 11% Head of compliance or internal audit 4% CISO/CSO or head of IT security 19% Total 100%
D3. What best describes your organization’s primary industry classification? Pct% Financial services 19% Public sector 12% Retail 10% Health & pharmaceuticals 9% Services 8% Industrial 7% Consumer products 6% Energy & utilities 6% Technology & software 5% Transportation 5% Communications 3% Other 3% Hospitality 2% Entertainment & media 2% Education & research 2% Defense contractor 1% Total 100%
D4. What range best describes the full-time headcount of your global organization? Pct% Less than 1,000 19% 1,000 than 5,000 22% 5,001 to 10,000 34% 10,001 to 25,000 13% 25,001 to 75,000 5% More than 75,000 7% Total 100%
Ponemon Institute© Research Report
14
14
Ponemon Institute
Advancing Responsible Information Management Ponemon Institute is dedicated to independent research and education that advances responsible information and privacy management practices within business and government. Our mission is to conduct high quality, empirical studies on critical issues affecting the management and security of sensitive information about people and organizations.
As a member of the Council of American Survey Research Organizations (CASRO), we uphold strict data confidentiality, privacy and ethical research standards. We do not collect any personally identifiable information from individuals (or organization identifiable information in our business research). Furthermore, we have strict quality standards to ensure that subjects are not asked extraneous, irrelevant or improper questions.