The South African Logistics Index
27
SA economy & Logistics The aftermath of the big drought and recession. The logistics sector is getting ahead faster but perhaps there is just too many operators still? SA logistics in a world and SA context 1
-
Upload
tristan-wiggill -
Category
Business
-
view
64 -
download
7
Transcript of The South African Logistics Index
SA economy & Logistics
The aftermath of the big drought and recession. The logistics sector is getting ahead faster but perhaps there is just too many operators still?
SA logistics in a world and SA context
1
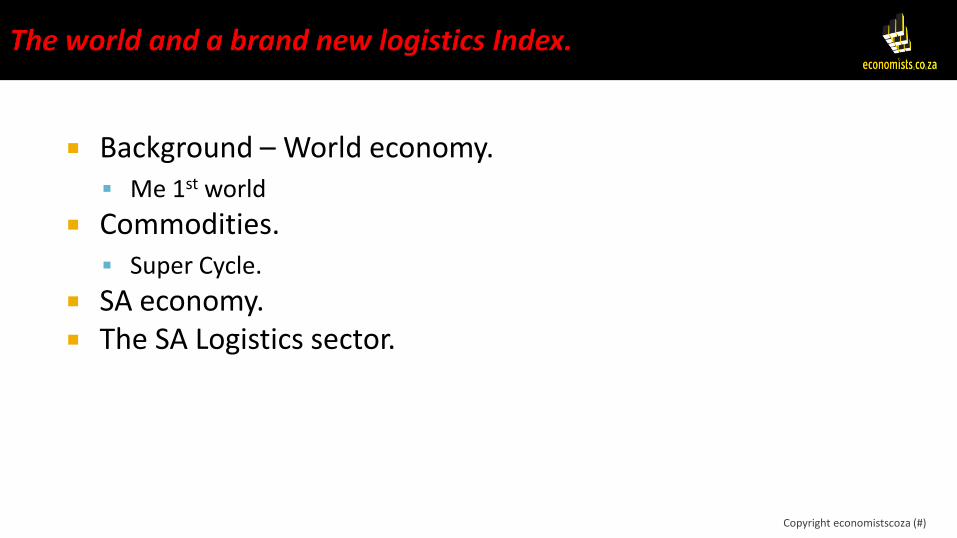
Background – World economy. Me 1st world
Commodities. Super Cycle.
SA economy. The SA Logistics sector.
Copyright economistscoza (#)

Copyright economistscoza 3
Copyright economistscoza 4
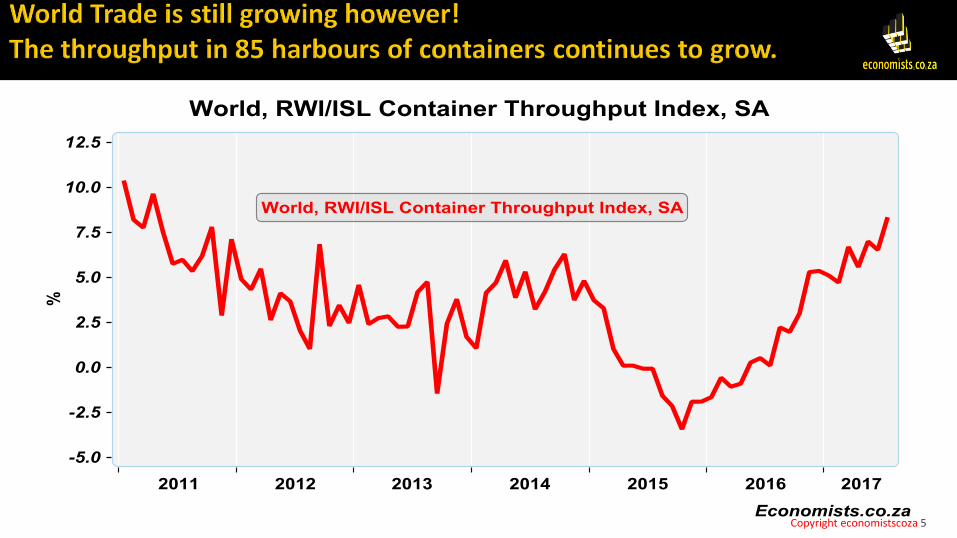
Copyright economistscoza 5

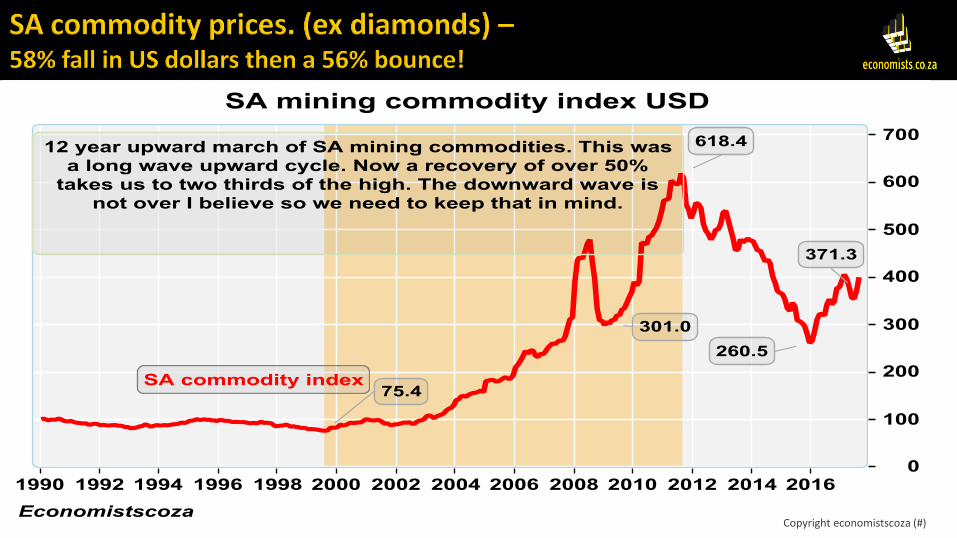
Looking at South African mineral exports and what the effect of that is on SA.
Copyright economistscoza 6
Copyright economistscoza (#)
Copyright economistscoza (#)
Copyright economistscoza (#)
Copyright economistscoza (#)

Copyright economistscoza (#)
Copyright economistscoza 12
Copyright economistscoza (#)
This is a brand new index of the total logistics sector.
Copyright economistscoza14
-15%
-10%
-5%
0%
5%
10%
15% Ja
n-1
2
Ap
r-1
2
Jul-
12
Oct
-12
Jan
-13
Ap
r-1
3
Jul-
13
Oct
-13
Jan
-14
Ap
r-1
4
Jul-
14
Oct
-14
Jan
-15
Ap
r-1
5
Jul-
15
Oct
-15
Jan
-16
Ap
r-1
6
Jul-
16
Oct
-16
Jan
-17
Ap
r-1
7
Jul-
17
Sea Freight
Air Freight
Copyright economistscoza (#)

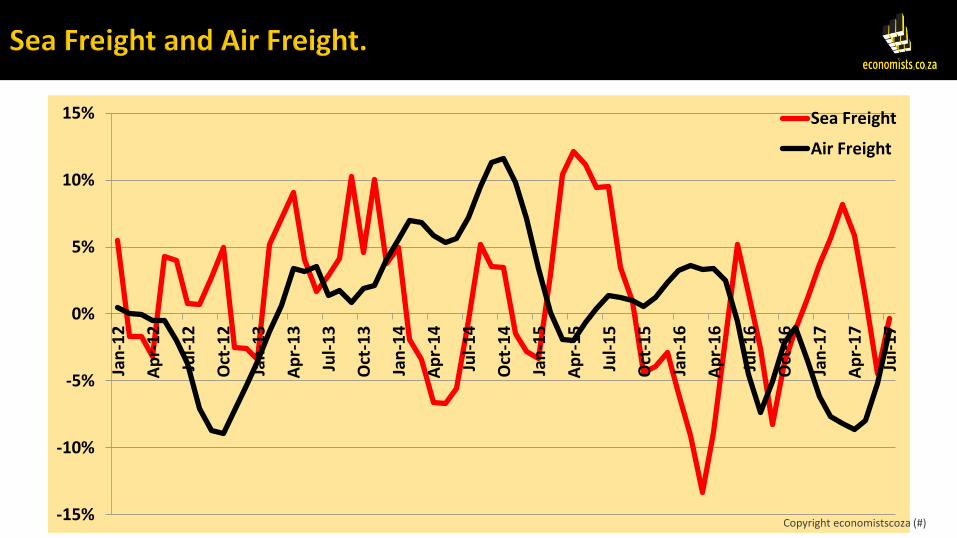
Container traffic is down by 0.2%. Break Bulk declined with 7% on a year ago. Bulk commodities are up 15.2%.
All of the above is for moving three month averages on a year ago basis.
The volatile nature here has been present since the end of the commodity boom at the end of 2011.
Containers used to grow fastest but now containers are very dependant on consumer spending in SA.
There will be a bounce back in containers but other than cars, break bulk traffic remains under pressure.
Copyright economistscoza (#)
-15%
-10%
-5%
0%
5%
10%
15%
20% Ja
n-1
2
Ap
r-1
2
Jul-
12
Oct
-12
Jan
-13
Ap
r-1
3
Jul-
13
Oct
-13
Jan
-14
Ap
r-1
4
Jul-
14
Oct
-14
Jan
-15
Ap
r-1
5
Jul-
15
Oct
-15
Jan
-16
Ap
r-1
6
Jul-
16
Oct
-16
Jan
-17
Ap
r-1
7
Jul-
17
Road Freight
Rail Freight
Copyright economistscoza (#)
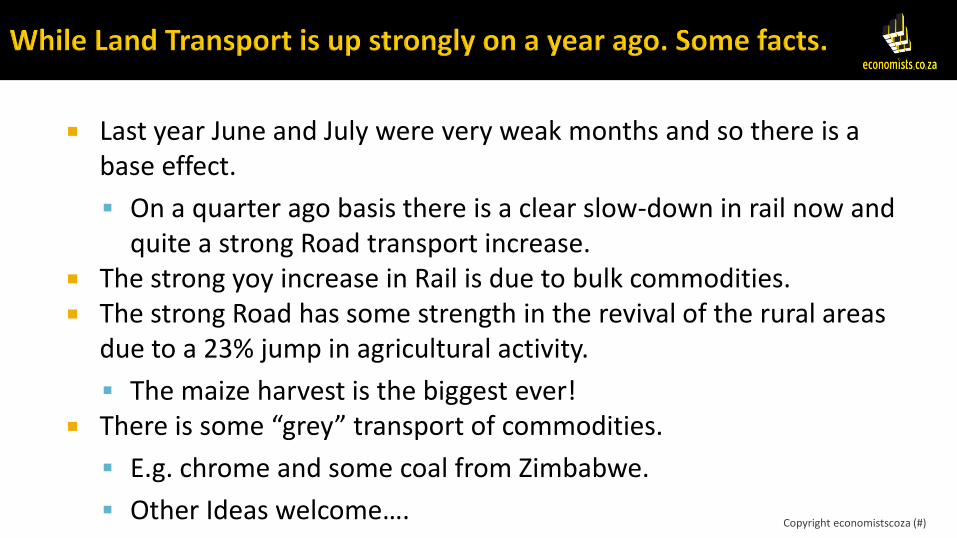
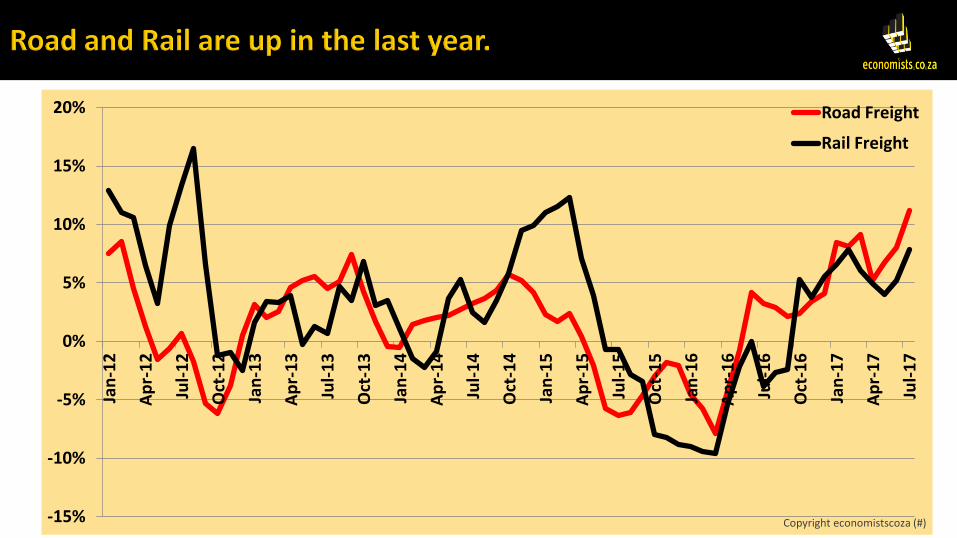
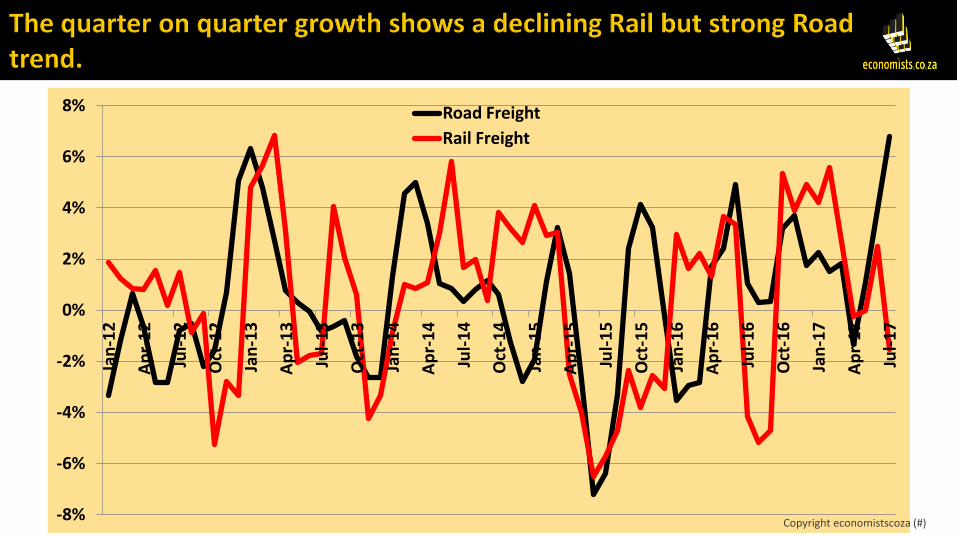
Last year June and July were very weak months and so there is a base effect.
On a quarter ago basis there is a clear slow-down in rail now and quite a strong Road transport increase.
The strong yoy increase in Rail is due to bulk commodities. The strong Road has some strength in the revival of the rural areas
due to a 23% jump in agricultural activity.
The maize harvest is the biggest ever! There is some “grey” transport of commodities.
E.g. chrome and some coal from Zimbabwe.
Other Ideas welcome…. Copyright economistscoza (#)
-8%
-6%
-4%
-2%
0%
2%
4%
6%
8% Ja
n-1
2
Ap
r-1
2
Jul-
12
Oct
-12
Jan
-13
Ap
r-1
3
Jul-
13
Oct
-13
Jan
-14
Ap
r-1
4
Jul-
14
Oct
-14
Jan
-15
Ap
r-1
5
Jul-
15
Oct
-15
Jan
-16
Ap
r-1
6
Jul-
16
Oct
-16
Jan
-17
Ap
r-1
7
Jul-
17
Road Freight
Rail Freight
Copyright economistscoza (#)
-6%
-4%
-2%
0%
2%
4%
6%
8%
10%
12%
14% Ja
n-1
2
Ap
r-1
2
Jul-
12
Oct
-12
Jan
-13
Ap
r-1
3
Jul-
13
Oct
-13
Jan
-14
Ap
r-1
4
Jul-
14
Oct
-14
Jan
-15
Ap
r-1
5
Jul-
15
Oct
-15
Jan
-16
Ap
r-1
6
Jul-
16
Oct
-16
Jan
-17
Ap
r-1
7
Jul-
17
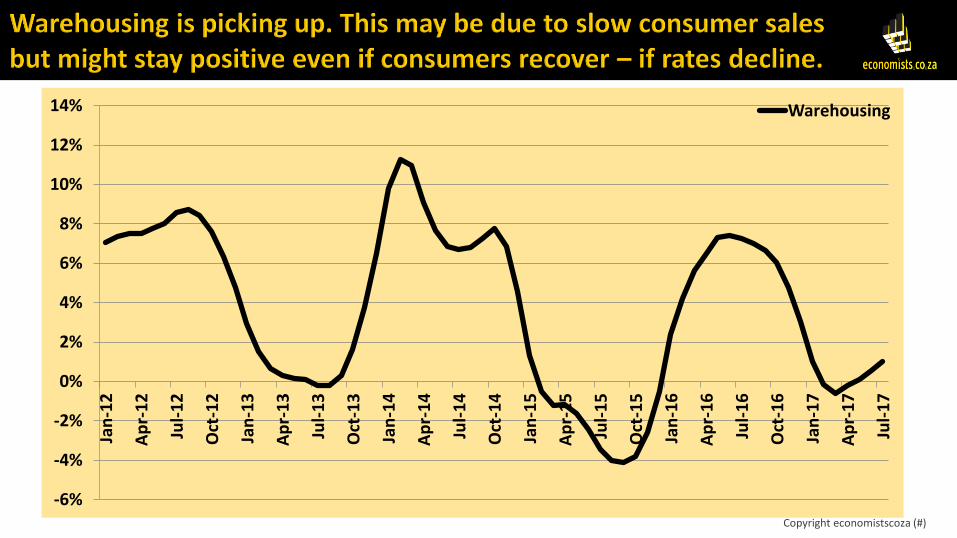
Warehousing
Copyright economistscoza (#)

-15%
-10%
-5%
0%
5%
10%
15%
20%
Jan
-12
Ap
r-1
2
Jul-
12
Oct
-12
Jan
-13
Ap
r-1
3
Jul-
13
Oct
-13
Jan
-14
Ap
r-1
4
Jul-
14
Oct
-14
Jan
-15
Ap
r-1
5
Jul-
15
Oct
-15
Jan
-16
Ap
r-1
6
Jul-
16
Oct
-16
Jan
-17
Ap
r-1
7
Jul-
17
Pipeline volumes
Pipeline volumes
Copyright economistscoza (#)
-24%
-12%
0%
12%
24%
36%
48%
-10%
-5%
0%
5%
10%
15%
20% Ja
n-2
00
5
Jul-
20
05
Jan
-20
06
Jul-
20
06
Jan
-20
07
Jul-
20
07
Jan
-20
08
Jul-
20
08
Jan
-20
09
Jul-
20
09
Jan
-20
10
Jul-
20
10
Jan
-20
11
Jul-
20
11
Jan
-20
12
Jul-
20
12
Jan
-20
13
Jul-
20
13
Jan
-20
14
Jul-
20
14
Jan
-20
15
Jul-
20
15
Jan
-20
16
Jul-
20
16
Jan
-20
17
Jul-
20
17
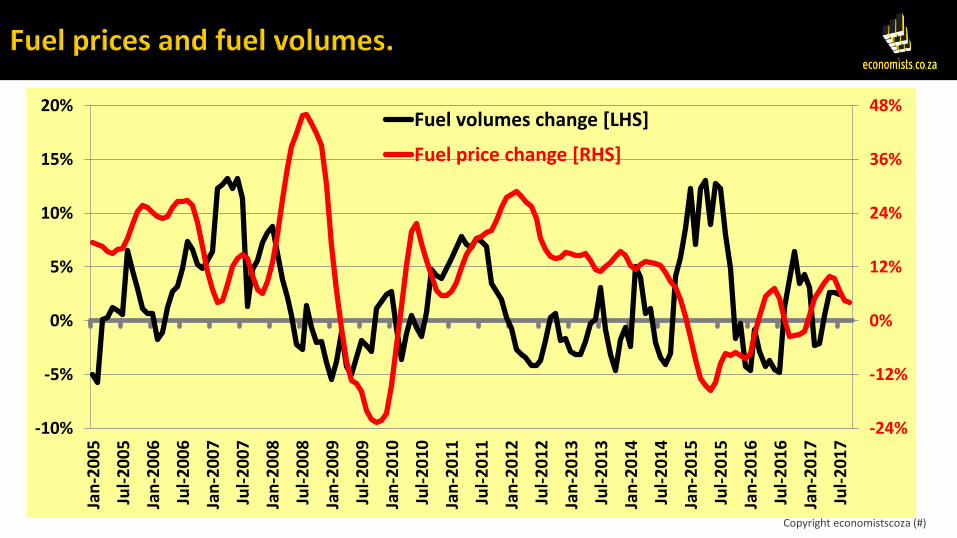
Fuel volumes change [LHS]
Fuel price change [RHS]
Copyright economistscoza (#)
The fuel volumes also have to do with the price trend as prices increase - consumers stock up on cheaper stock at first and then seemingly use less.
After a slight delay then high prices bring lower volumes and less fuel pumped up or down.
Fuel is the biggest commodity we believe in the pipelines.
Copyright economistscoza (#)
Copyright economistscoza (#)
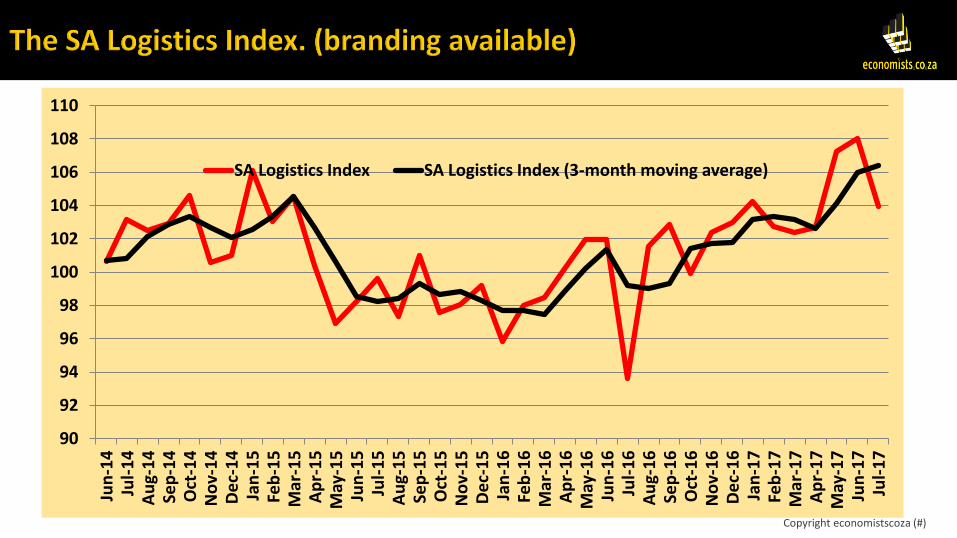
90
92
94
96
98
100
102
104
106
108
110 Ju
n-1
4
Jul-
14
A
ug-
14
Se
p-1
4
Oct
-14
N
ov-
14
D
ec-
14
Ja
n-1
5
Feb
-15
M
ar-1
5
Ap
r-1
5
May
-15
Ju
n-1
5
Jul-
15
A
ug-
15
Se
p-1
5
Oct
-15
N
ov-
15
D
ec-
15
Ja
n-1
6
Feb
-16
M
ar-1
6
Ap
r-1
6
May
-16
Ju
n-1
6
Jul-
16
A
ug-
16
Se
p-1
6
Oct
-16
N
ov-
16
D
ec-
16
Ja
n-1
7
Feb
-17
M
ar-1
7
Ap
r-1
7
May
-17
Ju
n-1
7
Jul-
17
SA Logistics Index SA Logistics Index (3-month moving average)
Copyright economistscoza (#)
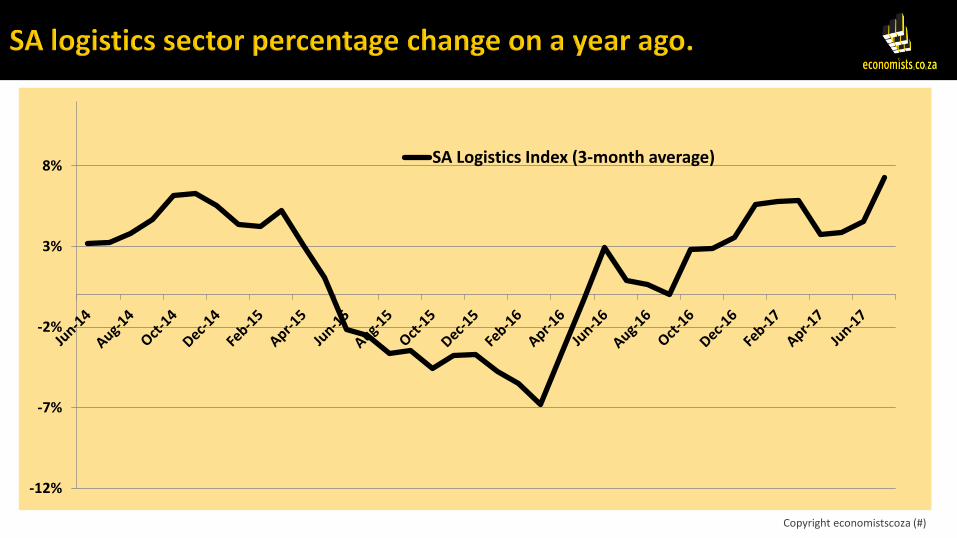
-12%
-7%
-2%
3%
8% SA Logistics Index (3-month average)
Copyright economistscoza (#)
Economists.co.za understands the importance of providing you with the latest and most accurate Logistics Statistics. We are looking to partner with a Logistics targeted audience, to provide you with the tools to better position your business for success. After all isn’t the focus to be one step ahead in this ever changing logistics arena to increase your sales and reach.
Copyright economistscoza 27