The Sources and Uses of Survey Data on Armenia
26
Overview BEEPS LiTS Population Census Household Surveys Extra Slides The Sources and Uses of Survey Data on Armenia Shushanik Hakobyan University of Virginia September 18, 2009
-
Upload
crrc-armenia -
Category
Documents
-
view
1.442 -
download
0
description
Transcript of The Sources and Uses of Survey Data on Armenia

Overview BEEPS LiTS Population Census Household Surveys Extra Slides
The Sources and Uses of Survey Data onArmenia
Shushanik Hakobyan
University of Virginia
September 18, 2009

Overview BEEPS LiTS Population Census Household Surveys Extra Slides
Outline
1 Overview of Micro Data
2 Business Environment and Enterprise Performance Survey(BEEPS)
3 Life in Transition (LiTS)
4 2001 Population Census
5 Household Surveys

Overview BEEPS LiTS Population Census Household Surveys Extra Slides
Types of Micro Data
Unit of observationA firmAn individual
Data structureCross-section data: Observations on a set of variables in agiven period, t, for individual units i=1,2,. . . ,n.Independent cross-sections => Pooled dataPanel (or longitudinal) data
Overview BEEPS LiTS Population Census Household Surveys Extra Slides
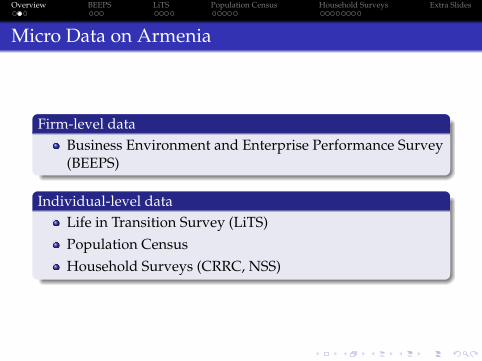
Micro Data on Armenia
Firm-level dataBusiness Environment and Enterprise Performance Survey(BEEPS)
Individual-level dataLife in Transition Survey (LiTS)Population CensusHousehold Surveys (CRRC, NSS)

Overview BEEPS LiTS Population Census Household Surveys Extra Slides
Sample Questions
Sample Questions
How tax evasion varies with frequency of bribes to tax officials?How likely are the individuals in one income group to move up,down, or remain in the same income group over time?How remittances influence spending on education?What is the pattern of educational assortative mating inArmenia? Do women marry up, down, or men with the sameeducational attainment?What is the return to education in Armenia (do wages rise witheducational attainment)?How to measure income distribution using household surveys?
Overview BEEPS LiTS Population Census Household Surveys Extra Slides
Firm-Level Data
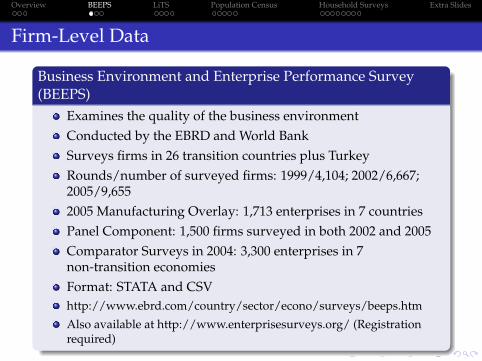
Business Environment and Enterprise Performance Survey(BEEPS)
Examines the quality of the business environmentConducted by the EBRD and World BankSurveys firms in 26 transition countries plus TurkeyRounds/number of surveyed firms: 1999/4,104; 2002/6,667;2005/9,6552005 Manufacturing Overlay: 1,713 enterprises in 7 countriesPanel Component: 1,500 firms surveyed in both 2002 and 2005Comparator Surveys in 2004: 3,300 enterprises in 7non-transition economiesFormat: STATA and CSVhttp://www.ebrd.com/country/sector/econo/surveys/beeps.htm
Also available at http://www.enterprisesurveys.org/ (Registrationrequired)

Overview BEEPS LiTS Population Census Household Surveys Extra Slides
Application of BEEPS
How tax evasion varies with frequency of bribes to tax officials?
Fraction of Sales Concealed by Frequency of Bribes to Tax Officials
Variable Mean Std. Dev. N
1 Never 0.12 0.21 2,4452 Seldom 0.21 0.25 7633 Sometimes 0.21 0.24 7294 Frequently 0.28 0.27 4555 Usually 0.31 0.27 2366 Always 0.31 0.28 1817 Not Reported 0.18 0.28 288
Total 0.18 0.25 5,097Missing – – 643
Source: Joulfaian, David, Bribes and Business Tax Evasion

Overview BEEPS LiTS Population Census Household Surveys Extra Slides
Determinants of Tax EvasionTobit estimates of Determinants of Tax Evasiona
aEstimates control for industry, size and country.
* Significant at the 5 percent level, ** at 10 percent level.
Overview BEEPS LiTS Population Census Household Surveys Extra Slides
Individual-Level Data
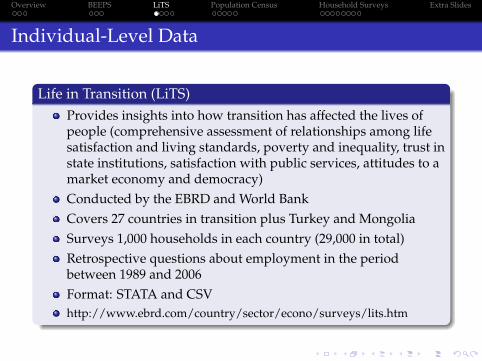
Life in Transition (LiTS)Provides insights into how transition has affected the lives ofpeople (comprehensive assessment of relationships among lifesatisfaction and living standards, poverty and inequality, trust instate institutions, satisfaction with public services, attitudes to amarket economy and democracy)Conducted by the EBRD and World BankCovers 27 countries in transition plus Turkey and MongoliaSurveys 1,000 households in each country (29,000 in total)Retrospective questions about employment in the periodbetween 1989 and 2006Format: STATA and CSVhttp://www.ebrd.com/country/sector/econo/surveys/lits.htm
Overview BEEPS LiTS Population Census Household Surveys Extra Slides
LiTS: Income Mobility
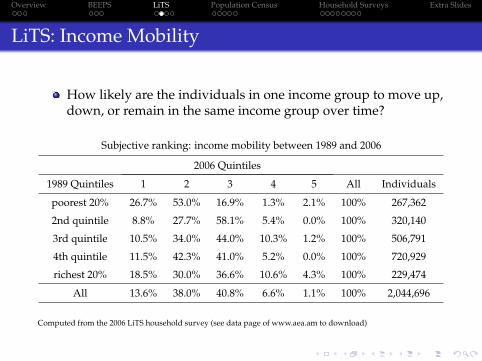
How likely are the individuals in one income group to move up,down, or remain in the same income group over time?
Subjective ranking: income mobility between 1989 and 2006
2006 Quintiles
1989 Quintiles 1 2 3 4 5 All Individuals
poorest 20% 26.7% 53.0% 16.9% 1.3% 2.1% 100% 267,362
2nd quintile 8.8% 27.7% 58.1% 5.4% 0.0% 100% 320,140
3rd quintile 10.5% 34.0% 44.0% 10.3% 1.2% 100% 506,791
4th quintile 11.5% 42.3% 41.0% 5.2% 0.0% 100% 720,929
richest 20% 18.5% 30.0% 36.6% 10.6% 4.3% 100% 229,474
All 13.6% 38.0% 40.8% 6.6% 1.1% 100% 2,044,696
Computed from the 2006 LiTS household survey (see data page of www.aea.am to download)

Overview BEEPS LiTS Population Census Household Surveys Extra Slides
LiTS: Remittances and Education Spending
How remittances influence spending on education?
Summary StatisticsNo Remittances With Remittances
Variables of interest Mean Std Dev Mean Std Dev
Education Expenditures 184 363 389 555
Health Expenditures 98 227 148 302
Male 71% 46% 55% 50%
Age of Head 50 14 50 17
School age children 1.79 0.83 1.70 0.86
University education 17.8% 38.3% 25.3% 43.7%
Post-graduate education 0.4% 6.0% 0.0% 0.0%
Receive social benefits 20.2% 40.2% 9.9% 30.0%
Gifts from locals 2.0% 13.9% 6.6% 25.0%
Observations 461 91
Overview BEEPS LiTS Population Census Household Surveys Extra Slides
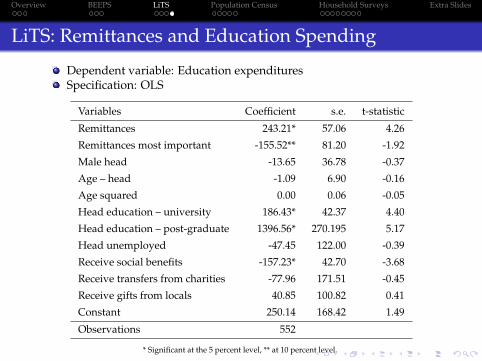
LiTS: Remittances and Education Spending
Dependent variable: Education expendituresSpecification: OLS
Variables Coefficient s.e. t-statistic
Remittances 243.21* 57.06 4.26
Remittances most important -155.52** 81.20 -1.92
Male head -13.65 36.78 -0.37
Age – head -1.09 6.90 -0.16
Age squared 0.00 0.06 -0.05
Head education – university 186.43* 42.37 4.40
Head education – post-graduate 1396.56* 270.195 5.17
Head unemployed -47.45 122.00 -0.39
Receive social benefits -157.23* 42.70 -3.68
Receive transfers from charities -77.96 171.51 -0.45
Receive gifts from locals 40.85 100.82 0.41
Constant 250.14 168.42 1.49
Observations 552
* Significant at the 5 percent level, ** at 10 percent level.
Overview BEEPS LiTS Population Census Household Surveys Extra Slides
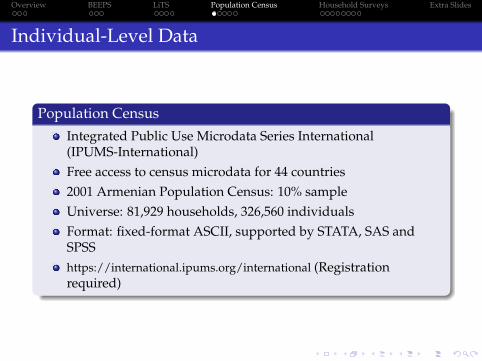
Individual-Level Data
Population Census
Integrated Public Use Microdata Series International(IPUMS-International)Free access to census microdata for 44 countries2001 Armenian Population Census: 10% sampleUniverse: 81,929 households, 326,560 individualsFormat: fixed-format ASCII, supported by STATA, SAS andSPSShttps://international.ipums.org/international (Registrationrequired)

Overview BEEPS LiTS Population Census Household Surveys Extra Slides
Educational Assortative Mating
Definition: Positive (negative) assortative mating on a characteristicmeans that individuals tend to match with partners who are similar(dissimilar) with respect to that characteristic.
Do the Armenian women marry up, down, or men with the sameeducational attainment? How these choices change across different agecohorts and how differences in age, among others, influence the choicesmade?
Data: 2001 Armenian Population Census
Restricted to women born between 1921 and 1970: 46,653 couplesObserve age, educational attainment, province or region ofresidenceMeasures of educational attainment
1 up to 3 years of primary education2 lower secondary or 4-8 years3 higher secondary4 professional5 university graduate

Overview BEEPS LiTS Population Census Household Surveys Extra Slides
Descriptive Statistics
Source: Hakobyan, Shushanik and David Joulfaian, Educational Assortative Mating in Armenia

Overview BEEPS LiTS Population Census Household Surveys Extra Slides
Educational attainment of partners by female birth cohorts

Overview BEEPS LiTS Population Census Household Surveys Extra Slides
Ordered Probit Estimates of Choices
Estimates control for region fixed effects.
Overview BEEPS LiTS Population Census Household Surveys Extra Slides
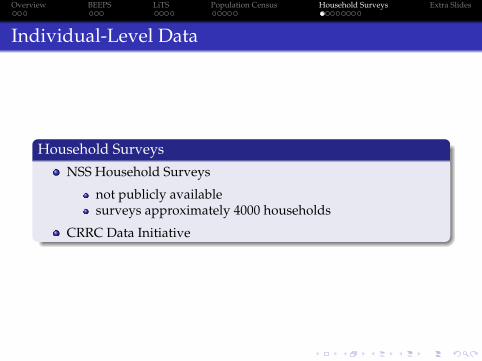
Individual-Level Data
Household Surveys
NSS Household Surveys
not publicly availablesurveys approximately 4000 households
CRRC Data Initiative
Overview BEEPS LiTS Population Census Household Surveys Extra Slides
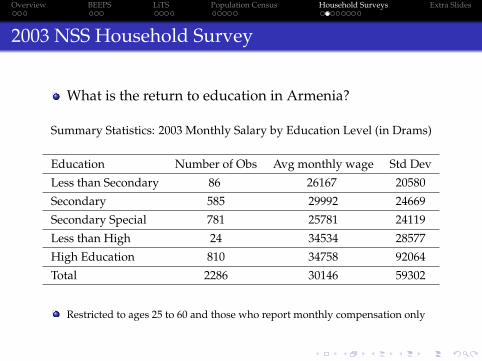
2003 NSS Household Survey
What is the return to education in Armenia?
Summary Statistics: 2003 Monthly Salary by Education Level (in Drams)
Education Number of Obs Avg monthly wage Std Dev
Less than Secondary 86 26167 20580
Secondary 585 29992 24669
Secondary Special 781 25781 24119
Less than High 24 34534 28577
High Education 810 34758 92064
Total 2286 30146 59302
Restricted to ages 25 to 60 and those who report monthly compensation only

Overview BEEPS LiTS Population Census Household Surveys Extra Slides
OLS: Return to Education
wi = β0 + β1Agei + β2Age2
i+ β3Secondi + β4Secspeci+
+β5Lesshighi + β6Highi + β7Femalei + ε i
All Women only Men only
Variable Coef. t-stat Coef. t-stat Coef. t-stat
Age 2338** 1.82 485 0.49 3502 1.47
Age squared -27** -1.77 -6 -0.94 -41 -1.44
Secondary 5494 0.82 5148** 1.69 5016 0.44
Secondary Special 4525 0.68 1981 0.97 4730 0.42
Less than High 12826 0.95 7122 0.67 16080 0.63
High Education 13135* 1.98 5387 1.37 18758** 1.66
Female -22051* -8.96
Constant -14828 -0.56 5172** 1.81 -40109 -0.81
Overview BEEPS LiTS Population Census Household Surveys Extra Slides
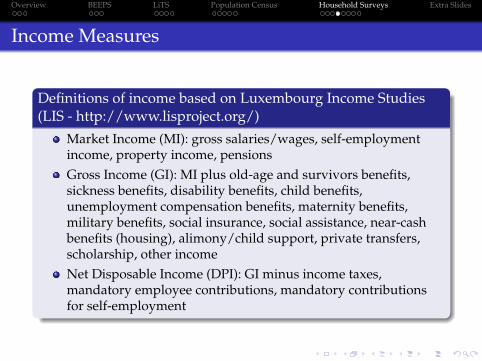
Income Measures
Definitions of income based on Luxembourg Income Studies(LIS - http://www.lisproject.org/)
Market Income (MI): gross salaries/wages, self-employmentincome, property income, pensionsGross Income (GI): MI plus old-age and survivors benefits,sickness benefits, disability benefits, child benefits,unemployment compensation benefits, maternity benefits,military benefits, social insurance, social assistance, near-cashbenefits (housing), alimony/child support, private transfers,scholarship, other incomeNet Disposable Income (DPI): GI minus income taxes,mandatory employee contributions, mandatory contributionsfor self-employment

Overview BEEPS LiTS Population Census Household Surveys Extra Slides
Income Distribution
Highly skewed distribution0
1020
3040
Per
cent
0 100000 200000 300000Household Market Income
Market Income Distribution

Overview BEEPS LiTS Population Census Household Surveys Extra Slides
Lorenz Curve and Gini Coefficient
Lorenz curve of market incomeStata command: glcurve varname, lorenz
Gini coefficient of market income = 0.52Stata command: ineqdeco varname
Overview BEEPS LiTS Population Census Household Surveys Extra Slides
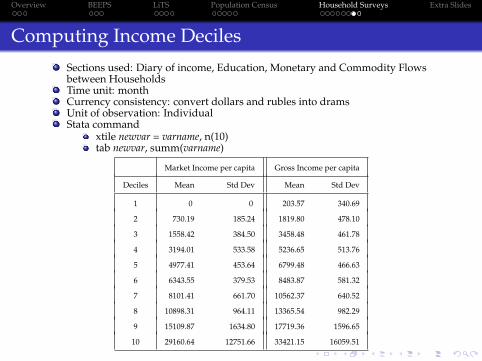
Computing Income DecilesSections used: Diary of income, Education, Monetary and Commodity Flowsbetween HouseholdsTime unit: monthCurrency consistency: convert dollars and rubles into dramsUnit of observation: IndividualStata command
xtile newvar = varname, n(10)tab newvar, summ(varname)
Market Income per capita Gross Income per capita
Deciles Mean Std Dev Mean Std Dev
1 0 0 203.57 340.69
2 730.19 185.24 1819.80 478.10
3 1558.42 384.50 3458.48 461.78
4 3194.01 533.58 5236.65 513.76
5 4977.41 453.64 6799.48 466.63
6 6343.55 379.53 8483.87 581.32
7 8101.41 661.70 10562.37 640.52
8 10898.31 964.11 13365.54 982.29
9 15109.87 1634.80 17719.36 1596.65
10 29160.64 12751.66 33421.15 16059.51

Overview BEEPS LiTS Population Census Household Surveys Extra Slides
Thank you!For questions, please email
Overview BEEPS LiTS Population Census Household Surveys Extra Slides
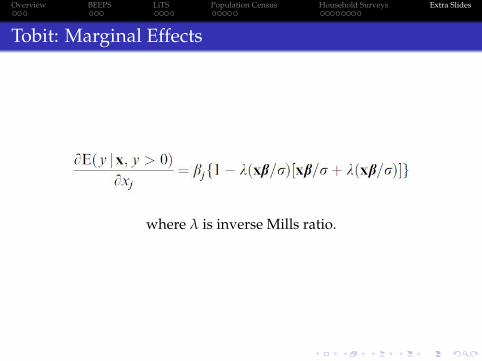
Tobit: Marginal Effects
where λ is inverse Mills ratio.