THE SOCIO-ECONOMIC IMPACT OF GAMBLING IN THE EASTERN CAPE ...€¦ · the socio-economic impact of...
126
THE SOCIO-ECONOMIC IMPACT OF LEGALIZED GAMBLING IN THE EASTERN CAPE PROVINCE ISBN: 978-0-621-39980-6
Transcript of THE SOCIO-ECONOMIC IMPACT OF GAMBLING IN THE EASTERN CAPE ...€¦ · the socio-economic impact of...
THE SOCIO-ECONOMIC IMPACT OF LEGALIZED GAMBLING IN THE EASTERN CAPE
PROVINCE
ISBN: 978-0-621-39980-6
2
2009
Acknowledgements
The Board of Directors of the Eastern Cape, led by former Chairperson Mr Sipho Luyolo Mtika Majombozi, has always wanted to gain an understanding of the industry. This, they believed, would assist in gambling policy formulation, overall regulation of the industry as well as assist in planning and formulating interventions, such as responsible gambling programmes, avail empirical data about the industry in the province.
After successfully establishing a research unit the Board managed to commission a study which was undertaken by TNS Research Survey, one of South Africa‟s leading market research companies. They were assisted by a well known gaming industry experts, Economic Information Services based in Cape Town.
The Board would like to extend a special gratitude to the gambling industry in the province for willingly participating and contributing valuable data as required by the project.
This report was compiled by TNS Research Surveys (Political and Social Unit) and Economics Information Services.
Contact Person: Kim Larsen (Business Head, TNS Research Surveys), Tel: 011 778 7500
Authors: Megan van Vuuren, Barry Standish, Antony Boting, Brian Swing, Lesley Powell and Kim Larsen
The project was managed by Monde Duma, Manager: Research and Communication (ECGBB), Tel: 043 7028300
EXCLUSION OF CLAIMS
Despite all efforts to ensure accuracy in the assembly of information and data or the compilation thereof, ECGBB is unable to warrant the accuracy of the information, data and compilations as contained in this report. Readers are deemed to have waived and renounced all rights to any claim against the above-mentioned institution and their officers for any loss or damage of any nature whatsoever arising from the use or reliance upon such information, data or compilations.
3
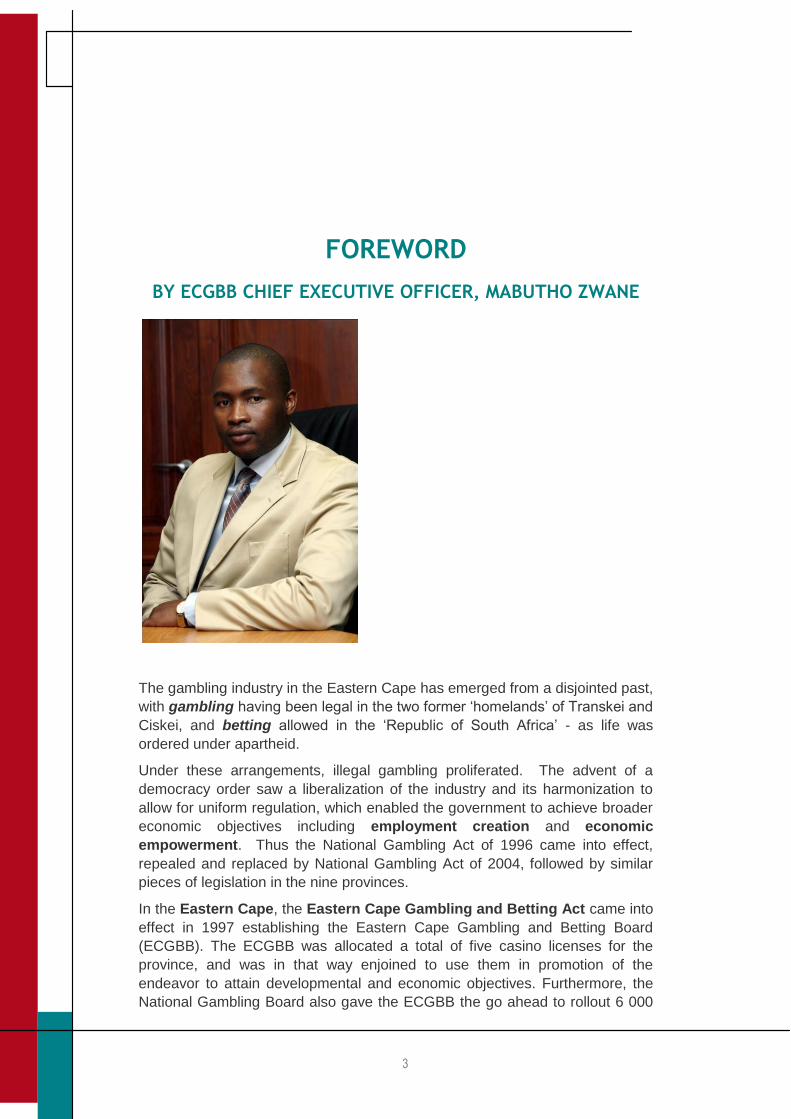
FOREWORD
BY ECGBB CHIEF EXECUTIVE OFFICER, MABUTHO ZWANE
The gambling industry in the Eastern Cape has emerged from a disjointed past,
with gambling having been legal in the two former „homelands‟ of Transkei and
Ciskei, and betting allowed in the „Republic of South Africa‟ - as life was
ordered under apartheid.
Under these arrangements, illegal gambling proliferated. The advent of a
democracy order saw a liberalization of the industry and its harmonization to
allow for uniform regulation, which enabled the government to achieve broader
economic objectives including employment creation and economic
empowerment. Thus the National Gambling Act of 1996 came into effect,
repealed and replaced by National Gambling Act of 2004, followed by similar
pieces of legislation in the nine provinces.
In the Eastern Cape, the Eastern Cape Gambling and Betting Act came into
effect in 1997 establishing the Eastern Cape Gambling and Betting Board
(ECGBB). The ECGBB was allocated a total of five casino licenses for the
province, and was in that way enjoined to use them in promotion of the
endeavor to attain developmental and economic objectives. Furthermore, the
National Gambling Board also gave the ECGBB the go ahead to rollout 6 000
4
Limited Payout Machines (LPM‟s) and the concomitant right to license. Since
then, the main gambling modes that the ECGBB has regulated are the casino,
horseracing as well as the Limited Payout Machine industries, and related
activity.
Since then, no empirical data existed to guide either policy formulation in the
province or to shed enlightenment on gambling operations in general. The
commitment of the Board of Directors of ECGBB to efficiently regulating the
industry on an informed basis, and to place on a higher plane the enterprise of
regulating for socio-economic development led to the commissioning of this
report.
The study was designed to be representative of the Eastern Cape adult
population and was conducted in all six district municipalities of the province.
The study covers, inter alia, the following critical areas:
attitudes towards gambling,
participation in gambling activities,
economic impact of gambling and
the extent of problem gambling.
The study contains invaluable information and serves as an important baseline
data reference for all efforts at monitoring and evaluating progress made in our
implementation of ECGBB mandate.
The information contained in the report will be found useful by various
stakeholders and role players including government, the gambling industry,
the public, research organizations, academic institutions, and by many
others.
On behalf of the Eastern Cape Gambling and Betting Board I am exceedingly
pleased to, in presenting the report, extend appreciation to the following for the
professionalism with which they approached this important assignment: the
consortium members of TNS Research Surveys and EIS – Mrs Megan van
Vuuren, Ms Kim Larsen, Messrs Brian Swing and Lesley Powell;
economists – Messrs Antony Boting and Barry Standish; Professor Peter
Collins for his expert guidance on methodology and questions.
Monde Duma is the research manager of the ECGBB. He coordinated the
whole enterprise and over-extended himself in the process to ensure the
delivery of a credible, if authoritative, product.
____________________________ RM ZWANE CHIEF EXECUTIVE
5
CONTENTS
EXECUTIVE SUMMARY ..................................................................................................... 14 Attitudes to gambling ..................................................................................................... 16 Economic impact ..................................................................................................... 16 Macro economic contribution ............................................................................................ 16 Job creation ....................................................................................................................... 17 Corporate social investment ............................................................................................. 17 Contribution to tourism ...................................................................................................... 18 Property prices .................................................................................................................. 18 Displacement effects ......................................................................................................... 18 Income levels of gamblers ................................................................................................ 19 SECTION A (The Background) ............................................................................................. 21 1. INTRODUCTION ............................................................................................................... 22 1.1 The provincial context .............................................................................................. 22 1.2 The legislative framework ........................................................................................ 23 1.3 Concerns with gambling ........................................................................................... 25 1.4 Reseach objective .................................................................................................... 27 1.5 The structure of this report ....................................................................................... 28 2. THE METHODOLOGICAL APPROACH .......................................................................... 29 2.1 Frameworks for determining the socio-economic impact of gambling ..................... 29 2.2 Determining the costs and benefits of gambling ...................................................... 32 2.3 Indicators used in the 2009 Eastern Cape gambling survey ................................... 34 2.4 Econometric data ..................................................................................................... 35 2.5 Household survey .................................................................................................... 36 2.6 Intercept survey ..................................................................................................... 40 2.7 Qualitative data collection approaches .................................................................... 41 SECTION B (Gambling Participation) .................................................................................. 44 3. PARTICIPATION IN GAMBLING ACTIVITIES ................................................................ 45 3.1 The gambling industry in the Eastern Cape ............................................................. 45 3.2 Participation in gambling activities ........................................................................... 46 3.3 Commitment to gambling mode ............................................................................... 48 3.4 Demographic character of gambling participants..................................................... 51 3.5 Conclusion ................................. .................................................................... 62 SECTION C (The Social Impact of Gambling) ..................................................................... 66 4. PROBLEM GAMBLING.................................................................................................... 67 4.1 Incidence of problem gambling across studies ....................................................... 69 4.2 Problem gambling across modes ............................................................................ 70 4.3 Demographic profile of problem gamblers .............................................................. 73 4.4 Gambling risk (CPGI) .............................................................................................. 78 4.5 Reasons for gambling ............................................................................................. 80 4.6 Conclusion ............................................................................................................... 81
6
5. ATTITUDES TO GAMBLING ........................................................................................... 82 5.1 Acceptability of gambling......................................................................................... 82 5.2 The importance of gambling as a form of leisure .................................................... 85 5.3 Reasons for gambling ............................................................................................. 86 5.4 Attitudes to youth gambling ..................................................................................... 89 6. PERSPECTIVES OF THE IMPACT OF GAMBLING ....................................................... 91 6.1 Gambling Impact Index ........................................................................................... 91 6.2 Attitudes to gambling ............................................................................................... 92 6.3 Attitudes to gambling by demographic criteria ........................................................ 98 6.4 Attitudes to gambling by CPGI risk segments ......................................................... 99 6.5 Attitudes towards winning and losing ...................................................................... 99 6.6 Attitudes towards discipline ................................................................................... 101 6.7 Attitudes towards gambling and substance abuse ................................................ 102 6.8 Gambler self-reported impact ................................................................................ 103 6.9 The impact of gambling on the household ............................................................ 105 6.10 The regulation of the gambling industry ................................................................ 105 6.11 Conclusion ............................................................................................................. 107 SECTION D (The Economic Impact of Gambling) ............................................................ 109 7. THE MACRO ECONOMIC IMPACT OF GAMBLING .................................................... 110 7.1 Gross Domestic Product (GDP) ............................................................................ 110 7.2 Gross Geographic Product (GGP) ........................................................................ 111 7.3 Gaming Taxes ....................................................................................................... 111 7.4 Indirect household income .................................................................................... 112 7.5 Job creation ........................................................................................................... 112 7.6 Corporate social investment .................................................................................. 113 7.7 Tourism.................................................................................................................. 113 7.8 Property values ..................................................................................................... 115 8. DISPLACEMENT EFFECTS .......................................................................................... 118 8.1 Displacement by essential versus non-essential spending ................................... 119 8.2 Gambling expenditure ........................................................................................... 120 SECTION E (SUMMARY) ..................................................................................................... 122 9. SUMMARY ...................................................................................................................... 123 9.1 Incidence of gambling ........................................................................................... 123 9.2 Perceptions of gambling ........................................................................................ 123 9.3 Youth and gambling .............................................................................................. 123 9.4 Informal gambling .................................................................................................. 124 9.5 Problem gambling ................................................................................................. 124 9.6 Economic impact of gamnling ............................................................................... 124
7
LIST OF TABLES
Table 1 The sample
Table 2 Profile of participation across gambling modes
Table 3 Profile of most often participation across gambling modes
Table 4 Participation across informal gambling modes
Table 5 Participation by area type across gambling modes
Table 6 Location of gambling activities
Table 7 Frequency of participation in gambling modes located less than 10
minutes from home
Table 8 Desire for more gambling sites by district
Table 9 Participation by gambling mode and gender
Table 10 Participation by gambling mode across race groups
Table 11 Incidence of problem gambling by mode
Table 12 Gambling frequency
Table 13 CPGI risk segments by gambling mode
Table 14 Reasons for gambling
Table 15 Acceptability of gambling across gambler types
Table 16 Acceptability of gambling by importance of religion
Table 17 Importance of gambling as a form of entertainment
Table 18 Attitudes towards gambling – the positives: gamblers compared to
non-gamblers
Table 19 Attitudes towards gambling – the negatives: gamblers compared to
non-gamblers
Table 20 Self-reported gambling impact
Table 21 Awareness of gambling entities and support programmes
Table 22 Contribution to GDP
Table 23 Contribution to Eastern Cape GGP
Table 24 Contribution to direct and indirect taxes
Table 25 Contribution to indirect household income
Table 26 Contribution to direct and indirect job creation
Table 27 Contribution to corporate social investment
Table 28 Source of Wild Coast Sun GGR in 2007
Table 29 Boardwalk property price premium
Table 30 Hemingways property price premium
Table 31 Mean gambling spend
8
Table 32 Median gambling spend
9
LIST OF FIGURES
Figure 1 Frequency of participation across gambling modes
Figure 2 Commitment to gambling mode
Figure 3 Profile of participation by area type
Figure 4 Profile of participation by proximity to nearest bar or pub with slot
machines
Figure 5 Profile of participation by proximity to nearest horse or sports
betting outlet
Figure 6 Profile of participation by proximity to nearest casino
Figure 7 Profile of participation by gender
Figure 8 Profile of participation across age groups
Figure 9 Age at which gamblers started gambling regularly
Figure 10 Participation by mode amongst youth gamblers
Figure 11 Profile of participation across work status groups
Figure 12 Profile of participation across education levels
Figure 13 Profile of participation across monthly household income levels
Figure 14 Median monthly household income by gambling mode
Figure 15 Profile of participation across race groups
Figure 16 Profile of participation across religious groups
Figure 17 Profile of participation by importance of religion
Figure 18 Overview of gambling participation in the Eastern Cape
Figure 19 Comparative profiles of gambling trialists vs. non-trialists
Figure 20 Comparative profiles of regular gamblers vs. irregular gamblers
Figure 21 Incidence of problem gambling
Figure 22 Gambling and problem gambling participation compared
Figure 23 Gambling and problem gambling most often participation compared
Figure 24 Profile of problem gambling participation by area type
Figure 25 Incidence of problem gambling by district
Figure 26 Incidence of gambling more often if gambling site within 10 minutes
Figure 27 Profile of problem gambling participation by gender
Figure 28 Profile of problem gambling participation across age groups
Figure 29 Age at which problem gamblers started gambling regularly
Figure 30 Profile of problem gambling participation across work status groups
Figure 31 Profile of problem gambling participation across education levels
10
Figure 32 Profile of problem gambling participation across monthly household
income levels
Figure 33 Profile of problem gambling participation across race groups
Figure 34 CPGI risk segments
Figure 35 Acceptability of gambling
Figure 36 Against any form of gambling by gender
Figure 37 Against any form of gambling by area type
Figure 38 Against any form of gambling by age
Figure 39 Leisure activities enjoyed at least once every three months
Figure 40 Factors prompting the initiation into gambling
Figure 41 Six degrees of separation for non-gamblers
Figure 42 Reasons for gambling
Figure 43 Reasons for never trying gambling
Figure 44 Attitudes towards under-aged gambling
Figure 45 Gambling Impact Index
Figure 46 Associations with gambling held by the Eastern Cape population
Figure 47 Attitudes towards gambling – the positives
Figure 48 Attitudes towards gambling – the negatives
Figure 49 Profiling the Gambling Impact Index
Figure 50 How attitudes differ across CPGI segments
Figure 51 Attitudes towards winning
Figure 52 Attitudes towards losing
Figure 53 Attitudes towards discipline
Figure 54 Attitudes towards various aspects of gambling
Figure 55 Attitudes towards substances used when gambling
Figure 56 Statements about gamblers in the household
Figure 57 Displacement across categories
Figure 58 Displacement by essential versus non-essential expenditure
Figure 59 Gambling spend from most recent gambling activity
11
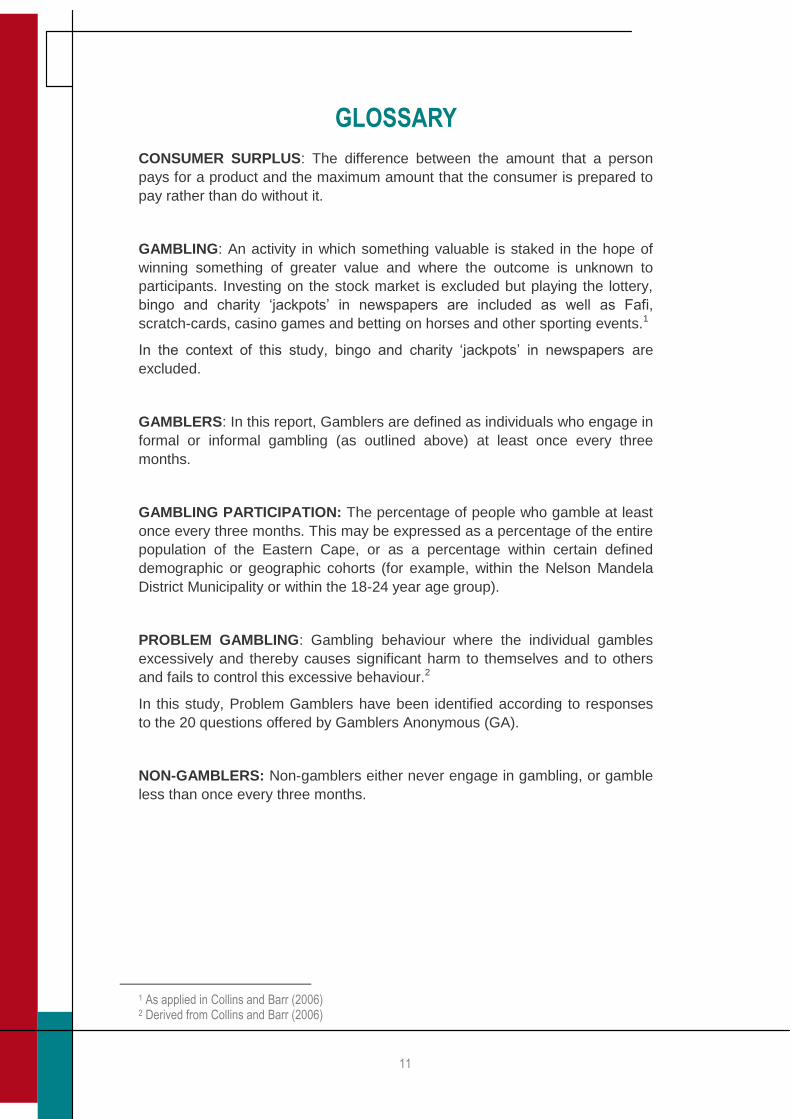
GLOSSARY
CONSUMER SURPLUS: The difference between the amount that a person
pays for a product and the maximum amount that the consumer is prepared to
pay rather than do without it.
GAMBLING: An activity in which something valuable is staked in the hope of
winning something of greater value and where the outcome is unknown to
participants. Investing on the stock market is excluded but playing the lottery,
bingo and charity „jackpots‟ in newspapers are included as well as Fafi,
scratch-cards, casino games and betting on horses and other sporting events.1
In the context of this study, bingo and charity „jackpots‟ in newspapers are
excluded.
GAMBLERS: In this report, Gamblers are defined as individuals who engage in
formal or informal gambling (as outlined above) at least once every three
months.
GAMBLING PARTICIPATION: The percentage of people who gamble at least
once every three months. This may be expressed as a percentage of the entire
population of the Eastern Cape, or as a percentage within certain defined
demographic or geographic cohorts (for example, within the Nelson Mandela
District Municipality or within the 18-24 year age group).
PROBLEM GAMBLING: Gambling behaviour where the individual gambles
excessively and thereby causes significant harm to themselves and to others
and fails to control this excessive behaviour.2
In this study, Problem Gamblers have been identified according to responses
to the 20 questions offered by Gamblers Anonymous (GA).
NON-GAMBLERS: Non-gamblers either never engage in gambling, or gamble
less than once every three months.
1 As applied in Collins and Barr (2006) 2 Derived from Collins and Barr (2006)
12
ACRONYMS
CASA Casino Association of South Africa
CPGI Canadian Problem Gambling Index
ECGBB Eastern Cape Gambling and Betting Board
GA Gamblers Anonymous
GDP Gross Domestic Product
GGP Gross Geographic Product
GGR Gross Gaming Revenue
LPMs Limited Payout Machines
NRGP National Responsible Gambling Programme
SAM Social Accounting Matrix
SU Small Urban
FY Financial Year
13
REPORT NOTES
This report exists as a synthesis of the reports produced during the 12 months
of the study on the socio-economic impact of the gambling industry in the
Eastern Cape. It draws liberally from the existing reports and frequently
references and refers the reader to these reports. The synthesis report
highlights the key findings and should be read in conjunction with the
background reports which exist as appendices to this document. These reports
are:
APPENDIX A: The economic impact of gambling in the Eastern Cape
APPENDIX B: The socio-economic impact of gambling in the Eastern Cape:
Findings of the qualitative study
APPENDIX C: The social impact of gambling in the Eastern Cape: Key
quantitative findings
Please note that all economic data presented, unless otherwise stated, refers
to gaming and gambling as it takes place in the casino, LPM and horse racing
industries in the Eastern Cape.
Also, the study focused on legal gambling, whilst participation and awareness
of illegal gambling is also reported on, online gambling was not a focus of the
study.
Small base sizes
Base sizes are reflected throughout the report and in some cases, an asterisk
will appear next to a base size. This indicates a small base size which must be
treated with caution.
*Note: Small base size
**Note: Extremely small base size – results indicative only
14
EXECUTIVE SUMMARY
Legalised gambling, with the exception of horse racing which has always been
legal, has been legal for more than a decade now. Since the legalization of
gambling in the Eastern Cape in 1997, all but one of the five provincial casino
licences have been issued and, of the 2 000 LPM licences awarded to the
province, a total of 1 345 LPMs have been rolled out that function across 252
LPM sites. The number these sites has since been reduced to 110 due to
liquidation of one of the two route operators in 2009.
Two legal casinos, the Wild Coast Sun and the Fish River Sun, were in the
Eastern Cape when gambling was liberalised. Today there are four casinos
with a fifth licence pending. These are the Wild Coast Sun in Bizana; Queens
Casino in Queenstown; Hemmingway's Casino Resort in East London; and
Boardwalk Casino and Entertainment World in Port Elizabeth. A pending
licence is expected to be located in Zone 4 (Mthatha or surrounding areas).
The Fish River Sun continues to operate as a holiday resort but no longer has
a casino licence.
The LPM industry is made up of route operators and site operators. Site
operators are the premises at which the LPMs are located which, in this
province, are taverns, clubs and pubs. The route operators lease the machines
to the site operators and give them logistical and other support. All sites are
linked electronically to the route operator. There are two route operators in the
Eastern Cape: Vukani and Luck At It. Luck At It has since been liquidated.
The horse racing industry is a wide and disparate industry that is made up of
horse breeders, horse trainers and racers, the race courses themselves (of
which there are two, Arlington and Fairview, both in Port Elizabeth) and the
betting industry. There are two types of betting operations: totalisator (tote)
betting and fixed odds betting. The difference between the two is that the tote is
a pool from all bets taken on a specific race while fixed odds betting is,
accurate to the description, a wager with fixed odds. Phumelela and Gold
Circle are the only licensed racing tote betting operators in South Africa
although only Phumelela is active in the Eastern Cape. There are seven fixed
odds bookmakers in the province.
Fifty six percent of the Eastern Cape population has gambled at some time in
their life and 39% can be considered regular gamblers (gamble at least once
every three months). The key difference between regular gamblers (gamblers)
and those who gamble less than once every three months rests in the
following:
Proximity to gambling site: Gamblers tend to live closer to gambling sites
Household income: Gamblers tend to be in the mid-range income band
(R1,200-R6,400 per month) whereas those who gamble less than once every
three months tend to be in the low income band (less than R1,200 per month)
Race and gender: Gamblers are most likely to be male and Coloured, while
those who gamble less than once every three months are most likely to be
female
15
Participation in gambling modes other than the lottery is undertaken by those
who have limited access to lottery, generally because they live in rural areas;
they are more likely to be young (18-24 years), black, have a low level of
education and limited income (LSM 1-3, not working). They tend to resort to
informal gambling, particularly dice games.
Those who only participate in the National Lottery and not any other forms of
gambling are more likely to be females, divorced, separated or widowed. Those
who participate in the lottery and other forms of gambling tend to live in
metropolitan areas (all forms of gambling easily accessible); are more likely to
be high income (LSM 7-10), working, educated and non-black.
The Eastern Cape has a problem gambling incidence of 2.8% which has
declined since 2001 when it had an incidence of 7.3% and 2003 when it had an
incidence of 4.1%.
The highest incidences of problem gambling are found amongst gamblers who
play at LPMs (28%), who play card games (25%) and who play dice games
(24%). The lowest is amongst gamblers who play the lottery (7%) and amongst
those who play scratch cards (8%).
Males have a greater propensity to become problem gamblers with 61% of
problem gamblers being male and 39% female. The highest incidence of
problem gambling of 5% is seen amongst Coloured people. White people have
the lowest incidence at 1%.
Attitudes to gambling
Attitudes to gambling in the province exist along a continuum from positive to
negative with a Gambling Impact Index score midway between positive and
negative (although leaning slightly towards the negative) of 48.6. The overall
attitude to gambling is strongly shaped by the individual‟s gambling behaviour
with the score derived from the responses provided by non-gamblers being
45.5, that from gamblers being more positive at 52.8 and the score from the
responses provided by problem gamblers being even more positive at 59.3.
The attitude is also shaped by proximity to others who gamble. Thirty eight
percent of non-gamblers who live with a gambler provided at least one negative
experience related to gambling, with 22% indicating that the gambler living in
their household has gambled until their last Rand was gone; 21% that gambling
makes them depressed; 19% that the gambler gambles to get money to pay
their debts and solve their financial problems, 16% that gambling leads to more
frequent drinking and smoking and 15% that gambling leads to arguments
about money in the home.
Negative attitudes to gambling are influenced by the harmful effects of
gambling on the individual and on society with key aspects being: (i) The
dangers involved in gambling; (ii) The costs of gambling and the implications
for gamblers who either cannot afford to gamble or, who are gambling in
excess of the money that they can afford to use for gambling; (iii) The
marketing of gambling which focuses on the positives of gambling and on the
possibility of winning without warning of the risks involved in gambling; and (iv)
The ease with which an individual can become addicted to gambling.
16
Positive attitudes are influenced by the entertainment value that the gambling
industry provides to individuals and the economic benefits of the industry to the
province. Specifically, the following key aspects were highlighted as positive
for the industry: (i) The industry provides entertainment that is fun, harmless
when used responsibly and that is safe for family and friends to enjoy together;
(ii) The gambling industry contributes to the community through local
investment and social corporate investment; and (iii) The gambling industry
makes a contribution to the local economy through casino revenue, the
provision of jobs and through attracting tourists into the Eastern Cape.
Almost half (49%) of the Eastern Cape population believe that gambling is
harmless when it is done responsibly; 44% believe that it is a fun leisure activity
and 42% that the gambling industry provides employment in the region.
Economic impact
The shift to legalised gambling and the growth in the sector since then have
been beneficial in several ways. First, they have given consumers an additional
choice of entertainment. Second, they have largely eradicated the illegal
(casino type) gambling industry and generated considerable tax revenue of
various sorts. Third, they have funded other infrastructure including roads and
hotels. The casinos in both Nelson Mandela Bay Metro and Buffalo City
brought about major regeneration in their local areas. There has also been
considerable spending on corporate social investment of various types.
Incomes have been generated, jobs created and a tourist attraction has been
established in Port Elizabeth.
The casino industry dominates the gambling industry and there has been a
relative decline in the contribution from horse racing. In 2000/1 total gross
gaming revenue (GGR) was a little over R500m with racing contributing
R70.1m. By 2008/9 GGR had grown to R1.1bn with LPMs making a R108m
contribution and racing a R120m contribution. In 2000/1 racing contributed
14.2% of GGR while by 2008/9 this share had fallen to 10.7%. At the same
time the LPM contribution had grown to 9.6%.
Macro-economic contribution
The most all encompassing measure of macroeconomic economic contribution
is contribution to Gross Domestic Product (GDP). This is reported as well as
contribution to Eastern Cape Gross Geographic Product (GGP), which is the
provincial share of GDP, contribution to taxes and contribution to indirect
household income.
In the 2008 financial year the Eastern Cape Gambling and Betting Board
(ECGBB), casinos, LPMs and the horse racing industry contributed R1.578bn
to GDP. Of this R34.3m was by the ECGBB itself; R1 175.7m by casinos
(includes an estimate of the contribution by concessionaires); R113.9m by
LPMs; and R254.2m from the horse racing industry. This contribution to GDP is
the equivalent of 0.8% of the overall Eastern Cape economy. Between 2001
and 2008 the cumulative contribution to GDP totalled R9.7bn.
17
GGP is the provincial equivalent of GDP. Total contribution to Eastern Cape
GGP amounted to R85.2m in FY2001, before dropping off to R49.6m in
FY2002. The high contribution in FY2001 was due the construction of The
Boardwalk and Hemingways. Contribution to GGP has then shown a steady
increase from R49.6m in FY2002 to R87.0m in FY2008. Between FY2001 and
FY2008 the gambling industry made a cumulative contribution to Eastern Cape
GGP of R545.2m.
The gaming industry in the Eastern Cape has contributed to both direct and
indirect taxes. Gaming levies and VAT payments have increased from R68.0m
in FY2001 to R203.7m in FY2008. At the same time other forms of direct
revenue to the government, such as company tax and PAYE, increased from
R30.8m to R127.0m. Total direct taxes in FY2008 amounted to R330.7m.
Indirect taxes, generated through the multiplier effect and linkages in the
economy, have increased from R216.9m in FY2001 to R318.6m in FY2008.
Total direct and indirect taxes amounted to R649.3m in FY2008, while the
cumulative contribution to all forms of taxes since FY2001 exceeds R3.3bn.
Indirect household income is generated through the multiplier effects. In
FY2008 the gaming industry in the province generated R796.8m in indirect
household income. Between FY2001 and FY2008 there was a cumulative
increase in indirect household income of over R5bn.
Job creation
The gambling industry has created and sustained three types of jobs. The first
are jobs in the provincial construction industry where the construction and
ongoing maintenance have sustained jobs in the industry. The second type of
jobs are those due to the ongoing running of the industry. The third type of jobs
are the so-called indirect jobs which are the result of the multiplied spending on
construction and operations.
The construction of The Boardwalk and Hemingways in FY2001 was a major
contributor to the 8 941 direct jobs created in that year. Employment by the
gambling industry has sustained over 4 000 for most years between FY2001
and FY2008. A total of 4 568 direct jobs were sustained in FY2008. This is the
equivalent of 0.3% of all formal employment in the Eastern Cape.
The LPM part of the industry is estimated to employ about 169 people. This is
up from an estimated 40 in 2005 when the first LPMs were installed. The horse
racing industry is estimated to employ about 329 people. This is up from 301 in
2001.
In FY2008 7 503 indirect jobs were created, with the majority resulting from the
casinos. Total contribution to jobs (both direct and indirect) totalled 12 070 in
FY2008.
Corporate social investment
The total value of corporate social investment (CSI) increased from R30 000 in
FY2001 to over R5.6m in FY2008. Most of this comes from casino
contributions. Total contribution to CSI since FY2001 exceeded R16.7m. We
18
were unable to source CSI by Luck At It or the horse racing industry. Anecdotal
evidence suggests that Phumelela donates all racing gate money to charity, but
we were not able to verify this.
CSI expenditure by the casino industry covers a wide range of initiatives.
These include community support like HIV/AIDs, supporting orphanages and
youth hostels; supporting local sports clubs and music events. There is poverty
alleviation; support for education; and promotion of arts and culture.
Contribution to tourism
There is general consensus amongst role players that the Eastern Cape has
significant tourism potential but this potential is not currently being put to good
use. The Boardwalk has added significant value to Port Elizabeth‟s tourism
sector and has enhanced Port Elizabeth‟s tourist appeal. The Boardwalk was,
at the time, the largest tourism investment in the Eastern Cape. Over 22 million
people have visited The Boardwalk since its opening which, after the beaches,
is the most popular tourism venue in the city. It is the only pure entertainment
venue in Port Elizabeth. Entertainment and shopping has consistently been the
second most important reason why people visit the Nelson Mandela Bay Metro.
Furthermore, the proportion of visitors coming primarily for the region‟s
entertainment and shopping almost doubled to 27% during the summer of
2007/8 compared to around 16% previously. The Boardwalk, after the beaches,
featured second on the list of the top 10 favourite attractions of visitors to
Nelson Mandela Bay, outranking Bayworld in third place.
The Wild Coast Sun is a well known destination casino that draws patrons from
far and wide. In doing this it helps promote tourism. In particular most of the
gambling taxes that accrue to the Eastern Cape come from people living in
other provinces. In 2007 the bulk of people visiting the Wild Coast Sun were
from KwaZulu Natal, with 31% originating from the Durban metropolitan area. It
can be safely assumed that these people would have spent a night or two at
the resort. Surprisingly 16% were from Gauteng and only 3% from the Eastern
Cape.
Property prices
The analysis of property value changes was limited to the three new casinos.
To quantify the impacts on property values, estate agents operating in the
areas surrounding the three new casinos were asked whether the casino had
changed property values and by how much. In total, property prices have
increased by about R1 084m on average as a result of the building of the three
new casinos.
Displacement effects
When people choose to gamble they are making choices within a finite amount
of disposable income. If people do choose to gamble with their money then
they choose not to spend it on other things. What does this mean for jobs and
expenditure? Any increase in jobs and expenditure which will occur as a result
19
of the establishment of a casino, for example, will be offset, to a larger or lesser
extent, by a loss of jobs in other sectors.
There are three circumstances when a casino will not displace other forms of
economic activity. The first is when there is a general increase in income. The
second is when the operation of the casino itself leads to an increase in
income. The third is when the displacement reduces imports from other
provinces or countries.
Survey results for the Eastern Cape, which were done as part of this study
reveal the following types of displacement.
The highest incidence of displacement is food for the household with 274
responses. This is followed by the „nothing specific‟ category with 111
responses. Other categories include:
Other entertainment with 107 responses
Transport had 53 responses
Savings or stokvel clubs 48 responses
Alcohol and housing 47 each
Medical aid or expenses and children/grandchildren received the least
responses with one and two respectively
Gambling displaces essential spending more than non-essential spending.
There were 468 essential and 154 non-essential responses, while „nothing
specific‟ received 111. The „other‟ and „don‟t know‟ categories received 13 and
34 responses respectively. This information was analysed in more detail and
the more important findings are:
While essential spending is the major category across all forms of gambling, it
is more prevalent for informal gambling and scratch cards, at about 65%. In
both cases household food is the category with the highest incidence
Displacement of essential spending is proportionately the lowest for casino
spending, at 50%. Casino spending is also the type of gambling where
displacement of non-essential spending is the highest, at 28%
The „nothing specific‟ category varies from 9.9% for other formal gambling to
14.9% for the lottery. The „other‟ category varies from 1.0% for casinos to 2.9%
for informal gambling, while the „don‟t know‟ category varies from 2.9% for
informal gambling to 8.1% for casinos
Gamblers in the 18 to 24 year and 40 to 49 year age groups are less inclined to
use essential spending than gamblers in the 25 to 39 year and over 50 year
age groups. The incidence of non-essential spending remains more or less
constant across all age groups
The incidence of essential spending declines as household incomes increase.
The incidence of non-essential spending fluctuates but tends to exhibit an
increase as household incomes increase. The „don‟t know‟ category shows an
increase with household incomes
20
The incidence of essential spending increases from around 55% for working
people to 67% for non-working people. The incidence of non-essential
spending compensates for this increase in essential spending, and decreases
from around 24% for working people to 14% for non-working people. The
„nothing specific‟, „other‟ and „don‟t know‟ categories are similar for both
working and non-working people
Income levels of gamblers
Part of the survey focused on the income levels of gamblers and what kind of
gambling they indulged in. There were two types of surveys, a household
survey (households generally) and an intercept survey (where people were
interviewed at the place where they were gambling).
The following characteristics were revealed by the household survey:
The majority of casino gamblers (53%) fall into the income categories of
R3 201 to R12 800 per month. Very few gamblers at casinos (6%) earned more
than R12 800 a month
About 89% of people who gamble on other formal types of gambling earned
between R801 to R12 800 per month, with the highest proportion (22%) being
in the R3 201 to R6 400 category
LPMs show a normal distribution about the R1 201 to R1 600 and R1 601 to
R3 200 per month income groups
Gamblers participating in horse betting are fairly well distributed across all
income groups up to R12 800 per month, with spikes in the R801 to R1 200
income group and the R3 201 to R6 400 income group. About 11% of all horse
gamblers fall into the up to R400 monthly income category
The majority of sports betting gamblers fall into the R801 to R12 800 income
categories, with the peak of 35% occurring in the R3 201 to R6 400 income
group
21
SECTION A
The Background
22
1. INTRODUCTION
Legalised gambling has grown markedly over the past decade. Since the
passing of the National Gambling Act in 1996, the industry has extended from
horse-racing to include casinos, bingo, sports betting, national lottery and,
recently, Limited Payout Machines (LPMs). It has grown from a limited activity
to one that is commonplace with almost half the South African population
having engaged in some form of gambling.3 As legalised gambling continues to
grow in popularity and prevalence, and new forms of gaming are introduced
and expanded, there is much public debate about the costs and benefits of this
sector to our society and to our economy.
It is against this backdrop that the Eastern Cape Gambling and Betting Board
(ECGBB) commissioned an assessment of the socio-economic impact of the
Eastern Cape gambling sector. While national studies to the effect have been
undertaken by the National Gambling Board (NGB); small sample sizes
disallow disaggregation by province, area (metropolitan, small urban or rural)
and by demographic variables such as race, gender, age, employment status
and income.
This report sets out to determine the extent and manner in which legalised
gambling has impacted, both socially and economically, on the Eastern Cape.
The specific impact referred to is one that touches the individual gambler, the
household and the community in the province and focuses on the positive and
negative impacts of legalised gambling and, in particular, the preventable
negative consequences.
1.1 The provincial context
The Eastern Cape is a predominantly rural province with a largely agro-based
economy; other key drivers being tourism and motor-car manufacturing. The
province consists of seven district municipalities with thirty eight local
municipalities. It has a population of over six and a half million and is regarded
as one of the poorer provinces in the country; more than half the population are
unemployed and 71% live in extreme poverty.
Further exacerbating the socio-economic challenges of the province is the
global crisis which has resulted in a decline in the motor manufacturing industry
internationally, in South Africa, and in the Eastern Cape. In a province where
the motor industry is a major employer and key contributor to the GDP, the
effects are ravaging. It is estimated, that the Eastern Cape will lose between 14
000 and 39 000 jobs this year. 4
Contrary to the economic decline experienced in the motor and construction
industries, the legalised gaming and gambling industry has achieved significant
growth since 1997/8, when first legalised in the Eastern Cape. Since then it has
made a noteworthy mark on the economy; during the 2007/8 financial year, a
total of R67.3 million was collected between April and December 2008 as
3. National Gambling Board (2005) indicates that at least half of the population, over the age of 18 had engaged in gambling activities in the three months prior to the study 4. http://www.info.gov.za/speeches/2009/09063016451002.htm
23
gambling taxes and fees from the gambling industry in the province. This is a
huge growth when compared to the R27 million collected in 1997/8.
It is for these reasons that the Honourable MEC, Mcebisi Jonas, suggests that
the Eastern Cape explore alternatives for expanding the gaming and gambling
industry in a manner that supports and facilitates economic development.
“Currently the Eastern Cape Gambling and Betting Board (ECGBB) are
making a substantial contribution towards the fiscus in a very effective and
efficient manner. We believe that the expansion and optimal regulation of
a number of potential new gambling activities such as traditional horse
racing and the development of the on-line gaming industry in the province,
will lead to an increase in the revenue base of the province.” 5
Notwithstanding this, the MEC recognises that the economic gains of the
gambling industry need to be measured and balanced against the social costs
of the industry. In this regard, the gambling sector has always been viewed as
different from other sectors of the economy. Unlike other industries in which the
market is the principal determinant of supply and demand, government
decisions have largely determined the size and form of the legalised gambling
sector. The result being that the gambling sector in the Eastern Cape, in South
Africa, and for that matter the rest of the world, exists as one of the most highly
regulated economic sectors; together with the alcohol and tobacco industries.6
1.2 The legislative framework
The framework for legalised gambling in South Africa was provided in 1996 by
the National Gambling Act (No. 33 of 1996)7 which aimed to consolidate and
harmonize the control of gambling activities in the Republic. This was
superseded, repealed and replaced by the National Gambling Act (No. 7 of
2004). These legislations aim to establish the principles and mechanisms by
which legalised gambling is regulated, controlled, policed and licensed and by
so doing to bring about uniformity in the legislation relating to gambling in the
Republic and in the provinces.
In the Eastern Cape, the gaming and gambling industry was legalised under
the „homelands governments‟ of Transkei and Ciskei. Gambling in Eastern
Cape areas administered then under the Cape Province continued to be illegal
with the exception of horse racing which was always legal. Legalised gambling
in the Eastern Cape was established in 1997 through the Eastern Cape
Gambling and Betting Act (No. 5 of 1997) which aimed to implement the
national regulatory framework as set out in the National Gambling Act (No. 33
of 1996) in the Eastern Cape.
This legislation, together with the National Gambling Regulations (2004), seeks
to protect the public from „over-stimulation of the latent demand for gambling‟.8
It does so by establishing a number of restrictions and guidelines including,
inter-alia, the following: (i) The protection of minors by limiting their access and
5. http://www.info.gov.za/speeches/2009/09063016451002.htm 6. Casino Association South Africa (2005): The National Gambling Act. http://www.casasa.org.za/newact.htm 7. This bill replaced The Lotteries and Gambling Board Act (No. 210 of 1993) 8. National Gambling Act (No. 33 of 1996)
24
ensuring that gambling premises are at specified distances away from schools;
(ii) Restrictions on the granting of credit or discounts to gamblers and
limitations on the directions to and distances from auto banking facilities; (iii)
Restricting the content of advertising for gambling activities; (iv) Ensuring that
gambling premises close for a minimum of six hours in every 24 hours; (v)
Enabling self exclusion from gambling and (vi) Making the posting of notices
announcing the dangers of gambling a prerequisite at licenced premises.
The Act (2004) includes a description – in relation to the norms and standards
of gambling – of the roles, functions and limitations of the Minister, the National
Gambling Policy Council and the National and Provincial Gambling Boards.
The legislation allows the Minister to establish limits on the total licences in
South Africa by providing the Minister the responsibility of determining the
maximum number of licences to be granted in the Republic and in each
province.9
At the provincial level, gambling and betting boards were established under
provincial gambling and betting legislations. In the Eastern Cape, the Eastern
Cape Gambling and Betting Board (ECGBB) was established as a statutory
body under the ECGB Act (No.5 of 1997). The most important functions of the
Board are the licensing of the legal gambling industry, the regulation of licence
holders, the collection of gambling taxes on behalf of the Province and
ensuring the abolition of unlicensed gambling.10 The control of gambling and
betting activity allows for the exclusion of problem gamblers, protection of the
public against unscrupulous gambling practices and the general control of
gambling activities in the Eastern Cape. Further, it is the responsibility of the
Board to ensure that a responsible legal gambling industry exists in the
province and that internationally recognised standards are complied with.11 The
Eastern Cape was granted five casino licenses under the National Gambling
Act to dispense. The province has been divided into five zones for these
purposes, with the objective of granting one license per zone. Currently, there
are four casinos operating in the province with one licence unallocated. The
Eastern Cape was provided licences for 2 000 LPMs of which 1 345 have been
allocated.
A more recent development in the gambling industry is that of online gambling.
The National Gambling Bill 48 of 2003 defines online gambling, or „interactive
gambling‟ as it is otherwise known, as „gambling games played or available to
be played through the mechanism of an electronic agent accessed over the
Internet‟. Interactive gambling was outlawed by the National Gambling Act of
2004 because government considered that more time was needed to conduct
research into this form of gaming. The National Gambling Amendment Bill
submitted to parliament in 2008 served to address this thorny issue by
providing for the licensing and regulation of interactive gambling within the
republic; putting in place effective mechanisms to control online gambling;
preventing gambling from becoming a source of crime and money laundering
and providing protection for vulnerable persons such as youth and problem
9. National Gambling Act (No. 33 of 1996) 10. ECGBB Terms of Reference 11. ECGBB Terms of Reference
25
gamblers. The nuts and bolts of implementing the regulation needs much work
and further debate.
One explanation for the high degree of regulation of the gambling sector is the
history of gambling and associated therewith moral objections to gambling as a
legitimated form of entertainment. Another is concern that legalised gambling
would produce a number of negative effects on society. These include the
negative consequences for gamblers themselves, such as the financial and
family distress caused by problem gambling and the negative externalities
imposed on society, such as increased poverty and crime.
1.3 Concerns with gambling
These concerns are not necessarily without merit. Wits Enterprise (2004), in a
study on the participation of under 18 year olds (school students) in gambling,
found that 13.5% exhibited what can be described as a mild predisposition to
gambling, whilst 5.1% indicated a strong predisposition to gambling. The study
found that students with a strong predisposition to gamble were
disproportionately more likely to be victims of physical assault (from both
parents and teachers), and to live in families where alcohol and gambling were
widely tolerated. Students who gambled excessively were also more likely to
hold strongly narcissistic and fatalistic views on life, which typically
underpinned attitudes to sex and HIV-AIDS and other risk-taking behavior. The
study did, however, argue that the findings are consistent with international
trends where some under-age gambling is experienced in the gambling
industry, given difficulties in enforcing age restrictions and monitoring individual
activity.12 Similar to this, the NGB (2003) found that gambling activity across all
modes of gambling decreases in proportion to age, with the prevalence of
gambling strongest in the 18 to 30 year old category.
The NGB (2005) looked at the prevalence of problem gambling in South Africa
and concluded that 0.52% of all respondents who gambled could be classified
as problem gamblers, suggesting an approximate 0.26% of all South Africans.13
In the same study, respondents were asked to comment on the extent to which
gambling by members within the household had a negative impact on their
household welfare. While the large majority of respondents did not report a
negative impact, a significant minority of 6,7% confirmed that gambling had a
negative impact on their households.14
Cosatu, coming from an economic rather than moral perspective, argued in
their 2003 submission to the Portfolio Committee on Trade and Industry that
gambling contributes negatively to the socio-economic wellbeing of the country
in that it increases poverty by encouraging poor people to „sink their hard-
earned money into gambling operations and gambling machines in the hope
that they will win‟.15 They provided, as an example, the Mpumalanga province
12. http://www.ecgbb.co.za 13. The report indicates that approximately half of South Africans engaged in gambling. As such, to determine the total % of problem gamblers the total percentage was halved. 14. NGB (2005): Socio economic impact of gambling 15. Cosatu submission on the National Gambling Bill to the Portfolio Committee on Trade and Industry, 2003.
26
which they argued granted casino licences despite being aware that a sizable
displacement of household expenditure was the main income for these
casinos. Similarly, the Northern Cape where pensioners gambled with the little
pension money that they have in the hope that they will be lucky and win the
funds that they need. With respect to Lotto, they stated that 40% of the adults
who buy Lotto tickets earn between R800 and R4000 a month, and 11% earn
under R800 a month with some admitting that they cut spending on necessities
like food and clothing in order to play the Lotto.
In support of Cosatu‟s argument of 2003, the NGB (2005) found that less
affluent members of the South African population are important participants in
gaming activities: 27,2% of gambling participants were unemployed; 13,5%
occupied part time jobs; almost 4% had no formal schooling; almost 13% had
only primary school qualifications and just over half earned less than R1 000
per month. Among low income earners and the unemployed, purchase of lotto
tickets comprised the large majority of gambling activity (just under three
quarters).
On the other side of the debate, supporters of legalised gambling recognize the
increase in consumer welfare for those who enjoy gambling and participate
„responsibly‟ in gambling as a choice of leisure entertainment. Further, the
importance of a legalised gaming and gambling industry for the eradication of
potential economic benefits, including job creation and development. Those in
favor of expanded gambling operations point to the revenue-generating
potential for lotteries and the taxation of casino revenues. As stated by the
Casino Association of South Africa,
By its very nature, gambling in some sectors of society remains a
controversial issue, although independent research commissioned by the
NGB shows that 73% of South Africans believe gaming is acceptable, and
89% do not have a moral, philosophical or religious objection to this form
of entertainment. About one in eight South Africans (12.2%) are opposed
to gaming, while the rest may choose not to gamble, but have no objection
if others do so.
In line with its role, the NGB has undertaken a number of studies assessing
trends in gambling activity since the early 2000‟s. The first major study of the
socio-economic impact of gambling, conducted in 2002, revealed a developing
gambling market showing considerable levels of volatility.16 A follow up impact
assessment in 2005 indicated maturation of the gambling market with a decline
in the number of people participating in the various legalised forms of gambling
available in the country.17
http://docs.google.com/gview?a=v&q=cache:K4dbpWCIR5cJ:www.cosatu.org.za/docs/2003/NatGamblingBill.B.pdf+cosatu+gambling&hl=en&gl=za 16. http://www.ecgbb.co.za 17. http://www.ecgbb.co.za
27
1.4 Research objective
This study, as the first study into the socio-economic impact of the legalised
gambling industry specifically in the Eastern Cape, provides a baseline on
which future policy decisions can be determined and from which changes in the
gambling industry can be monitored. The research outcomes of the study are
to determine awareness and participation in gambling; to assess the social and
economic impact of legalised gambling and to devise a replicable methodology
that can be used to monitor the sector in the future, highlight and identify
preventable negative consequences of legalised gambling, and make
recommendations as to how these might be addressed. As a first socio-
economic impact assessment of gambling in the Eastern Cape these research
outcomes have been achieved by addressing, inter alia, the following:
The awareness of legal and illegal gambling activities
Attitudes to legalised gambling by determining personal views of the
acceptability of gambling; the importance of gambling for recreation purposes;
the motives and perceived benefits from gambling and the negative and
positive impacts of gambling for the household, the community and the
province
The level of participation in legal and illegal gambling activies by understanding
the mindsets regarding participation in various modes of gambling and reasons
for participation or abstaining from doing so
Prevalence of problem and compulsive gambling by determining problem
gambling incidence and prevalence rates; possible negative impact of gambling
on household welfare levels and awareness of assistance available to and for
problem gambling
Prevalence of youth participation in gambling and the specific modes – both
legal and illegal - in which they engage and the motives for such.
The socio-economic contributions of gambling since its legalization. In order to
do so, the study will apply socio-economic indicators that can be used in the
future for monitoring the socio-economic impact of gambling. These will
include, inter-alia, the following:
With respect to impact on the economy: turnover and gross gaming revenue
(GGR); total winning payouts; government revenues from gambling including
taxation; contributions to capital expenditure including, where possible, analysis
of capital gains to consumers and industry including increases in private and
commercial property values related to gambling venues and development;
direct, indirect and induced contributions to the GDP; social corporate
investments made by the gambling industry; net growth in revenue and sales
from spill-off or feeder sectors
With respect to impact on household expenditure: Propensity to spend on
gambling; gambling expenditure in comparison with and as a proportion of
other household expenditure items; expenditure displacement effects;
household expenditure replacement analysis; allocation of winnings and
incidence of impulsive gambling expenditure
28
With respect to impact on development: Direct and indirect employment (and
the nature of such); job intensity: gambling related jobs created per R1 million
of gambling income (or GDP) compared with other sectors in the economy;
changes in employment and unemployment rates resulting directly from the
gaming industry development and the gambling tourism rate used to determine
the extent to which the gambling industry enhances tourism in the province
1.5 The structure of this report
The report consists of FIVE sections.
Section A provides the background to the study and contains the introduction
and the methodology chapters. The methodology chapter provides the
methodological basis for the study. It presents the methodological
assumptions, the sampling frame and the assumptions underlying the
methodology.
Section B focuses on gambling particiaption. It provides a description of the
gambling industry in the Eastern Cape, the participation therein and the
attitudes thereto.
Section C examines the impact of gambling in the Eastern Cape. It examines
the social impacts by presenting the perspectives of Eastern Cape residents on
the gambling industry overall; by focusing on problem gambling, youth
gambling and illegal gambling and the economic impacts of gambling.
Section D examines the impact of gambling in the Eastern Cape. It examines
the social impacts by presenting the perspectives of Eastern Cape residents on
the gambling industry overall; by focusing on problem gambling, youth
gambling and illegal gambling and the economic impacts of gambling
Section E examines the impact of gambling in the Eastern Cape. It examines
the social impacts by presenting the perspectives of Eastern Cape residents on
the gambling industry overall; by focusing on problem gambling, youth
gambling and illegal gambling and the economic impacts of gambling
29
2. THE METHODOLOGICAL APPROACH
Studies on the socio-economic impact of gambling rest on the theoretical
foundations of social cost estimations combined with cost-benefit analysis. In
terms of social cost estimations the focus is on the way in which the behavioral
outcomes of gambling impact on communities. Cost benefit analysis, on the
other hand, focuses specifically on the financial costs and benefits of gambling.
These quantitative measures are supported by qualitative studies that
determine the day to day lived experience of gamblers and the perspectives of
communities.
2.1 Frameworks for determining the socio-economic impact of gambling
A number of research frameworks exist for determining the socio-economic
impact of gambling. Where appropriate, this study drew from the lessons of
these research frameworks, most notable for this study are the Socio-
Economic Impact of Gambling (SEIG) framework developed in Canada, the
approach utilised in New Zealand and the method used by the National
Gambling Board in South Africa.
Socio-Economic Impact of Gambling (SEIG) framework
The Socio-Economic Impact of Gambling (SEIG) framework was developed by
Aneilski for the gambling sector in Canada to help researchers report on the
social and economic impact – both positive (benefits) and negative (costs) – of
gambling in Canada‟.18 It aims, because of the nature of the gambling, to
determine an actual, authentic and unbiased manner in which the worth of the
gambling industry can be determined.19
The methodology represents, according to the authors, „the highest standard
yet attained for a measurement methodology of assessment‟. The authors
expect that „the framework will assume the recognized and accepted position
as the preferred methodology for assessing the gaming industry‟s impact on
the individual and on society‟20. The SEIG framework reflects the
interdisciplinary and complex nature of gambling and takes a broad and
integrated systems approach to measuring impact.21 It consists of six impact
themes each with underlying variables and indicators that allow the positive
and negative impact to be determined. These themes are:
Impact Theme One: Health and Wellbeing
Impact Theme Two: Economic and Financial
Impact Theme Three: Employment and Education
Impact Theme Four: Recreation and Tourism
18. Ibid 19. Ibid 20. Ibid 21. SEIG
30
Impact Theme Five: Legal and Justice
Impact Theme Six: Culture
The methodology, whilst widely used in Canada, contains a number of
limitations and challenges that are worth noting as these were pertinent to the
transferability of the framework to the South African context and to this study in
particular. The first and most important challenge is the absence in South
Africa of adequately robust data to populate the various impact domains. The
framework provides the highest possible ambition in terms of variables and
data. Within the South African context data limitations are a major concern in
the implementation of the model as many of the variables and indicators
highlighted are not routinely collected and if so, certainly not validated and
acceptable for research purposes. The data required is for the full range of
social, economic and health aspects including co-morbidity, depression and
suicide. Much of this data would need to be collected from health clinics which
would be costly, time consuming and would exist as a large and challenging
research project in its own right.
The framework does not impose a hierarchy of variables. While this enables
the framework to be transferable and flexible, it makes it almost impossible to
determine the importance of variables as compared to each other as all
variables are provided equal weight. As such, the framework fails to provide a
streamlined approach to be used in the context of limited data, restricted time
and tight budgets – a description that best describes the South African context.
The challenge of estimating the full monetized cost and benefits of gambling on
a society is a challenge for any framework. While conventional cost-benefit
analyses are beneficial, there is still considerable disagreement among
economists as to the taxonomy of cost and benefit for gambling and how to
measure the impact.
The model is not concerned with transfers; for example, the impact on the
educational status of children of gamblers versus the impact on the educational
status of the children of employees of gambling institutions. In the Eastern
Cape, where social development is a key aspect, this is an important failing of
the model.
Nonetheless, and despite the concerns raised with the framework, the SEIG
framework provided the study with a systematic systems approach by providing
key analytic tools drawn from multiple disciplines and highlighting a set of
indicators to be considered when assessing the socio-economic impact of
gambling.
The New Zealand approach
Massey University developed an approach to determine the propensity for and
the socio-economic impact of gambling in New Zealand. In doing so they
adopted the following useful steps which they recommend for defining and
refining the methodology to be utilized. First, a review of the literature is to be
undertaken. This is followed by interviews with key informants. Data available
in a number of impact categories is then assessed. These categories overlap
very closely with that developed by the SEIG framework and might very well
31
have been drawn from the SEIG framework. Finally, a draft quantitative
instrument is developed which is piloted and then finalised.
The New Zealand approach provided the study with a useful approach to
finalizing the methodology and the instruments used in this study. It suggested
that the development of a methodology should be undertaken as a study in its
own right to ensure that the variables collected and the instruments utilized are
appropriate for the long term monitoring and assessment of the impact of
gambling in the region. While this was clearly a luxury that this study could not
afford, we used this research opportunity as an opportunity to test, pilot and
refine key research tools to be used by the ECGGB for the monitoring and
assessment of the impact of gambling in the future.
The National Gambling Board
The National Gambling Board (NGB) provided the study with an approach
piloted within the South African context. The NGB study was based on a
household survey combined with qualitative focus groups with gamblers and
the general public. It focused on:
Awareness of, attitudes to and participation (including the frequency of
participation) in gambling and in different modes of gambling
Negative social impacts of gambling such as the belief that gambling can lead
to negative social behavior and have negative impacts on the community
The extent to which respondents believe that gambling as a leisure activity is
valuable and furthermore, perspectives on the adequacy of gambling outlets
The incidence of problem gambling including youth gambling. Here the focus,
was on the impact on personal health, interpersonal relationships, work,
studies, crime and the financial well being of the person, the family and the
community
Household expenditure which included the total expenditure on gambling, i.e.
propensity to gamble; household expenditure displacement; allocation of
winnings and the extent to which gambling expenditure is budgeted or due to
impulsive spending
Analysis was undertaken by key demographics such as age, employment
status, educational level, race, gender, income
The approach utilized by the NGB provided an excellent case study of the data
available to the study of gambling in South Africa. This study, together with the
work undertaken by Collins and Barr (2001) and (2006) on problem gambling
was widely used in the design of this study.
32
2.2. Determining the costs and benefits of gambling
As provided by the studies above, particularly by the SEIG framework, an
analysis of the socio-economic impact of gambling should take into account all
the costs and all the benefits associated with gambling.
The benefits
In this regard, the benefits of the gambling industry would include job creation,
the generation of incomes and consumer surplus where consumer surplus is
defined as the difference between the amount that a person pays for a product
and the maximum amount that the consumer is prepared to pay rather than do
without it. In the context of this study consumer surplus refers to the
entertainment value that people derive from gambling which is just as important
as the pleasure and enjoyment that people derive from watching movies, going
to the theatre or engaging in sport.
The social costs of gambling
The benefits of gambling need to be balanced against the social costs of
gambling, some of which are quantifiable and some of which are not. One of
the most concerning is problem gambling and the impact that it has on the life
of the individual, that of the family unit and on the community. The definition of
problem gambling developed by Collins and Barr (2006) and the NGB (2005) is
applied in this report. In terms of this definition, problem gamblers are people
who,
“spend so much money and/or time gambling that they do significant
damage to themselves in areas of their lives which are important to them,
notably their personal relationships, their work, their sense of security or
self-respect find it difficult to control their gambling without assistance”.22
In addition to these characteristics, problem gamblers “… are obsessed with
gambling and think about it for much of the time when they are not gambling”
and use gambling “not as a means of enhancing the pleasure in their lives but
as a means of escaping pain”. 23
The challenge facing research into problem gambling lies not only in defining it,
but also in identifying the problem gambler. Here the difficulty lies in the
reluctance of the problem gambler to talk truthfully to strangers and even to
themselves, as addicts often lie to themselves about their problem. The
Gamblers Anonymous 20 Questions are used for this purpose in this report.
For the purposes of analysis seven affirmative responses were used to identify
problem gamblers and 14 affirmatives to determine pathological problem
gamblers. Furthermore, the Canadian Problem Gambling Index (CPGI) was
used to segment gamblers into groups using the following scoring regime: No
risk = score of 0, Low risk = score of 1 to 2, Moderate risk = score of 3 to 7 and
High risk = score of 8 to 27.
The Gamblers Anonymous 20 Questions were used by the National Gambling
Board in their national studies on gambling in South Africa and by the National
22 Collins and Barr (2006): p.30 23 Collins and Barr (2006): p.31
33
Centre for the Study of gambling. Using this framework made it possible to
compare the findings from the Eastern Cape to other studies undertaken in the
country.
Internationally there have been many attempts to measure the cost of problem
gambling. Aspects included in the assessment are increases in law
enforcement costs, in healthcare costs, in welfare payments and in other social
services costs. Other negative impacts which may or may not be thought of as
social costs include job losses, bankruptcies, family breakdown, personal
unhappiness and community breakdown. This is similarly so for determining
the negative impacts on local communities where it is probably fair to list the
negative social impacts and to add numbers where appropriate, including costs
to taxpayers.
The key questions that underlie studies on problem gambling rotate around the
concern of what would happen in the absence of legalized gambling? Would
the negative impacts have been the same, or would they have been greater or
lesser? This, as stated by Collins and Barr (2006), is the $64 000 question:
„Does increased availability of gambling opportunities lead to an increase in the
prevalence of problem gambling?‟ A large number of studies exist that present
a strong correlation between proximity to gambling sites and problem gambling.
On the surface of it, these findings suggest that an increase in gambling
opportunities does indeed result in an increase in problem gambling. Collins
and Barr (2006) suggest that this is „an over-simplification‟. Citing the work of
Volberg (2004) they argue increased problem gambling with increased
gambling opportunities is not a foregone conclusion, rather that the correlation
between the two depends on how the society regulates the increased gambling
and what else is done in terms of communication and education to combat
problem gambling. 24
“If a jurisdiction introduces new forms of gambling and does nothing else it
will most likely experience an increase in the incidence of problem
gambling. However, if the jurisdiction combines the introduction of new
forms of gambling especially with an effective public awareness campaign
about the dangers of gambling and how to avoid them, it is likely to
experience a decrease in problem gambling numbers and even in the
numbers of people who gamble regularly as well.” 25
Another possible negative consequence of gambling is the skewed
distributional effects which result in poor and middle class people, who tend to
gamble more, carrying the burden of gambling tax, as compared to wealthy
people who tend to not gamble as frequently. Further, even though problem
gamblers constitute only a small proportion of gamblers, their contribution to
gross gaming revenue could be significant as the Australian Productivity
Commission found to be in Australia.
These negative distribution effects need to be balanced against positive
effects. In South Africa the awarding of casino licences in a manner that
promotes black economic empowerment and encouraging licensees to
24 Collins and Barr (2006): p.6 25 Collins and Barr (2006): p.6
34
contribute to social development have both conferred positive distributional
effects.
Another possible negative consequence is the displacement effect where poor
people gamble with money that would otherwise be utilised for necessities such
as food and clothing. In terms of displacement effects, some studies suggest
that displacement effects should not be considered a cost. Rather, these
studies suggest that displacements are an expected aspect of a dynamic
economy. As tastes change and as new opportunities become available, so
people change their spending patterns. The challenge with this idea in South
Africa, and elsewhere in the developing world, is that the notion of
displacement effects is so pervasive that it would be hard to ignore it.26 Hence,
displacement effects have been included in the Eastern Cape study, but with a
caveat.
2.3 Indicators used in the 2009 Eastern Cape gambling survey
Constraints in budget, time and available data disallowed this study from
undertaking a full cost-benefit analysis as outlined above. Rather, with respect
to the economic analysis the study focuses on job creation and income
generation. It assesses the contribution to tourism and changes in property
values in areas where new casinos have been located.
On the negative side, the incidence of displacement effects is reported. It is
important to note that it has been argued that the capital costs, the running
costs, the jobs and the associated multiplier effects should not be considered
benefits in developed contexts. The reason for this is that developed
economies are close to full employment and therefore the resources utilised in
the gambling industry would, by and large, be used elsewhere resulting in a
zero sum gain. While this might be true for developed economies it is unlikely
to be true for South Africa where it is not at all clear that the resources used in
the casino industry would have been used elsewhere in the economy.
With respect to the social aspects the study focuses on the impact to
communities, problem gambling, impact on youth and the impact on
households and families.
For the purpose of this study a number of impact areas have been identified,
drawing from the SEIG framework, the NGB studies, other international studies
and, most importantly, experience of gambling studies undertaken in the
developing context. These have been grouped, for understanding and
convenience, into four impact themes:
Impact Theme One, Impact on the economy. Key indicators reported on
include: (i) Turnover and gross gaming revenue (GGR); (ii) Total winning
payouts; (iii) Net contribution to GDP which would be capital and operating
expenditure of gambling outlets and other infrastructure, international
convention business, organic growth in national convention business, induced
tourism from convention business less any displacement effects; (iv)
Cumulative costs and benefits over time and net contribution to GDP over time;
(v) Growth in international tourism or tourist spending; (vi) Net contribution to
26 See for example Collins and Barr 2003: p.34 and Ligthelm and Mabaso 2003: p.46
35
taxes; (vii) Changes in property values; (viii) Contributions to the social
corporate investment made by the gambling industry; (ix) Net growth in
revenue and sales from spill-off or feeder sectors and (x) Positive and negative
distributional effects
Impact Theme Two, Impact on household expenditure. Key indicators reported
on include: (i) Propensity to spend on gambling, i.e. the percentage of
household cash expenditure allocated to gambling; (ii) Gambling expenditure in
comparison with and as a proportion of other household expenditure items; (iii)
Expenditure displacement effects; (iv) Total expenditure on gambling; and (v)
Budgetary provision for expenditure on gambling
Impact Theme Three, Problem gambling: Key indicators reported on include: (i)
The incidence of problem gambling; (ii) Possible negative impact of gambling
on household welfare levels; (iii) Negative consequences of problem gambling
to the individual and (iv) Youth gambling including the awareness thereof and
the attitudes thereto
Impact Theme Four, Impact on development: (i) Contribution to employment
and job creation in terms of: direct employment (and the nature of such) in the
gaming industry and indirect employment related to the gaming industry; (ii)
Nature of the employment: Annual and hourly wages for gambling industry
employees; (iii) Changes in employment and unemployment rates resulting
directly from gaming industry development; (iv) Gambling tourism rate:
percentage of patrons/ visitors from outside the region/ community/ province
making trips to a local gaming venue; and (v) Tourism citing gambling as the
primary reason to visit the region
2.4 Econometric data
The gambling analyzed in this project refers primarily to legalised gaming
authorized by the Eastern Cape Gambling and Betting Board with a focus on
casino-type gambling, horse racing and LPMs.
Much of the econometric information that is used in this study was supplied
directly by operators in the industry. It was cross checked against ECGBB
information and other secondary sources. As a result we are confident that the
bulk of the results that are reported here are accurate within a 5% margin of
error. This is particularly true of the casino industry where all four casino
operators supplied the data that was requested. In the LPM industry, Vukani
supplied the requested data but the remaining operator, Luck-at-It, did not. We
understand that Luck-at-It is in the process of being sold and it was this that
constrained their ability to supply information.
The most problematic area for data was for the horse racing industry. While we
had very positive cooperation from the horse breeding and training industry
both nationally and in the province, there is no systematic data on training and
breeding in the province. As a result we have worked from a number of
different sources in order to establish an estimate of the size of the industry.
This is described in detail in the economic report attached as Appendix A.
Similar, albeit lesser, problems were encountered with the horse betting
industry. We did not receive any information from the tote and race course
36
operator. Our approach in making estimates for this part of the industry is
described in further detail in the economic report attached as Appendix A.
Analysis includes an estimation of the size of the gambling sector, expressed in
terms of GDP, fixed investment, tax contribution and employment. In addition,
the multiplier effects of the gambling sector, in respect of GDP, employment,
labour, remuneration and government taxes is discussed. Furthermore, and
where possible, the economic analysis includes examination of the growth of
the gambling sector since 1994 (dependent on access to historical data from
the NGB and the ECGBB), and the characteristics of the gambling market in
respect of its level of development.
For this component of the study, we drew on the National Gambling Statistics
for the 2006/7 Financial Year and previous years. These statistics are compiled
on an annual basis and are based on data received from the Provincial
Licensing Authorities. The National Gambling Statistics Database focuses
mainly on primary statistics such as turnover, gross gambling revenue, and tax
contributions by gambling establishments. Provincial Licensing Authorities are
required to submit the primary statistics to the ECGBB for analysis on a
quarterly basis. The ECGBB calculates the return to player percentage per
gambling mode, based on these primary statistics. The database comprises
comparative statistics for the years 1999 to 2007. Statistics are available by
province, by gambling mode, and according to institution type. The ECGBB
provided access to this data to TNS Research Surveys.
2.5 Household survey
A 30 minute household survey amongst 1 500 respondents was undertaken.
The survey was administered face to face. This is a marked difference from
the national gambling study undertaken in previous years by the National
Gambling Board where a proportion of the study was undertaken through face
to face interviewing and others through telephonic interviewing. Our reasons
for electing this approach are as follows:
In a study of this sort, covering a sensitive issue about which respondents may
have fairly strong feelings, it is likely that the responses received from
individuals answering questions over the phone may be significantly different to
the responses received from individuals answering the questions face to face.
In this context, the data generated through the two different survey methods
may not be strictly directly comparable.
Conducting the entire survey using face to face interviews avoids any potential
sample bias, and ensures that survey conditions are standard for all
respondents.
Given that only a limited proportion of the population has access to landlines in
their homes (29% of the urban population in South Africa according to the 2007
AMPS database) the cost saving of a combined approach is limited. This is
more so in the Eastern Cape where 13% of the total population, according to
2007 AMPS data, has access to landlines in their homes. Twenty eight percent
of the metropolitan population has access to landlines in their homes, 17% of
the small urban population and only 4% of the rural population.
37
A further benefit of face to face surveys for this study is that they enabled
interviewers to administer the gambling survey in respondents‟ homes and in
their home language.
The sample
A representative sample of n=1 500 members of the Eastern Cape population,
aged 18 years+, were interviewed across all key demographics and across all
seven districts.
The sample was systematically drawn from the sampling frame. In order to
achieve a truly representative sample we use randomisation techniques to limit
the subjectivity in the selection of areas and respondents. A complex sample
design was used that included stratification and a multi-stage sampling
procedure.
First, we drew a sample stratified by districts. This approach ensured that the
metropolitan as well as small urban and rural populations of the Eastern Cape
were sufficiently covered. Within each sub-sample, the primary sampling unit,
the suburb, was sampled through an approach known as “probability
proportional to size” (PPS). Here suburbs were listed along with their
associated populations. In line with this approach, the probability of a suburb
being selected is then proportional to its population size.
Once the suburbs had been selected, maps were produced by our in-house
Geographical Information System expert to support our field force in identifying
households for selection in each suburb. Interviewers used random rules to
identify five visiting points (households or dwellings) within each suburb. At
each visiting point they obtained an interview with the head of the household. If
there was more than one head of the household, the person to be interviewed
was objectively selected applying the “birthday rule”. In other words, the
interview was conducted with the head of household who celebrates their
birthday next.
In summary, the sample was stratified by area in order to divide the sample into
more homogenous strata that ensured lower within-strata variability. Probability
sampling was then conducted within each stratum. This was followed by a
multi-stage approach where the suburbs were selected through the PPS
approach, then households within the suburbs through random rules in field,
and then within the households the head of the household was chosen, using
the birthday rule if there was more than one head of the household.
If the selected person was unavailable, then up to two recalls at different times
of the day and week were carried out to maintain the integrity of the sample. If
a person was repeatedly unavailable or refused participation, then very strict
substitution rules were applied. The substitute was also chosen using
randomisation techniques. No substitution of individuals within a household
was allowed.
Since the approach to interview in non-metropolitan areas is cost-intensive we
over-sampled the major metropolitan areas and under-sampled non-
metropolitan areas. The returned data was then weighted back to be
representative. This strategy makes sense from the point of view that
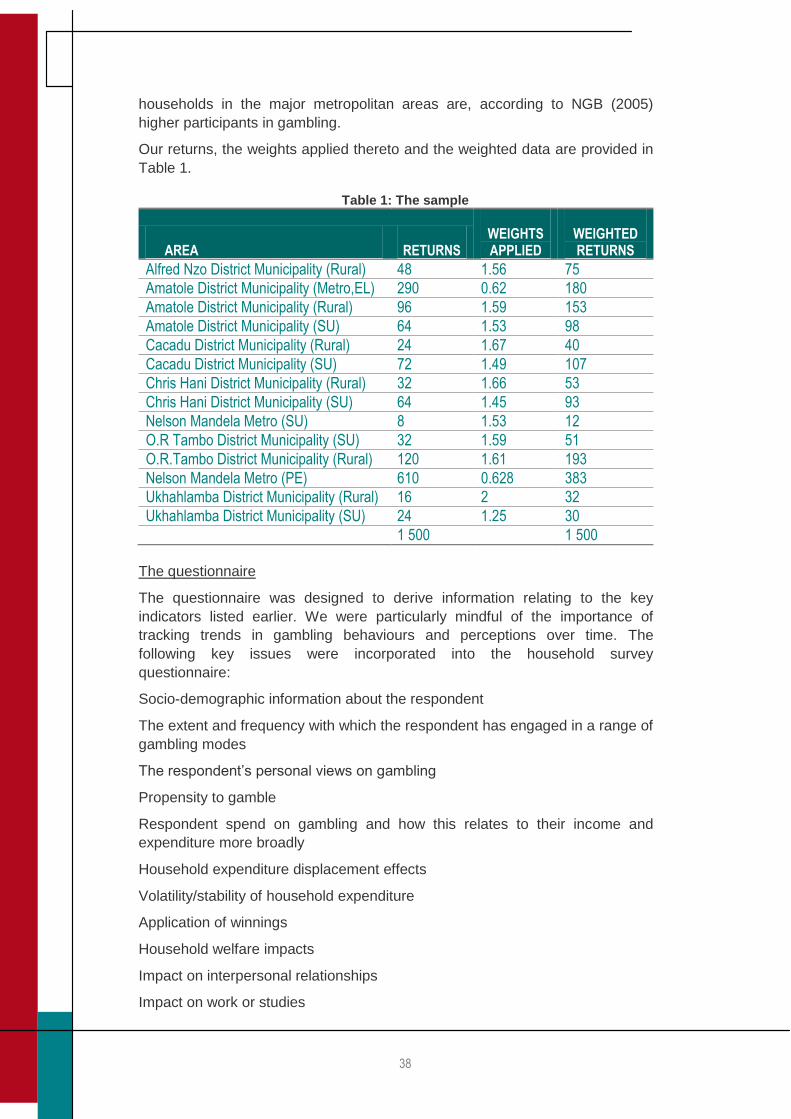
38
households in the major metropolitan areas are, according to NGB (2005)
higher participants in gambling.
Our returns, the weights applied thereto and the weighted data are provided in
Table 1.
Table 1: The sample
AREA RETURNS WEIGHTS APPLIED
WEIGHTED RETURNS
Alfred Nzo District Municipality (Rural) 48 1.56 75
Amatole District Municipality (Metro,EL) 290 0.62 180
Amatole District Municipality (Rural) 96 1.59 153
Amatole District Municipality (SU) 64 1.53 98
Cacadu District Municipality (Rural) 24 1.67 40
Cacadu District Municipality (SU) 72 1.49 107
Chris Hani District Municipality (Rural) 32 1.66 53
Chris Hani District Municipality (SU) 64 1.45 93
Nelson Mandela Metro (SU) 8 1.53 12
O.R Tambo District Municipality (SU) 32 1.59 51
O.R.Tambo District Municipality (Rural) 120 1.61 193
Nelson Mandela Metro (PE) 610 0.628 383
Ukhahlamba District Municipality (Rural) 16 2 32
Ukhahlamba District Municipality (SU) 24 1.25 30
1 500 1 500
The questionnaire
The questionnaire was designed to derive information relating to the key
indicators listed earlier. We were particularly mindful of the importance of
tracking trends in gambling behaviours and perceptions over time. The
following key issues were incorporated into the household survey
questionnaire:
Socio-demographic information about the respondent
The extent and frequency with which the respondent has engaged in a range of
gambling modes
The respondent‟s personal views on gambling
Propensity to gamble
Respondent spend on gambling and how this relates to their income and
expenditure more broadly
Household expenditure displacement effects
Volatility/stability of household expenditure
Application of winnings
Household welfare impacts
Impact on interpersonal relationships
Impact on work or studies
39
Perceptions regarding responsible gambling
The extent to which respondents display addictive or problem gambling
behaviours
Respondent‟s awareness of programmes to assist addictive or problem
gamblers
Attitude to the impact of gambling, specifically in terms of the impact on the
individual‟s health, the legal impact, and the impact on the local community
Understanding of the probability of winning and games of skill
Respondent‟s knowledge of the addictive potential of gambling
Respondent‟s perceptions about responsible gambling
Respondent‟s views on how to encourage responsible gambling behaviour
among young people
The influence of adverts, media and promotions on young people‟s perceptions
of gambling
Respondent‟s reports on parental and peer group attitudes toward gambling
TNS Research Surveys conducted pilot interviews to test the effectiveness of
the questionnaire and to ensure that fieldworkers were familiar with the
instrument prior to the commencement of the survey. Pilots included young
people, gamblers and the broader population. Pilots were conducted in a metro
location, in close proximity to gambling establishments.
The field managers in each location provided detailed feedback on the pilot
process to the research team. The questionnaire was refined on the basis of
this feedback.
Data capture
TNS Research Surveys has a dedicated and experienced data-capturing
department located in Cape Town. Dedicated supervisors oversee the coding
and capturing processes. Once questionnaires were received from the
individual field teams, they were checked to ensure that the overall quotas had
been correctly completed. All questionnaires were captured and coded in this
department. All capturing and primary data analysis would be done in
SurveyCraft. SPSS, Quantum and other programmes were used depending on
the analysis requirements. Data specifications were set up according to the
questionnaire and questionnaire instructions, allowing a clean data entry
system.
40
2.6 Intercept survey
To ensure that an adequate number of „gamblers‟ would be achieved by the
study, an intercept survey amongst 200 gamblers, using face to face
interviews, was undertaken as a „booster‟ study.
Interviews were conducted in the vernacular allowing the respondent to answer
in a language that they felt comfortable conversing in. Interviewers were
stationed outside selected gambling sites and intercepted customers as they
exited the site. Interviews were conducted at different times of the day to gain
representation of different customer types such as working and non-working.
The questionnaire
Questions focused on:
Extent and frequency of gambling activities
Impact of gambling in their personal lives in terms of:
Expenditure (Respondent‟s spend on gambling and how this relates to their
income and expenditure more broadly)
Social relations
Family relations
Employment
Personal health
Household expenditure displacement effects
Application of winnings
The extent to which respondents display addictive or problem gambling
behaviours
Respondent‟s awareness of programmes to assist addictive or problem
gamblers
Perceptions regarding measures to encourage responsible gambling and
reduce problem gambling
41
2.7 Qualitative data collection approaches
Apart from the many intrinsic benefits of qualitative research for the study at
hand, there were three primary reasons for recommending qualitative research.
The method offered a medium in which to gain the insight and understanding
into the scope of awareness, participation and attitudes to gambling activities
as well as the values underpinning such.
Second, the discussion provided a context in which recommendations and
actions could be established.
Third, since qualitative research is less structured than quantitative research, it
offered the flexibility to ask people to explain opinions and behaviours and to
explore pertinent issues that may not necessarily have been anticipated, hence
ensuring that nothing important was missed in the quantitative instrument. It
also enabled the study to experience how the public talk about these issues
using their own words, so that we can ensure that the quantitative
measurement tool used terminology that is easy for the respondents to
understand.
The focus groups
The qualitative component consisted of seven focus groups broken down as
follows: four were held with the general public and three with gamblers. Four of
the focus groups were held in metropolitan areas and three in non-metropolitan
areas.
Discussion groups were approximately two hours long and included discussion
on participation in gambling and perspectives of the socio economic impact of
gambling. Discussions that last longer than this result in respondent fatigue and
a corresponding decline in the quality of the information gathered. During the
focus group, a moderator used a discussion guide to facilitate and guide the
discussions, while at the same time, using the flexibility of the guide to allow for
discussions on pertinent issues that respondents raised that might not be on
the discussion guide.
It is important to note that the topic of gambling is a sensitive one as it is
possible that it is perceived to be amoral and socially irresponsible behaviour,
particularly if leading to problem gambling. To address this, a non directive
approach was adopted for the discussion guide, which demanded that
respondents speak of the experience of others and reflect, in a simulated
context, on the experience of others rather than share their own experience.
The discussion guide that the moderator followed included discussion on:
Knowledge, attitudes and perceptions of gambling
Incidence of problem gambling
Reported incidence of youth gambling
Impact on personal health
Impact on interpersonal relationships
Impact on work or studies
42
Financial impact
Legal impact
Youth gambling
Socio-demographic information about respondent‟s families
Access to gambling establishments for under-age participants and monitoring
of age limits
Respondent‟s understanding of the probability of winning and games of skill
Respondent‟s knowledge of the addictive potential of gambling
Respondent‟s perceptions about responsible gambling
Respondent‟s views on how to encourage responsible gambling behaviour
among young people
The influence of adverts, media and promotions on young people‟s perceptions
of gambling
Respondent‟s reports on parental and peer group attitudes toward gambling
In-depth interviews
Seven in-depth interviews were held with key stakeholders and gambling
licence holders. These were broken down as follows: two with casino licence
holders, two with route operators, one with a totaliser, one with a tourism
representative and one with a problem gambling counsellor. We included
research amongst gambling licensees and key stakeholders as we believed
them to be critical role players in identifying and addressing the negative
impacts of gambling.
The aim of these interviews was to determine from the perspective of gambling
site holders and other key stakeholders the impact of gambling on the socio-
economy of the Eastern Cape.
The discussion guide allowed for discussion on the social impact of gambling in
the province and the steps undertaken to address the potential negative
consequences of gambling. Specifically, the following aspects were addressed:
Knowledge, attitudes and perceptions of gambling
Incidence of problem gambling
Reported incidence of youth gambling
Impact on personal health
Impact on interpersonal relationships and family
Impact on work or studies
Legal impact, the impact on crime
In addition, perspectives of the economic impact of gambling in the province
and reported steps undertaken to address the potential negative consequences
of gambling in relation to these were also covered in the discussion guide:
Financial impact
43
Development impact in terms of tourism
Job creation and employment trends
Contributions to social corporate expenditure
Legal impact
44
SECTION B
Gambling Participation
45
3. PARTICIPATION IN GAMBLING ACTIVITIES
This chapter discusses participation in gambling activities amongst the Eastern
Cape population as a whole, as well as within various demographic and
geographic cohorts.
3.1 The gambling industry in the Eastern Cape
Legalised gambling, with the exception of horse racing which was always legal,
has been legal for more than a decade now. Since the legalization of gambling
in the Eastern Cape in 1997, all but one of the five provincial casino licences
been issued and, of the 2 000 LPM licences awarded to the province, a total of
1 345 LPMs have been rolled out that function across 252 LPM sites. The
number of LPM sites has now dropped to 110 after Luck At It was liquidated.
Two legal casinos, the Wild Coast Sun and the Fish River Sun, were in the
Eastern Cape when gambling was liberalised. Today there are four casinos
with a fifth licence pending. These are the Wild Coast Sun in Bizana; Queens
Casino in Queenstown; Hemmingway's Casino Resort in East London; and
Boardwalk Casino and Entertainment World in Port Elizabeth. A pending
licence is expected to be located in Mthatha. The Fish River Sun continues to
operate as a holiday resort but no longer has a casino licence.
The LPM industry is made up of route operators and site operators. Site
operators are the premises at which the LPMs are located which, in this
province, are taverns, clubs and pubs. The route operators lease the machines
to the site operators and give them logistical and other support. All sites are
linked electronically to the route operator. There are two route operators in the
Eastern Cape: Vukani and Luck At It, the latter has since been liquidated.
The horse racing industry is a wide and disparate industry that is made up of
horse breeders, horse trainers and racers, the race courses themselves (of
which there are two, Arlington and Fairview, both in Port Elizabeth) and the
betting industry. There are two types of betting operations: totalisator (tote)
betting and fixed odds betting. The difference between the two is that the tote is
a pool from all bets taken on a specific race while fixed odds betting is,
accurate to the description, a wager with fixed odds. Phumelela and Gold
Circle are the only licensed racing tote betting operators in South Africa
although only Phumelela is active in the Eastern Cape. There are seven fixed
odds bookmakers in the province.
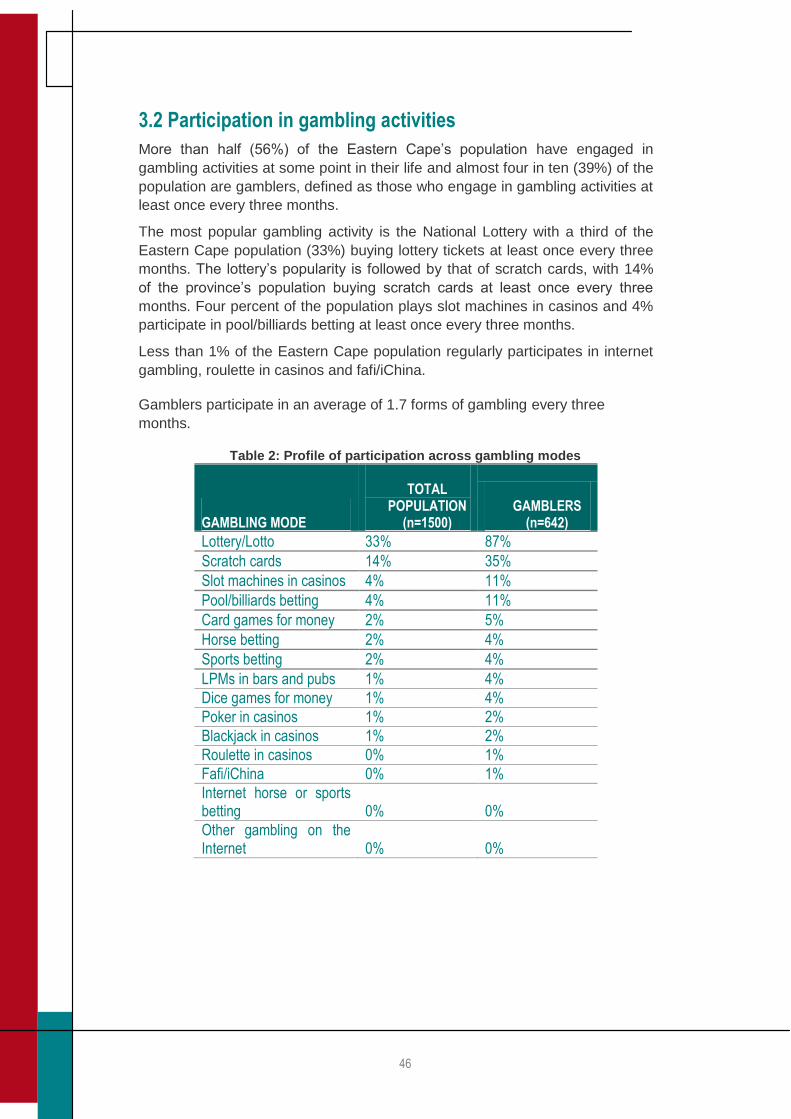
46
3.2 Participation in gambling activities
More than half (56%) of the Eastern Cape‟s population have engaged in
gambling activities at some point in their life and almost four in ten (39%) of the
population are gamblers, defined as those who engage in gambling activities at
least once every three months.
The most popular gambling activity is the National Lottery with a third of the
Eastern Cape population (33%) buying lottery tickets at least once every three
months. The lottery‟s popularity is followed by that of scratch cards, with 14%
of the province‟s population buying scratch cards at least once every three
months. Four percent of the population plays slot machines in casinos and 4%
participate in pool/billiards betting at least once every three months.
Less than 1% of the Eastern Cape population regularly participates in internet
gambling, roulette in casinos and fafi/iChina.
Gamblers participate in an average of 1.7 forms of gambling every three
months.
Table 2: Profile of participation across gambling modes
GAMBLING MODE
TOTAL POPULATION
(n=1500) GAMBLERS
(n=642)
Lottery/Lotto 33% 87%
Scratch cards 14% 35%
Slot machines in casinos 4% 11%
Pool/billiards betting 4% 11%
Card games for money 2% 5%
Horse betting 2% 4%
Sports betting 2% 4%
LPMs in bars and pubs 1% 4%
Dice games for money 1% 4%
Poker in casinos 1% 2%
Blackjack in casinos 1% 2%
Roulette in casinos 0% 1%
Fafi/iChina 0% 1%
Internet horse or sports betting 0% 0%
Other gambling on the Internet 0% 0%
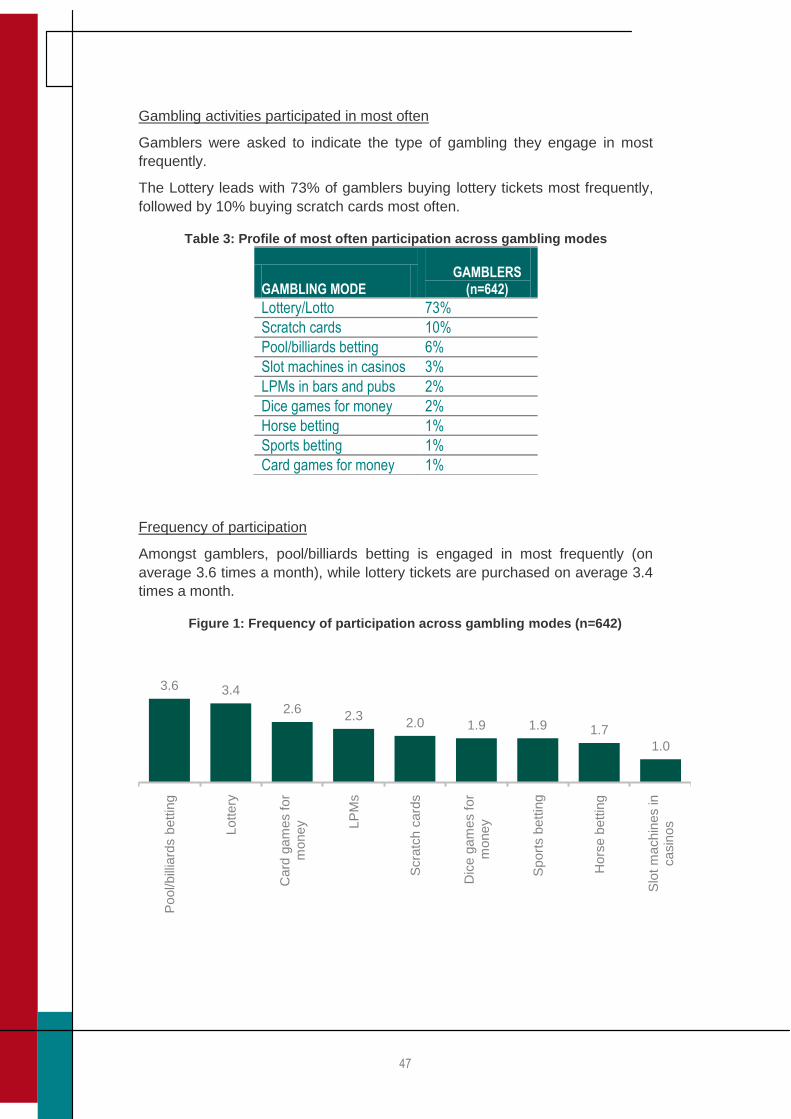
47
Gambling activities participated in most often
Gamblers were asked to indicate the type of gambling they engage in most
frequently.
The Lottery leads with 73% of gamblers buying lottery tickets most frequently,
followed by 10% buying scratch cards most often.
Table 3: Profile of most often participation across gambling modes
GAMBLING MODE GAMBLERS
(n=642)
Lottery/Lotto 73%
Scratch cards 10%
Pool/billiards betting 6%
Slot machines in casinos 3%
LPMs in bars and pubs 2%
Dice games for money 2%
Horse betting 1%
Sports betting 1%
Card games for money 1%
Frequency of participation
Amongst gamblers, pool/billiards betting is engaged in most frequently (on
average 3.6 times a month), while lottery tickets are purchased on average 3.4
times a month.
Figure 1: Frequency of participation across gambling modes (n=642)
3.6 3.4
2.62.3
2.0 1.9 1.9 1.7
1.0
Pool/bill
iard
s b
ettin
g
Lottery
Card
gam
es for
money LP
Ms
Scra
tch c
ard
s
Dic
e g
am
es for
money
Sport
s b
ett
ing
Hors
e b
ettin
g
Slo
t m
achin
es in
casin
os
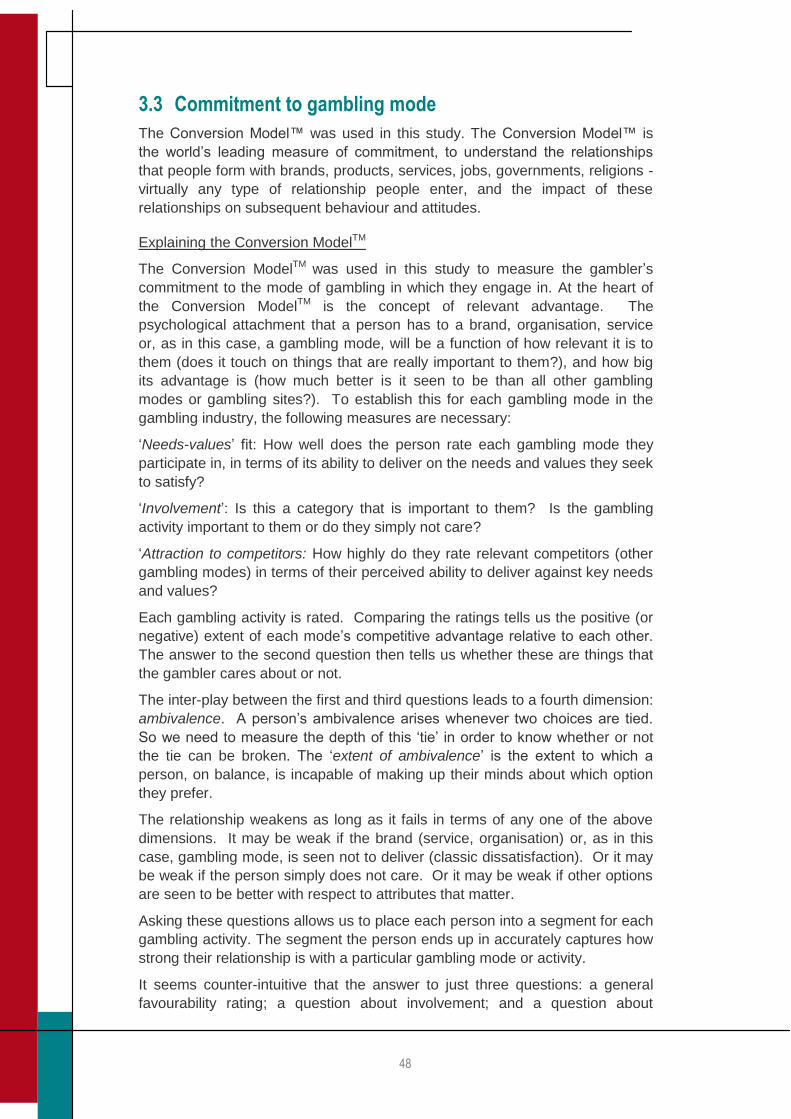
48
3.3 Commitment to gambling mode
The Conversion Model™ was used in this study. The Conversion Model™ is
the world‟s leading measure of commitment, to understand the relationships
that people form with brands, products, services, jobs, governments, religions -
virtually any type of relationship people enter, and the impact of these
relationships on subsequent behaviour and attitudes.
Explaining the Conversion ModelTM
The Conversion ModelTM was used in this study to measure the gambler‟s
commitment to the mode of gambling in which they engage in. At the heart of
the Conversion ModelTM is the concept of relevant advantage. The
psychological attachment that a person has to a brand, organisation, service
or, as in this case, a gambling mode, will be a function of how relevant it is to
them (does it touch on things that are really important to them?), and how big
its advantage is (how much better is it seen to be than all other gambling
modes or gambling sites?). To establish this for each gambling mode in the
gambling industry, the following measures are necessary:
„Needs-values‟ fit: How well does the person rate each gambling mode they
participate in, in terms of its ability to deliver on the needs and values they seek
to satisfy?
„Involvement‟: Is this a category that is important to them? Is the gambling
activity important to them or do they simply not care?
„Attraction to competitors: How highly do they rate relevant competitors (other
gambling modes) in terms of their perceived ability to deliver against key needs
and values?
Each gambling activity is rated. Comparing the ratings tells us the positive (or
negative) extent of each mode‟s competitive advantage relative to each other.
The answer to the second question then tells us whether these are things that
the gambler cares about or not.
The inter-play between the first and third questions leads to a fourth dimension:
ambivalence. A person‟s ambivalence arises whenever two choices are tied.
So we need to measure the depth of this „tie‟ in order to know whether or not
the tie can be broken. The „extent of ambivalence‟ is the extent to which a
person, on balance, is incapable of making up their minds about which option
they prefer.
The relationship weakens as long as it fails in terms of any one of the above
dimensions. It may be weak if the brand (service, organisation) or, as in this
case, gambling mode, is seen not to deliver (classic dissatisfaction). Or it may
be weak if the person simply does not care. Or it may be weak if other options
are seen to be better with respect to attributes that matter.
Asking these questions allows us to place each person into a segment for each
gambling activity. The segment the person ends up in accurately captures how
strong their relationship is with a particular gambling mode or activity.
It seems counter-intuitive that the answer to just three questions: a general
favourability rating; a question about involvement; and a question about
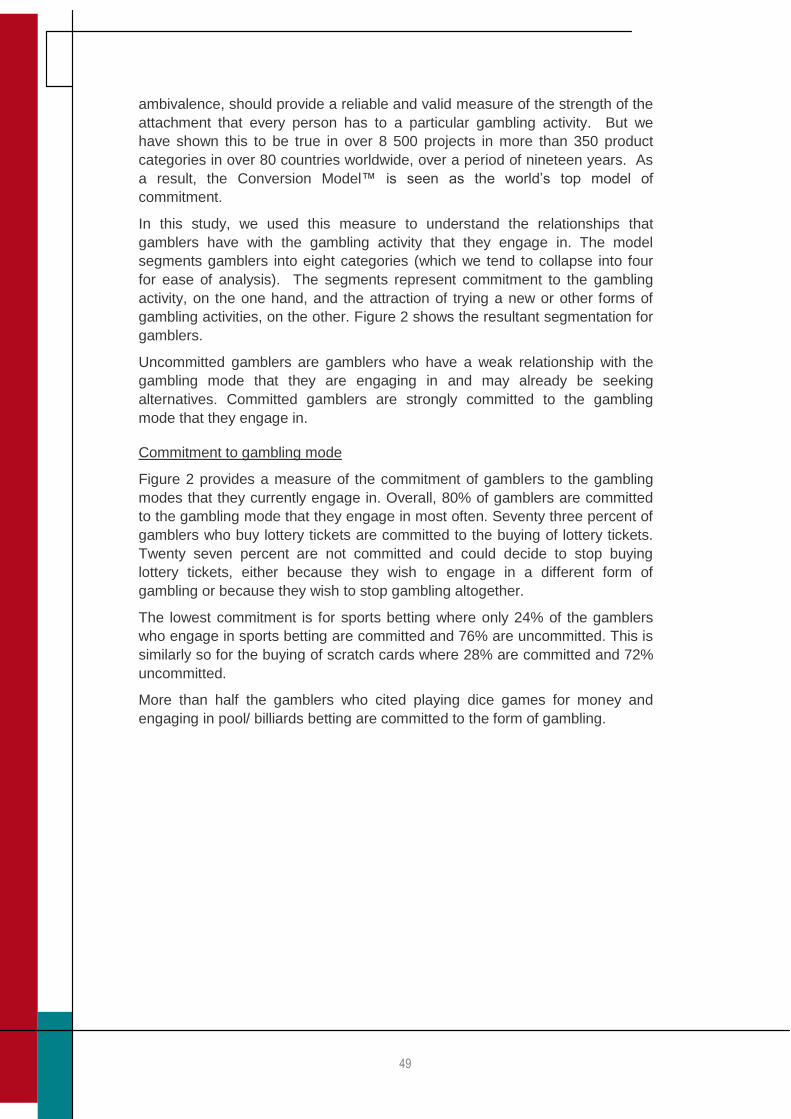
49
ambivalence, should provide a reliable and valid measure of the strength of the
attachment that every person has to a particular gambling activity. But we
have shown this to be true in over 8 500 projects in more than 350 product
categories in over 80 countries worldwide, over a period of nineteen years. As
a result, the Conversion Model™ is seen as the world‟s top model of
commitment.
In this study, we used this measure to understand the relationships that
gamblers have with the gambling activity that they engage in. The model
segments gamblers into eight categories (which we tend to collapse into four
for ease of analysis). The segments represent commitment to the gambling
activity, on the one hand, and the attraction of trying a new or other forms of
gambling activities, on the other. Figure 2 shows the resultant segmentation for
gamblers.
Uncommitted gamblers are gamblers who have a weak relationship with the
gambling mode that they are engaging in and may already be seeking
alternatives. Committed gamblers are strongly committed to the gambling
mode that they engage in.
Commitment to gambling mode
Figure 2 provides a measure of the commitment of gamblers to the gambling
modes that they currently engage in. Overall, 80% of gamblers are committed
to the gambling mode that they engage in most often. Seventy three percent of
gamblers who buy lottery tickets are committed to the buying of lottery tickets.
Twenty seven percent are not committed and could decide to stop buying
lottery tickets, either because they wish to engage in a different form of
gambling or because they wish to stop gambling altogether.
The lowest commitment is for sports betting where only 24% of the gamblers
who engage in sports betting are committed and 76% are uncommitted. This is
similarly so for the buying of scratch cards where 28% are committed and 72%
uncommitted.
More than half the gamblers who cited playing dice games for money and
engaging in pool/ billiards betting are committed to the form of gambling.
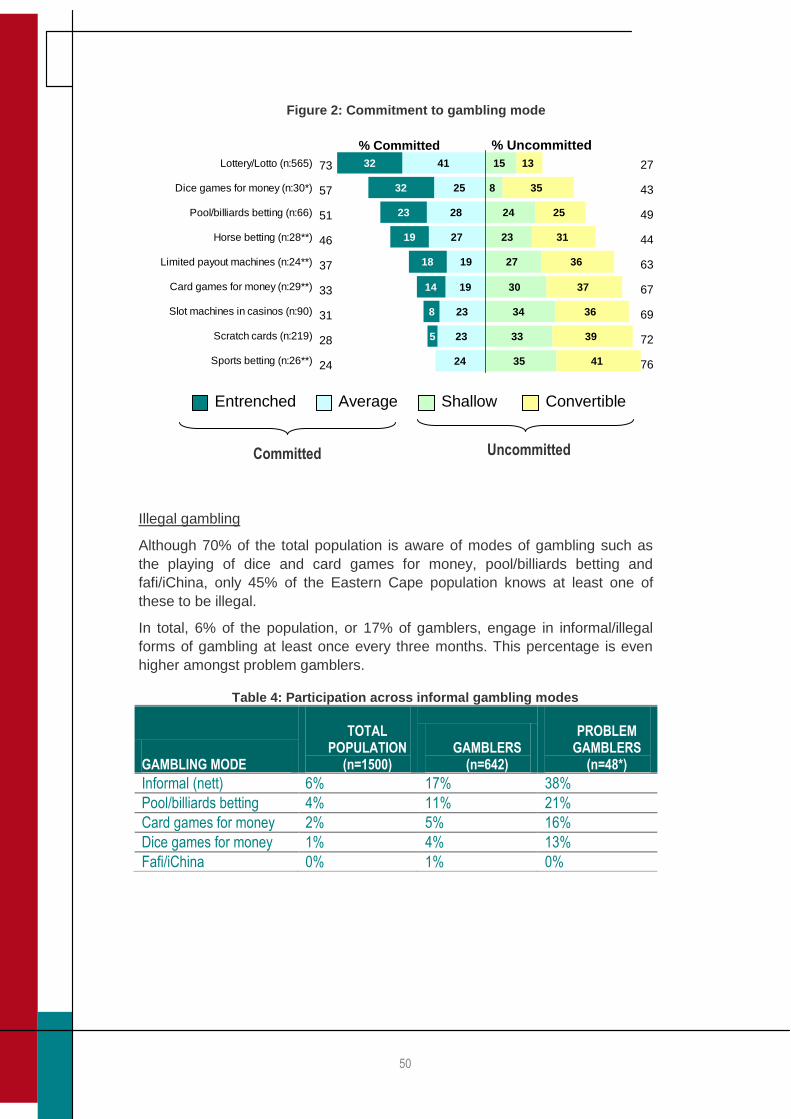
50
Illegal gambling
Although 70% of the total population is aware of modes of gambling such as
the playing of dice and card games for money, pool/billiards betting and
fafi/iChina, only 45% of the Eastern Cape population knows at least one of
these to be illegal.
In total, 6% of the population, or 17% of gamblers, engage in informal/illegal
forms of gambling at least once every three months. This percentage is even
higher amongst problem gamblers.
Table 4: Participation across informal gambling modes
GAMBLING MODE
TOTAL POPULATION
(n=1500) GAMBLERS
(n=642)
PROBLEM GAMBLERS
(n=48*)
Informal (nett) 6% 17% 38%
Pool/billiards betting 4% 11% 21%
Card games for money 2% 5% 16%
Dice games for money 1% 4% 13%
Fafi/iChina 0% 1% 0%
Figure 2: Commitment to gambling mode
24
23
23
19
19
27
28
25
41
5
8
14
18
19
23
32
32
35
33
34
30
27
23
24
8
15
41
39
36
37
36
31
25
35
13
Sports betting (n:26**)
Scratch cards (n:219)
Slot machines in casinos (n:90)
Card games for money (n:29**)
Limited payout machines (n:24**)
Horse betting (n:28**)
Pool/billiards betting (n:66)
Dice games for money (n:30*)
Lottery/Lotto (n:565)
% Committed
73
57
51
46
37
33
31
28
24
27
43
49
44
63
67
69
72
76
Entrenched Average Shallow Convertible
Committed
Uncommitted
% Uncommitted
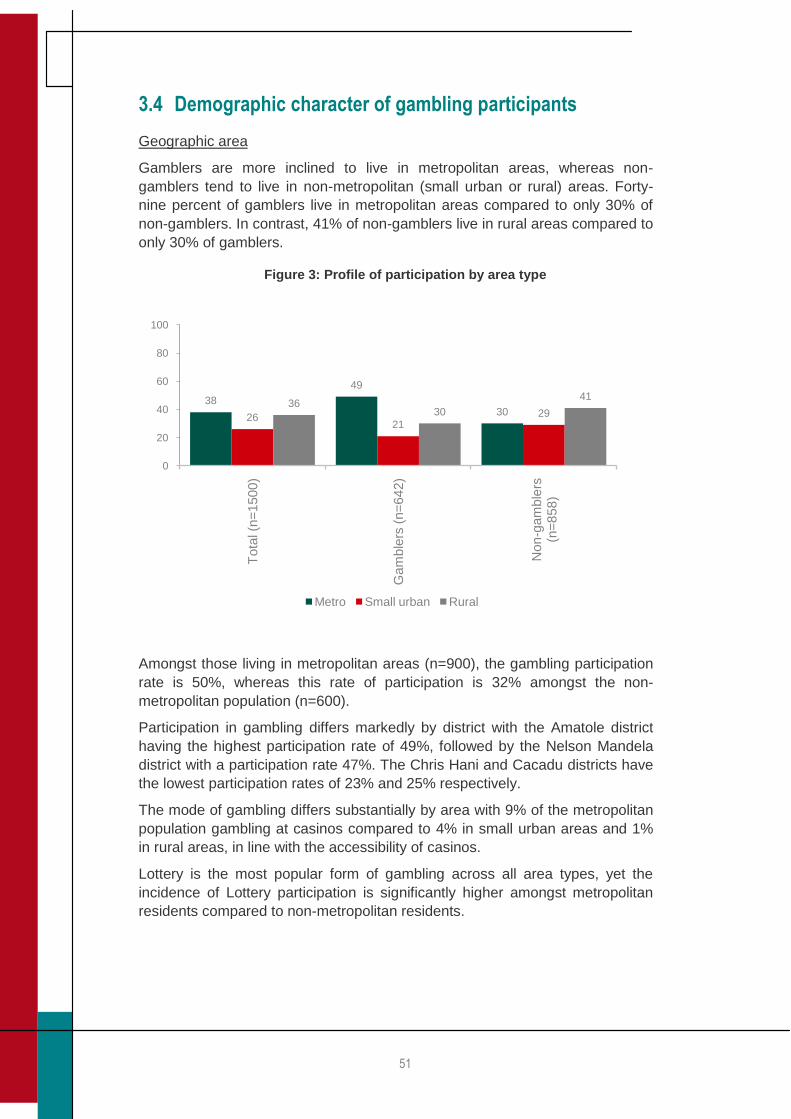
51
3.4 Demographic character of gambling participants
Geographic area
Gamblers are more inclined to live in metropolitan areas, whereas non-
gamblers tend to live in non-metropolitan (small urban or rural) areas. Forty-
nine percent of gamblers live in metropolitan areas compared to only 30% of
non-gamblers. In contrast, 41% of non-gamblers live in rural areas compared to
only 30% of gamblers.
Figure 3: Profile of participation by area type
Amongst those living in metropolitan areas (n=900), the gambling participation
rate is 50%, whereas this rate of participation is 32% amongst the non-
metropolitan population (n=600).
Participation in gambling differs markedly by district with the Amatole district
having the highest participation rate of 49%, followed by the Nelson Mandela
district with a participation rate 47%. The Chris Hani and Cacadu districts have
the lowest participation rates of 23% and 25% respectively.
The mode of gambling differs substantially by area with 9% of the metropolitan
population gambling at casinos compared to 4% in small urban areas and 1%
in rural areas, in line with the accessibility of casinos.
Lottery is the most popular form of gambling across all area types, yet the
incidence of Lottery participation is significantly higher amongst metropolitan
residents compared to non-metropolitan residents.
38
49
3026
2129
3630
41
0
20
40
60
80
100
Tota
l (n
=1500)
Gam
ble
rs (
n=
642)
Non
-gam
ble
rs
(n=
858)
Metro Small urban Rural
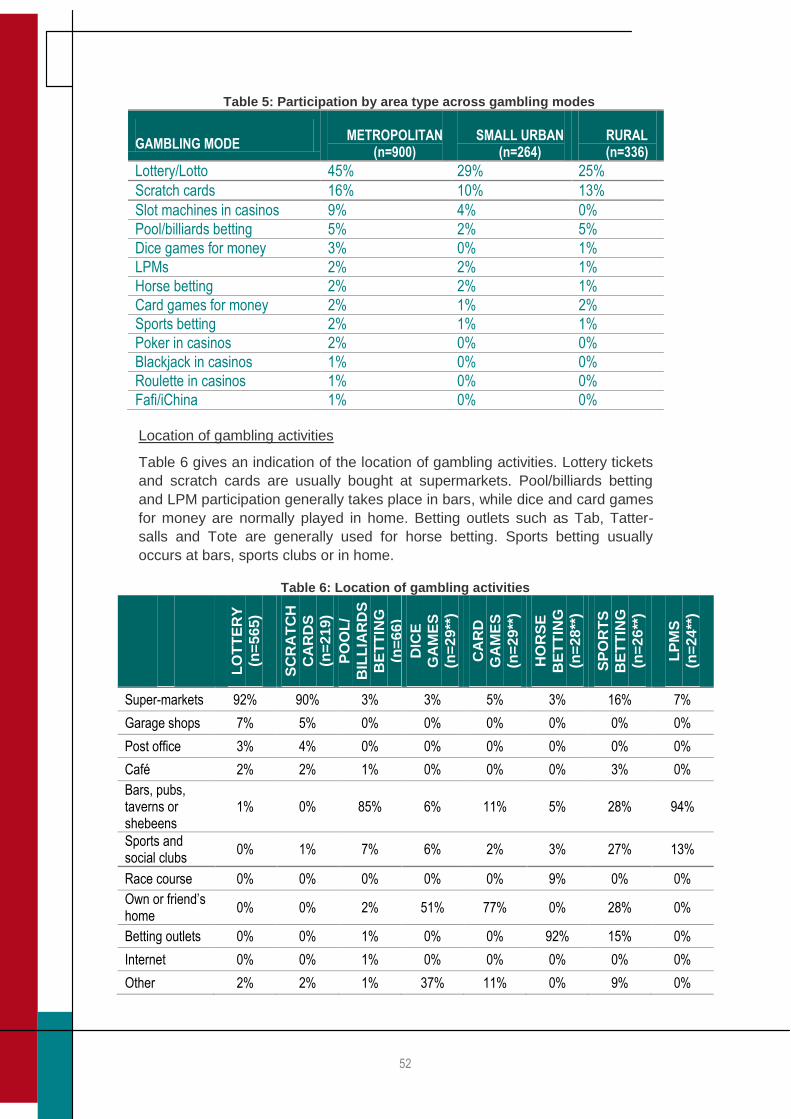
52
Table 5: Participation by area type across gambling modes
GAMBLING MODE METROPOLITAN
(n=900) SMALL URBAN
(n=264) RURAL (n=336)
Lottery/Lotto 45% 29% 25%
Scratch cards 16% 10% 13%
Slot machines in casinos 9% 4% 0%
Pool/billiards betting 5% 2% 5%
Dice games for money 3% 0% 1%
LPMs 2% 2% 1%
Horse betting 2% 2% 1%
Card games for money 2% 1% 2%
Sports betting 2% 1% 1%
Poker in casinos 2% 0% 0%
Blackjack in casinos 1% 0% 0%
Roulette in casinos 1% 0% 0%
Fafi/iChina 1% 0% 0%
Location of gambling activities
Table 6 gives an indication of the location of gambling activities. Lottery tickets
and scratch cards are usually bought at supermarkets. Pool/billiards betting
and LPM participation generally takes place in bars, while dice and card games
for money are normally played in home. Betting outlets such as Tab, Tatter-
salls and Tote are generally used for horse betting. Sports betting usually
occurs at bars, sports clubs or in home.
Table 6: Location of gambling activities
LO
TT
ER
Y
(n=
56
5)
SC
RA
TC
H
CA
RD
S
(n=
21
9)
PO
OL
/
BIL
LIA
RD
S
BE
TT
ING
(n=
66
)
DIC
E
GA
ME
S
(n=
29
**)
CA
RD
GA
ME
S
(n=
29
**)
HO
RS
E
BE
TT
ING
(n=
28
**)
SP
OR
TS
BE
TT
ING
(n=
26
**)
LP
MS
(n=
24
**)
Super-markets 92% 90% 3% 3% 5% 3% 16% 7%
Garage shops 7% 5% 0% 0% 0% 0% 0% 0%
Post office 3% 4% 0% 0% 0% 0% 0% 0%
Café 2% 2% 1% 0% 0% 0% 3% 0%
Bars, pubs, taverns or shebeens
1% 0% 85% 6% 11% 5% 28% 94%
Sports and social clubs
0% 1% 7% 6% 2% 3% 27% 13%
Race course 0% 0% 0% 0% 0% 9% 0% 0%
Own or friend’s home
0% 0% 2% 51% 77% 0% 28% 0%
Betting outlets 0% 0% 1% 0% 0% 92% 15% 0%
Internet 0% 0% 1% 0% 0% 0% 0% 0%
Other 2% 2% 1% 37% 11% 0% 9% 0%
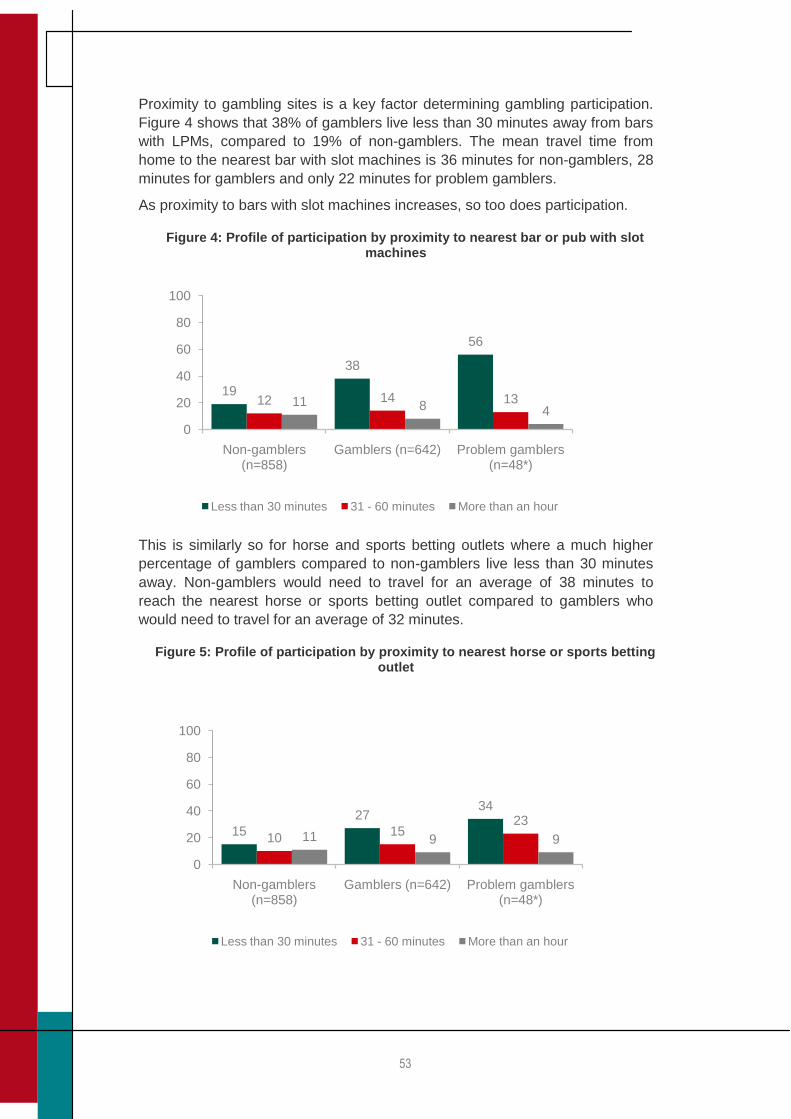
53
Proximity to gambling sites is a key factor determining gambling participation.
Figure 4 shows that 38% of gamblers live less than 30 minutes away from bars
with LPMs, compared to 19% of non-gamblers. The mean travel time from
home to the nearest bar with slot machines is 36 minutes for non-gamblers, 28
minutes for gamblers and only 22 minutes for problem gamblers.
As proximity to bars with slot machines increases, so too does participation.
Figure 4: Profile of participation by proximity to nearest bar or pub with slot machines
This is similarly so for horse and sports betting outlets where a much higher
percentage of gamblers compared to non-gamblers live less than 30 minutes
away. Non-gamblers would need to travel for an average of 38 minutes to
reach the nearest horse or sports betting outlet compared to gamblers who
would need to travel for an average of 32 minutes.
Figure 5: Profile of participation by proximity to nearest horse or sports betting outlet
15
2734
1015
23
11 9 9
0
20
40
60
80
100
Non-gamblers (n=858)
Gamblers (n=642) Problem gamblers (n=48*)
Less than 30 minutes 31 - 60 minutes More than an hour
19
38
56
12 14 1311 8 4
0
20
40
60
80
100
Non-gamblers (n=858)
Gamblers (n=642) Problem gamblers (n=48*)
Less than 30 minutes 31 - 60 minutes More than an hour
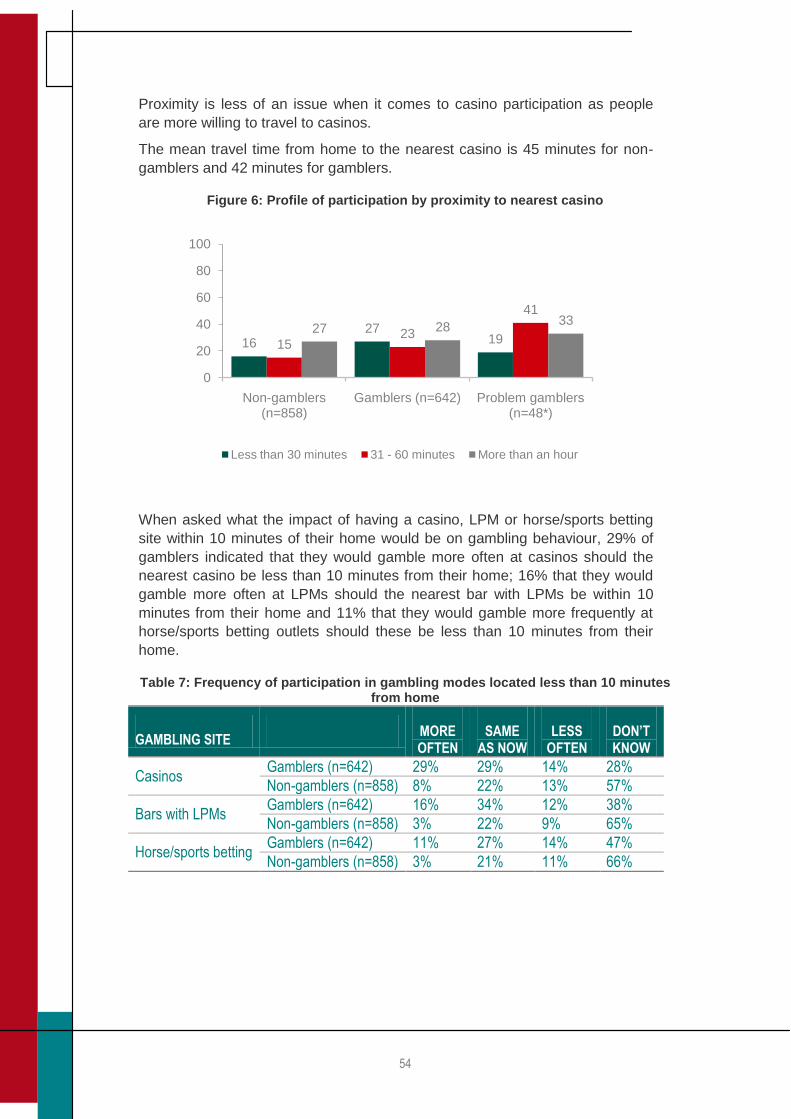
54
Proximity is less of an issue when it comes to casino participation as people
are more willing to travel to casinos.
The mean travel time from home to the nearest casino is 45 minutes for non-
gamblers and 42 minutes for gamblers.
Figure 6: Profile of participation by proximity to nearest casino
When asked what the impact of having a casino, LPM or horse/sports betting
site within 10 minutes of their home would be on gambling behaviour, 29% of
gamblers indicated that they would gamble more often at casinos should the
nearest casino be less than 10 minutes from their home; 16% that they would
gamble more often at LPMs should the nearest bar with LPMs be within 10
minutes from their home and 11% that they would gamble more frequently at
horse/sports betting outlets should these be less than 10 minutes from their
home.
Table 7: Frequency of participation in gambling modes located less than 10 minutes from home
GAMBLING SITE MORE OFTEN
SAME AS NOW
LESS OFTEN
DON’T KNOW
Casinos Gamblers (n=642) 29% 29% 14% 28%
Non-gamblers (n=858) 8% 22% 13% 57%
Bars with LPMs Gamblers (n=642) 16% 34% 12% 38%
Non-gamblers (n=858) 3% 22% 9% 65%
Horse/sports betting Gamblers (n=642) 11% 27% 14% 47%
Non-gamblers (n=858) 3% 21% 11% 66%
1627
191523
41
27 2833
0
20
40
60
80
100
Non-gamblers (n=858)
Gamblers (n=642) Problem gamblers (n=48*)
Less than 30 minutes 31 - 60 minutes More than an hour
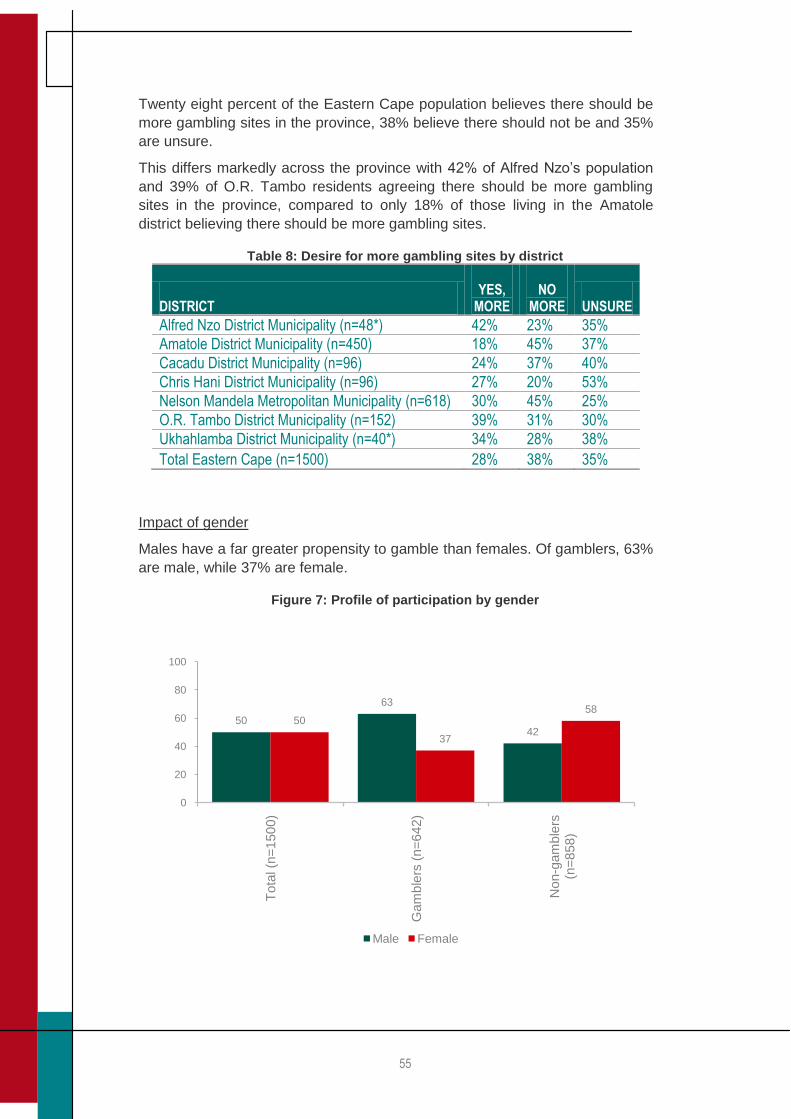
55
Twenty eight percent of the Eastern Cape population believes there should be
more gambling sites in the province, 38% believe there should not be and 35%
are unsure.
This differs markedly across the province with 42% of Alfred Nzo‟s population
and 39% of O.R. Tambo residents agreeing there should be more gambling
sites in the province, compared to only 18% of those living in the Amatole
district believing there should be more gambling sites.
Table 8: Desire for more gambling sites by district
DISTRICT YES,
MORE NO
MORE UNSURE
Alfred Nzo District Municipality (n=48*) 42% 23% 35%
Amatole District Municipality (n=450) 18% 45% 37%
Cacadu District Municipality (n=96) 24% 37% 40%
Chris Hani District Municipality (n=96) 27% 20% 53%
Nelson Mandela Metropolitan Municipality (n=618) 30% 45% 25%
O.R. Tambo District Municipality (n=152) 39% 31% 30%
Ukhahlamba District Municipality (n=40*) 34% 28% 38%
Total Eastern Cape (n=1500) 28% 38% 35%
Impact of gender
Males have a far greater propensity to gamble than females. Of gamblers, 63%
are male, while 37% are female.
Figure 7: Profile of participation by gender
50
63
4250
37
58
0
20
40
60
80
100
Tota
l (n
=1500)
Gam
ble
rs (
n=
642)
Non-g
am
ble
rs
(n=
858)
Male Female
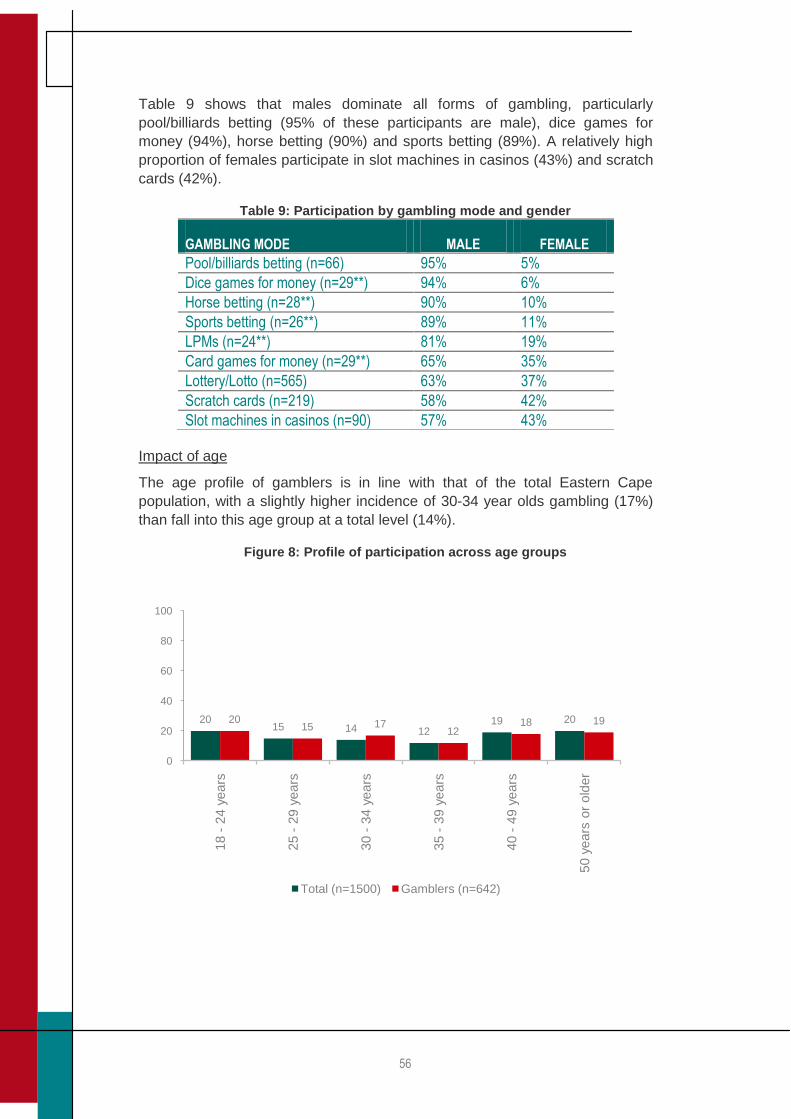
56
Table 9 shows that males dominate all forms of gambling, particularly
pool/billiards betting (95% of these participants are male), dice games for
money (94%), horse betting (90%) and sports betting (89%). A relatively high
proportion of females participate in slot machines in casinos (43%) and scratch
cards (42%).
Table 9: Participation by gambling mode and gender
GAMBLING MODE MALE FEMALE
Pool/billiards betting (n=66) 95% 5%
Dice games for money (n=29**) 94% 6%
Horse betting (n=28**) 90% 10%
Sports betting (n=26**) 89% 11%
LPMs (n=24**) 81% 19%
Card games for money (n=29**) 65% 35%
Lottery/Lotto (n=565) 63% 37%
Scratch cards (n=219) 58% 42%
Slot machines in casinos (n=90) 57% 43%
Impact of age
The age profile of gamblers is in line with that of the total Eastern Cape
population, with a slightly higher incidence of 30-34 year olds gambling (17%)
than fall into this age group at a total level (14%).
Figure 8: Profile of participation across age groups
2015 14 12
19 202015 17
1218 19
0
20
40
60
80
100
18 -
24 y
ears
25 -
29 y
ears
30 -
34 y
ears
35 -
39 y
ears
40 -
49 y
ears
50 y
ears
or
old
er
Total (n=1500) Gamblers (n=642)
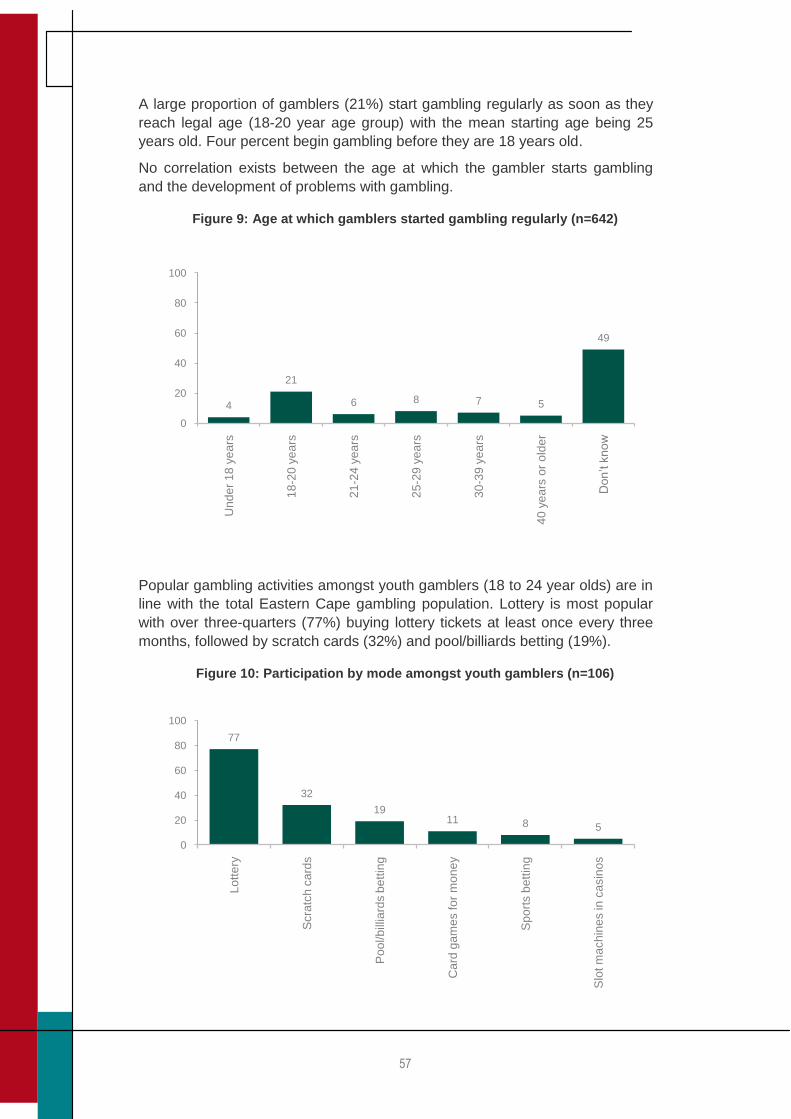
57
A large proportion of gamblers (21%) start gambling regularly as soon as they
reach legal age (18-20 year age group) with the mean starting age being 25
years old. Four percent begin gambling before they are 18 years old.
No correlation exists between the age at which the gambler starts gambling
and the development of problems with gambling.
Figure 9: Age at which gamblers started gambling regularly (n=642)
Popular gambling activities amongst youth gamblers (18 to 24 year olds) are in
line with the total Eastern Cape gambling population. Lottery is most popular
with over three-quarters (77%) buying lottery tickets at least once every three
months, followed by scratch cards (32%) and pool/billiards betting (19%).
Figure 10: Participation by mode amongst youth gamblers (n=106)
77
32
1911 8 5
0
20
40
60
80
100
Lo
tte
ry
Scra
tch
ca
rds
Po
ol/b
illia
rds b
ett
ing
Card
ga
me
s fo
r m
on
ey
Sp
ort
s b
ett
ing
Slo
t m
ach
ine
s in
ca
sin
os
4
21
6 8 7 5
49
0
20
40
60
80
100
Und
er
18
ye
ars
18
-20
ye
ars
21
-24
ye
ars
25
-29
ye
ars
30
-39
ye
ars
40
ye
ars
or
old
er
Do
n’t k
no
w
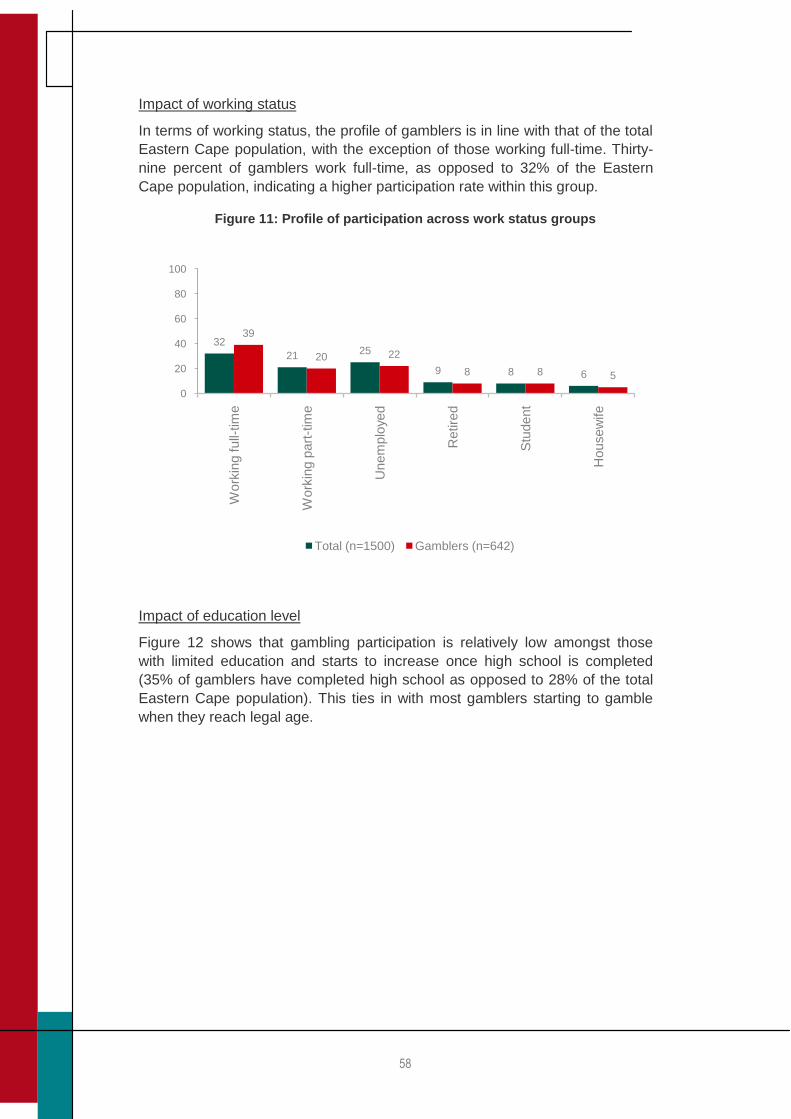
58
Impact of working status
In terms of working status, the profile of gamblers is in line with that of the total
Eastern Cape population, with the exception of those working full-time. Thirty-
nine percent of gamblers work full-time, as opposed to 32% of the Eastern
Cape population, indicating a higher participation rate within this group.
Figure 11: Profile of participation across work status groups
Impact of education level
Figure 12 shows that gambling participation is relatively low amongst those
with limited education and starts to increase once high school is completed
(35% of gamblers have completed high school as opposed to 28% of the total
Eastern Cape population). This ties in with most gamblers starting to gamble
when they reach legal age.
32
21 25
9 8 6
39
20 22
8 8 5
0
20
40
60
80
100
Work
ing full-
tim
e
Work
ing p
art
-tim
e
Unem
plo
yed
Retire
d
Stu
dent
Housew
ife
Total (n=1500) Gamblers (n=642)
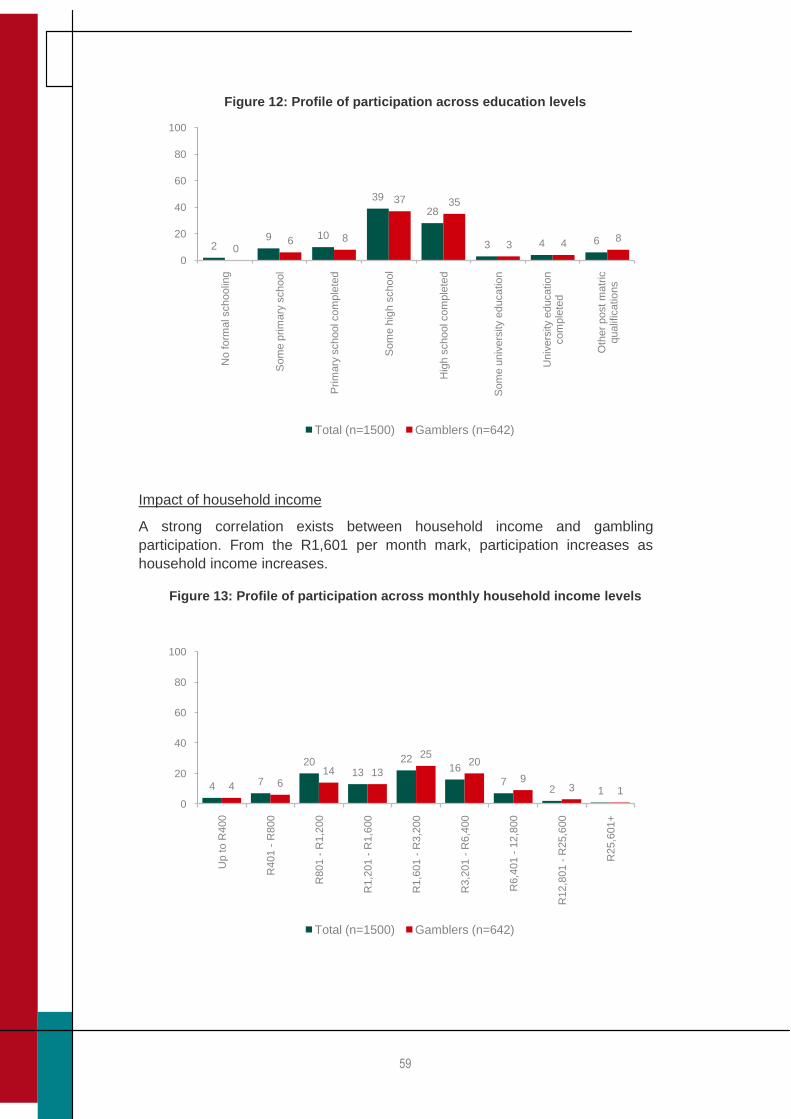
59
Figure 12: Profile of participation across education levels
Impact of household income
A strong correlation exists between household income and gambling
participation. From the R1,601 per month mark, participation increases as
household income increases.
Figure 13: Profile of participation across monthly household income levels
29 10
39
28
3 4 60
6 8
37 35
3 48
0
20
40
60
80
100
No form
al schoolin
g
Som
e p
rim
ary
school
Prim
ary
school com
ple
ted
So
me
hig
h s
ch
oo
l
Hig
h s
chool com
ple
ted
Som
e u
niv
ers
ity e
ducatio
n
Univ
ers
ity e
ducatio
n
com
ple
ted
Oth
er
post m
atr
ic
qualif
icatio
ns
Total (n=1500) Gamblers (n=642)
4 7
2013
2216
72 14 6
14 13
2520
93 1
0
20
40
60
80
100
Up t
o R
40
0
R401 -
R800
R801 -
R1,2
00
R1,2
01 -
R1,6
00
R1,6
01 -
R3,2
00
R3,2
01 -
R6,4
00
R6,4
01 -
12,8
00
R12,8
01 -
R25,6
00
R25,6
01+
Total (n=1500) Gamblers (n=642)
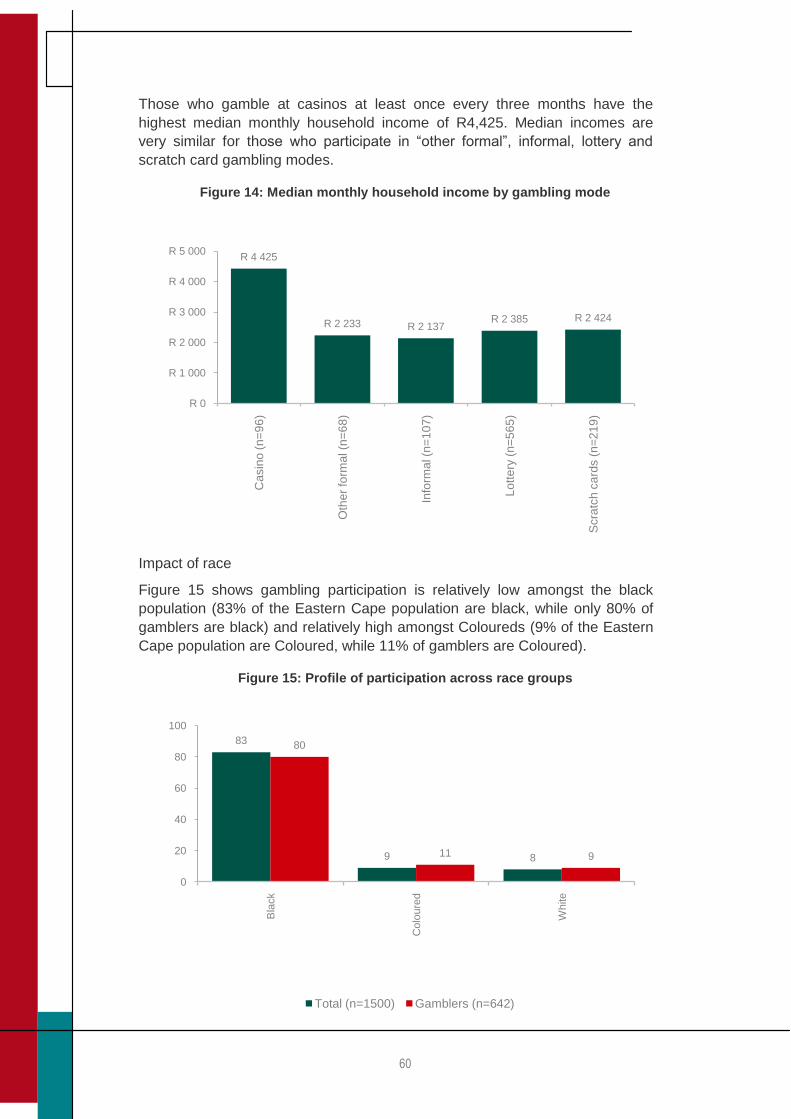
60
Those who gamble at casinos at least once every three months have the
highest median monthly household income of R4,425. Median incomes are
very similar for those who participate in “other formal”, informal, lottery and
scratch card gambling modes.
Figure 14: Median monthly household income by gambling mode
Impact of race
Figure 15 shows gambling participation is relatively low amongst the black
population (83% of the Eastern Cape population are black, while only 80% of
gamblers are black) and relatively high amongst Coloureds (9% of the Eastern
Cape population are Coloured, while 11% of gamblers are Coloured).
Figure 15: Profile of participation across race groups
R 4 425
R 2 233 R 2 137R 2 385 R 2 424
R 0
R 1 000
R 2 000
R 3 000
R 4 000
R 5 000C
asin
o (
n=
96
)
Oth
er
form
al (n
=6
8)
Info
rma
l (n
=1
07
)
Lo
tte
ry (
n=
56
5)
Scra
tch
ca
rds (
n=
21
9)
83
9 8
80
11 9
0
20
40
60
80
100
Bla
ck
Colo
ure
d
White
Total (n=1500) Gamblers (n=642)
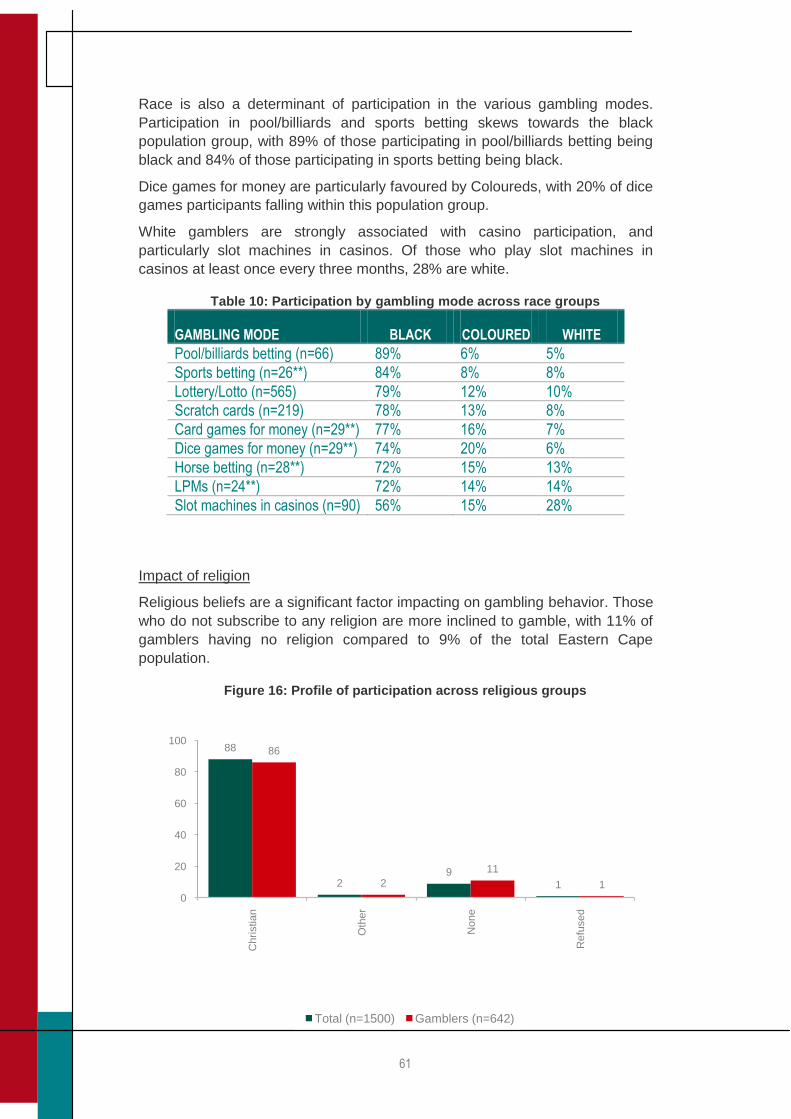
61
Race is also a determinant of participation in the various gambling modes.
Participation in pool/billiards and sports betting skews towards the black
population group, with 89% of those participating in pool/billiards betting being
black and 84% of those participating in sports betting being black.
Dice games for money are particularly favoured by Coloureds, with 20% of dice
games participants falling within this population group.
White gamblers are strongly associated with casino participation, and
particularly slot machines in casinos. Of those who play slot machines in
casinos at least once every three months, 28% are white.
Table 10: Participation by gambling mode across race groups
GAMBLING MODE BLACK COLOURED WHITE
Pool/billiards betting (n=66) 89% 6% 5%
Sports betting (n=26**) 84% 8% 8%
Lottery/Lotto (n=565) 79% 12% 10%
Scratch cards (n=219) 78% 13% 8%
Card games for money (n=29**) 77% 16% 7%
Dice games for money (n=29**) 74% 20% 6%
Horse betting (n=28**) 72% 15% 13%
LPMs (n=24**) 72% 14% 14%
Slot machines in casinos (n=90) 56% 15% 28%
Impact of religion
Religious beliefs are a significant factor impacting on gambling behavior. Those
who do not subscribe to any religion are more inclined to gamble, with 11% of
gamblers having no religion compared to 9% of the total Eastern Cape
population.
Figure 16: Profile of participation across religious groups
88
29
1
86
2
11
1
0
20
40
60
80
100
Christia
n
Oth
er
None
Refu
sed
Total (n=1500) Gamblers (n=642)
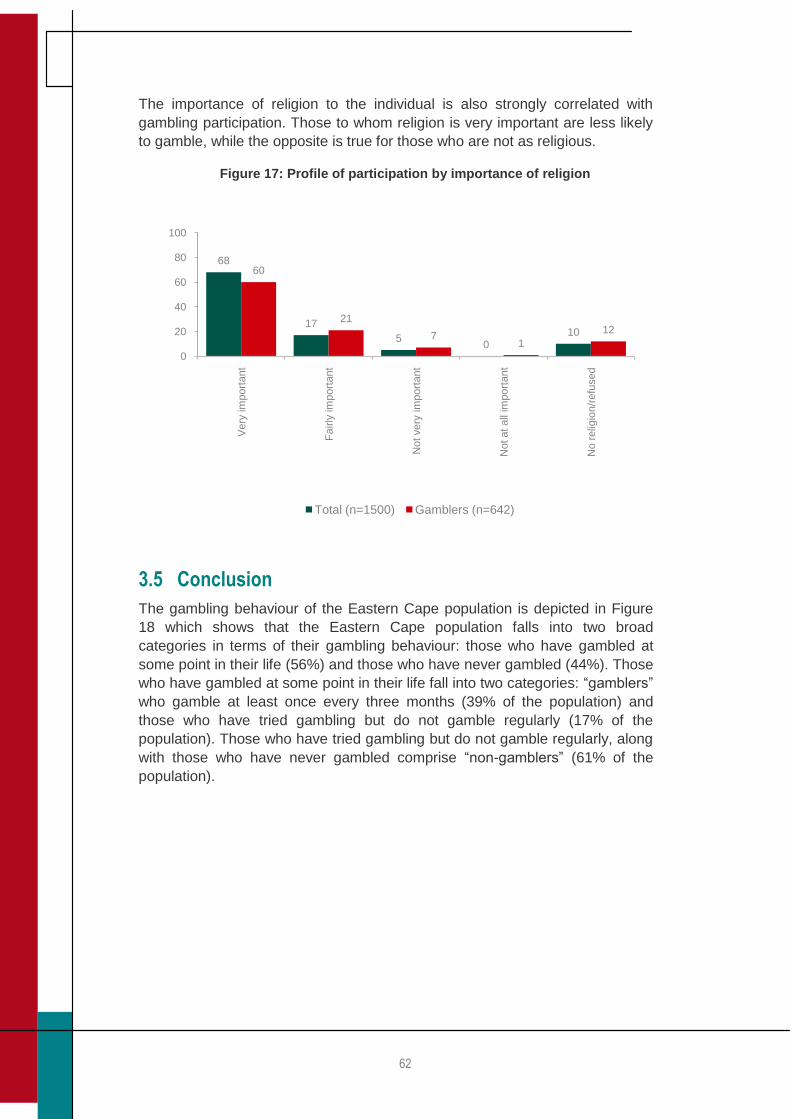
62
The importance of religion to the individual is also strongly correlated with
gambling participation. Those to whom religion is very important are less likely
to gamble, while the opposite is true for those who are not as religious.
Figure 17: Profile of participation by importance of religion
3.5 Conclusion
The gambling behaviour of the Eastern Cape population is depicted in Figure
18 which shows that the Eastern Cape population falls into two broad
categories in terms of their gambling behaviour: those who have gambled at
some point in their life (56%) and those who have never gambled (44%). Those
who have gambled at some point in their life fall into two categories: “gamblers”
who gamble at least once every three months (39% of the population) and
those who have tried gambling but do not gamble regularly (17% of the
population). Those who have tried gambling but do not gamble regularly, along
with those who have never gambled comprise “non-gamblers” (61% of the
population).
68
17
50
10
60
21
71
12
0
20
40
60
80
100V
ery
im
port
ant
Fa
irly
im
port
ant
Not very
im
port
ant
Not at all
import
ant
No r
elig
ion/r
efu
sed
Total (n=1500) Gamblers (n=642)
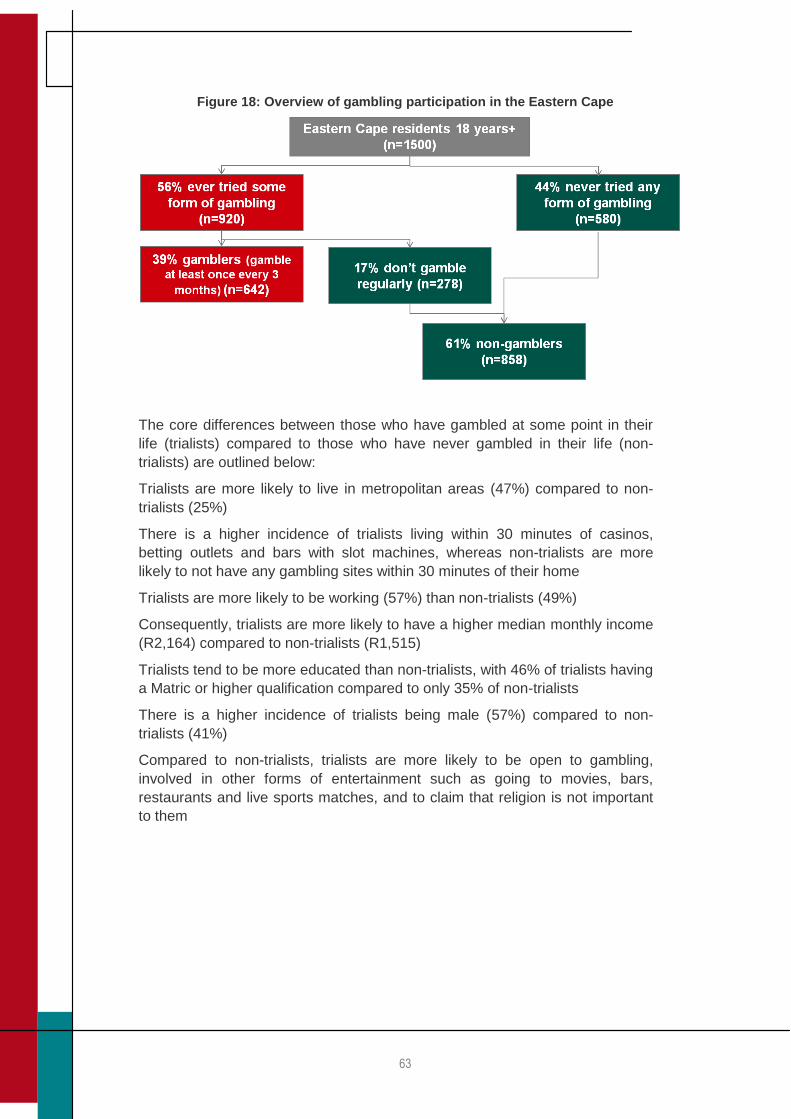
63
Figure 18: Overview of gambling participation in the Eastern Cape
The core differences between those who have gambled at some point in their
life (trialists) compared to those who have never gambled in their life (non-
trialists) are outlined below:
Trialists are more likely to live in metropolitan areas (47%) compared to non-
trialists (25%)
There is a higher incidence of trialists living within 30 minutes of casinos,
betting outlets and bars with slot machines, whereas non-trialists are more
likely to not have any gambling sites within 30 minutes of their home
Trialists are more likely to be working (57%) than non-trialists (49%)
Consequently, trialists are more likely to have a higher median monthly income
(R2,164) compared to non-trialists (R1,515)
Trialists tend to be more educated than non-trialists, with 46% of trialists having
a Matric or higher qualification compared to only 35% of non-trialists
There is a higher incidence of trialists being male (57%) compared to non-
trialists (41%)
Compared to non-trialists, trialists are more likely to be open to gambling,
involved in other forms of entertainment such as going to movies, bars,
restaurants and live sports matches, and to claim that religion is not important
to them
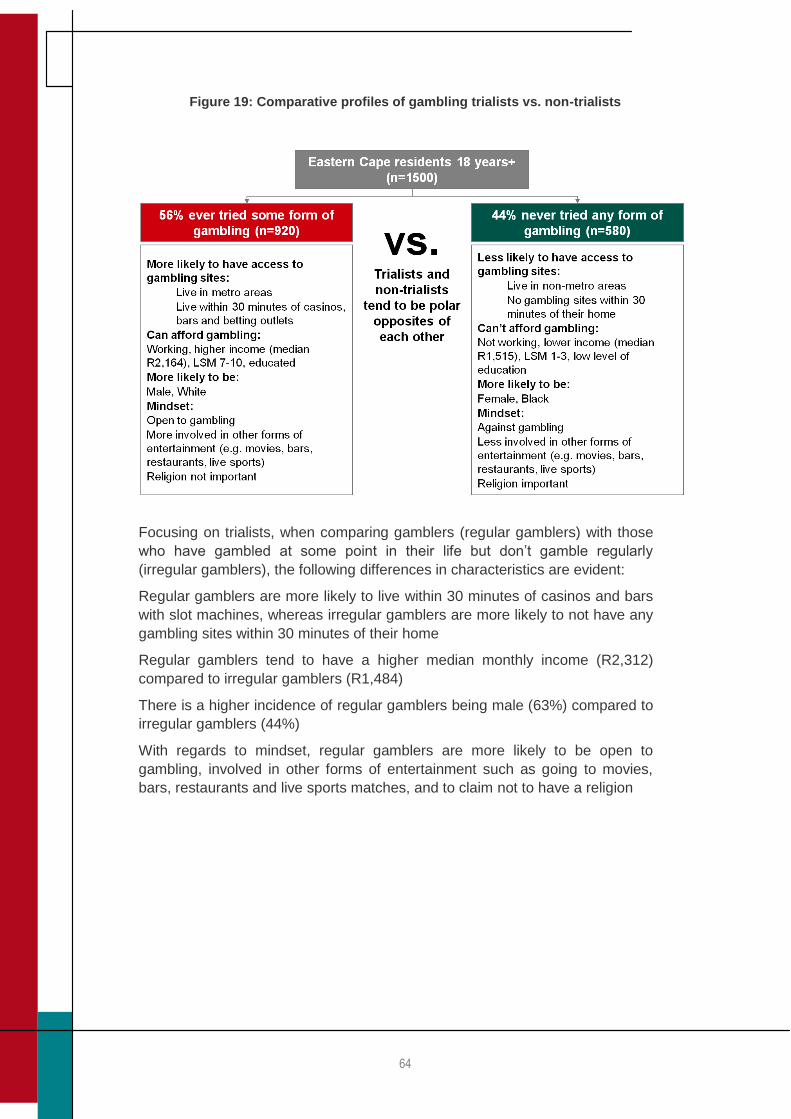
64
Figure 19: Comparative profiles of gambling trialists vs. non-trialists
Focusing on trialists, when comparing gamblers (regular gamblers) with those
who have gambled at some point in their life but don‟t gamble regularly
(irregular gamblers), the following differences in characteristics are evident:
Regular gamblers are more likely to live within 30 minutes of casinos and bars
with slot machines, whereas irregular gamblers are more likely to not have any
gambling sites within 30 minutes of their home
Regular gamblers tend to have a higher median monthly income (R2,312)
compared to irregular gamblers (R1,484)
There is a higher incidence of regular gamblers being male (63%) compared to
irregular gamblers (44%)
With regards to mindset, regular gamblers are more likely to be open to
gambling, involved in other forms of entertainment such as going to movies,
bars, restaurants and live sports matches, and to claim not to have a religion
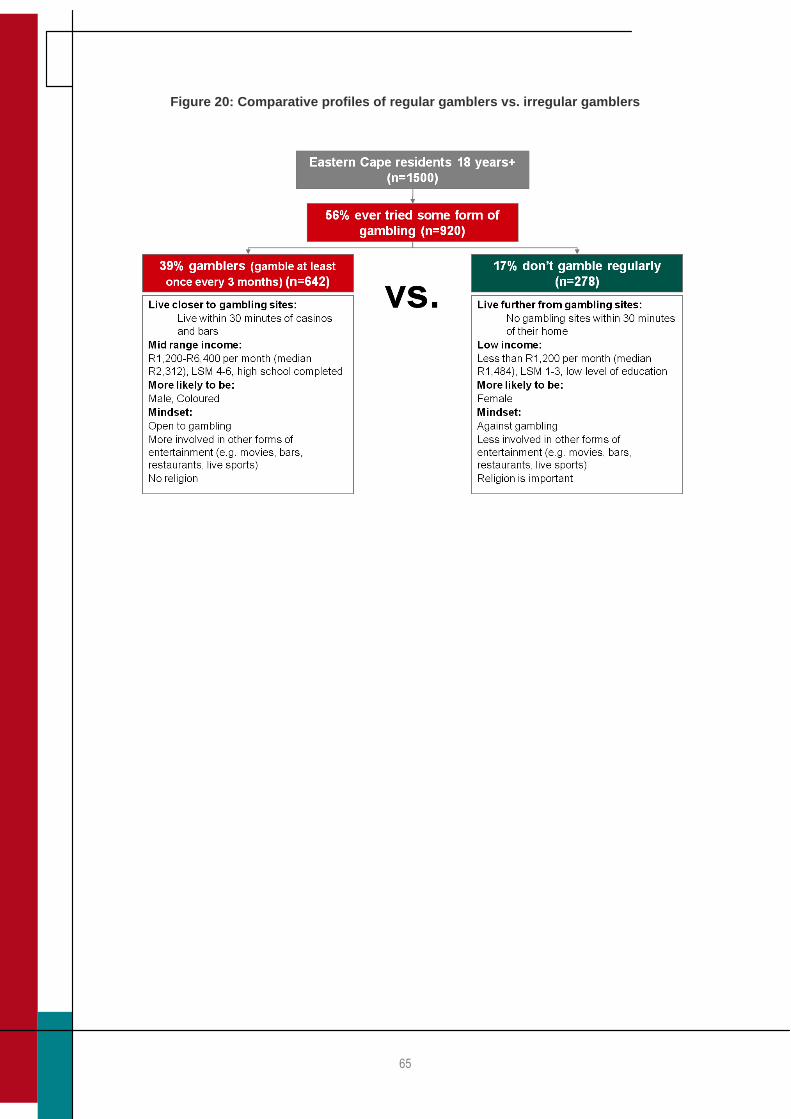
65
Figure 20: Comparative profiles of regular gamblers vs. irregular gamblers
66
SECTION C
The Social Impact of
Gambling
67
4. PROBLEM GAMBLING
One of the tasks of the Eastern Cape Gambling and Betting Board is to monitor
the social impact of gambling including the identification of problem gambling
and the causes, patterns and consequences of such.
Determining the extent to which gambling has leaked into the area of problem
gambling is a complex concern which is impacted on by “moral judgements,
which vary in different cultures, at different points in history and among different
individuals”27. For the purpose of this report, the definition of problem gambling
utilized by the Ferris and Wynne (2001) is utilized. The definition focuses on
the consequences of problem gambling for the individual and for society at
large by defining problem gambling as: “gambling behaviour that creates
negative consequences for the gambler, others in his or her social network, or
for the community"28. This is similar to the definition adopted by the NGB
(2005) which states that “gambling behaviour should be viewed as problematic
when gamblers gamble excessively and thereby cause significant harm to
themselves and to others and when gamblers fail to control this excessive
behaviour by themselves or without assistance”. In accordance with this
understanding of problem gambling, this report segments the Eastern Cape
gambling population into three categories in relation to gambling behaviour29:
Gamblers are recreational gamblers who gamble on social occasions with
family, friends or colleagues. For the purposes of this report, this category is
defined as those who gamble at least once every three months. Generally, they
have predetermined acceptable losses and, by and large, their gambling
activities cause little harm, being recreational in approach.
Problem gamblers are gamblers who gamble frequently and beyond their
means, and whose behaviour causes harm both to themselves and to others.
Pathological problem gamblers have a psychiatric disorder diagnosable by
strict criteria. It is regarded as a disorder of impulse control in that such
gamblers are unable to control their gambling, with consequent significant
damage to themselves and others. No pathological gamblers were identified
through the household survey. A small percentage of pathological gamblers
were identified through the intercept survey. While incidence of pathological
gamblers cannot be presented in this chapter, the views and experience of
pathological gamblers are shared in this chapter where sufficient returns allow
valid data analysis.
27 NGB (2005): 54 28 Ferris, J., & Wynne, H. (2001). The Canadian Problem Gambling Index: Final report. Ottawa, ON: Canadian Centre on Substance Abuse. 29 The three categories of gamblers utilised in this report are drawn from the NGB (2005). The motive for using these categories are as follows: (I) It is allows this report to make comparisons with the national norm and (ii) The data falls naturally into these three categories.
68
There are a number of challenges to measuring problem gambling and to
determining the extent of it. These include the following:
Problem gambling, existing as a social construct, is a difficult behaviour to
measure as the line between regular gambling and problem gambling is a shifty
and shifting one. The biggest concern with understandings of problem
gambling that define gambling as behaviour that causes problem for the
individual, his or her family or for society in general is that the definition
depends on the extent to which the circumstances of that individual (or society)
can tolerate a greater or lesser expenditure in terms of time and money on
gambling activity.30 For the purposes of this study, the Gamblers Anonymous
(GA) twenty questions were used to determine problem and pathological
problem gamblers. Seven or more questions answered affirmatively in the GA
test indicate problem gamblers and 14 or more questions answered
affirmatively in the GA test indicate pathological problem gamblers
The survey approach rests on self reported concerns that the respondent might
have with his or her own gambling behaviour which is likely to result in under
reporting as addicts are frequently unwilling to expose their behaviour to other
people and are frequently unaware of the consequences of their behaviour. To
address the former aspect, respondents were given the option to self-complete
the 20 GA questions in confidence
As a result, estimates provided in this report (and in fact all reports on problem
gambling) should be regarded as estimates that capture the direction and
estimated degree of the problem.
The twenty questions offered by GA and used in this report to determine
problem gambling are:
Do you miss work to go gambling?
Is gambling making your home life unhappy?
Is gambling giving you a bad reputation?
Have you ever felt remorse after gambling?
Do you ever gamble to get money to pay debts or solve financial difficulties?
Does gambling reduce your ambition or efficiency?
After losing, do you feel you must return as soon as possible to win back your
losses?
After a win, do you have a strong urge to return and win more?
Do you often gamble until your last Rand has gone?
Do you ever borrow money to finance your gambling?
Have you ever sold anything to finance your gambling?
Are you reluctant to use “gambling money” for other expenses?
Does gambling make you neglect yourself or your family?
30 Elena Svetieva & Michael Walker (2008): Inconsistency between concept and measurement: The Canadian Problem Gambling Index (CPGI). Journal of Gambling Issues: Issue 22, December
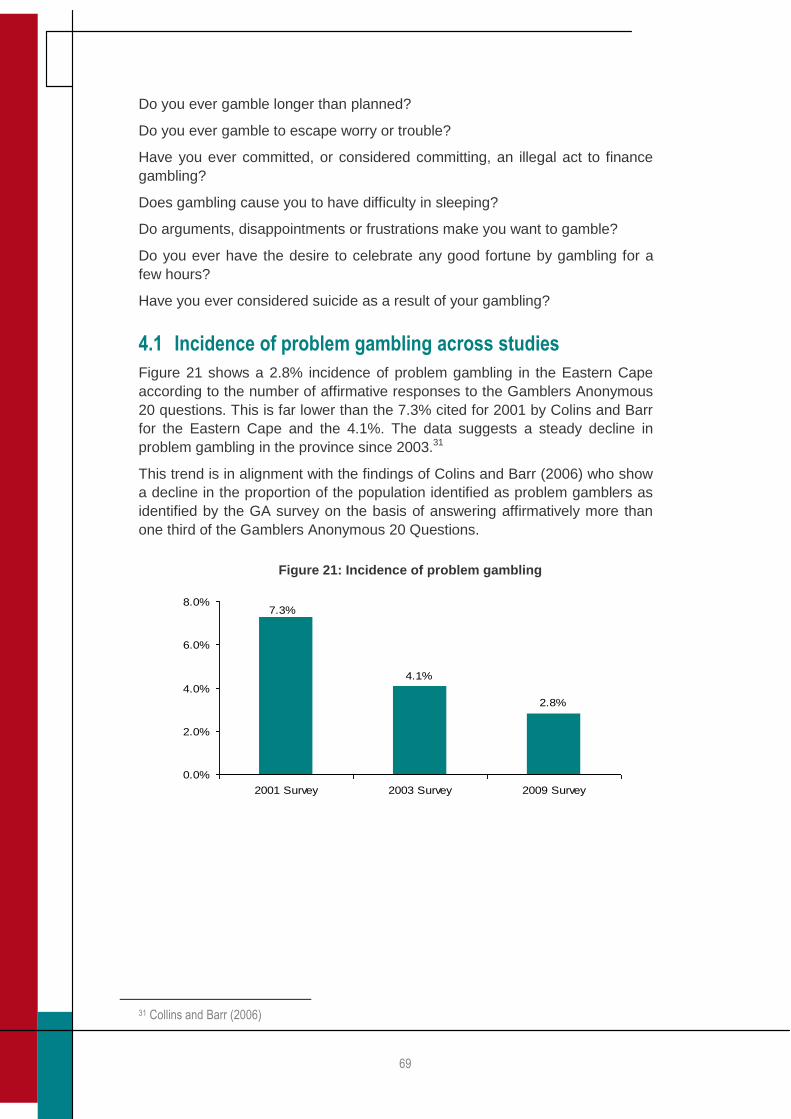
69
Do you ever gamble longer than planned?
Do you ever gamble to escape worry or trouble?
Have you ever committed, or considered committing, an illegal act to finance
gambling?
Does gambling cause you to have difficulty in sleeping?
Do arguments, disappointments or frustrations make you want to gamble?
Do you ever have the desire to celebrate any good fortune by gambling for a
few hours?
Have you ever considered suicide as a result of your gambling?
4.1 Incidence of problem gambling across studies
Figure 21 shows a 2.8% incidence of problem gambling in the Eastern Cape
according to the number of affirmative responses to the Gamblers Anonymous
20 questions. This is far lower than the 7.3% cited for 2001 by Colins and Barr
for the Eastern Cape and the 4.1%. The data suggests a steady decline in
problem gambling in the province since 2003.31
This trend is in alignment with the findings of Colins and Barr (2006) who show
a decline in the proportion of the population identified as problem gamblers as
identified by the GA survey on the basis of answering affirmatively more than
one third of the Gamblers Anonymous 20 Questions.
31 Collins and Barr (2006)
2.8%
4.1%
7.3%
0.0%
2.0%
4.0%
6.0%
8.0%
2001 Survey 2003 Survey 2009 Survey
Figure 21: Incidence of problem gambling
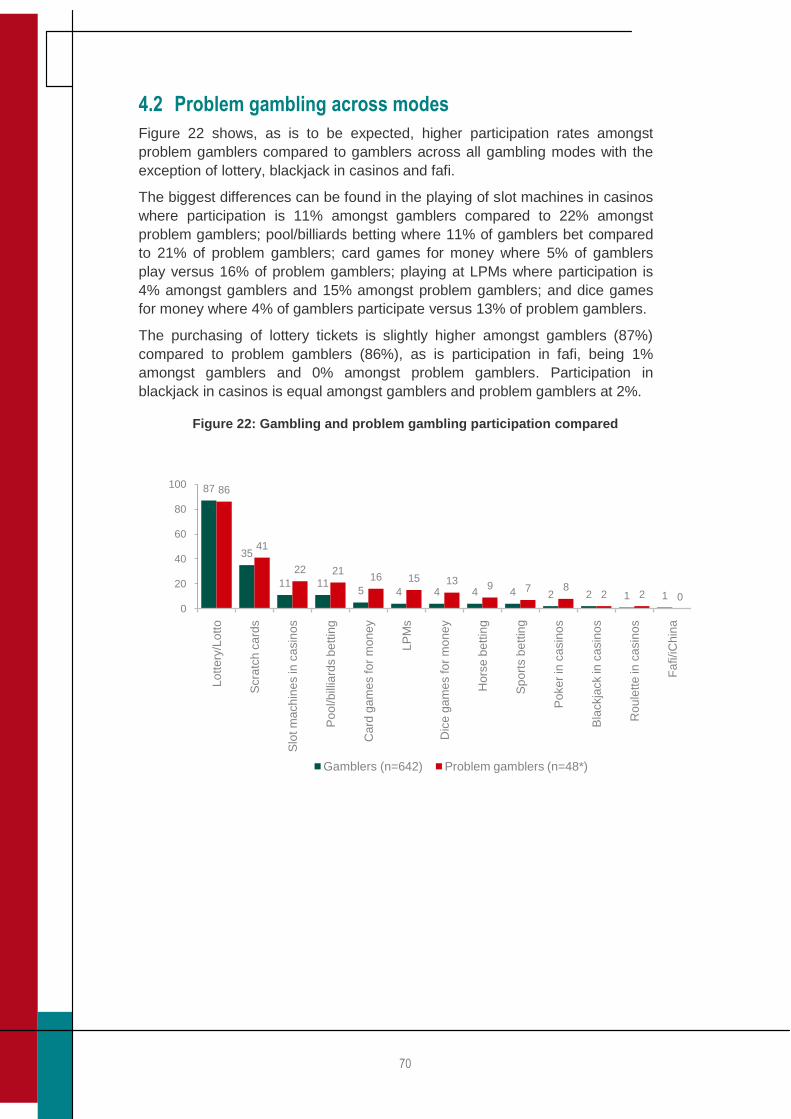
70
4.2 Problem gambling across modes
Figure 22 shows, as is to be expected, higher participation rates amongst
problem gamblers compared to gamblers across all gambling modes with the
exception of lottery, blackjack in casinos and fafi.
The biggest differences can be found in the playing of slot machines in casinos
where participation is 11% amongst gamblers compared to 22% amongst
problem gamblers; pool/billiards betting where 11% of gamblers bet compared
to 21% of problem gamblers; card games for money where 5% of gamblers
play versus 16% of problem gamblers; playing at LPMs where participation is
4% amongst gamblers and 15% amongst problem gamblers; and dice games
for money where 4% of gamblers participate versus 13% of problem gamblers.
The purchasing of lottery tickets is slightly higher amongst gamblers (87%)
compared to problem gamblers (86%), as is participation in fafi, being 1%
amongst gamblers and 0% amongst problem gamblers. Participation in
blackjack in casinos is equal amongst gamblers and problem gamblers at 2%.
Figure 22: Gambling and problem gambling participation compared
87
35
11 115 4 4 4 4 2 2 1 1
86
41
22 2116 15 13 9 7 8
2 2 00
20
40
60
80
100
Lo
tte
ry/L
ott
o
Scra
tch
ca
rds
Slo
t m
ach
ine
s in
ca
sin
os
Po
ol/b
illia
rds b
ett
ing
Ca
rd g
am
es fo
r m
on
ey
LP
Ms
Dic
e g
am
es fo
r m
on
ey
Hors
e b
ett
ing
Sp
ort
s b
ett
ing
Po
ke
r in
ca
sin
os
Bla
ckja
ck in
ca
sin
os
Rou
lett
e in
ca
sin
os
Fa
fi/iC
hin
a
Gamblers (n=642) Problem gamblers (n=48*)
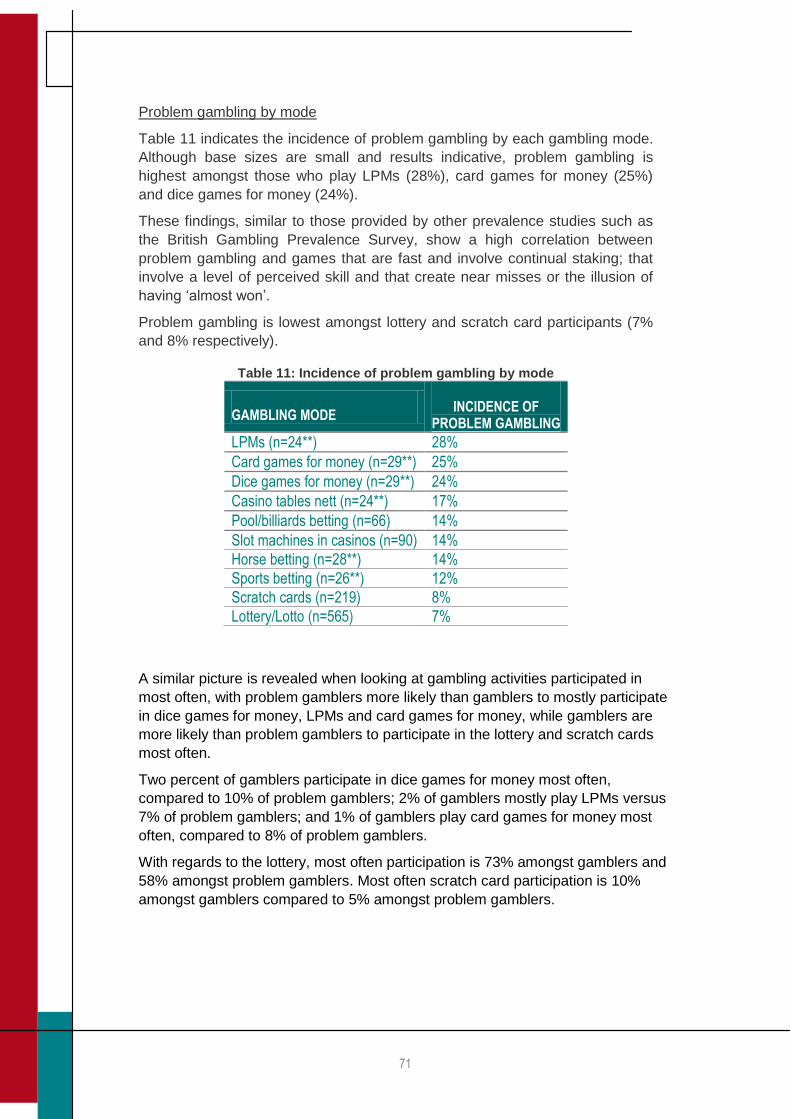
71
Problem gambling by mode
Table 11 indicates the incidence of problem gambling by each gambling mode.
Although base sizes are small and results indicative, problem gambling is
highest amongst those who play LPMs (28%), card games for money (25%)
and dice games for money (24%).
These findings, similar to those provided by other prevalence studies such as
the British Gambling Prevalence Survey, show a high correlation between
problem gambling and games that are fast and involve continual staking; that
involve a level of perceived skill and that create near misses or the illusion of
having „almost won‟.
Problem gambling is lowest amongst lottery and scratch card participants (7%
and 8% respectively).
Table 11: Incidence of problem gambling by mode
GAMBLING MODE INCIDENCE OF
PROBLEM GAMBLING
LPMs (n=24**) 28%
Card games for money (n=29**) 25%
Dice games for money (n=29**) 24%
Casino tables nett (n=24**) 17%
Pool/billiards betting (n=66) 14%
Slot machines in casinos (n=90) 14%
Horse betting (n=28**) 14%
Sports betting (n=26**) 12%
Scratch cards (n=219) 8%
Lottery/Lotto (n=565) 7%
A similar picture is revealed when looking at gambling activities participated in
most often, with problem gamblers more likely than gamblers to mostly participate
in dice games for money, LPMs and card games for money, while gamblers are
more likely than problem gamblers to participate in the lottery and scratch cards
most often.
Two percent of gamblers participate in dice games for money most often,
compared to 10% of problem gamblers; 2% of gamblers mostly play LPMs versus
7% of problem gamblers; and 1% of gamblers play card games for money most
often, compared to 8% of problem gamblers.
With regards to the lottery, most often participation is 73% amongst gamblers and
58% amongst problem gamblers. Most often scratch card participation is 10%
amongst gamblers compared to 5% amongst problem gamblers.
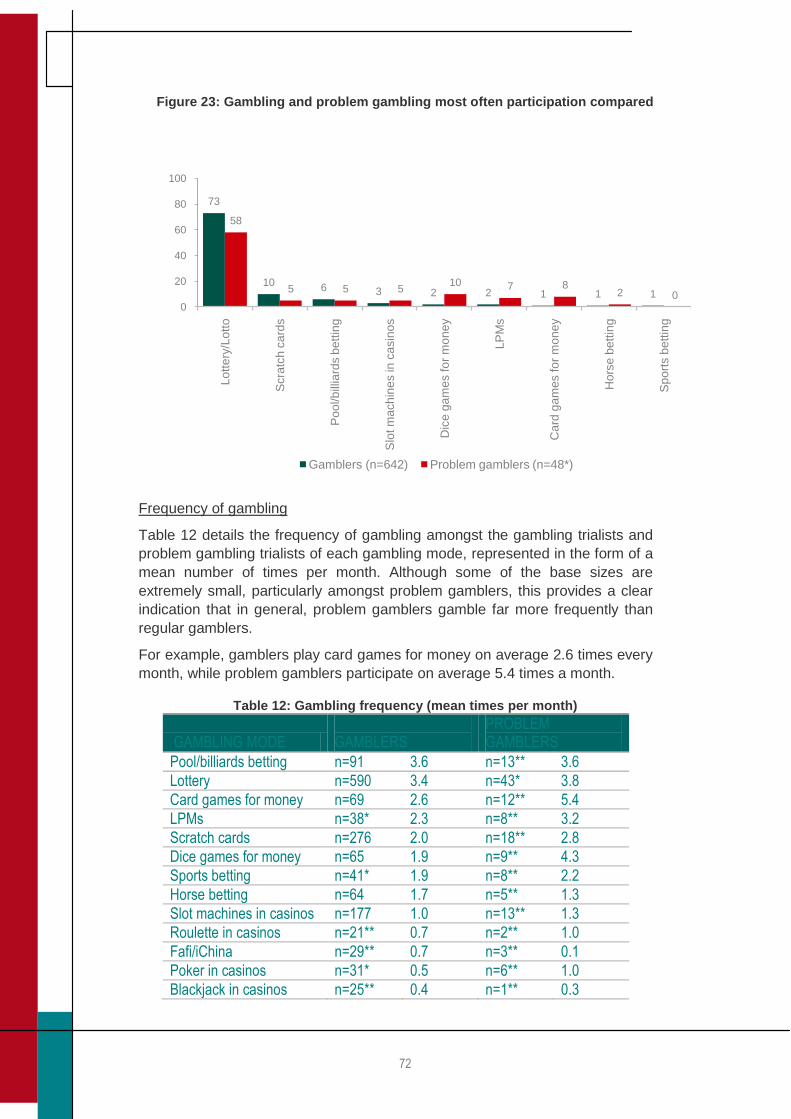
72
Figure 23: Gambling and problem gambling most often participation compared
Frequency of gambling
Table 12 details the frequency of gambling amongst the gambling trialists and
problem gambling trialists of each gambling mode, represented in the form of a
mean number of times per month. Although some of the base sizes are
extremely small, particularly amongst problem gamblers, this provides a clear
indication that in general, problem gamblers gamble far more frequently than
regular gamblers.
For example, gamblers play card games for money on average 2.6 times every
month, while problem gamblers participate on average 5.4 times a month.
Table 12: Gambling frequency (mean times per month)
GAMBLING MODE GAMBLERS
PROBLEM GAMBLERS
Pool/billiards betting n=91 3.6 n=13** 3.6
Lottery n=590 3.4 n=43* 3.8
Card games for money n=69 2.6 n=12** 5.4
LPMs n=38* 2.3 n=8** 3.2
Scratch cards n=276 2.0 n=18** 2.8
Dice games for money n=65 1.9 n=9** 4.3
Sports betting n=41* 1.9 n=8** 2.2
Horse betting n=64 1.7 n=5** 1.3
Slot machines in casinos n=177 1.0 n=13** 1.3
Roulette in casinos n=21** 0.7 n=2** 1.0
Fafi/iChina n=29** 0.7 n=3** 0.1
Poker in casinos n=31* 0.5 n=6** 1.0
Blackjack in casinos n=25** 0.4 n=1** 0.3
73
106 3 2 2 1 1 1
58
5 5 510 7 8
2 00
20
40
60
80
100
Lo
tte
ry/L
ott
o
Scra
tch
ca
rds
Po
ol/b
illia
rds b
ett
ing
Slo
t m
ach
ine
s in
ca
sin
os
Dic
e g
am
es fo
r m
on
ey
LP
Ms
Ca
rd g
am
es fo
r m
on
ey
Ho
rse
be
ttin
g
Sp
ort
s b
ett
ing
Gamblers (n=642) Problem gamblers (n=48*)
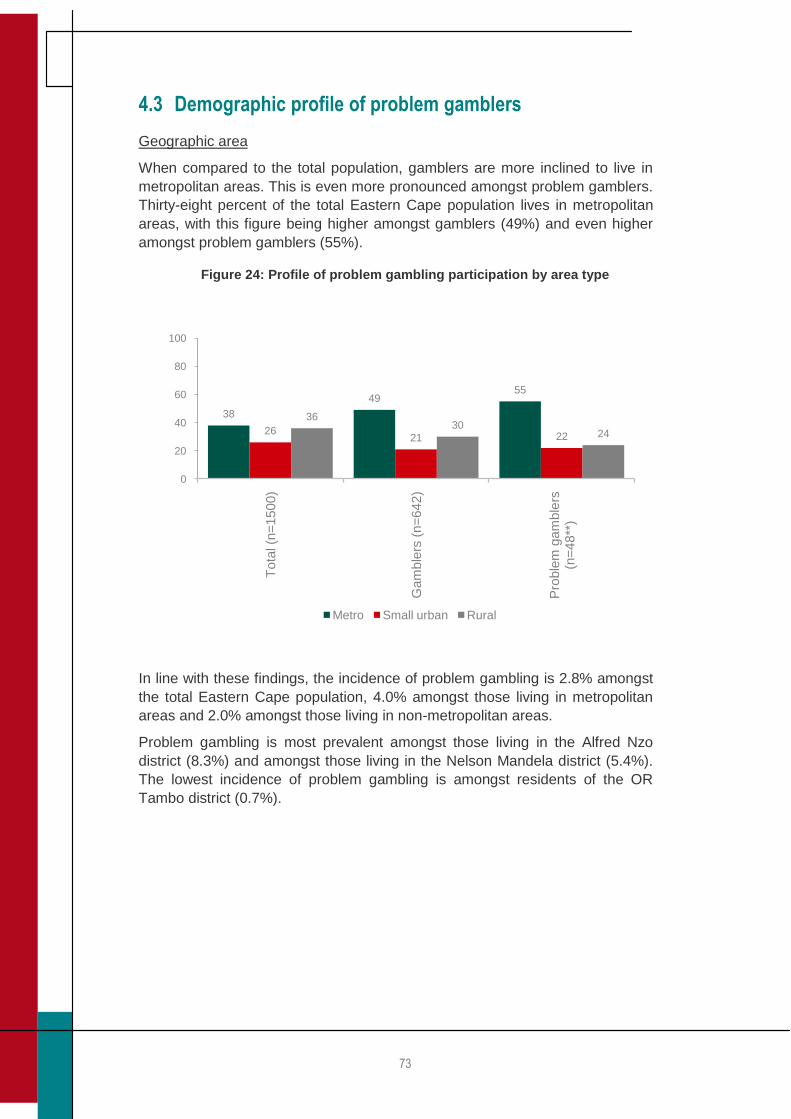
73
4.3 Demographic profile of problem gamblers
Geographic area
When compared to the total population, gamblers are more inclined to live in
metropolitan areas. This is even more pronounced amongst problem gamblers.
Thirty-eight percent of the total Eastern Cape population lives in metropolitan
areas, with this figure being higher amongst gamblers (49%) and even higher
amongst problem gamblers (55%).
Figure 24: Profile of problem gambling participation by area type
In line with these findings, the incidence of problem gambling is 2.8% amongst
the total Eastern Cape population, 4.0% amongst those living in metropolitan
areas and 2.0% amongst those living in non-metropolitan areas.
Problem gambling is most prevalent amongst those living in the Alfred Nzo
district (8.3%) and amongst those living in the Nelson Mandela district (5.4%).
The lowest incidence of problem gambling is amongst residents of the OR
Tambo district (0.7%).
38
4955
2621 22
3630
24
0
20
40
60
80
100
Tota
l (n
=1500)
Gam
ble
rs (
n=
642)
Pro
ble
m g
am
ble
rs
(n=
48**
)
Metro Small urban Rural
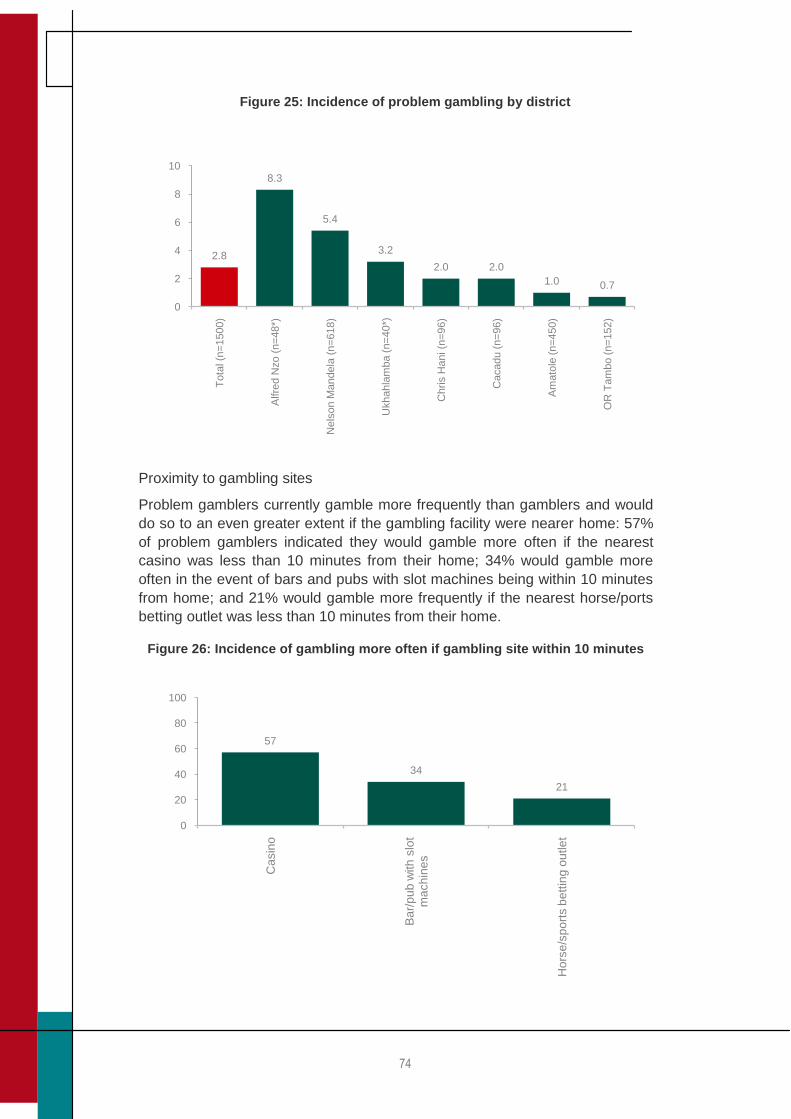
74
Figure 25: Incidence of problem gambling by district
Proximity to gambling sites
Problem gamblers currently gamble more frequently than gamblers and would
do so to an even greater extent if the gambling facility were nearer home: 57%
of problem gamblers indicated they would gamble more often if the nearest
casino was less than 10 minutes from their home; 34% would gamble more
often in the event of bars and pubs with slot machines being within 10 minutes
from home; and 21% would gamble more frequently if the nearest horse/ports
betting outlet was less than 10 minutes from their home.
Figure 26: Incidence of gambling more often if gambling site within 10 minutes
2.8
8.3
5.4
3.2
2.0 2.0
1.0 0.7
0
2
4
6
8
10
Tota
l (n
=1500)
Alfre
d N
zo (
n=
48*)
Nels
on M
andela
(n=
618)
Ukh
ah
lam
ba
(n
=4
0*)
Chris H
ani (n
=96)
Cacadu (
n=
96)
Am
ato
le (n=
450)
OR
Tam
bo (
n=
152)
57
34
21
0
20
40
60
80
100
Casin
o
Ba
r/p
ub
with
slo
t m
ach
ine
s
Hors
e/s
po
rts b
ett
ing
ou
tle
t
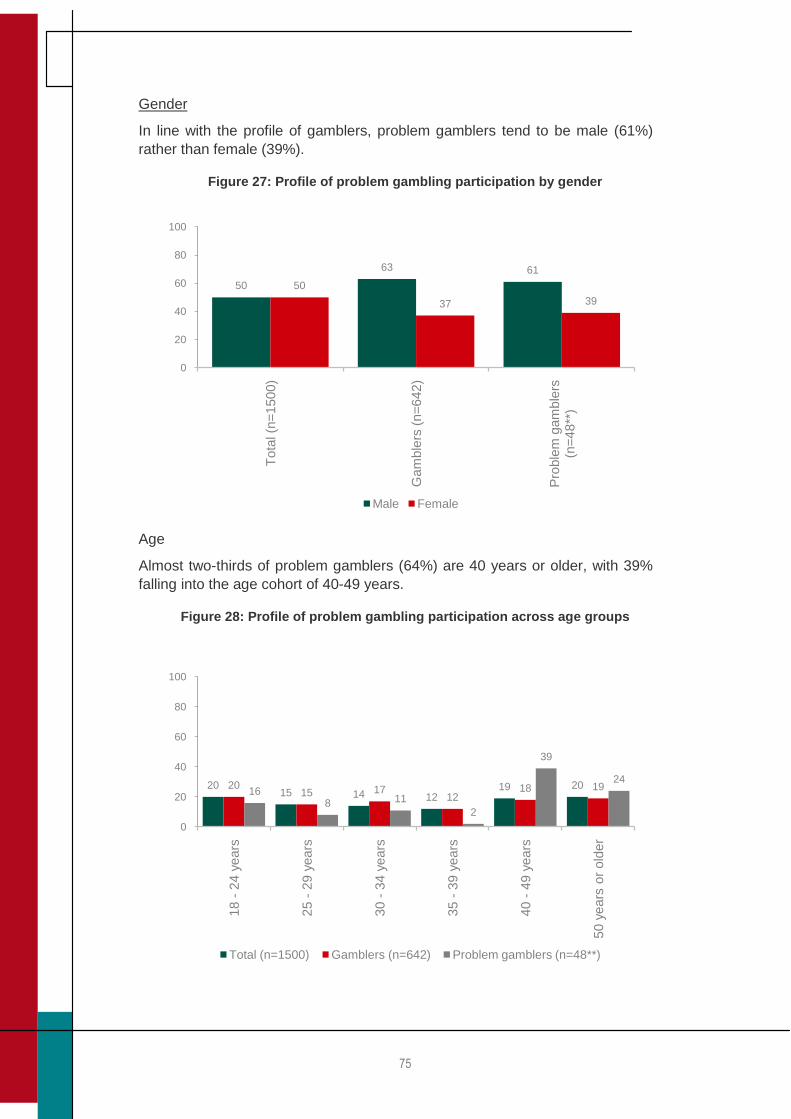
75
Gender
In line with the profile of gamblers, problem gamblers tend to be male (61%)
rather than female (39%).
Figure 27: Profile of problem gambling participation by gender
Age
Almost two-thirds of problem gamblers (64%) are 40 years or older, with 39%
falling into the age cohort of 40-49 years.
Figure 28: Profile of problem gambling participation across age groups
50
63 61
50
37 39
0
20
40
60
80
100
Tota
l (n
=1500)
Gam
ble
rs (
n=
642)
Pro
ble
m g
am
ble
rs
(n=
48**
)
Male Female
2015 14 12
19 202015 17
1218 1916
8 11
2
39
24
0
20
40
60
80
100
18 -
24 y
ears
25 -
29 y
ears
30 -
34 y
ears
35 -
39 y
ears
40 -
49 y
ears
50 y
ears
or
old
er
Total (n=1500) Gamblers (n=642) Problem gamblers (n=48**)
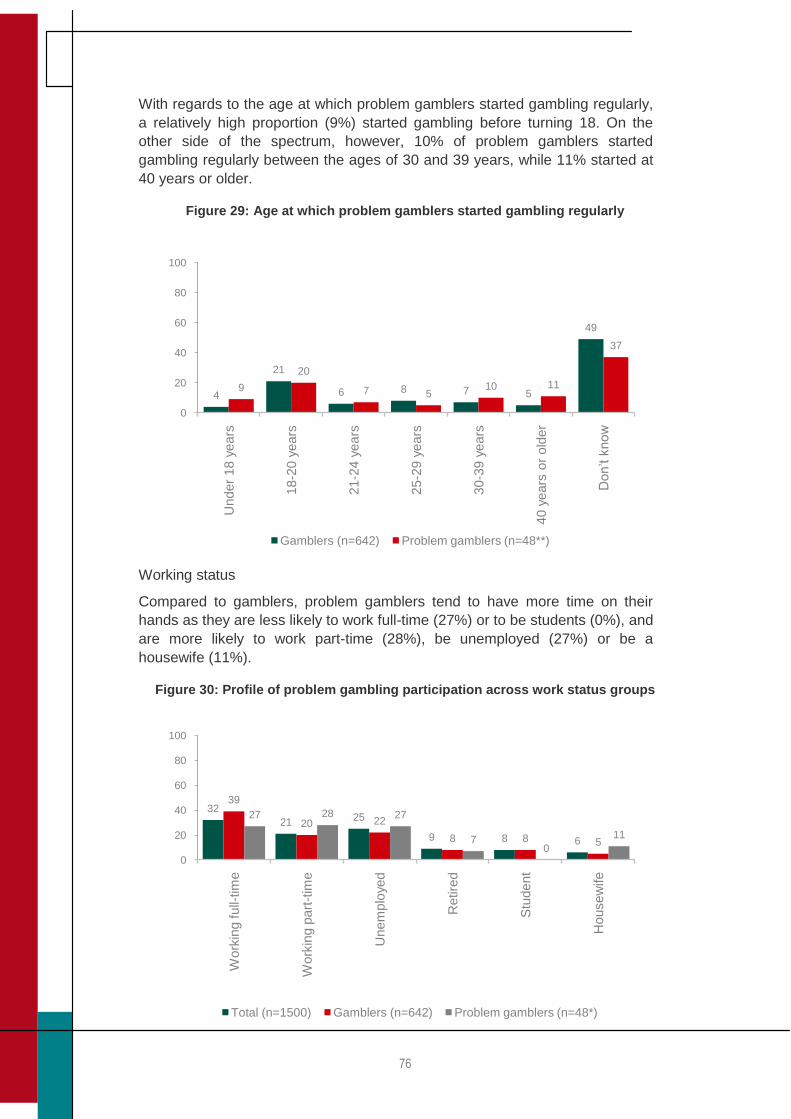
76
With regards to the age at which problem gamblers started gambling regularly,
a relatively high proportion (9%) started gambling before turning 18. On the
other side of the spectrum, however, 10% of problem gamblers started
gambling regularly between the ages of 30 and 39 years, while 11% started at
40 years or older.
Figure 29: Age at which problem gamblers started gambling regularly
Working status
Compared to gamblers, problem gamblers tend to have more time on their
hands as they are less likely to work full-time (27%) or to be students (0%), and
are more likely to work part-time (28%), be unemployed (27%) or be a
housewife (11%).
Figure 30: Profile of problem gambling participation across work status groups
4
21
6 8 7 5
49
9
20
7 510 11
37
0
20
40
60
80
100
Under
18 y
ears
18-2
0 y
ears
21-2
4 y
ears
25-2
9 y
ears
30-3
9 y
ears
40 y
ears
or
old
er
Don’t k
now
Gamblers (n=642) Problem gamblers (n=48**)
32
21 25
9 8 6
39
20 22
8 8 5
27 28 27
70
11
0
20
40
60
80
100
Work
ing full-
tim
e
Work
ing p
art
-tim
e
Unem
plo
yed
Retire
d
Stu
dent
Housew
ife
Total (n=1500) Gamblers (n=642) Problem gamblers (n=48*)
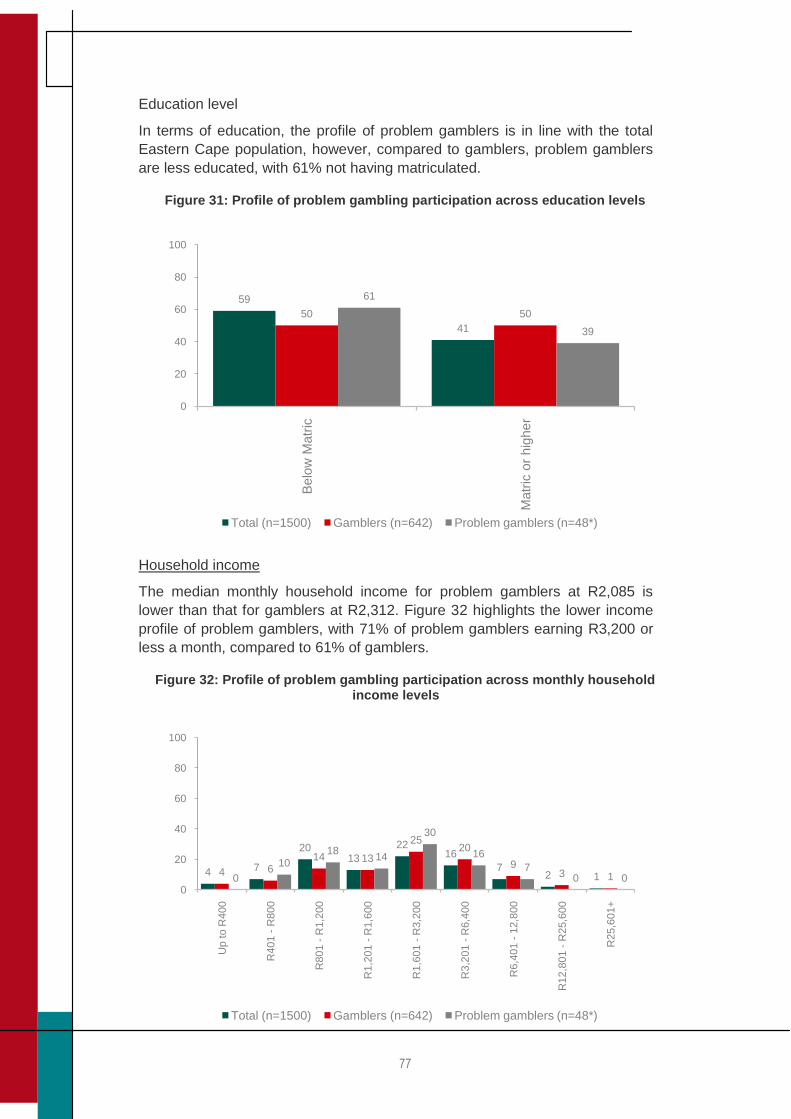
77
Education level
In terms of education, the profile of problem gamblers is in line with the total
Eastern Cape population, however, compared to gamblers, problem gamblers
are less educated, with 61% not having matriculated.
Figure 31: Profile of problem gambling participation across education levels
Household income
The median monthly household income for problem gamblers at R2,085 is
lower than that for gamblers at R2,312. Figure 32 highlights the lower income
profile of problem gamblers, with 71% of problem gamblers earning R3,200 or
less a month, compared to 61% of gamblers.
Figure 32: Profile of problem gambling participation across monthly household income levels
59
41
50 50
61
39
0
20
40
60
80
100
Belo
w M
atr
ic
Matr
ic o
r hig
her
Total (n=1500) Gamblers (n=642) Problem gamblers (n=48*)
4 7
2013
2216
72 14 6
14 13
2520
93 10
1018
14
30
16
70 0
0
20
40
60
80
100
Up to R
400
R401 -
R800
R801 -
R1,2
00
R1,2
01 -
R1,6
00
R1,6
01 -
R3,2
00
R3,2
01 -
R6,4
00
R6,4
01 -
12,8
00
R12,8
01 -
R25,6
00
R25,6
01+
Total (n=1500) Gamblers (n=642) Problem gamblers (n=48*)
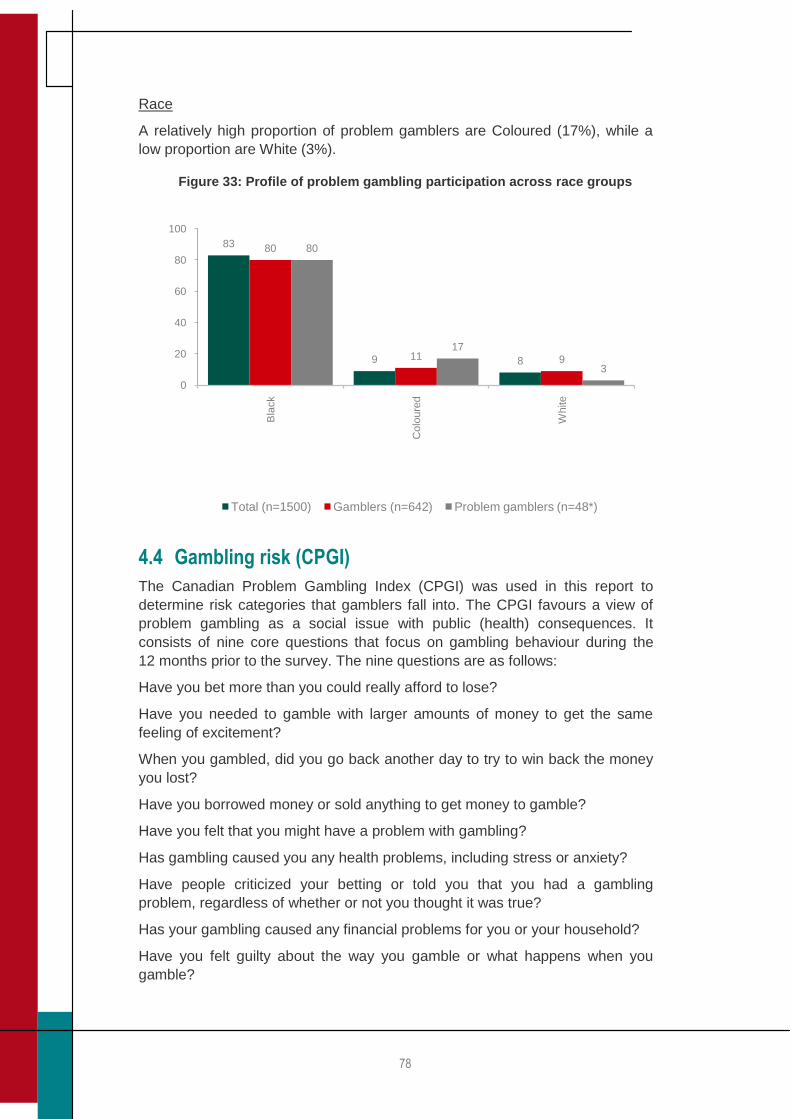
78
Race
A relatively high proportion of problem gamblers are Coloured (17%), while a
low proportion are White (3%).
Figure 33: Profile of problem gambling participation across race groups
4.4 Gambling risk (CPGI)
The Canadian Problem Gambling Index (CPGI) was used in this report to
determine risk categories that gamblers fall into. The CPGI favours a view of
problem gambling as a social issue with public (health) consequences. It
consists of nine core questions that focus on gambling behaviour during the
12 months prior to the survey. The nine questions are as follows:
Have you bet more than you could really afford to lose?
Have you needed to gamble with larger amounts of money to get the same
feeling of excitement?
When you gambled, did you go back another day to try to win back the money
you lost?
Have you borrowed money or sold anything to get money to gamble?
Have you felt that you might have a problem with gambling?
Has gambling caused you any health problems, including stress or anxiety?
Have people criticized your betting or told you that you had a gambling
problem, regardless of whether or not you thought it was true?
Has your gambling caused any financial problems for you or your household?
Have you felt guilty about the way you gamble or what happens when you
gamble?
83
9 8
80
11 9
80
17
3
0
20
40
60
80
100
Bla
ck
Colo
ure
d
White
Total (n=1500) Gamblers (n=642) Problem gamblers (n=48*)
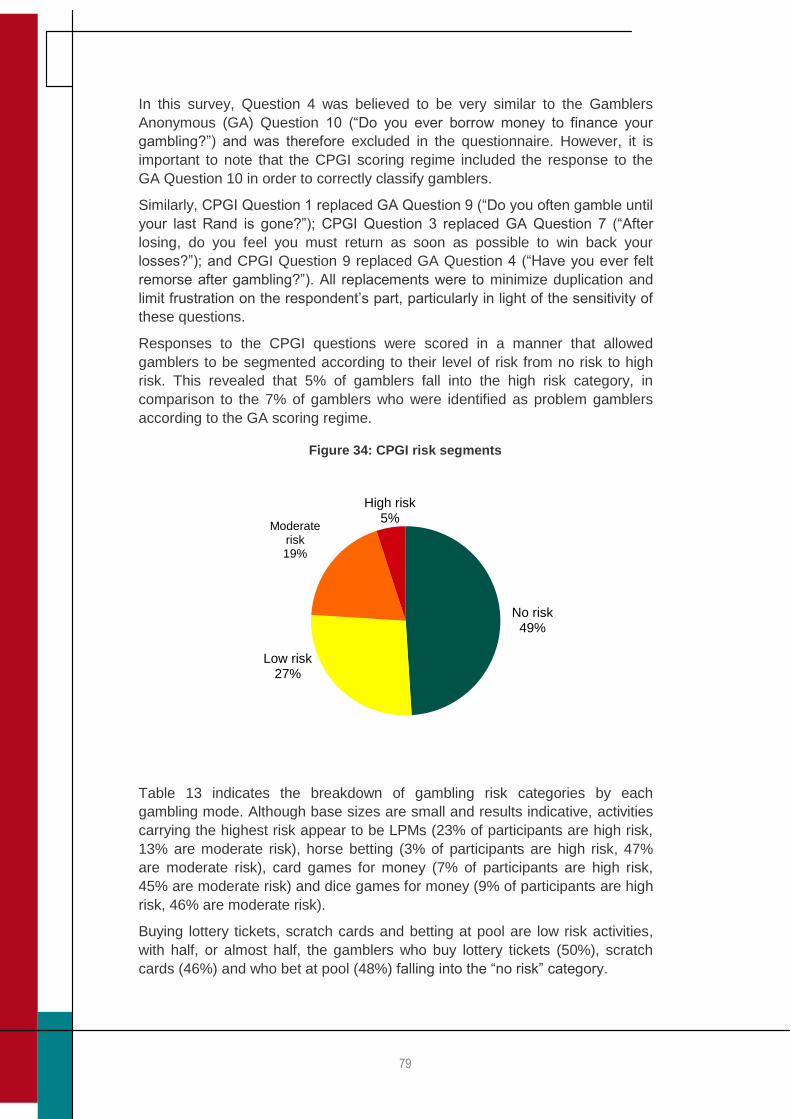
79
In this survey, Question 4 was believed to be very similar to the Gamblers
Anonymous (GA) Question 10 (“Do you ever borrow money to finance your
gambling?”) and was therefore excluded in the questionnaire. However, it is
important to note that the CPGI scoring regime included the response to the
GA Question 10 in order to correctly classify gamblers.
Similarly, CPGI Question 1 replaced GA Question 9 (“Do you often gamble until
your last Rand is gone?”); CPGI Question 3 replaced GA Question 7 (“After
losing, do you feel you must return as soon as possible to win back your
losses?”); and CPGI Question 9 replaced GA Question 4 (“Have you ever felt
remorse after gambling?”). All replacements were to minimize duplication and
limit frustration on the respondent‟s part, particularly in light of the sensitivity of
these questions.
Responses to the CPGI questions were scored in a manner that allowed
gamblers to be segmented according to their level of risk from no risk to high
risk. This revealed that 5% of gamblers fall into the high risk category, in
comparison to the 7% of gamblers who were identified as problem gamblers
according to the GA scoring regime.
Figure 34: CPGI risk segments
Table 13 indicates the breakdown of gambling risk categories by each
gambling mode. Although base sizes are small and results indicative, activities
carrying the highest risk appear to be LPMs (23% of participants are high risk,
13% are moderate risk), horse betting (3% of participants are high risk, 47%
are moderate risk), card games for money (7% of participants are high risk,
45% are moderate risk) and dice games for money (9% of participants are high
risk, 46% are moderate risk).
Buying lottery tickets, scratch cards and betting at pool are low risk activities,
with half, or almost half, the gamblers who buy lottery tickets (50%), scratch
cards (46%) and who bet at pool (48%) falling into the “no risk” category.
No risk49%
Low risk27%
Moderate risk19%
High risk5%
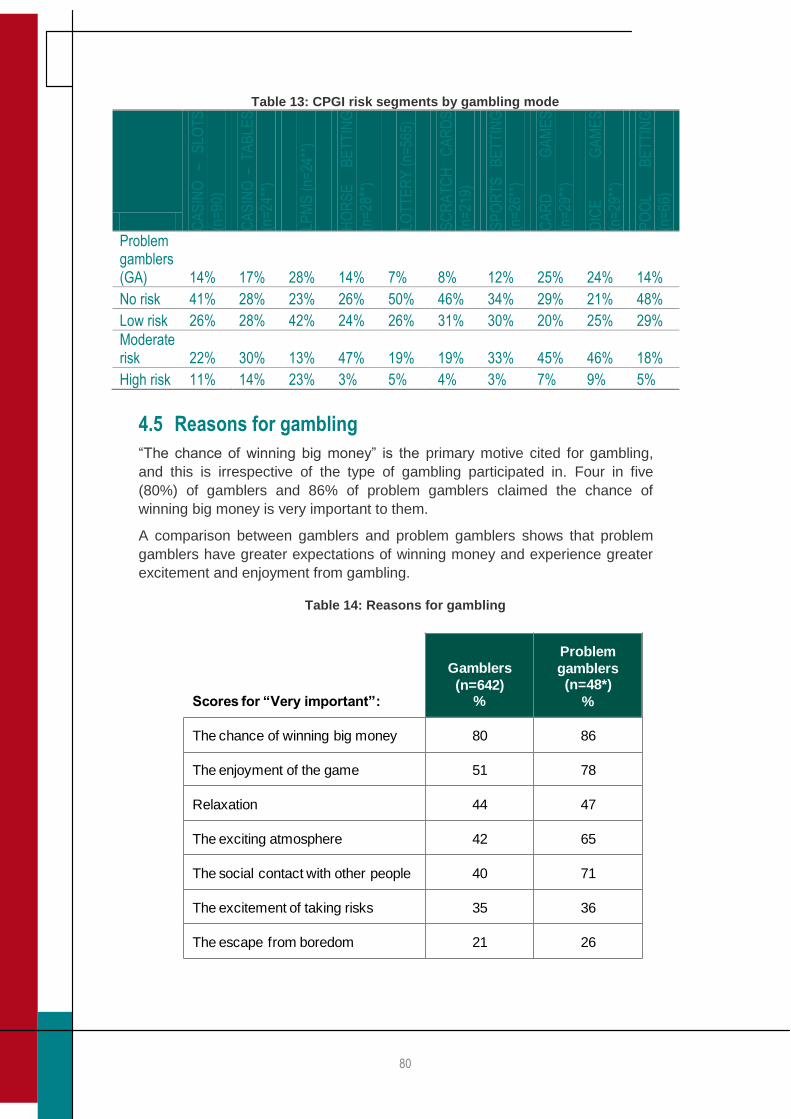
80
Table 13: CPGI risk segments by gambling mode
CA
SIN
O
– S
LOT
S
(n=
90)
CA
SIN
O –
TA
BLE
S
(n=
24**
)
LPM
S (
n=24
**)
HO
RS
E
BE
TT
ING
(n=
28**
)
LOT
TE
RY
(n=
565)
SC
RA
TC
H
CA
RD
S
(n=
219)
SP
OR
TS
B
ET
TIN
G
(n=
26**
)
CA
RD
G
AM
ES
(n=
29**
)
DIC
E
GA
ME
S
(n=
29**
)
PO
OL
BE
TT
ING
(n=
66)
Problem gamblers (GA) 14% 17% 28% 14% 7% 8% 12% 25% 24% 14%
No risk 41% 28% 23% 26% 50% 46% 34% 29% 21% 48%
Low risk 26% 28% 42% 24% 26% 31% 30% 20% 25% 29%
Moderate risk 22% 30% 13% 47% 19% 19% 33% 45% 46% 18%
High risk 11% 14% 23% 3% 5% 4% 3% 7% 9% 5%
4.5 Reasons for gambling
“The chance of winning big money” is the primary motive cited for gambling,
and this is irrespective of the type of gambling participated in. Four in five
(80%) of gamblers and 86% of problem gamblers claimed the chance of
winning big money is very important to them.
A comparison between gamblers and problem gamblers shows that problem
gamblers have greater expectations of winning money and experience greater
excitement and enjoyment from gambling.
Table 14: Reasons for gambling
Scores for “Very important”:
Gamblers
(n=642)%
Problem
gamblers(n=48*)
%
The chance of winning big money 80 86
The enjoyment of the game 51 78
Relaxation 44 47
The exciting atmosphere 42 65
The social contact with other people 40 71
The excitement of taking risks 35 36
The escape from boredom 21 26
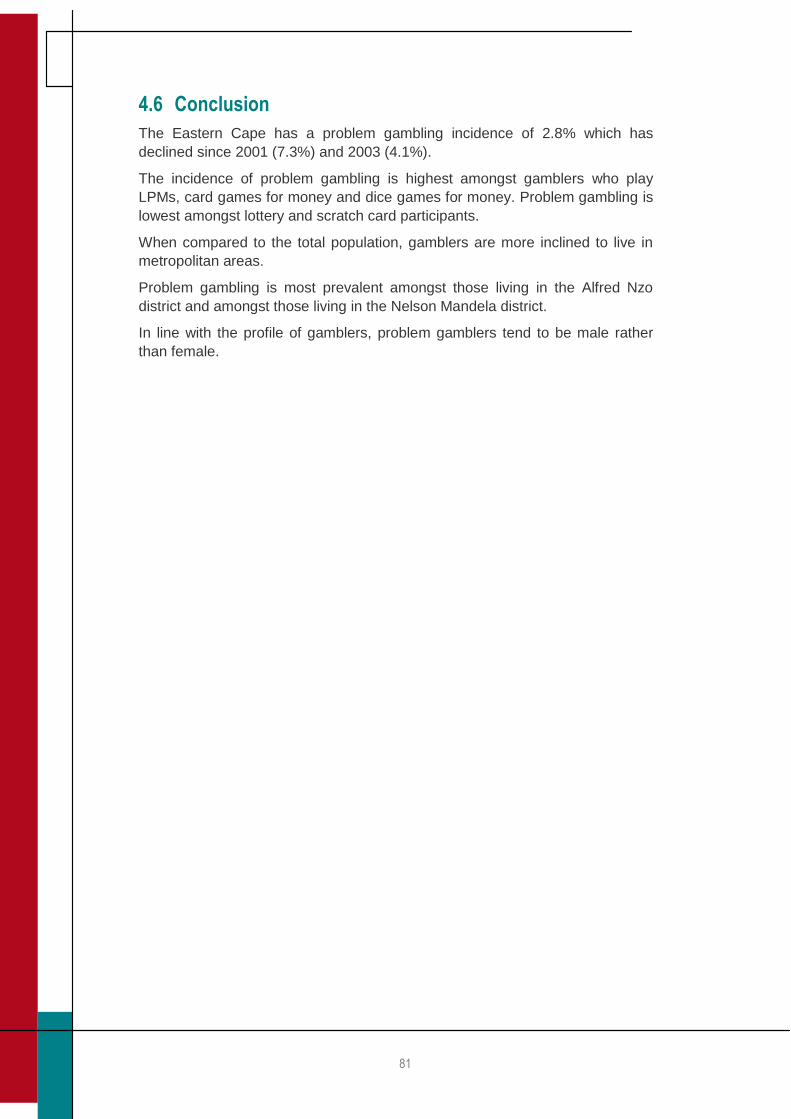
81
4.6 Conclusion
The Eastern Cape has a problem gambling incidence of 2.8% which has
declined since 2001 (7.3%) and 2003 (4.1%).
The incidence of problem gambling is highest amongst gamblers who play
LPMs, card games for money and dice games for money. Problem gambling is
lowest amongst lottery and scratch card participants.
When compared to the total population, gamblers are more inclined to live in
metropolitan areas.
Problem gambling is most prevalent amongst those living in the Alfred Nzo
district and amongst those living in the Nelson Mandela district.
In line with the profile of gamblers, problem gamblers tend to be male rather
than female.
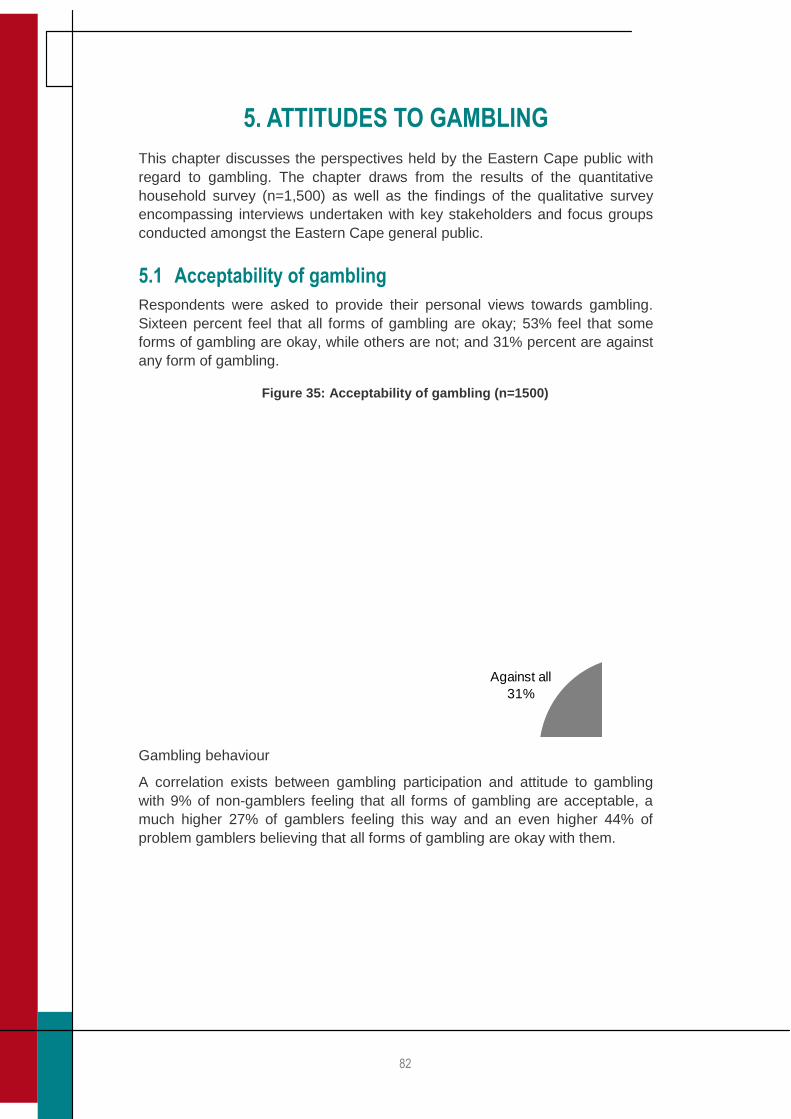
82
5. ATTITUDES TO GAMBLING
This chapter discusses the perspectives held by the Eastern Cape public with
regard to gambling. The chapter draws from the results of the quantitative
household survey (n=1,500) as well as the findings of the qualitative survey
encompassing interviews undertaken with key stakeholders and focus groups
conducted amongst the Eastern Cape general public.
5.1 Acceptability of gambling
Respondents were asked to provide their personal views towards gambling.
Sixteen percent feel that all forms of gambling are okay; 53% feel that some
forms of gambling are okay, while others are not; and 31% percent are against
any form of gambling.
Figure 35: Acceptability of gambling (n=1500)
Gambling behaviour
A correlation exists between gambling participation and attitude to gambling
with 9% of non-gamblers feeling that all forms of gambling are acceptable, a
much higher 27% of gamblers feeling this way and an even higher 44% of
problem gamblers believing that all forms of gambling are okay with them.
All OK
16%
Against all
31%
Some OK
53%
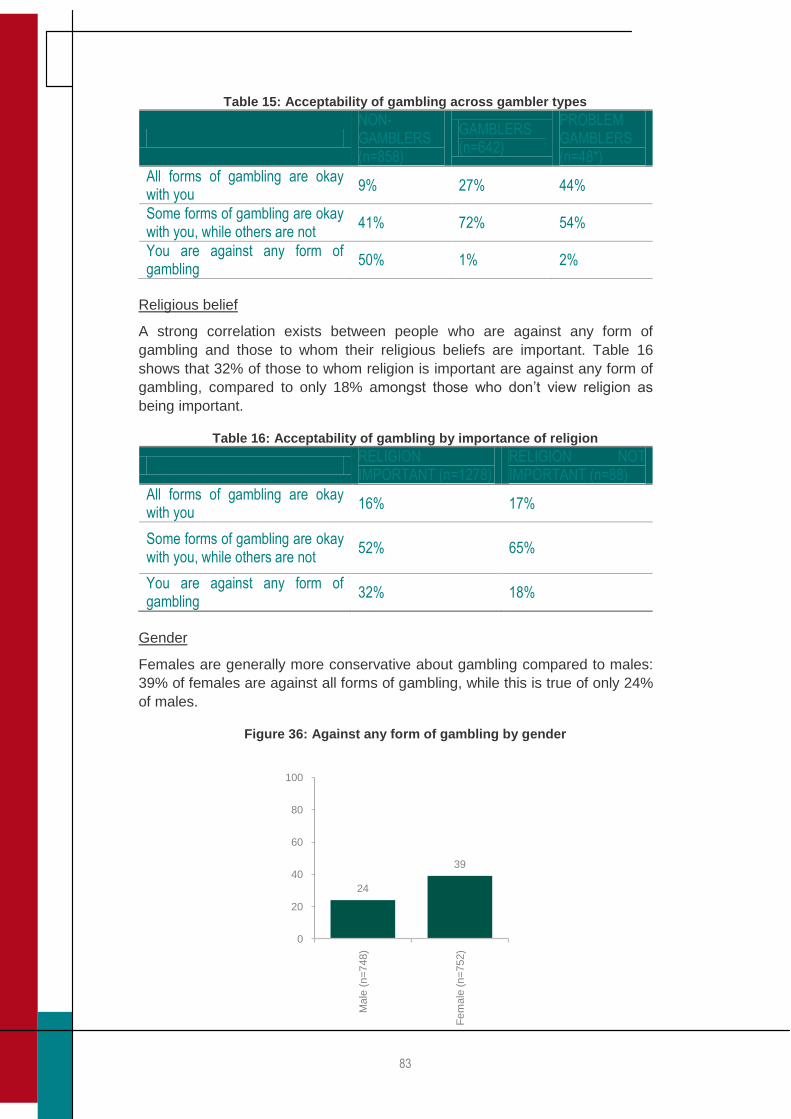
83
Table 15: Acceptability of gambling across gambler types
NON-GAMBLERS (n=858)
GAMBLERS (n=642)
PROBLEM GAMBLERS (n=48*)
All forms of gambling are okay with you
9% 27% 44%
Some forms of gambling are okay with you, while others are not
41% 72% 54%
You are against any form of gambling
50% 1% 2%
Religious belief
A strong correlation exists between people who are against any form of
gambling and those to whom their religious beliefs are important. Table 16
shows that 32% of those to whom religion is important are against any form of
gambling, compared to only 18% amongst those who don‟t view religion as
being important.
Table 16: Acceptability of gambling by importance of religion
RELIGION IMPORTANT (n=1278)
RELIGION NOT IMPORTANT (n=88)
All forms of gambling are okay with you
16% 17%
Some forms of gambling are okay with you, while others are not
52% 65%
You are against any form of gambling
32% 18%
Gender
Females are generally more conservative about gambling compared to males:
39% of females are against all forms of gambling, while this is true of only 24%
of males.
Figure 36: Against any form of gambling by gender
24
39
0
20
40
60
80
100
Male
(n=
748)
Fe
male
(n=
752)
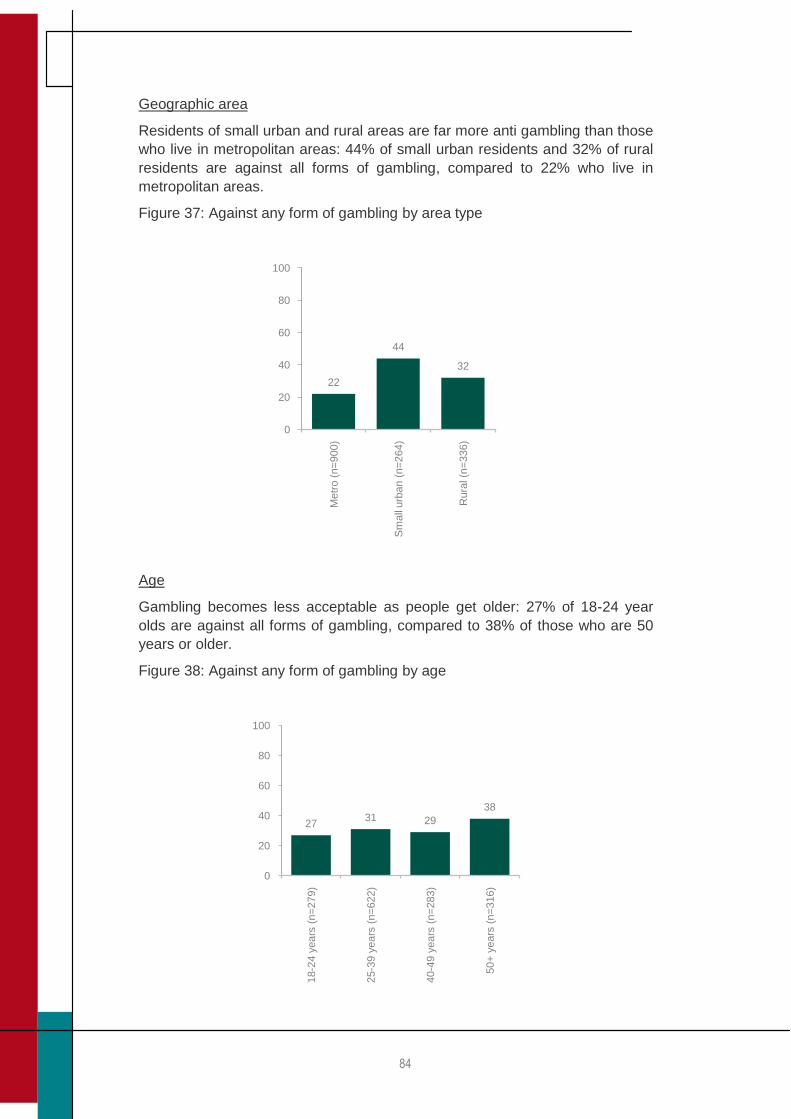
84
Geographic area
Residents of small urban and rural areas are far more anti gambling than those
who live in metropolitan areas: 44% of small urban residents and 32% of rural
residents are against all forms of gambling, compared to 22% who live in
metropolitan areas.
Figure 37: Against any form of gambling by area type
Age
Gambling becomes less acceptable as people get older: 27% of 18-24 year
olds are against all forms of gambling, compared to 38% of those who are 50
years or older.
Figure 38: Against any form of gambling by age
22
44
32
0
20
40
60
80
100
Metr
o (
n=
900)
Sm
all
urb
an (
n=
264)
Rura
l (n
=336)
2731 29
38
0
20
40
60
80
100
18-2
4 y
ears
(n=
279)
25-3
9 y
ears
(n=
622)
40-4
9 y
ears
(n=
283)
50+
years
(n=
316)
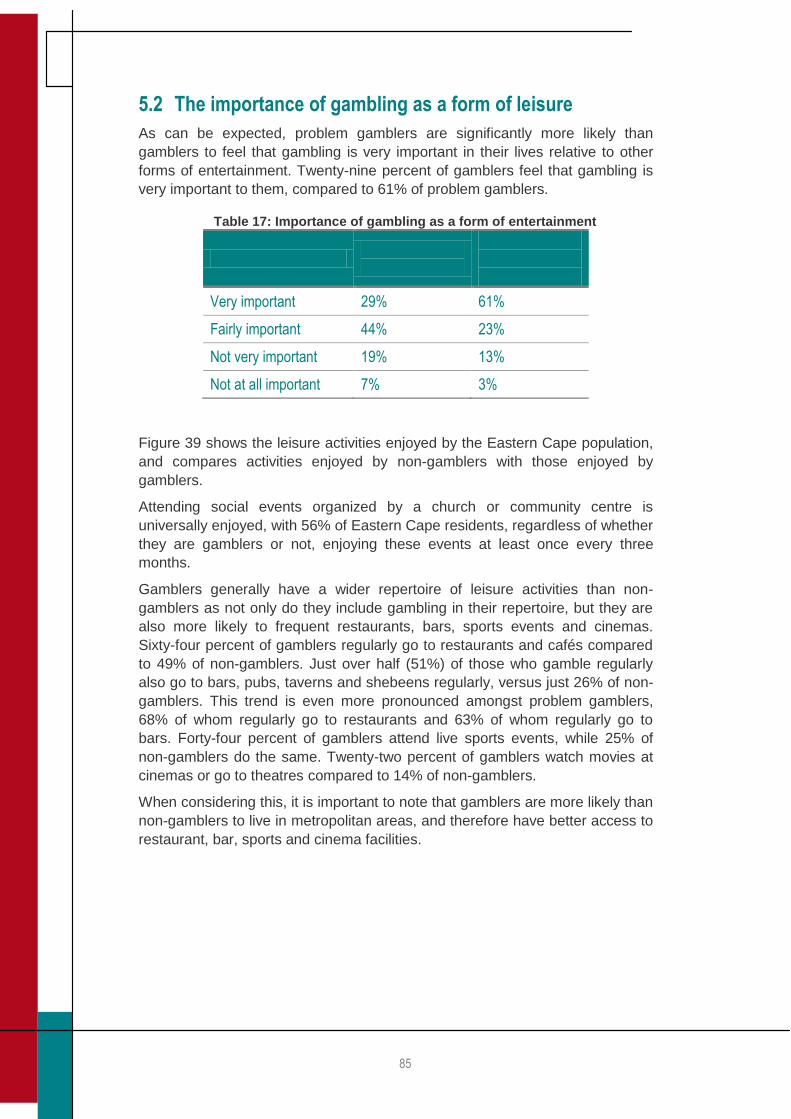
85
5.2 The importance of gambling as a form of leisure
As can be expected, problem gamblers are significantly more likely than
gamblers to feel that gambling is very important in their lives relative to other
forms of entertainment. Twenty-nine percent of gamblers feel that gambling is
very important to them, compared to 61% of problem gamblers.
Table 17: Importance of gambling as a form of entertainment
GAMBLERS (n=642)
PROBLEM GAMBLERS (n=48*)
Very important 29% 61%
Fairly important 44% 23%
Not very important 19% 13%
Not at all important 7% 3%
Figure 39 shows the leisure activities enjoyed by the Eastern Cape population,
and compares activities enjoyed by non-gamblers with those enjoyed by
gamblers.
Attending social events organized by a church or community centre is
universally enjoyed, with 56% of Eastern Cape residents, regardless of whether
they are gamblers or not, enjoying these events at least once every three
months.
Gamblers generally have a wider repertoire of leisure activities than non-
gamblers as not only do they include gambling in their repertoire, but they are
also more likely to frequent restaurants, bars, sports events and cinemas.
Sixty-four percent of gamblers regularly go to restaurants and cafés compared
to 49% of non-gamblers. Just over half (51%) of those who gamble regularly
also go to bars, pubs, taverns and shebeens regularly, versus just 26% of non-
gamblers. This trend is even more pronounced amongst problem gamblers,
68% of whom regularly go to restaurants and 63% of whom regularly go to
bars. Forty-four percent of gamblers attend live sports events, while 25% of
non-gamblers do the same. Twenty-two percent of gamblers watch movies at
cinemas or go to theatres compared to 14% of non-gamblers.
When considering this, it is important to note that gamblers are more likely than
non-gamblers to live in metropolitan areas, and therefore have better access to
restaurant, bar, sports and cinema facilities.
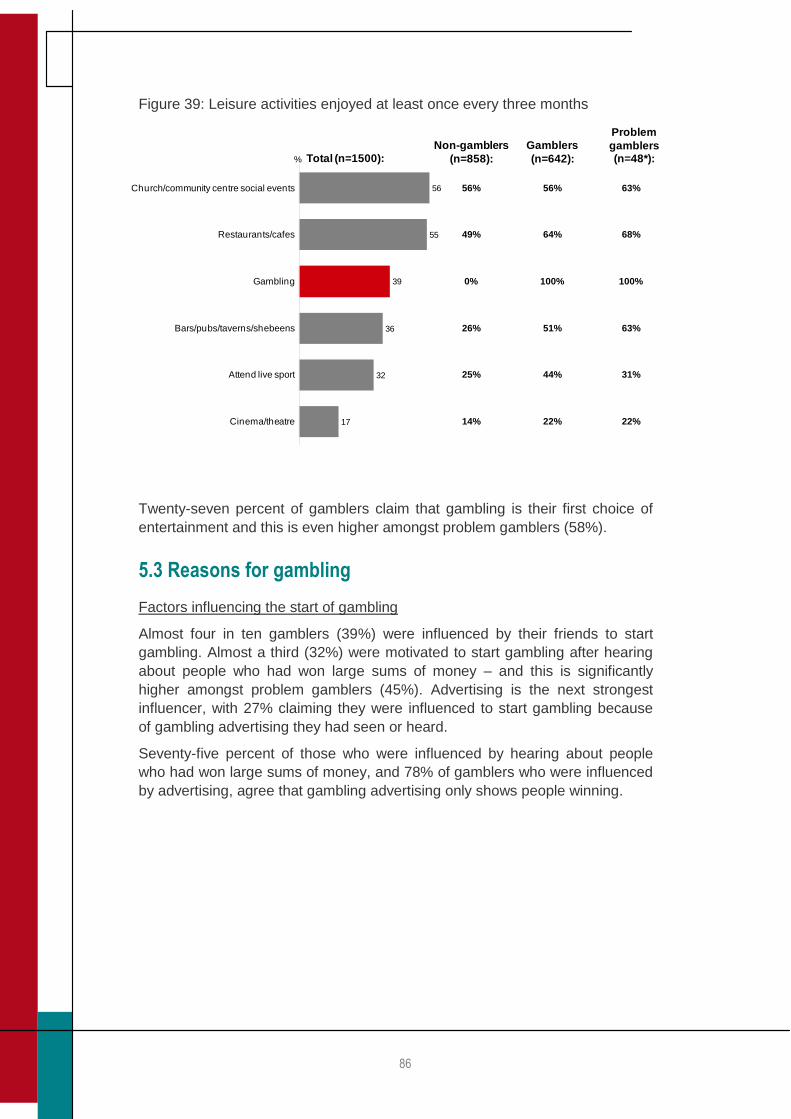
86
Figure 39: Leisure activities enjoyed at least once every three months
Twenty-seven percent of gamblers claim that gambling is their first choice of
entertainment and this is even higher amongst problem gamblers (58%).
5.3 Reasons for gambling
Factors influencing the start of gambling
Almost four in ten gamblers (39%) were influenced by their friends to start
gambling. Almost a third (32%) were motivated to start gambling after hearing
about people who had won large sums of money – and this is significantly
higher amongst problem gamblers (45%). Advertising is the next strongest
influencer, with 27% claiming they were influenced to start gambling because
of gambling advertising they had seen or heard.
Seventy-five percent of those who were influenced by hearing about people
who had won large sums of money, and 78% of gamblers who were influenced
by advertising, agree that gambling advertising only shows people winning.
56
55
39
36
32
17
%
56%
64%
100%
51%
44%
22%
Total (n=1500):
Gamblers
(n=642):
Church/community centre social events
Restaurants/cafes
Gambling
Bars/pubs/taverns/shebeens
Attend live sport
Cinema/theatre
56%
49%
0%
26%
25%
14%
Non-gamblers
(n=858):
63%
68%
100%
63%
31%
22%
Problem
gamblers(n=48*):
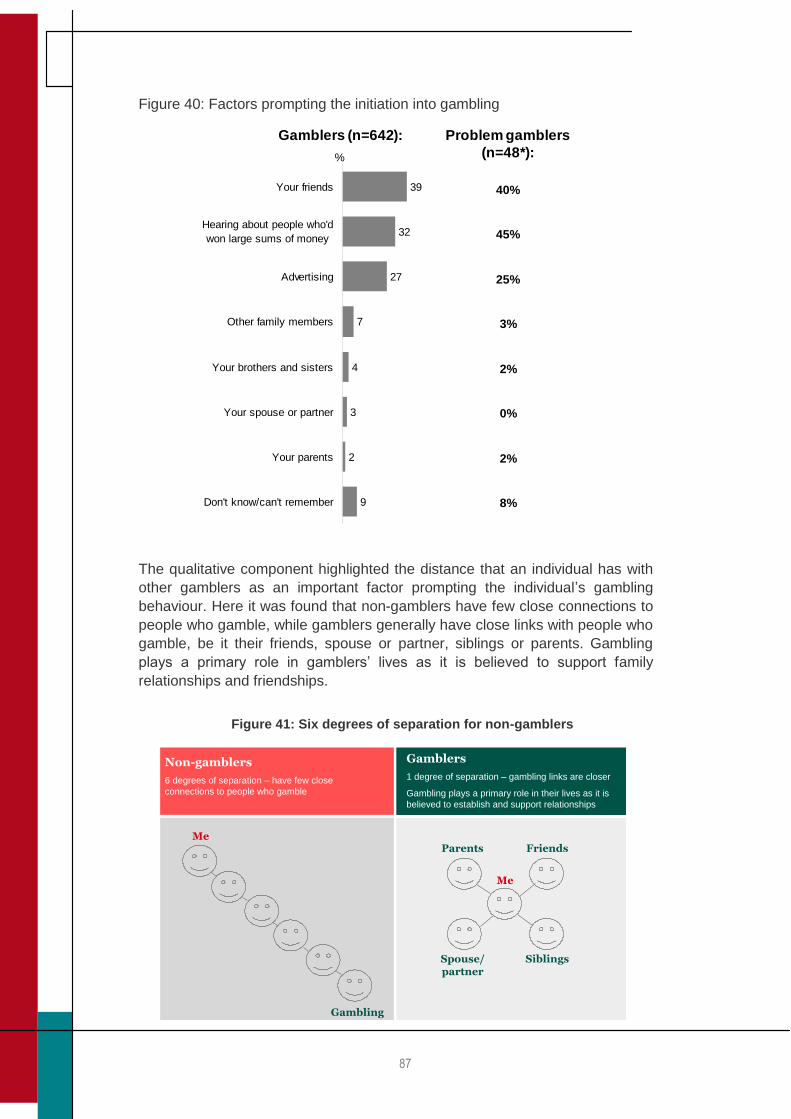
87
Figure 40: Factors prompting the initiation into gambling
The qualitative component highlighted the distance that an individual has with
other gamblers as an important factor prompting the individual‟s gambling
behaviour. Here it was found that non-gamblers have few close connections to
people who gamble, while gamblers generally have close links with people who
gamble, be it their friends, spouse or partner, siblings or parents. Gambling
plays a primary role in gamblers‟ lives as it is believed to support family
relationships and friendships.
16
Non-gamblers
6 degrees of separation – have few close
connections to people who gamble
Gamblers
1 degree of separation – gambling links are closer
Gambling plays a primary role in their lives as it is
believed to establish and support relationships
ParentsMe
Me
Gambling
Friends
Spouse/partner
Siblings
Figure 41: Six degrees of separation for non-gamblers
39
32
27
7
4
3
2
9
Your friends
Hearing about people who'd
won large sums of money
Advertising
Other family members
Your brothers and sisters
Your spouse or partner
Your parents
Don't know/can't remember
%
40%
45%
25%
3%
2%
0%
2%
8%
Gamblers (n=642): Problem gamblers
(n=48*):
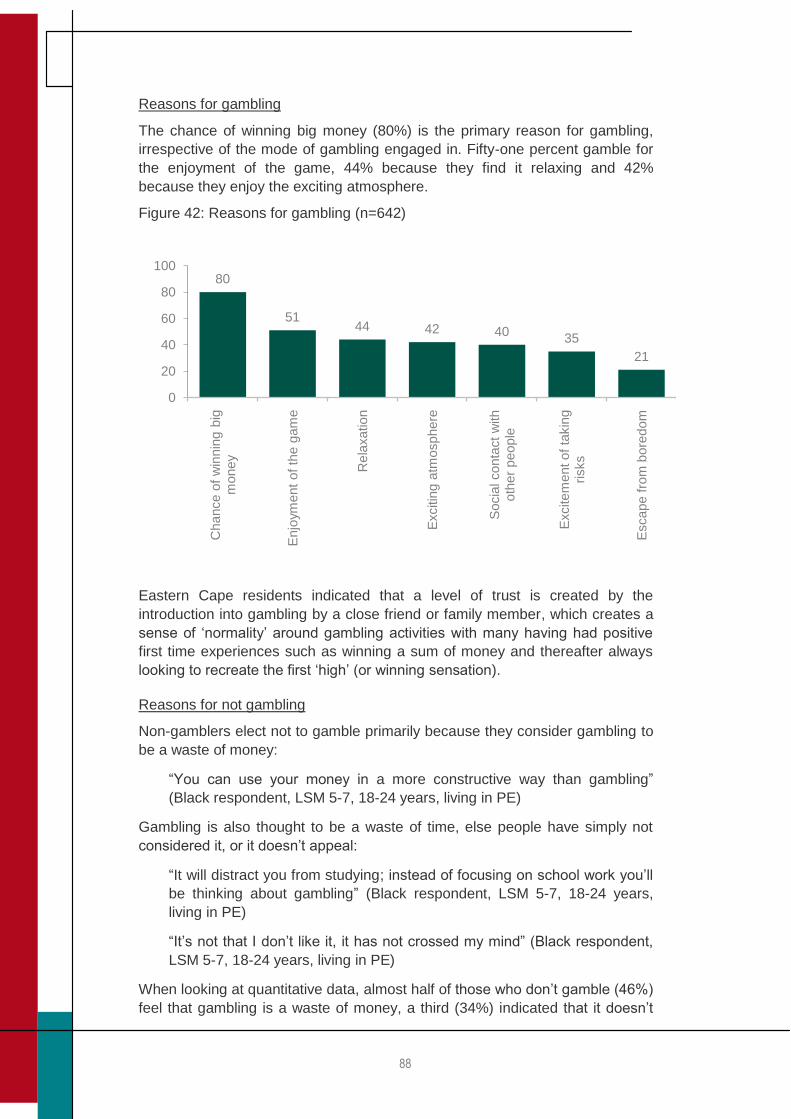
88
Reasons for gambling
The chance of winning big money (80%) is the primary reason for gambling,
irrespective of the mode of gambling engaged in. Fifty-one percent gamble for
the enjoyment of the game, 44% because they find it relaxing and 42%
because they enjoy the exciting atmosphere.
Figure 42: Reasons for gambling (n=642)
Eastern Cape residents indicated that a level of trust is created by the
introduction into gambling by a close friend or family member, which creates a
sense of „normality‟ around gambling activities with many having had positive
first time experiences such as winning a sum of money and thereafter always
looking to recreate the first „high‟ (or winning sensation).
Reasons for not gambling
Non-gamblers elect not to gamble primarily because they consider gambling to
be a waste of money:
“You can use your money in a more constructive way than gambling”
(Black respondent, LSM 5-7, 18-24 years, living in PE)
Gambling is also thought to be a waste of time, else people have simply not
considered it, or it doesn‟t appeal:
“It will distract you from studying; instead of focusing on school work you‟ll
be thinking about gambling” (Black respondent, LSM 5-7, 18-24 years,
living in PE)
“It‟s not that I don‟t like it, it has not crossed my mind” (Black respondent,
LSM 5-7, 18-24 years, living in PE)
When looking at quantitative data, almost half of those who don‟t gamble (46%)
feel that gambling is a waste of money, a third (34%) indicated that it doesn‟t
80
5144 42 40
35
21
0
20
40
60
80
100
Chance o
f w
innin
g b
ig
money
Enjo
yment
of th
e g
am
e
Rela
xation
Excitin
g a
tmosphere
Socia
l conta
ct
with
oth
er
people
Excitem
ent of
takin
g
risks
Escape f
rom
bore
dom
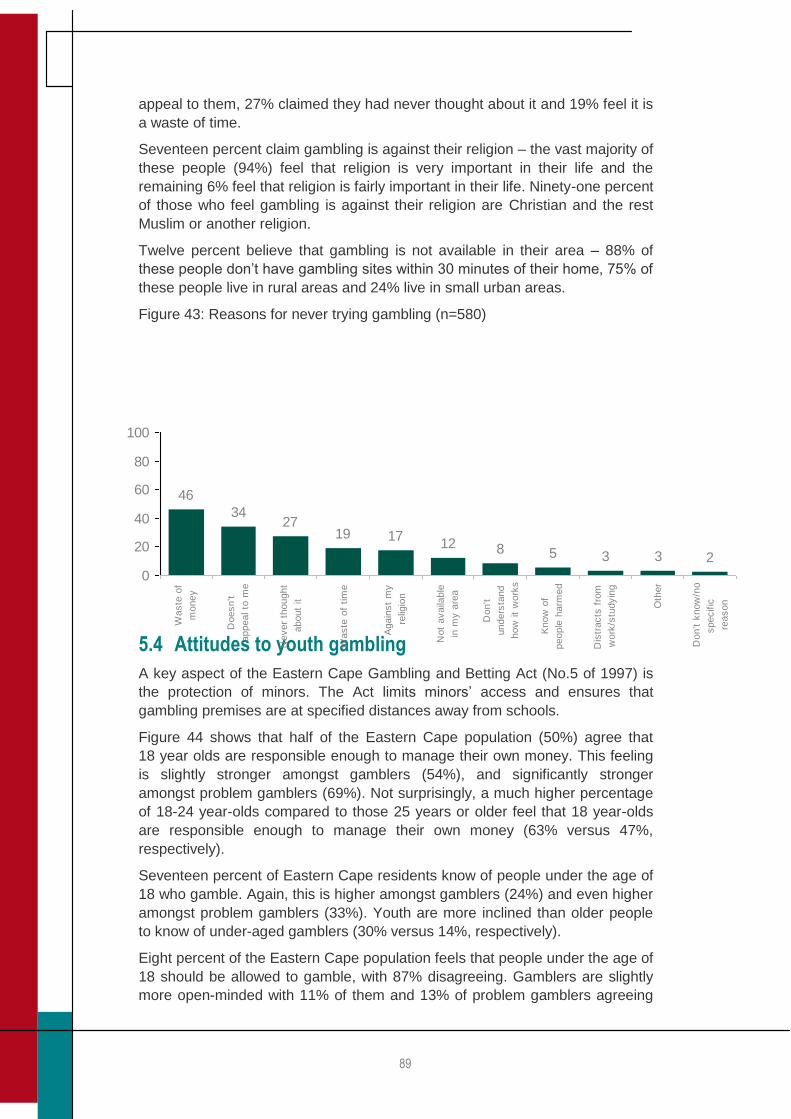
89
appeal to them, 27% claimed they had never thought about it and 19% feel it is
a waste of time.
Seventeen percent claim gambling is against their religion – the vast majority of
these people (94%) feel that religion is very important in their life and the
remaining 6% feel that religion is fairly important in their life. Ninety-one percent
of those who feel gambling is against their religion are Christian and the rest
Muslim or another religion.
Twelve percent believe that gambling is not available in their area – 88% of
these people don‟t have gambling sites within 30 minutes of their home, 75% of
these people live in rural areas and 24% live in small urban areas.
Figure 43: Reasons for never trying gambling (n=580)
5.4 Attitudes to youth gambling
A key aspect of the Eastern Cape Gambling and Betting Act (No.5 of 1997) is
the protection of minors. The Act limits minors‟ access and ensures that
gambling premises are at specified distances away from schools.
Figure 44 shows that half of the Eastern Cape population (50%) agree that
18 year olds are responsible enough to manage their own money. This feeling
is slightly stronger amongst gamblers (54%), and significantly stronger
amongst problem gamblers (69%). Not surprisingly, a much higher percentage
of 18-24 year-olds compared to those 25 years or older feel that 18 year-olds
are responsible enough to manage their own money (63% versus 47%,
respectively).
Seventeen percent of Eastern Cape residents know of people under the age of
18 who gamble. Again, this is higher amongst gamblers (24%) and even higher
amongst problem gamblers (33%). Youth are more inclined than older people
to know of under-aged gamblers (30% versus 14%, respectively).
Eight percent of the Eastern Cape population feels that people under the age of
18 should be allowed to gamble, with 87% disagreeing. Gamblers are slightly
more open-minded with 11% of them and 13% of problem gamblers agreeing
46
3427
19 1712 8 5 3 3 2
0
20
40
60
80
100
Wa
ste
of
mo
ne
y
Do
esn
't
app
ea
l to
me
Ne
ve
r th
ou
gh
t
abo
ut
it
Wa
ste
of
tim
e
Aga
inst
my
relig
ion
No
t a
va
ilab
le
in m
y a
rea
Do
n't
und
ers
tand
how
it
wo
rks
Kno
w o
f
peo
ple
harm
ed
Dis
tracts
fro
m
wo
rk/s
tudyin
g
Oth
er
Do
n't k
now
/no
sp
ecific
rea
so
n
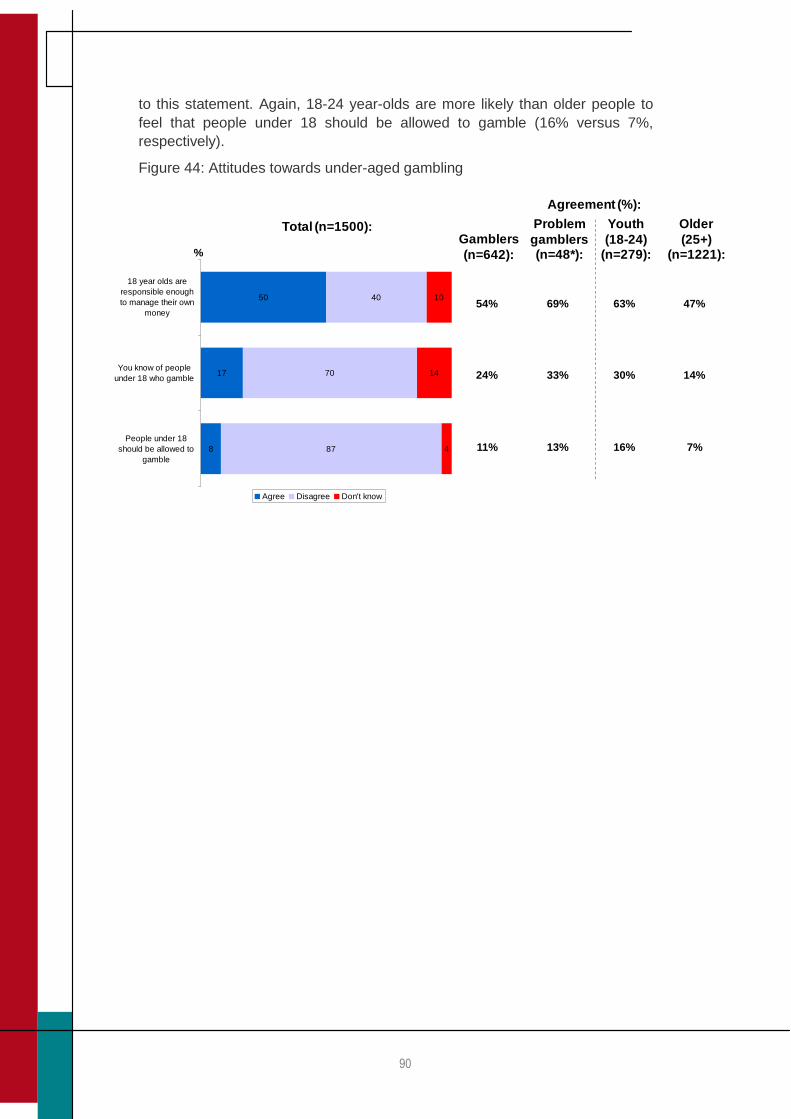
90
to this statement. Again, 18-24 year-olds are more likely than older people to
feel that people under 18 should be allowed to gamble (16% versus 7%,
respectively).
Figure 44: Attitudes towards under-aged gambling
8
17
50
87
70
40
4
14
10
People under 18
should be allowed to
gamble
You know of people
under 18 who gamble
18 year olds are
responsible enough
to manage their own
money
Agree Disagree Don't know
Total (n=1500):Gamblers
(n=642):
Problem
gamblers (n=48*):
54%
24%
11%
69%
33%
13%
Agreement (%):
Youth
(18-24) (n=279):
63%
30%
16%
%
Older
(25+) (n=1221):
47%
14%
7%
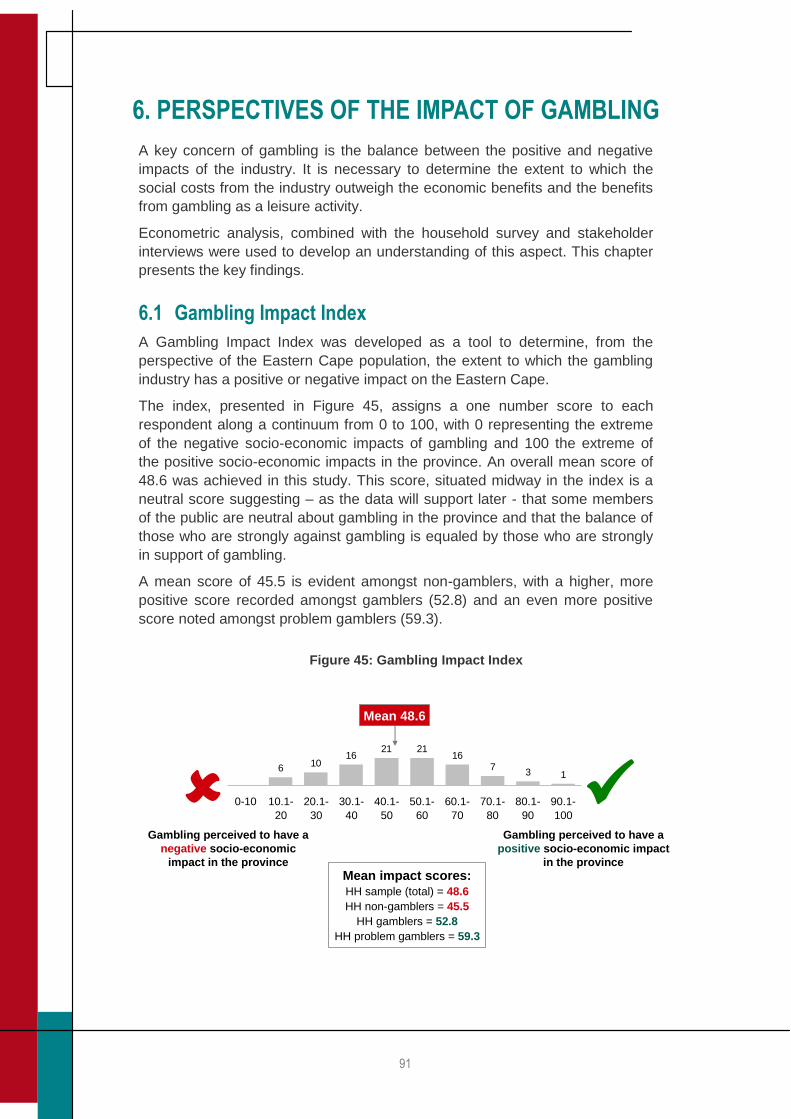
91
6. PERSPECTIVES OF THE IMPACT OF GAMBLING
A key concern of gambling is the balance between the positive and negative
impacts of the industry. It is necessary to determine the extent to which the
social costs from the industry outweigh the economic benefits and the benefits
from gambling as a leisure activity.
Econometric analysis, combined with the household survey and stakeholder
interviews were used to develop an understanding of this aspect. This chapter
presents the key findings.
6.1 Gambling Impact Index
A Gambling Impact Index was developed as a tool to determine, from the
perspective of the Eastern Cape population, the extent to which the gambling
industry has a positive or negative impact on the Eastern Cape.
The index, presented in Figure 45, assigns a one number score to each
respondent along a continuum from 0 to 100, with 0 representing the extreme
of the negative socio-economic impacts of gambling and 100 the extreme of
the positive socio-economic impacts in the province. An overall mean score of
48.6 was achieved in this study. This score, situated midway in the index is a
neutral score suggesting – as the data will support later - that some members
of the public are neutral about gambling in the province and that the balance of
those who are strongly against gambling is equaled by those who are strongly
in support of gambling.
A mean score of 45.5 is evident amongst non-gamblers, with a higher, more
positive score recorded amongst gamblers (52.8) and an even more positive
score noted amongst problem gamblers (59.3).
Gambling Impact IndexSource: Q21
Household study
n=1313
Filter: Disagree to all statements
610
1621 21
167
3 1
0-10 10.1-
20
20.1-
30
30.1-
40
40.1-
50
50.1-
60
60.1-
70
70.1-
80
80.1-
90
90.1-
100
This index has been constructed using agreement with statements relating to people‟s
perceptions of gambling in the Eastern Cape
Eastern Cape residents fall along a continuum as follows:
Gambling perceived to have a
negative socio-economic
impact in the province
Gambling perceived to have a
positive socio-economic impact
in the province
Mean impact scores:
HH sample (total) = 48.6
HH non-gamblers = 45.5
HH gamblers = 52.8
HH problem gamblers = 59.3
Mean 48.6
Figure 45: Gambling Impact Index
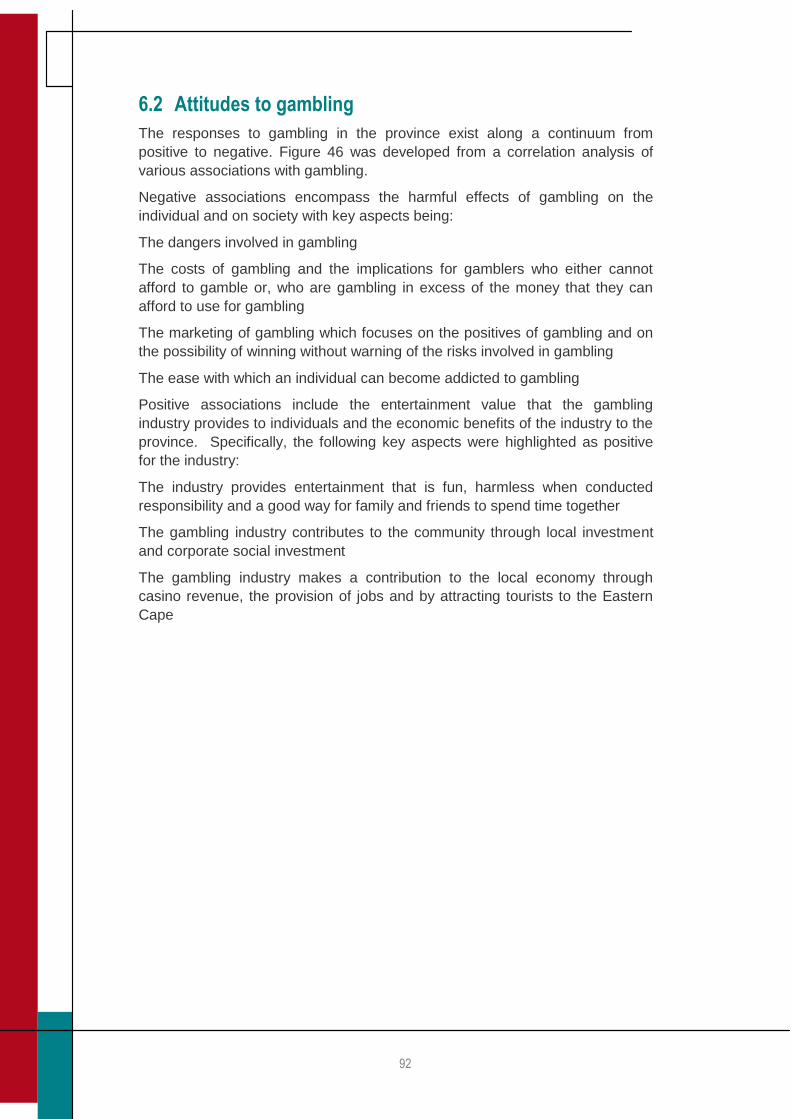
92
6.2 Attitudes to gambling
The responses to gambling in the province exist along a continuum from
positive to negative. Figure 46 was developed from a correlation analysis of
various associations with gambling.
Negative associations encompass the harmful effects of gambling on the
individual and on society with key aspects being:
The dangers involved in gambling
The costs of gambling and the implications for gamblers who either cannot
afford to gamble or, who are gambling in excess of the money that they can
afford to use for gambling
The marketing of gambling which focuses on the positives of gambling and on
the possibility of winning without warning of the risks involved in gambling
The ease with which an individual can become addicted to gambling
Positive associations include the entertainment value that the gambling
industry provides to individuals and the economic benefits of the industry to the
province. Specifically, the following key aspects were highlighted as positive
for the industry:
The industry provides entertainment that is fun, harmless when conducted
responsibility and a good way for family and friends to spend time together
The gambling industry contributes to the community through local investment
and corporate social investment
The gambling industry makes a contribution to the local economy through
casino revenue, the provision of jobs and by attracting tourists to the Eastern
Cape
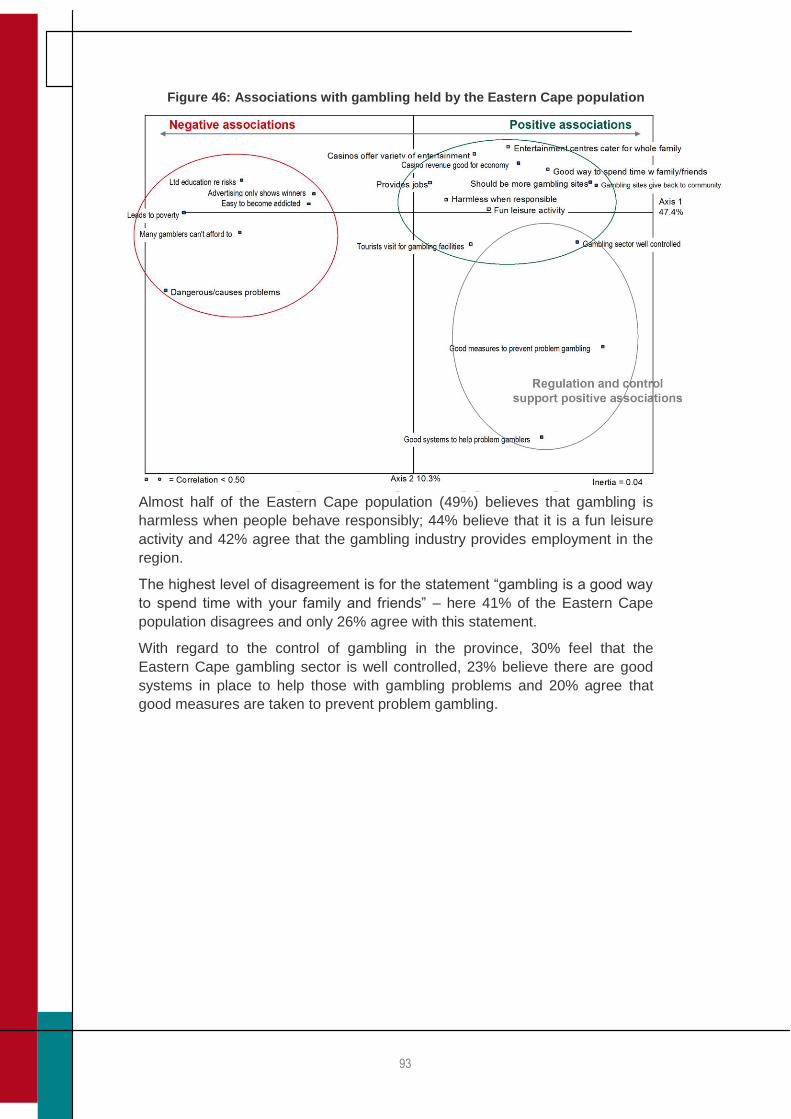
93
Almost half of the Eastern Cape population (49%) believes that gambling is
harmless when people behave responsibly; 44% believe that it is a fun leisure
activity and 42% agree that the gambling industry provides employment in the
region.
The highest level of disagreement is for the statement “gambling is a good way
to spend time with your family and friends” – here 41% of the Eastern Cape
population disagrees and only 26% agree with this statement.
With regard to the control of gambling in the province, 30% feel that the
Eastern Cape gambling sector is well controlled, 23% believe there are good
systems in place to help those with gambling problems and 20% agree that
good measures are taken to prevent problem gambling.
Figure 46: Associations with gambling held by the Eastern Cape population
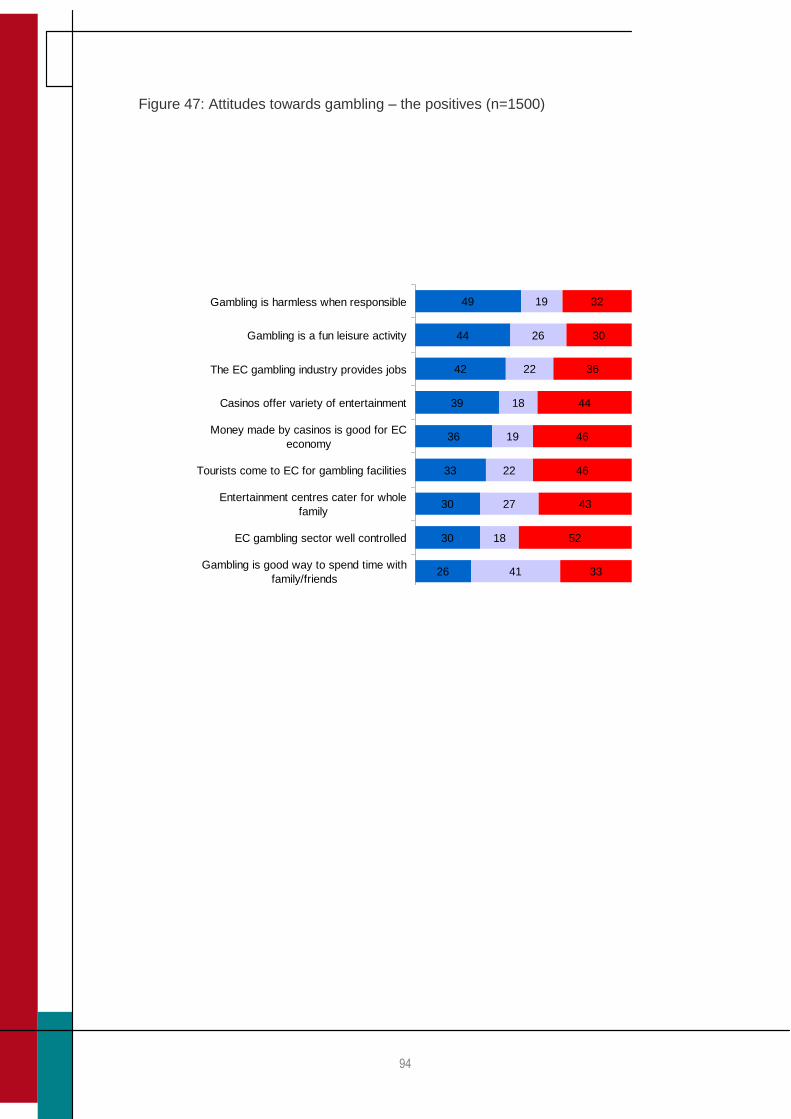
94
Figure 47: Attitudes towards gambling – the positives (n=1500)
20
23
25
26
30
30
33
36
39
42
44
49
26
24
20
41
18
27
22
19
18
22
26
19
54
53
54
33
52
43
46
46
44
36
30
32
Good measures to prevent problem
gambling
Good systems to help those with gambling
problems
Casinos and other sites give back to EC
community
Gambling is good way to spend time with
family/friends
EC gambling sector well controlled
Entertainment centres cater for whole
family
Tourists come to EC for gambling facilities
Money made by casinos is good for EC
economy
Casinos offer variety of entertainment
The EC gambling industry provides jobs
Gambling is a fun leisure activity
Gambling is harmless when responsible
Agree Disagree Don't know
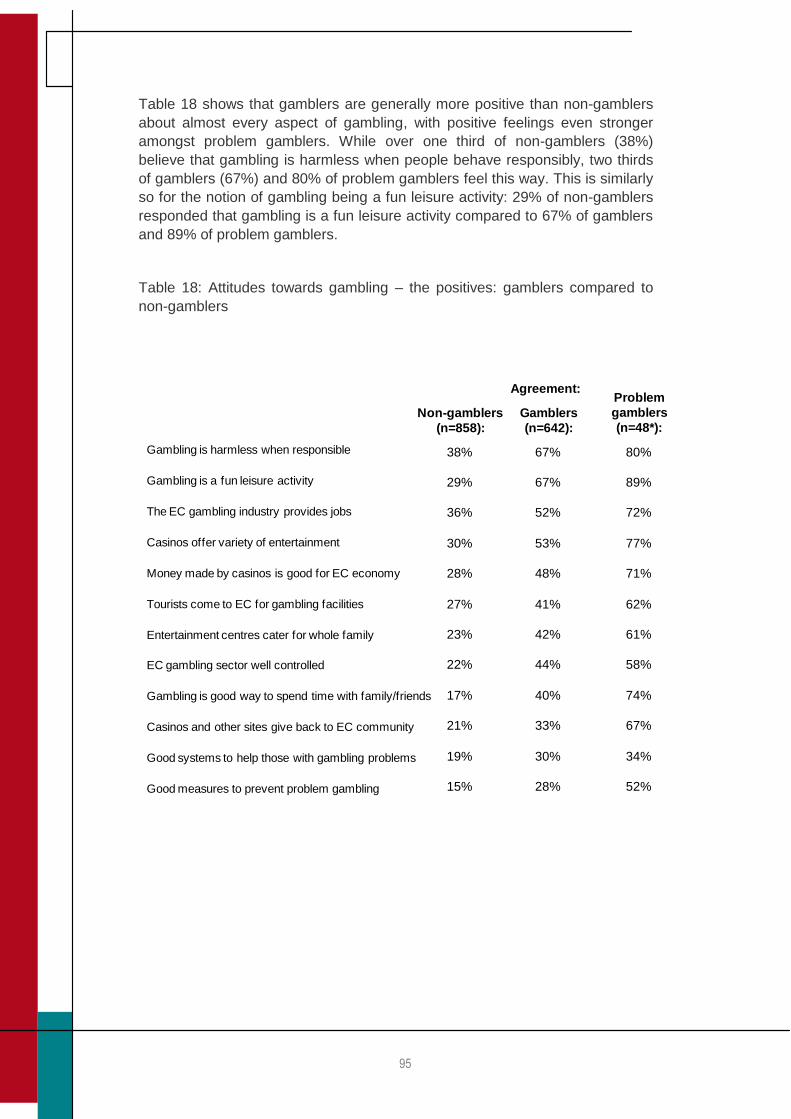
95
Table 18 shows that gamblers are generally more positive than non-gamblers
about almost every aspect of gambling, with positive feelings even stronger
amongst problem gamblers. While over one third of non-gamblers (38%)
believe that gambling is harmless when people behave responsibly, two thirds
of gamblers (67%) and 80% of problem gamblers feel this way. This is similarly
so for the notion of gambling being a fun leisure activity: 29% of non-gamblers
responded that gambling is a fun leisure activity compared to 67% of gamblers
and 89% of problem gamblers.
Table 18: Attitudes towards gambling – the positives: gamblers compared to
non-gamblers
Non-gamblers
(n=858):
Gamblers
(n=642):
38%
29%
36%
30%
28%
27%
23%
22%
17%
21%
19%
15%
67%
67%
52%
53%
48%
41%
42%
44%
40%
33%
30%
28%
Agreement:Problem
gamblers
(n=48*):
80%
89%
72%
77%
71%
62%
61%
58%
74%
67%
34%
52%
Gambling is harmless when responsible
Gambling is a fun leisure activity
The EC gambling industry provides jobs
Casinos offer variety of entertainment
Money made by casinos is good for EC economy
Tourists come to EC for gambling facilities
Entertainment centres cater for whole family
EC gambling sector well controlled
Gambling is good way to spend time with family/friends
Casinos and other sites give back to EC community
Good systems to help those with gambling problems
Good measures to prevent problem gambling
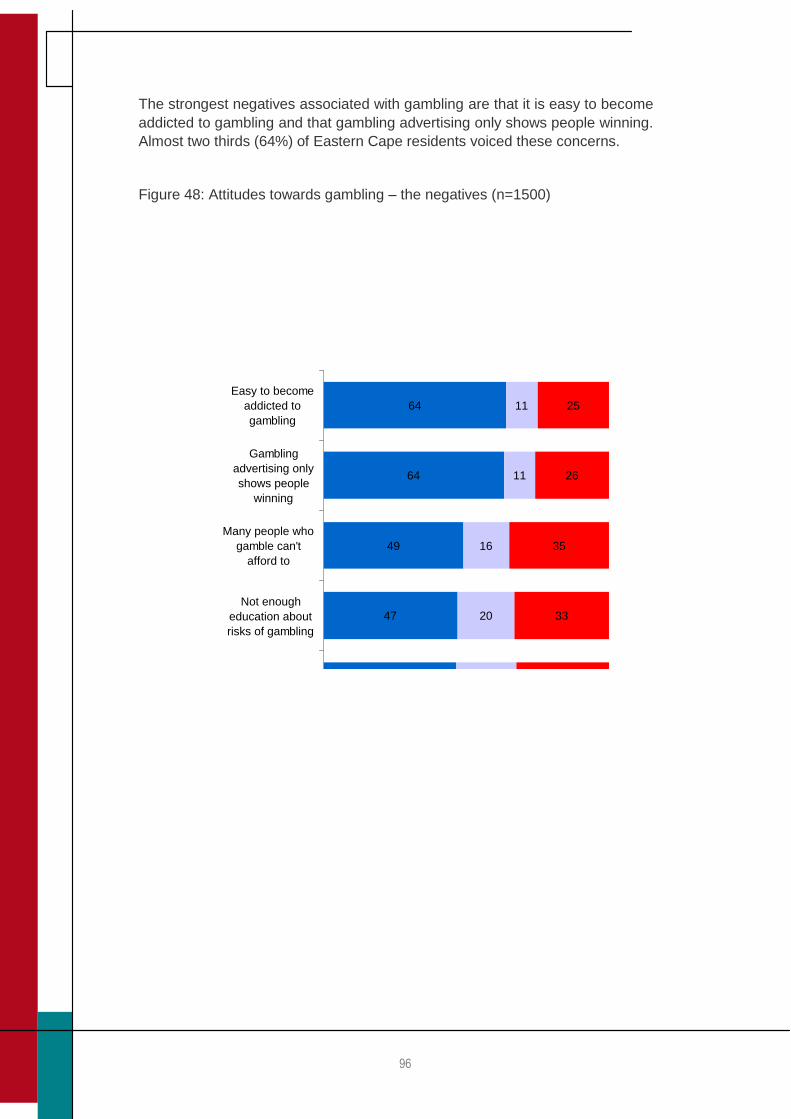
96
The strongest negatives associated with gambling are that it is easy to become
addicted to gambling and that gambling advertising only shows people winning.
Almost two thirds (64%) of Eastern Cape residents voiced these concerns.
Figure 48: Attitudes towards gambling – the negatives (n=1500)
37
46
47
49
64
64
21
21
20
16
11
11
42
32
33
35
26
25
Gambling is
dangerous,
causes problems
in EC
Gambling leads to
poverty in EC
Not enough
education about
risks of gambling
Many people who
gamble can't
afford to
Gambling
advertising only
shows people
winning
Easy to become
addicted to
gambling
Agree Disagree Don't know
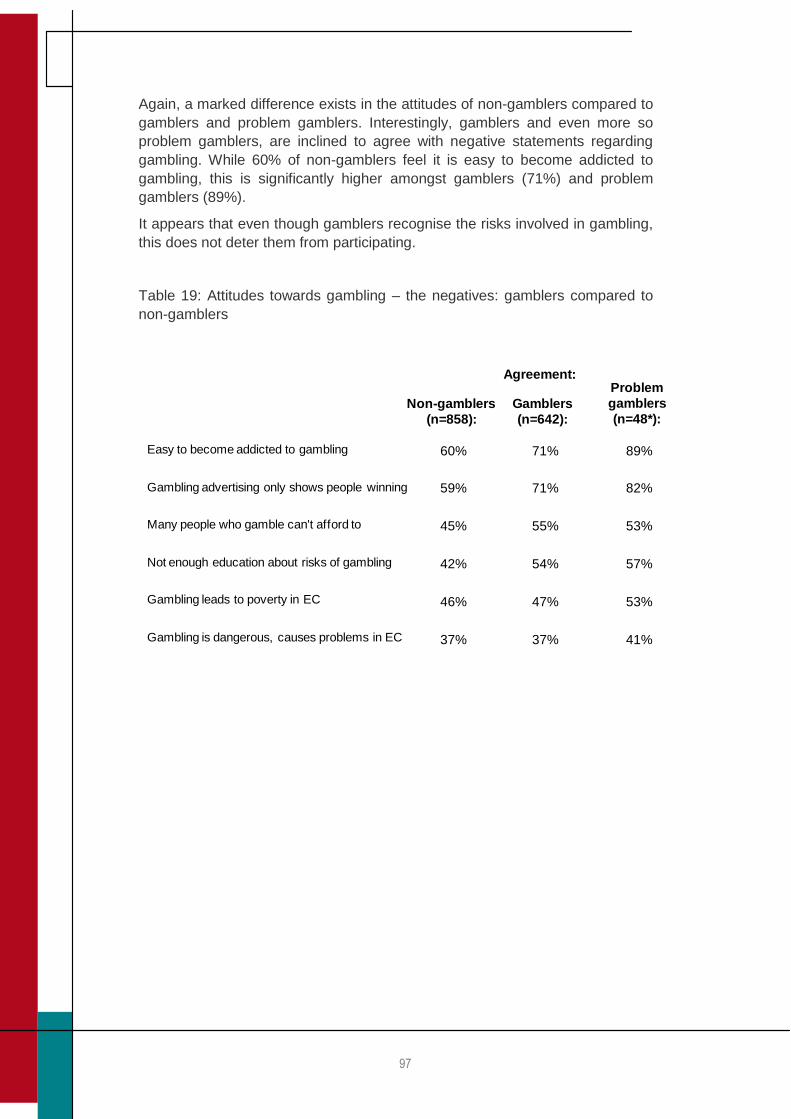
97
Again, a marked difference exists in the attitudes of non-gamblers compared to
gamblers and problem gamblers. Interestingly, gamblers and even more so
problem gamblers, are inclined to agree with negative statements regarding
gambling. While 60% of non-gamblers feel it is easy to become addicted to
gambling, this is significantly higher amongst gamblers (71%) and problem
gamblers (89%).
It appears that even though gamblers recognise the risks involved in gambling,
this does not deter them from participating.
Table 19: Attitudes towards gambling – the negatives: gamblers compared to
non-gamblers
60%
59%
45%
42%
46%
37%
71%
71%
55%
54%
47%
37%
Non-gamblers
(n=858):
Gamblers
(n=642):
89%
82%
53%
57%
53%
41%
Problem
gamblers
(n=48*):
Agreement:
Easy to become addicted to gambling
Gambling advertising only shows people winning
Many people who gamble can't afford to
Not enough education about risks of gambling
Gambling leads to poverty in EC
Gambling is dangerous, causes problems in EC
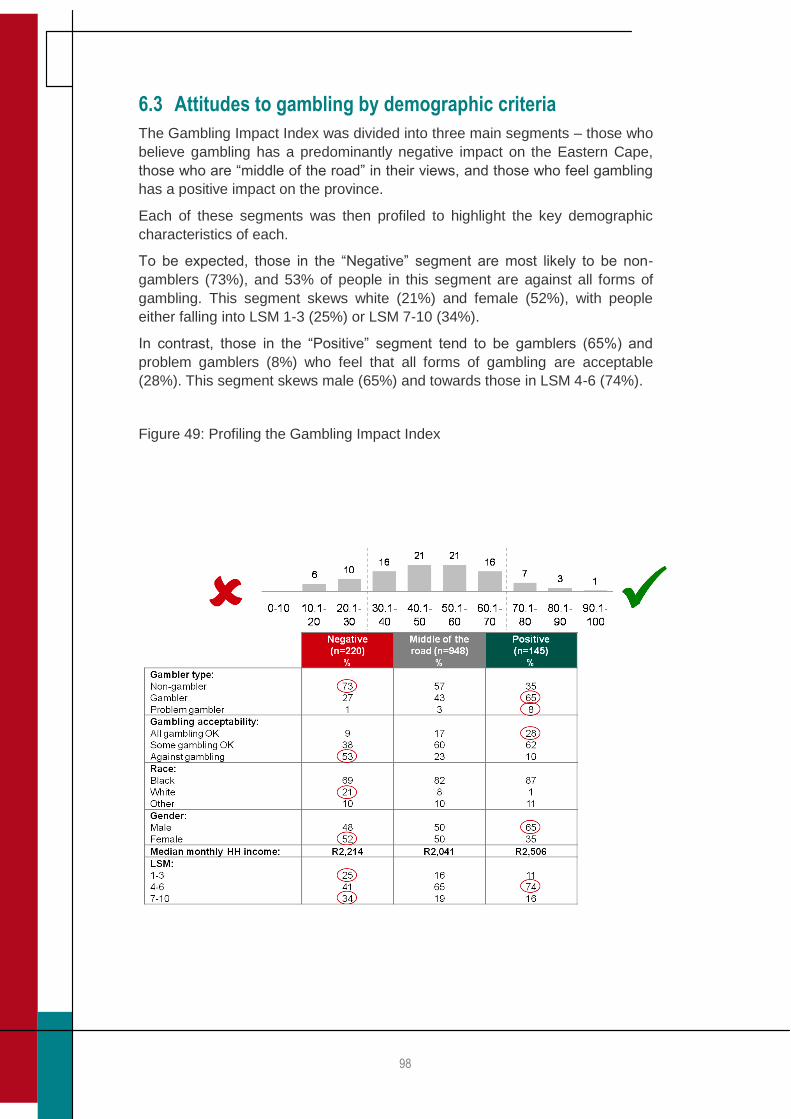
98
6.3 Attitudes to gambling by demographic criteria
The Gambling Impact Index was divided into three main segments – those who
believe gambling has a predominantly negative impact on the Eastern Cape,
those who are “middle of the road” in their views, and those who feel gambling
has a positive impact on the province.
Each of these segments was then profiled to highlight the key demographic
characteristics of each.
To be expected, those in the “Negative” segment are most likely to be non-
gamblers (73%), and 53% of people in this segment are against all forms of
gambling. This segment skews white (21%) and female (52%), with people
either falling into LSM 1-3 (25%) or LSM 7-10 (34%).
In contrast, those in the “Positive” segment tend to be gamblers (65%) and
problem gamblers (8%) who feel that all forms of gambling are acceptable
(28%). This segment skews male (65%) and towards those in LSM 4-6 (74%).
Figure 49: Profiling the Gambling Impact Index
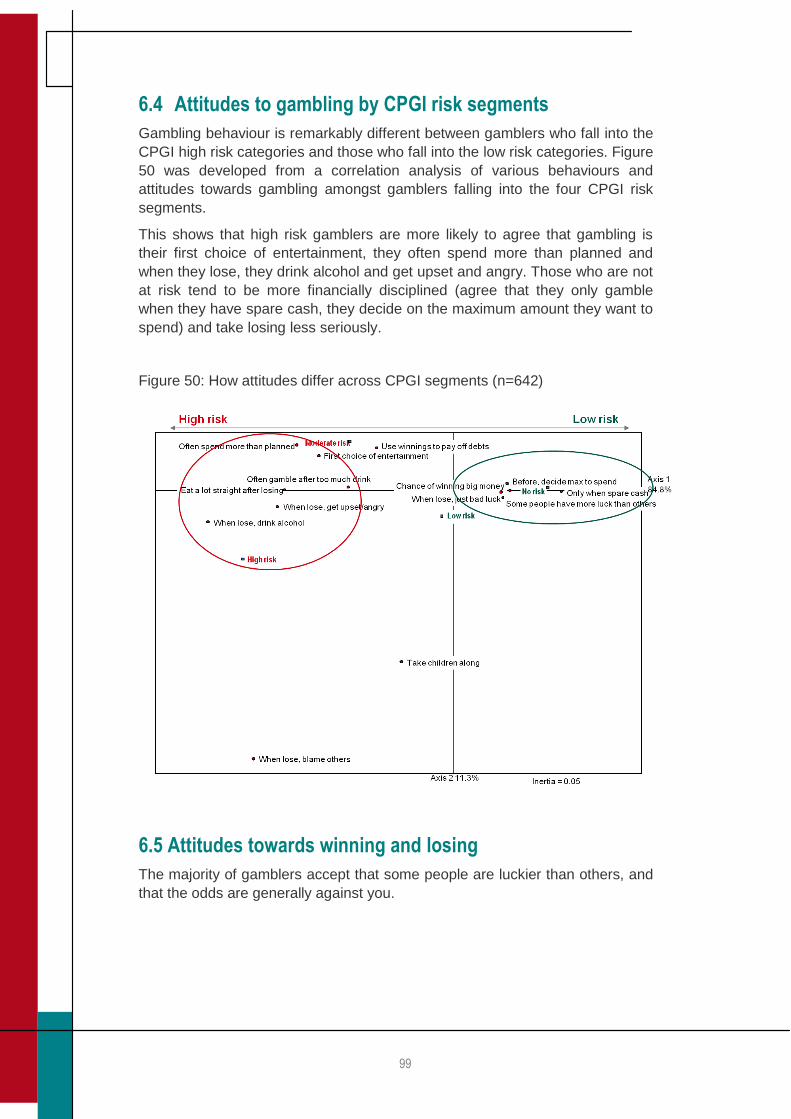
99
6.4 Attitudes to gambling by CPGI risk segments
Gambling behaviour is remarkably different between gamblers who fall into the
CPGI high risk categories and those who fall into the low risk categories. Figure
50 was developed from a correlation analysis of various behaviours and
attitudes towards gambling amongst gamblers falling into the four CPGI risk
segments.
This shows that high risk gamblers are more likely to agree that gambling is
their first choice of entertainment, they often spend more than planned and
when they lose, they drink alcohol and get upset and angry. Those who are not
at risk tend to be more financially disciplined (agree that they only gamble
when they have spare cash, they decide on the maximum amount they want to
spend) and take losing less seriously.
Figure 50: How attitudes differ across CPGI segments (n=642)
6.5 Attitudes towards winning and losing
The majority of gamblers accept that some people are luckier than others, and
that the odds are generally against you.
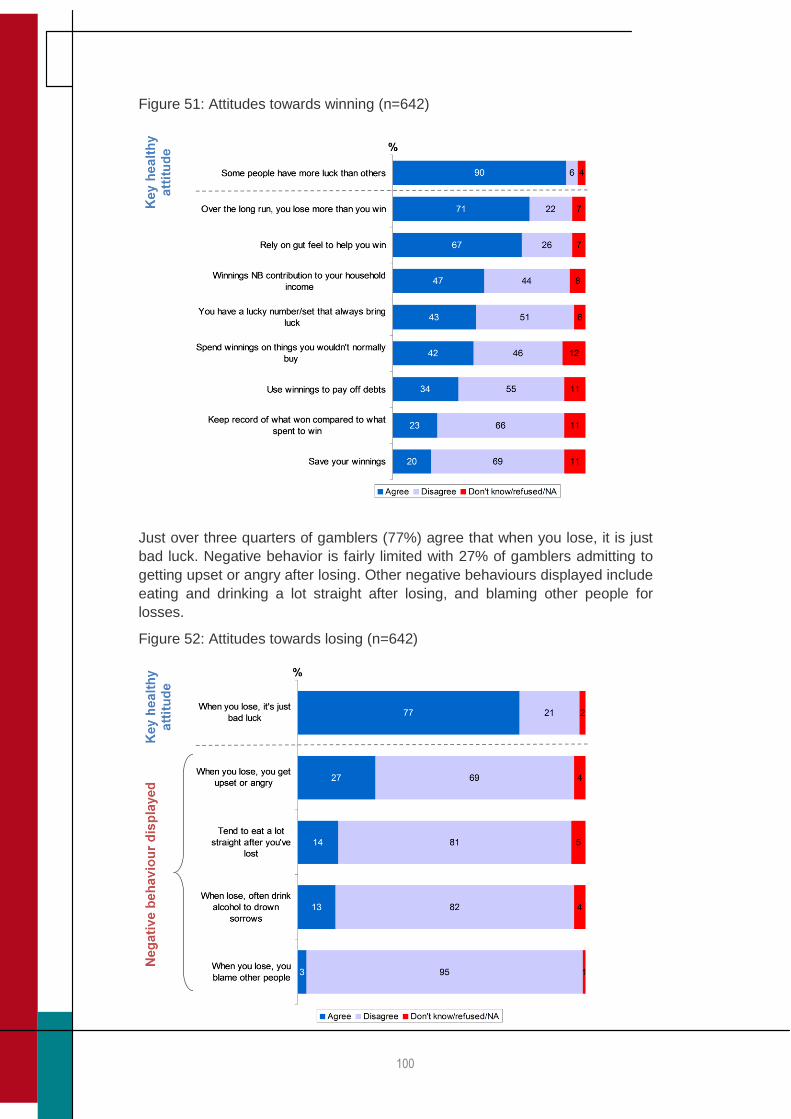
100
Figure 51: Attitudes towards winning (n=642)
Just over three quarters of gamblers (77%) agree that when you lose, it is just
bad luck. Negative behavior is fairly limited with 27% of gamblers admitting to
getting upset or angry after losing. Other negative behaviours displayed include
eating and drinking a lot straight after losing, and blaming other people for
losses.
Figure 52: Attitudes towards losing (n=642)
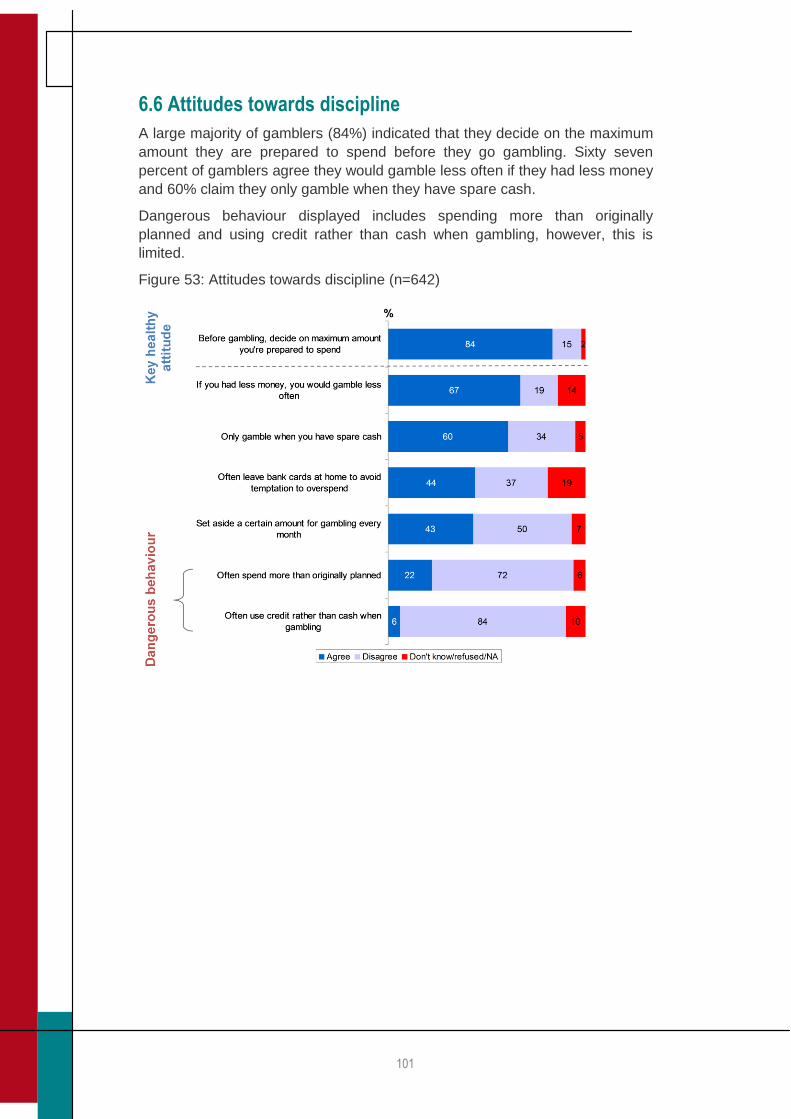
101
6.6 Attitudes towards discipline
A large majority of gamblers (84%) indicated that they decide on the maximum
amount they are prepared to spend before they go gambling. Sixty seven
percent of gamblers agree they would gamble less often if they had less money
and 60% claim they only gamble when they have spare cash.
Dangerous behaviour displayed includes spending more than originally
planned and using credit rather than cash when gambling, however, this is
limited.
Figure 53: Attitudes towards discipline (n=642)
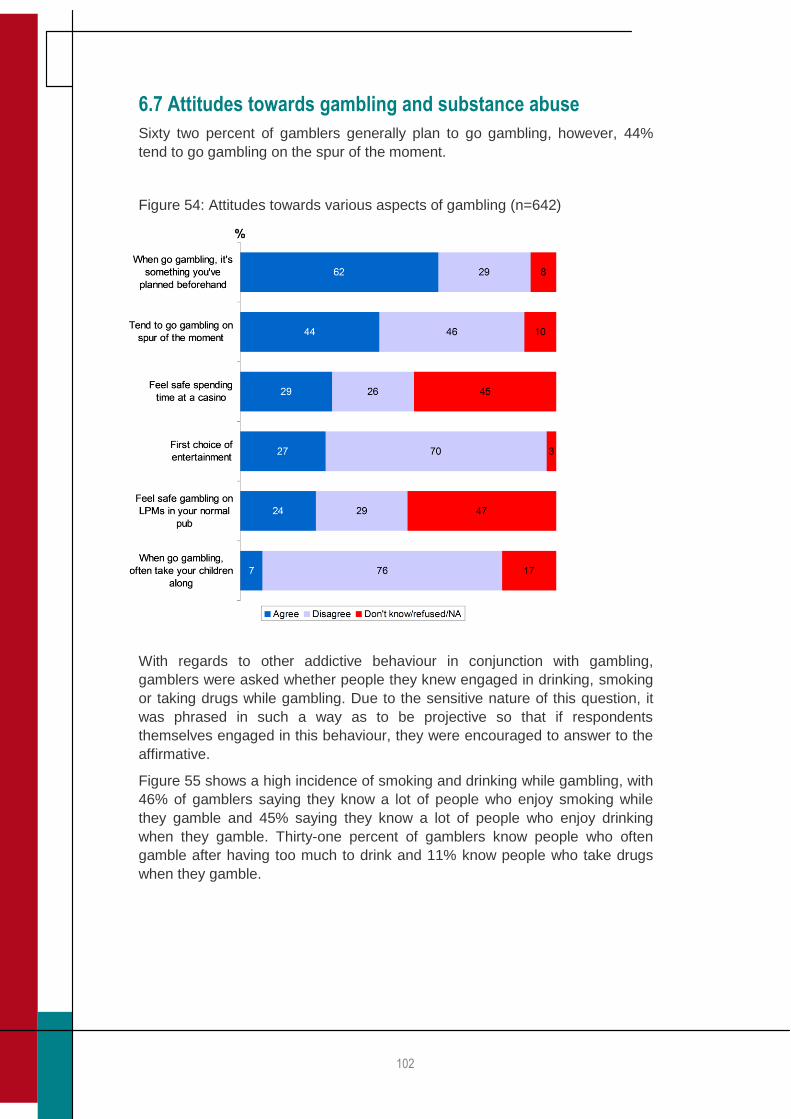
102
6.7 Attitudes towards gambling and substance abuse
Sixty two percent of gamblers generally plan to go gambling, however, 44%
tend to go gambling on the spur of the moment.
Figure 54: Attitudes towards various aspects of gambling (n=642)
With regards to other addictive behaviour in conjunction with gambling,
gamblers were asked whether people they knew engaged in drinking, smoking
or taking drugs while gambling. Due to the sensitive nature of this question, it
was phrased in such a way as to be projective so that if respondents
themselves engaged in this behaviour, they were encouraged to answer to the
affirmative.
Figure 55 shows a high incidence of smoking and drinking while gambling, with
46% of gamblers saying they know a lot of people who enjoy smoking while
they gamble and 45% saying they know a lot of people who enjoy drinking
when they gamble. Thirty-one percent of gamblers know people who often
gamble after having too much to drink and 11% know people who take drugs
when they gamble.
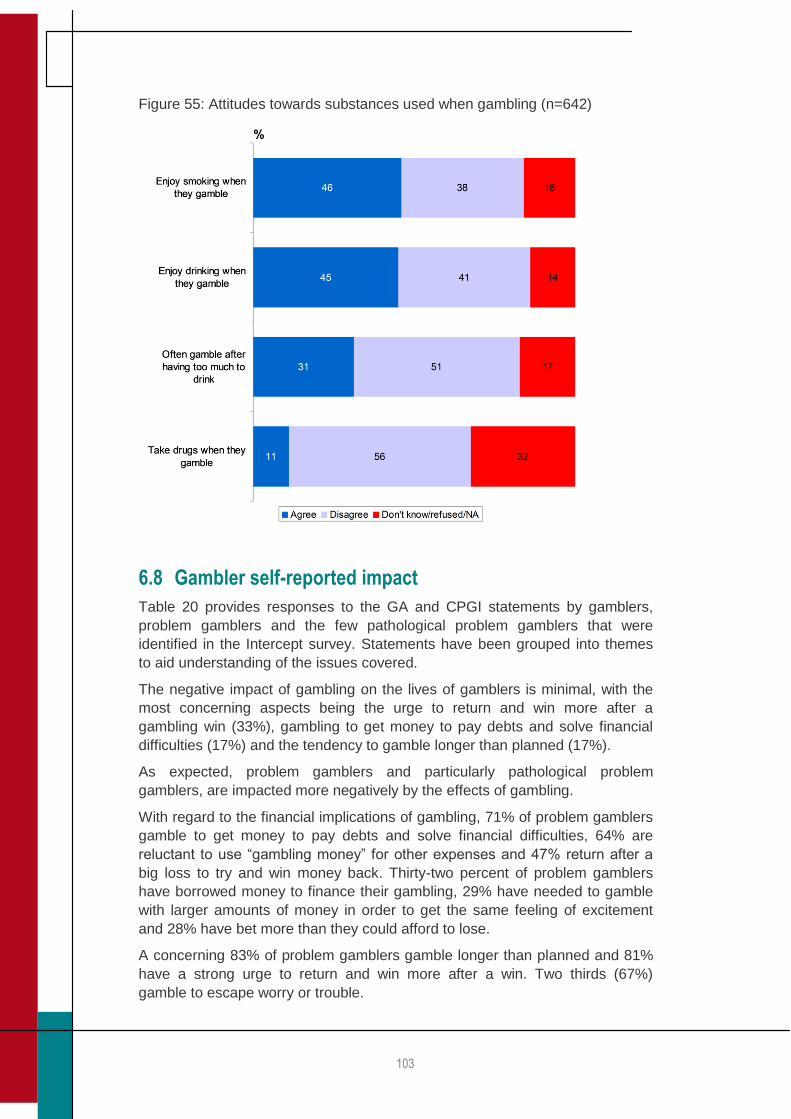
103
Figure 55: Attitudes towards substances used when gambling (n=642)
6.8 Gambler self-reported impact
Table 20 provides responses to the GA and CPGI statements by gamblers,
problem gamblers and the few pathological problem gamblers that were
identified in the Intercept survey. Statements have been grouped into themes
to aid understanding of the issues covered.
The negative impact of gambling on the lives of gamblers is minimal, with the
most concerning aspects being the urge to return and win more after a
gambling win (33%), gambling to get money to pay debts and solve financial
difficulties (17%) and the tendency to gamble longer than planned (17%).
As expected, problem gamblers and particularly pathological problem
gamblers, are impacted more negatively by the effects of gambling.
With regard to the financial implications of gambling, 71% of problem gamblers
gamble to get money to pay debts and solve financial difficulties, 64% are
reluctant to use “gambling money” for other expenses and 47% return after a
big loss to try and win money back. Thirty-two percent of problem gamblers
have borrowed money to finance their gambling, 29% have needed to gamble
with larger amounts of money in order to get the same feeling of excitement
and 28% have bet more than they could afford to lose.
A concerning 83% of problem gamblers gamble longer than planned and 81%
have a strong urge to return and win more after a win. Two thirds (67%)
gamble to escape worry or trouble.
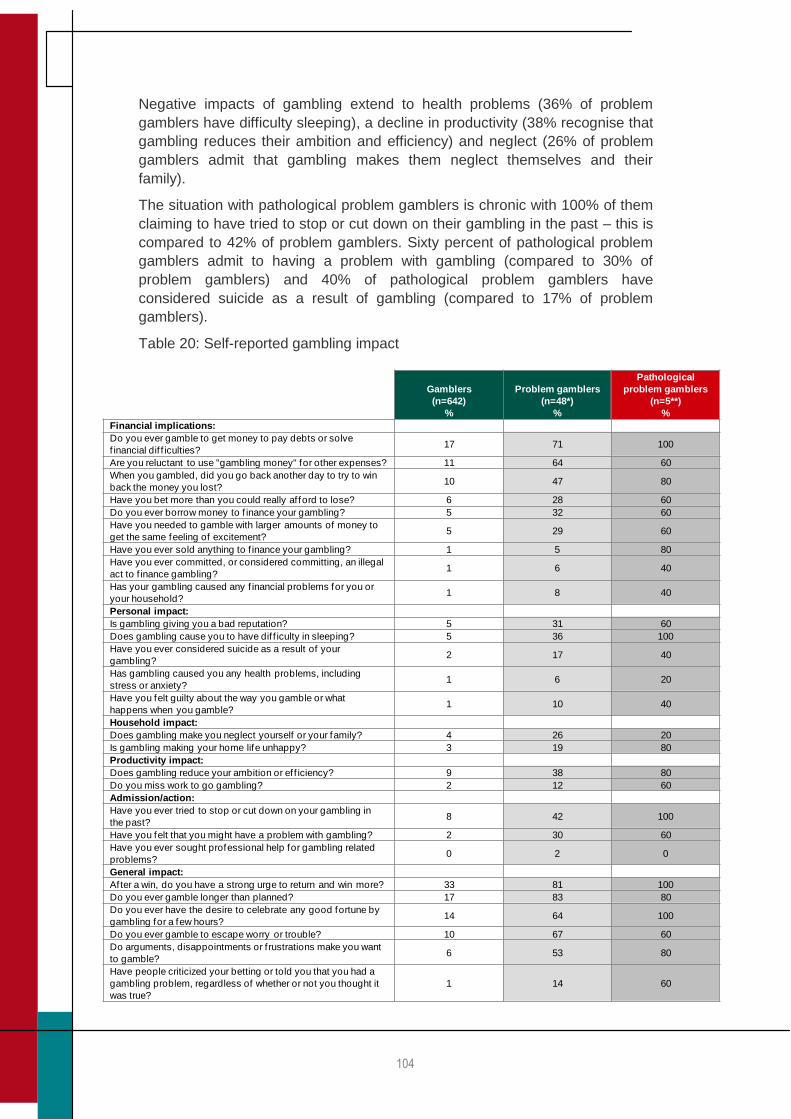
104
Negative impacts of gambling extend to health problems (36% of problem
gamblers have difficulty sleeping), a decline in productivity (38% recognise that
gambling reduces their ambition and efficiency) and neglect (26% of problem
gamblers admit that gambling makes them neglect themselves and their
family).
The situation with pathological problem gamblers is chronic with 100% of them
claiming to have tried to stop or cut down on their gambling in the past – this is
compared to 42% of problem gamblers. Sixty percent of pathological problem
gamblers admit to having a problem with gambling (compared to 30% of
problem gamblers) and 40% of pathological problem gamblers have
considered suicide as a result of gambling (compared to 17% of problem
gamblers).
Table 20: Self-reported gambling impact
Gamblers
(n=642)
%
Problem gamblers
(n=48*)
%
Pathological
problem gamblers
(n=5**)
%
Financial implications:
Do you ever gamble to get money to pay debts or solve
f inancial dif f iculties?17 71 100
Are you reluctant to use "gambling money" for other expenses? 11 64 60
When you gambled, did you go back another day to try to win
back the money you lost?10 47 80
Have you bet more than you could really af ford to lose? 6 28 60
Do you ever borrow money to f inance your gambling? 5 32 60
Have you needed to gamble with larger amounts of money to
get the same feeling of excitement?5 29 60
Have you ever sold anything to f inance your gambling? 1 5 80
Have you ever committed, or considered committing, an illegal
act to f inance gambling?1 6 40
Has your gambling caused any f inancial problems for you or
your household?1 8 40
Personal impact:
Is gambling giving you a bad reputation? 5 31 60
Does gambling cause you to have dif f iculty in sleeping? 5 36 100
Have you ever considered suicide as a result of your
gambling?2 17 40
Has gambling caused you any health problems, including
stress or anxiety?1 6 20
Have you felt guilty about the way you gamble or what
happens when you gamble?1 10 40
Household impact:
Does gambling make you neglect yourself or your family? 4 26 20
Is gambling making your home life unhappy? 3 19 80
Productivity impact:
Does gambling reduce your ambition or ef f iciency? 9 38 80
Do you miss work to go gambling? 2 12 60
Admission/action:
Have you ever tried to stop or cut down on your gambling in
the past?8 42 100
Have you felt that you might have a problem with gambling? 2 30 60
Have you ever sought professional help for gambling related
problems?0 2 0
General impact:
After a win, do you have a strong urge to return and win more? 33 81 100
Do you ever gamble longer than planned? 17 83 80
Do you ever have the desire to celebrate any good fortune by
gambling for a few hours?14 64 100
Do you ever gamble to escape worry or trouble? 10 67 60
Do arguments, disappointments or f rustrations make you want
to gamble?6 53 80
Have people criticized your betting or told you that you had a
gambling problem, regardless of whether or not you thought it
was true?
1 14 60
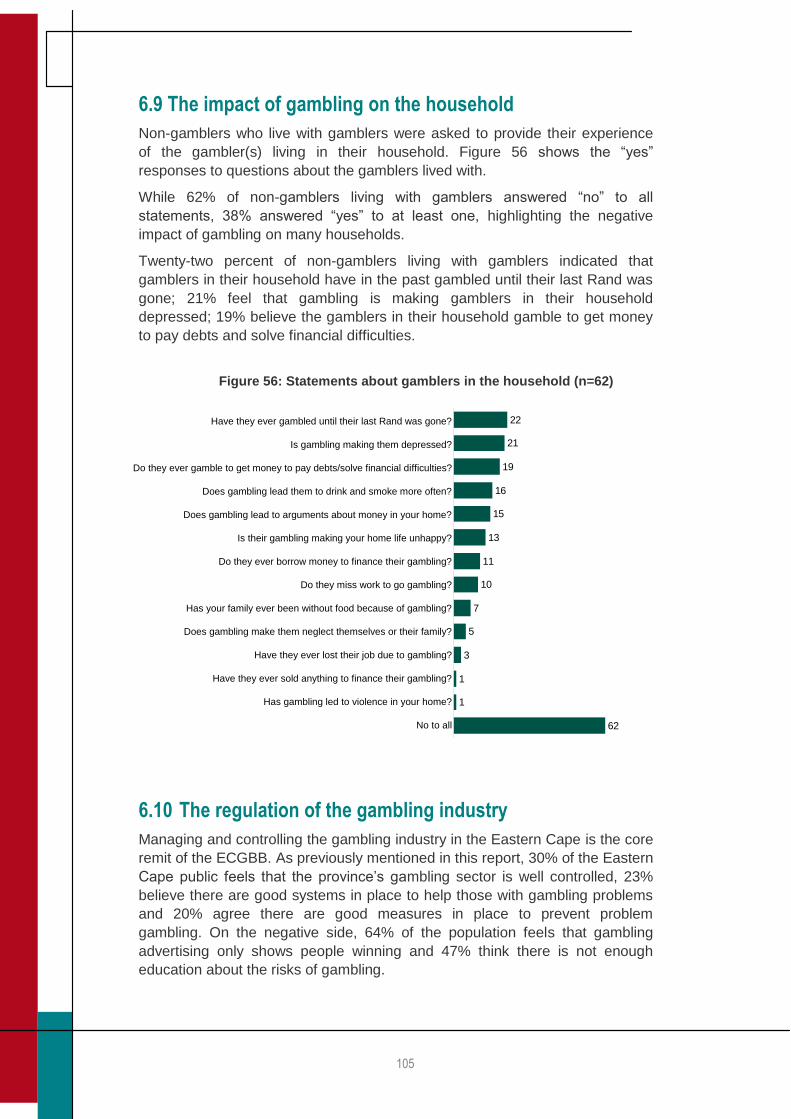
105
6.9 The impact of gambling on the household
Non-gamblers who live with gamblers were asked to provide their experience
of the gambler(s) living in their household. Figure 56 shows the “yes”
responses to questions about the gamblers lived with.
While 62% of non-gamblers living with gamblers answered “no” to all
statements, 38% answered “yes” to at least one, highlighting the negative
impact of gambling on many households.
Twenty-two percent of non-gamblers living with gamblers indicated that
gamblers in their household have in the past gambled until their last Rand was
gone; 21% feel that gambling is making gamblers in their household
depressed; 19% believe the gamblers in their household gamble to get money
to pay debts and solve financial difficulties.
6.10 The regulation of the gambling industry
Managing and controlling the gambling industry in the Eastern Cape is the core
remit of the ECGBB. As previously mentioned in this report, 30% of the Eastern
Cape public feels that the province‟s gambling sector is well controlled, 23%
believe there are good systems in place to help those with gambling problems
and 20% agree there are good measures in place to prevent problem
gambling. On the negative side, 64% of the population feels that gambling
advertising only shows people winning and 47% think there is not enough
education about the risks of gambling.
22
21
19
16
15
13
11
10
7
5
3
1
1
62
Household study
n=62
Filter: Non-gamblers with people in household
who gamble regularly
Have they ever gambled until their last Rand was gone?
Is gambling making them depressed?
Do they ever gamble to get money to pay debts/solve financial difficulties?
Does gambling lead them to drink and smoke more often?
Does gambling lead to arguments about money in your home?
Is their gambling making your home life unhappy?
Do they ever borrow money to finance their gambling?
Do they miss work to go gambling?
Has your family ever been without food because of gambling?
Does gambling make them neglect themselves or their family?
Have they ever lost their job due to gambling?
Have they ever sold anything to finance their gambling?
Has gambling led to violence in your home?
No to all
Figure 56: Statements about gamblers in the household (n=62)
Figure 6.9 Impact of gambling on the household
106
Gambling licence holders spoke of the need for consistency in terms of
advertising approval turnaround times, with respondents noting that Queens
Casino generally experiences a 24 hour turnaround time for advertising
approval while Phumelela claimed they had had a bad experience which
involved “chasing the ECGBB after three weeks” for one of their adverts.
Other concerns raised involved the high levels of staff turnover at the ECGBB
with licence holders unsure as to who the best person to contact at the ECGBB
would be. A direct result of the high turnover is the instability of the inspectorate
which, according to licence holders, should be skilled and should have direct
relationships with gambling sites, particularly casinos.
While only 28% of the population would like to see further growth in the
gambling industry, participants in the qualitative focus groups and stakeholders
interviewed expressed the belief that further growth in the industry was
possible particularly in terms of the casino industry and in terms of LPMs.
Nonetheless, people recognise the societal risks of gambling, particularly
amongst the poorer residents of the Eastern Cape:
“Eastern Cape is one of the poorer provinces… it should be protected from
putting more casinos out there, to protect the lower income residents.”
(Casino operator)
Others expressed concern about the saturation point of the gambling industry
believing that the gambling industry has reached the maximum size that the
Eastern Cape economy can currently service.
Awareness of gambling regulatory boards and support programmes increases
as the relevance and need for such programmes increases, however, there is
generally a low level of awareness with 60% of gamblers unaware of any
boards or support programmes.
A quarter of gamblers (25%) have heard of the National Gambling Board, 17%
are familiar with the ECGBB and 17% are aware of the National Responsible
Gambling Programme. Awareness is higher amongst problem gamblers: 30%
are familiar with the National Gambling Board, 31% are aware of the ECGBB
and 28% have heard of the National Responsible Gambling Programmes.
While awareness figures improve amongst problem gamblers, the level of
unawareness amongst these gamblers and amongst non-gamblers living with
gamblers, is of great concern.
Although the base size for pathological problem gamblers is extremely small, it
is still concerning to note that awareness levels for each of the following are
only at 20%: National Gambling Board, ECGBB, the Problem Gambling
Counselling toll-free help line, the Responsible Gambling website and the
gambling self-exclusion programme. More encouraging is that all pathological
problem gamblers in the sample were aware of the National Responsible
Gambling Programme.
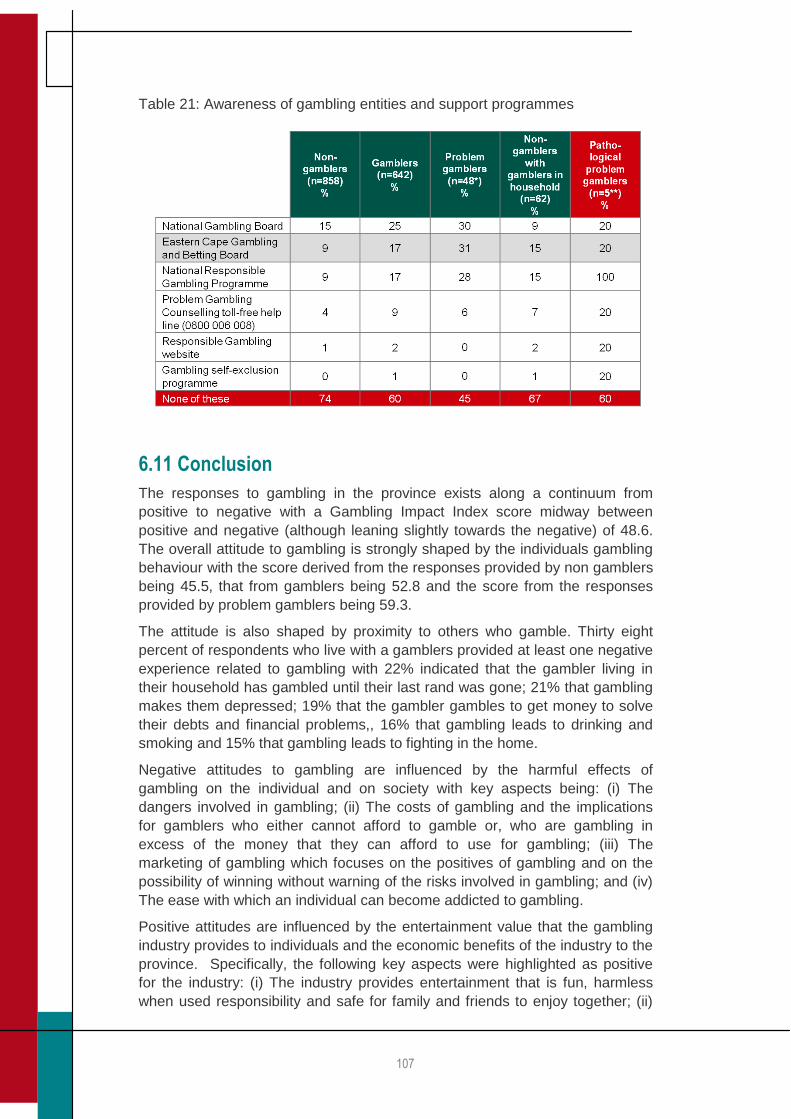
107
Table 21: Awareness of gambling entities and support programmes
6.11 Conclusion
The responses to gambling in the province exists along a continuum from
positive to negative with a Gambling Impact Index score midway between
positive and negative (although leaning slightly towards the negative) of 48.6.
The overall attitude to gambling is strongly shaped by the individuals gambling
behaviour with the score derived from the responses provided by non gamblers
being 45.5, that from gamblers being 52.8 and the score from the responses
provided by problem gamblers being 59.3.
The attitude is also shaped by proximity to others who gamble. Thirty eight
percent of respondents who live with a gamblers provided at least one negative
experience related to gambling with 22% indicated that the gambler living in
their household has gambled until their last rand was gone; 21% that gambling
makes them depressed; 19% that the gambler gambles to get money to solve
their debts and financial problems,, 16% that gambling leads to drinking and
smoking and 15% that gambling leads to fighting in the home.
Negative attitudes to gambling are influenced by the harmful effects of
gambling on the individual and on society with key aspects being: (i) The
dangers involved in gambling; (ii) The costs of gambling and the implications
for gamblers who either cannot afford to gamble or, who are gambling in
excess of the money that they can afford to use for gambling; (iii) The
marketing of gambling which focuses on the positives of gambling and on the
possibility of winning without warning of the risks involved in gambling; and (iv)
The ease with which an individual can become addicted to gambling.
Positive attitudes are influenced by the entertainment value that the gambling
industry provides to individuals and the economic benefits of the industry to the
province. Specifically, the following key aspects were highlighted as positive
for the industry: (i) The industry provides entertainment that is fun, harmless
when used responsibility and safe for family and friends to enjoy together; (ii)
108
The gambling industry contributes to the community through local investment
and social corporate investment; and (iii) The gambling industry makes a
contribution to the local economy through casino revenue, the provision of jobs
and through attracting tourists into the Eastern Cape.
Almost half (49%) of the Eastern Cape population believe that gambling is
harmless when it is responsibly done; 44% believe that it is a fun leisure activity
and 42% that the gambling industry provides employment in the region.
109
SECTION D
The Economic Impact
of Gambling
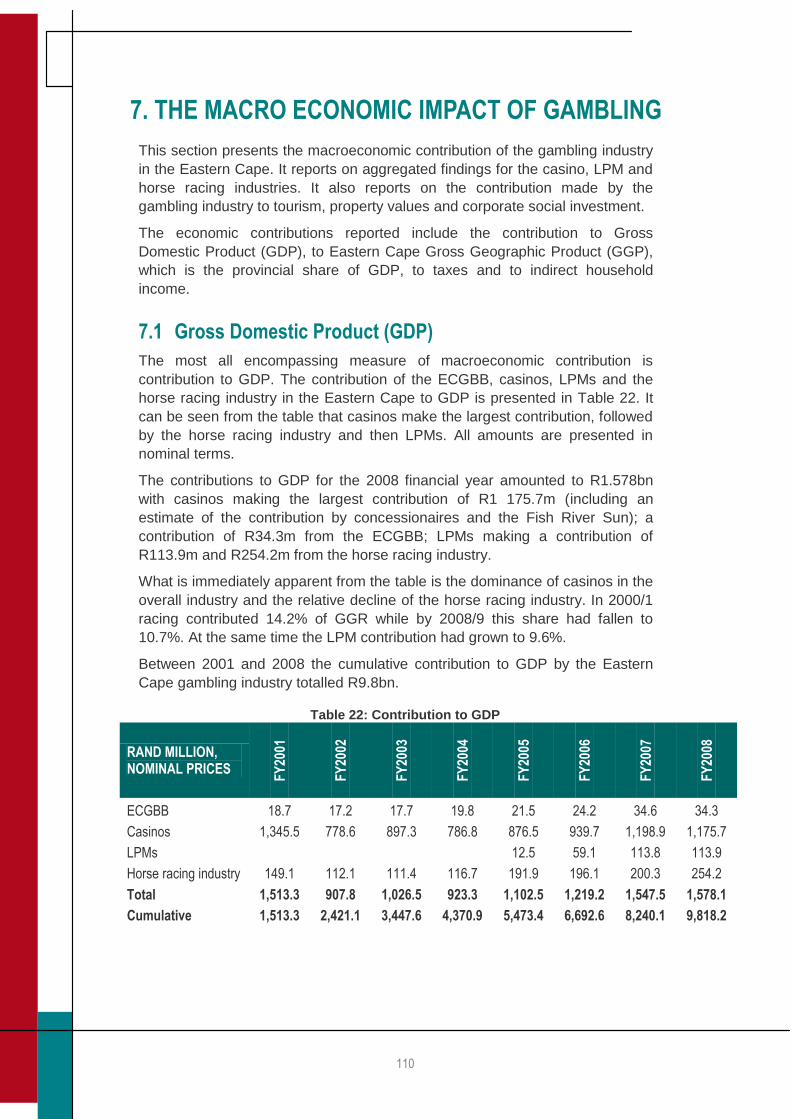
110
7. THE MACRO ECONOMIC IMPACT OF GAMBLING
This section presents the macroeconomic contribution of the gambling industry
in the Eastern Cape. It reports on aggregated findings for the casino, LPM and
horse racing industries. It also reports on the contribution made by the
gambling industry to tourism, property values and corporate social investment.
The economic contributions reported include the contribution to Gross
Domestic Product (GDP), to Eastern Cape Gross Geographic Product (GGP),
which is the provincial share of GDP, to taxes and to indirect household
income.
7.1 Gross Domestic Product (GDP)
The most all encompassing measure of macroeconomic contribution is
contribution to GDP. The contribution of the ECGBB, casinos, LPMs and the
horse racing industry in the Eastern Cape to GDP is presented in Table 22. It
can be seen from the table that casinos make the largest contribution, followed
by the horse racing industry and then LPMs. All amounts are presented in
nominal terms.
The contributions to GDP for the 2008 financial year amounted to R1.578bn
with casinos making the largest contribution of R1 175.7m (including an
estimate of the contribution by concessionaires and the Fish River Sun); a
contribution of R34.3m from the ECGBB; LPMs making a contribution of
R113.9m and R254.2m from the horse racing industry.
What is immediately apparent from the table is the dominance of casinos in the
overall industry and the relative decline of the horse racing industry. In 2000/1
racing contributed 14.2% of GGR while by 2008/9 this share had fallen to
10.7%. At the same time the LPM contribution had grown to 9.6%.
Between 2001 and 2008 the cumulative contribution to GDP by the Eastern
Cape gambling industry totalled R9.8bn.
Table 22: Contribution to GDP
RAND MILLION, NOMINAL PRICES
FY
2001
FY
2002
FY
2003
FY
2004
FY
2005
FY
2006
FY
2007
FY
2008
ECGBB 18.7 17.2 17.7 19.8 21.5 24.2 34.6 34.3
Casinos 1,345.5 778.6 897.3 786.8 876.5 939.7 1,198.9 1,175.7
LPMs 12.5 59.1 113.8 113.9
Horse racing industry 149.1 112.1 111.4 116.7 191.9 196.1 200.3 254.2
Total 1,513.3 907.8 1,026.5 923.3 1,102.5 1,219.2 1,547.5 1,578.1
Cumulative 1,513.3 2,421.1 3,447.6 4,370.9 5,473.4 6,692.6 8,240.1 9,818.2
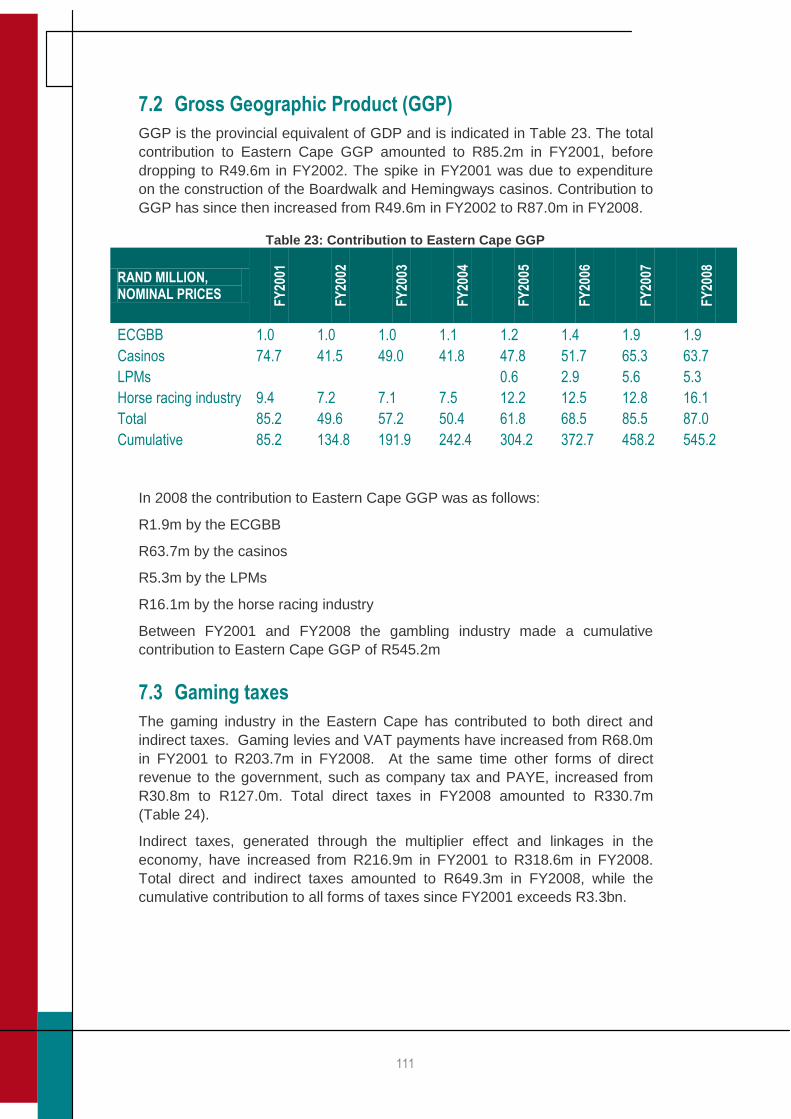
111
7.2 Gross Geographic Product (GGP)
GGP is the provincial equivalent of GDP and is indicated in Table 23. The total
contribution to Eastern Cape GGP amounted to R85.2m in FY2001, before
dropping to R49.6m in FY2002. The spike in FY2001 was due to expenditure
on the construction of the Boardwalk and Hemingways casinos. Contribution to
GGP has since then increased from R49.6m in FY2002 to R87.0m in FY2008.
Table 23: Contribution to Eastern Cape GGP
RAND MILLION, NOMINAL PRICES
FY
2001
FY
2002
FY
2003
FY
2004
FY
2005
FY
2006
FY
2007
FY
2008
ECGBB 1.0 1.0 1.0 1.1 1.2 1.4 1.9 1.9
Casinos 74.7 41.5 49.0 41.8 47.8 51.7 65.3 63.7
LPMs 0.6 2.9 5.6 5.3
Horse racing industry 9.4 7.2 7.1 7.5 12.2 12.5 12.8 16.1
Total 85.2 49.6 57.2 50.4 61.8 68.5 85.5 87.0
Cumulative 85.2 134.8 191.9 242.4 304.2 372.7 458.2 545.2
In 2008 the contribution to Eastern Cape GGP was as follows:
R1.9m by the ECGBB
R63.7m by the casinos
R5.3m by the LPMs
R16.1m by the horse racing industry
Between FY2001 and FY2008 the gambling industry made a cumulative
contribution to Eastern Cape GGP of R545.2m
7.3 Gaming taxes
The gaming industry in the Eastern Cape has contributed to both direct and
indirect taxes. Gaming levies and VAT payments have increased from R68.0m
in FY2001 to R203.7m in FY2008. At the same time other forms of direct
revenue to the government, such as company tax and PAYE, increased from
R30.8m to R127.0m. Total direct taxes in FY2008 amounted to R330.7m
(Table 24).
Indirect taxes, generated through the multiplier effect and linkages in the
economy, have increased from R216.9m in FY2001 to R318.6m in FY2008.
Total direct and indirect taxes amounted to R649.3m in FY2008, while the
cumulative contribution to all forms of taxes since FY2001 exceeds R3.3bn.
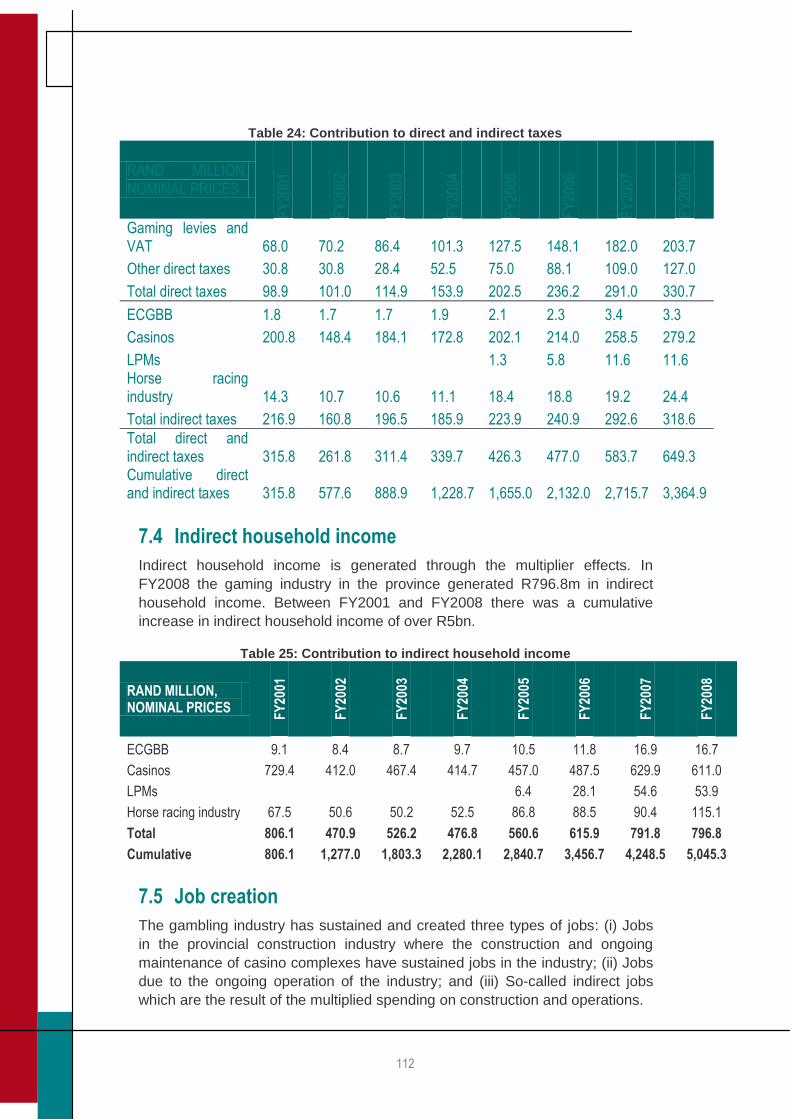
112
Table 24: Contribution to direct and indirect taxes
RAND MILLION, NOMINAL PRICES
FY
2001
FY
2002
FY
2003
FY
2004
FY
2005
FY
2006
FY
2007
FY
2008
Gaming levies and VAT 68.0 70.2 86.4 101.3 127.5 148.1 182.0 203.7
Other direct taxes 30.8 30.8 28.4 52.5 75.0 88.1 109.0 127.0
Total direct taxes 98.9 101.0 114.9 153.9 202.5 236.2 291.0 330.7
ECGBB 1.8 1.7 1.7 1.9 2.1 2.3 3.4 3.3
Casinos 200.8 148.4 184.1 172.8 202.1 214.0 258.5 279.2
LPMs 1.3 5.8 11.6 11.6 Horse racing industry 14.3 10.7 10.6 11.1 18.4 18.8 19.2 24.4
Total indirect taxes 216.9 160.8 196.5 185.9 223.9 240.9 292.6 318.6
Total direct and indirect taxes 315.8 261.8 311.4 339.7 426.3 477.0 583.7 649.3 Cumulative direct and indirect taxes 315.8 577.6 888.9 1,228.7 1,655.0 2,132.0 2,715.7 3,364.9
7.4 Indirect household income
Indirect household income is generated through the multiplier effects. In
FY2008 the gaming industry in the province generated R796.8m in indirect
household income. Between FY2001 and FY2008 there was a cumulative
increase in indirect household income of over R5bn.
Table 25: Contribution to indirect household income
RAND MILLION, NOMINAL PRICES
FY
2001
FY
2002
FY
2003
FY
2004
FY
2005
FY
2006
FY
2007
FY
2008
ECGBB 9.1 8.4 8.7 9.7 10.5 11.8 16.9 16.7
Casinos 729.4 412.0 467.4 414.7 457.0 487.5 629.9 611.0
LPMs 6.4 28.1 54.6 53.9
Horse racing industry 67.5 50.6 50.2 52.5 86.8 88.5 90.4 115.1
Total 806.1 470.9 526.2 476.8 560.6 615.9 791.8 796.8
Cumulative 806.1 1,277.0 1,803.3 2,280.1 2,840.7 3,456.7 4,248.5 5,045.3
7.5 Job creation
The gambling industry has sustained and created three types of jobs: (i) Jobs
in the provincial construction industry where the construction and ongoing
maintenance of casino complexes have sustained jobs in the industry; (ii) Jobs
due to the ongoing operation of the industry; and (iii) So-called indirect jobs
which are the result of the multiplied spending on construction and operations.
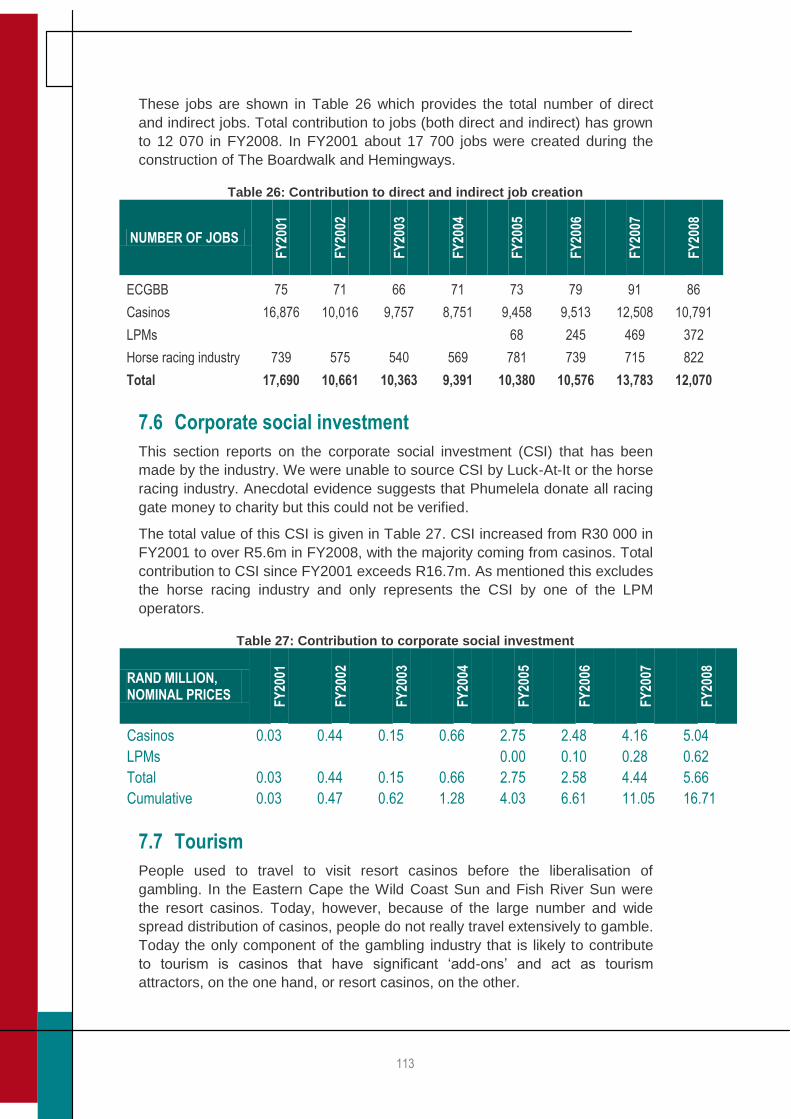
113
These jobs are shown in Table 26 which provides the total number of direct
and indirect jobs. Total contribution to jobs (both direct and indirect) has grown
to 12 070 in FY2008. In FY2001 about 17 700 jobs were created during the
construction of The Boardwalk and Hemingways.
Table 26: Contribution to direct and indirect job creation
NUMBER OF JOBS
FY
2001
FY
2002
FY
2003
FY
2004
FY
2005
FY
2006
FY
2007
FY
2008
ECGBB 75 71 66 71 73 79 91 86
Casinos 16,876 10,016 9,757 8,751 9,458 9,513 12,508 10,791
LPMs 68 245 469 372
Horse racing industry 739 575 540 569 781 739 715 822
Total 17,690 10,661 10,363 9,391 10,380 10,576 13,783 12,070
7.6 Corporate social investment
This section reports on the corporate social investment (CSI) that has been
made by the industry. We were unable to source CSI by Luck-At-It or the horse
racing industry. Anecdotal evidence suggests that Phumelela donate all racing
gate money to charity but this could not be verified.
The total value of this CSI is given in Table 27. CSI increased from R30 000 in
FY2001 to over R5.6m in FY2008, with the majority coming from casinos. Total
contribution to CSI since FY2001 exceeds R16.7m. As mentioned this excludes
the horse racing industry and only represents the CSI by one of the LPM
operators.
Table 27: Contribution to corporate social investment
RAND MILLION, NOMINAL PRICES
FY
2001
FY
2002
FY
2003
FY
2004
FY
2005
FY
2006
FY
2007
FY
2008
Casinos 0.03 0.44 0.15 0.66 2.75 2.48 4.16 5.04
LPMs 0.00 0.10 0.28 0.62
Total 0.03 0.44 0.15 0.66 2.75 2.58 4.44 5.66
Cumulative 0.03 0.47 0.62 1.28 4.03 6.61 11.05 16.71
7.7 Tourism
People used to travel to visit resort casinos before the liberalisation of
gambling. In the Eastern Cape the Wild Coast Sun and Fish River Sun were
the resort casinos. Today, however, because of the large number and wide
spread distribution of casinos, people do not really travel extensively to gamble.
Today the only component of the gambling industry that is likely to contribute
to tourism is casinos that have significant „add-ons‟ and act as tourism
attractors, on the one hand, or resort casinos, on the other.
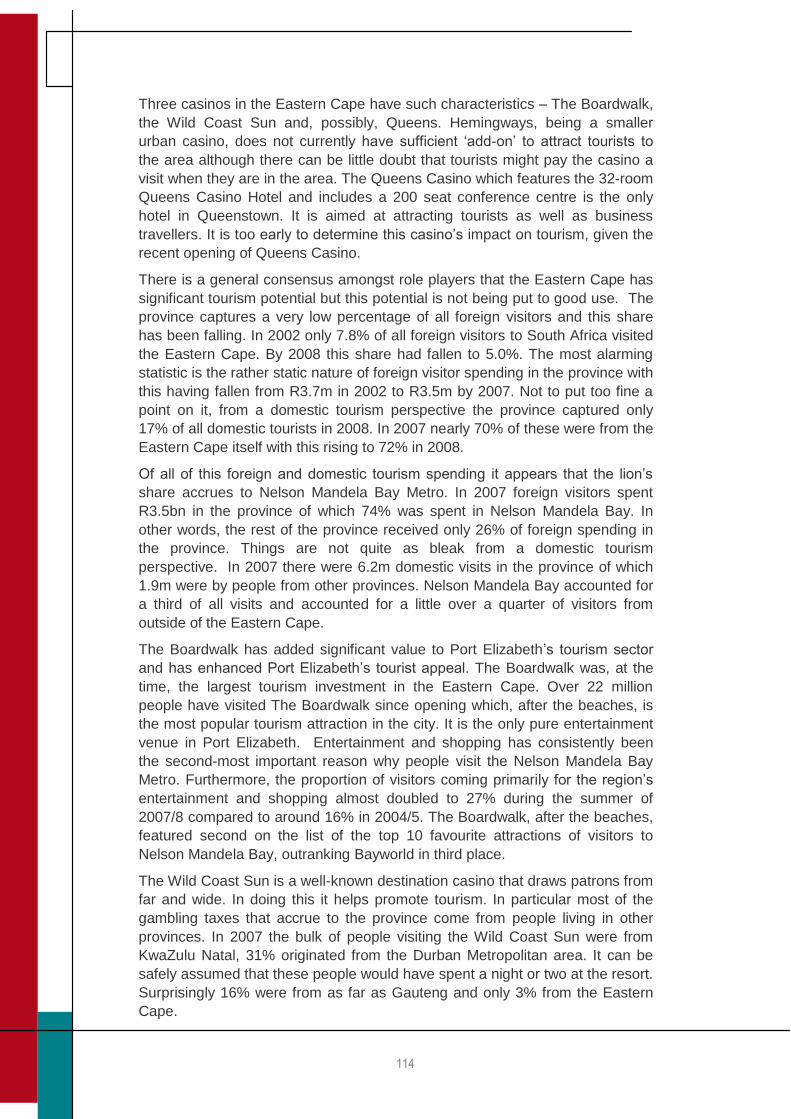
114
Three casinos in the Eastern Cape have such characteristics – The Boardwalk,
the Wild Coast Sun and, possibly, Queens. Hemingways, being a smaller
urban casino, does not currently have sufficient „add-on‟ to attract tourists to
the area although there can be little doubt that tourists might pay the casino a
visit when they are in the area. The Queens Casino which features the 32-room
Queens Casino Hotel and includes a 200 seat conference centre is the only
hotel in Queenstown. It is aimed at attracting tourists as well as business
travellers. It is too early to determine this casino‟s impact on tourism, given the
recent opening of Queens Casino.
There is a general consensus amongst role players that the Eastern Cape has
significant tourism potential but this potential is not being put to good use. The
province captures a very low percentage of all foreign visitors and this share
has been falling. In 2002 only 7.8% of all foreign visitors to South Africa visited
the Eastern Cape. By 2008 this share had fallen to 5.0%. The most alarming
statistic is the rather static nature of foreign visitor spending in the province with
this having fallen from R3.7m in 2002 to R3.5m by 2007. Not to put too fine a
point on it, from a domestic tourism perspective the province captured only
17% of all domestic tourists in 2008. In 2007 nearly 70% of these were from the
Eastern Cape itself with this rising to 72% in 2008.
Of all of this foreign and domestic tourism spending it appears that the lion‟s
share accrues to Nelson Mandela Bay Metro. In 2007 foreign visitors spent
R3.5bn in the province of which 74% was spent in Nelson Mandela Bay. In
other words, the rest of the province received only 26% of foreign spending in
the province. Things are not quite as bleak from a domestic tourism
perspective. In 2007 there were 6.2m domestic visits in the province of which
1.9m were by people from other provinces. Nelson Mandela Bay accounted for
a third of all visits and accounted for a little over a quarter of visitors from
outside of the Eastern Cape.
The Boardwalk has added significant value to Port Elizabeth‟s tourism sector
and has enhanced Port Elizabeth‟s tourist appeal. The Boardwalk was, at the
time, the largest tourism investment in the Eastern Cape. Over 22 million
people have visited The Boardwalk since opening which, after the beaches, is
the most popular tourism attraction in the city. It is the only pure entertainment
venue in Port Elizabeth. Entertainment and shopping has consistently been
the second-most important reason why people visit the Nelson Mandela Bay
Metro. Furthermore, the proportion of visitors coming primarily for the region‟s
entertainment and shopping almost doubled to 27% during the summer of
2007/8 compared to around 16% in 2004/5. The Boardwalk, after the beaches,
featured second on the list of the top 10 favourite attractions of visitors to
Nelson Mandela Bay, outranking Bayworld in third place.
The Wild Coast Sun is a well-known destination casino that draws patrons from
far and wide. In doing this it helps promote tourism. In particular most of the
gambling taxes that accrue to the province come from people living in other
provinces. In 2007 the bulk of people visiting the Wild Coast Sun were from
KwaZulu Natal, 31% originated from the Durban Metropolitan area. It can be
safely assumed that these people would have spent a night or two at the resort.
Surprisingly 16% were from as far as Gauteng and only 3% from the Eastern
Cape.
115
Table 28: Source of Wild Coast Sun GGR in 2007
Source %
South Coast 36
Durban metropolitan region 31
Rest of KwaZulu Natal 3
Total KwaZulu Natal 70
Gauteng 16
Western Cape 3
Eastern Cape 3
Rest of South Africa 5
Unknown 2
7.8 Property values
Changes in property values were not assessed for the facilities that existed
when gambling was liberalised. The analysis of property value changes was
limited to the three new casinos. To quantify the impacts on property values,
estate agents operating in the areas surrounding the three new casinos were
asked whether property values had changed.
The original interviews for The Boardwalk were conducted in 2007. Estate
agents felt that The Boardwalk's impact had been positive and that prices had
increased between 5% and 10% depending on the property's closeness to the
development. Given the approximate number of properties and their average
prices in both Summerstrand and Humewood, The Boardwalk's once-off
property price premium amounts to between R385m and R769m, or an
average of R577m in 2007 values. By applying a property price index
adjustment this is the 2009 equivalent of between R574m and R1.14bn, with an
average of R861m.
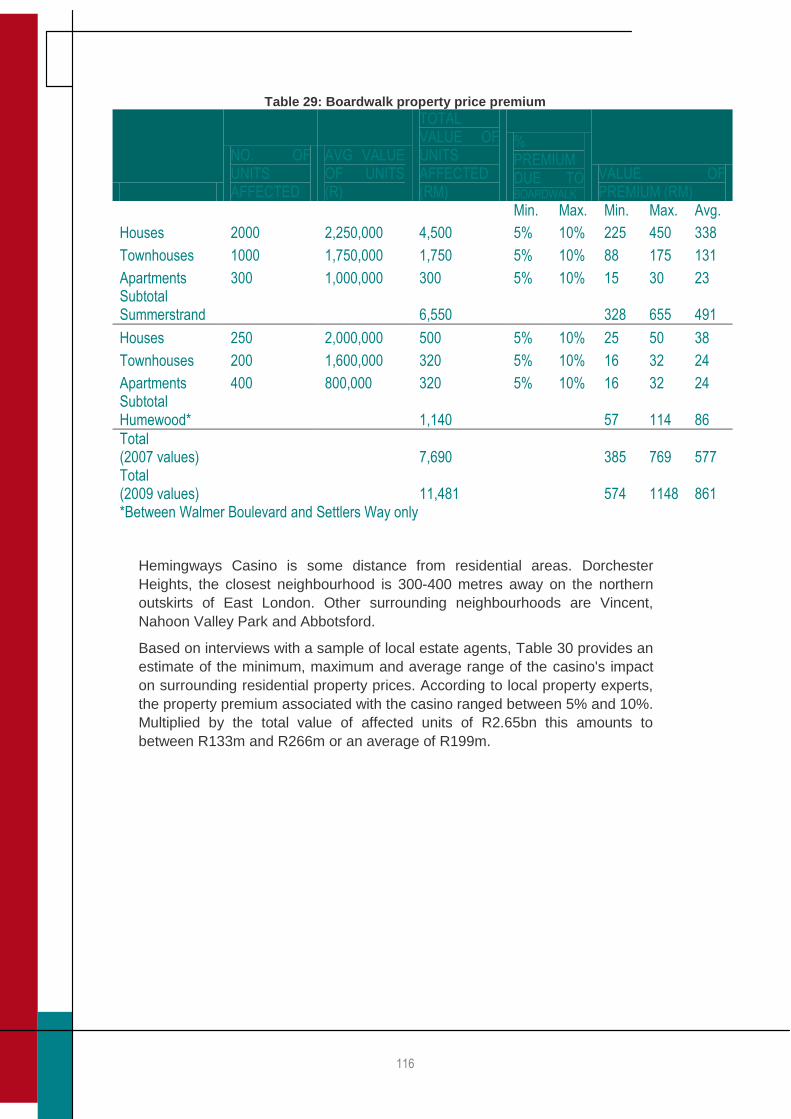
116
Table 29: Boardwalk property price premium
NO. OF UNITS AFFECTED
AVG VALUE OF UNITS (R)
TOTAL VALUE OF UNITS AFFECTED (RM)
% PREMIUM DUE TO BOARDWALK
VALUE OF PREMIUM (RM)
Min. Max. Min. Max. Avg.
Houses 2000 2,250,000 4,500 5% 10% 225 450 338
Townhouses 1000 1,750,000 1,750 5% 10% 88 175 131
Apartments 300 1,000,000 300 5% 10% 15 30 23 Subtotal Summerstrand 6,550 328 655 491
Houses 250 2,000,000 500 5% 10% 25 50 38
Townhouses 200 1,600,000 320 5% 10% 16 32 24
Apartments 400 800,000 320 5% 10% 16 32 24 Subtotal Humewood* 1,140 57 114 86
Total (2007 values) 7,690 385 769 577 Total (2009 values) 11,481 574 1148 861 *Between Walmer Boulevard and Settlers Way only
Hemingways Casino is some distance from residential areas. Dorchester
Heights, the closest neighbourhood is 300-400 metres away on the northern
outskirts of East London. Other surrounding neighbourhoods are Vincent,
Nahoon Valley Park and Abbotsford.
Based on interviews with a sample of local estate agents, Table 30 provides an
estimate of the minimum, maximum and average range of the casino's impact
on surrounding residential property prices. According to local property experts,
the property premium associated with the casino ranged between 5% and 10%.
Multiplied by the total value of affected units of R2.65bn this amounts to
between R133m and R266m or an average of R199m.
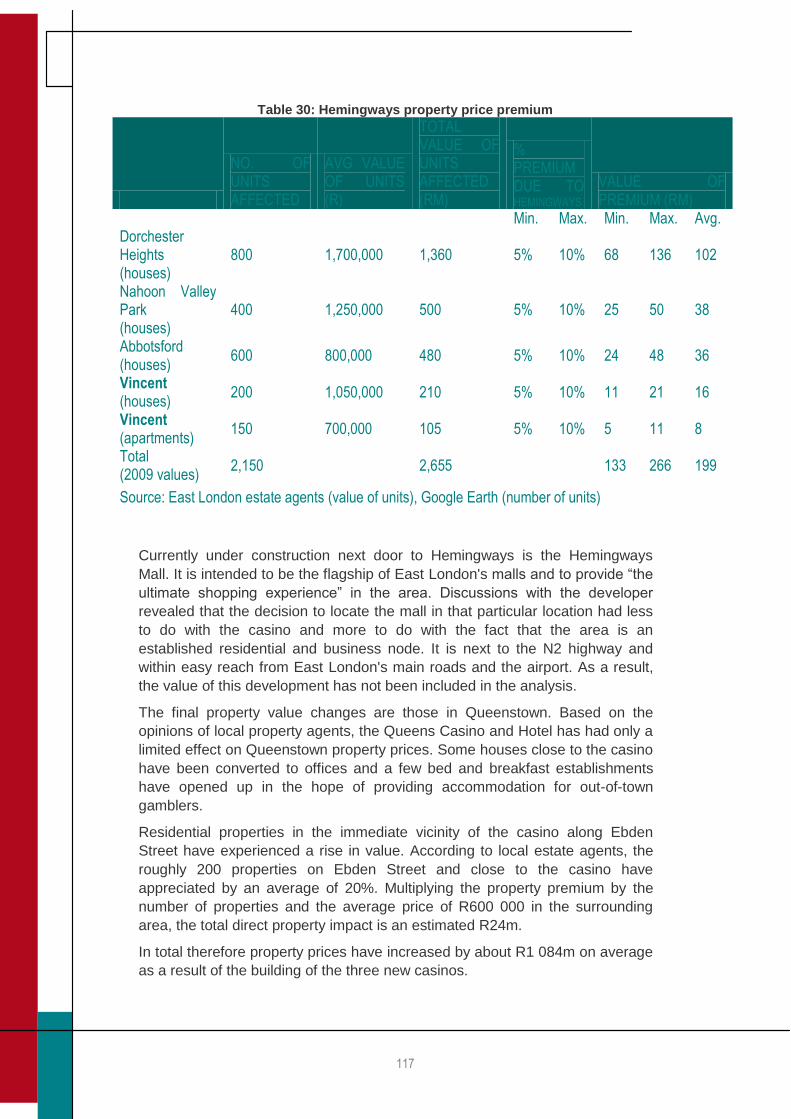
117
Table 30: Hemingways property price premium
NO. OF UNITS AFFECTED
AVG VALUE OF UNITS (R)
TOTAL VALUE OF UNITS AFFECTED (RM)
% PREMIUM DUE TO HEMINGWAYS
VALUE OF PREMIUM (RM)
Min. Max. Min. Max. Avg. Dorchester Heights (houses)
800 1,700,000 1,360 5% 10% 68 136 102
Nahoon Valley Park (houses)
400 1,250,000 500 5% 10% 25 50 38
Abbotsford (houses)
600 800,000 480 5% 10% 24 48 36
Vincent (houses)
200 1,050,000 210 5% 10% 11 21 16
Vincent (apartments)
150 700,000 105 5% 10% 5 11 8
Total (2009 values)
2,150 2,655 133 266 199
Source: East London estate agents (value of units), Google Earth (number of units)
Currently under construction next door to Hemingways is the Hemingways
Mall. It is intended to be the flagship of East London's malls and to provide “the
ultimate shopping experience” in the area. Discussions with the developer
revealed that the decision to locate the mall in that particular location had less
to do with the casino and more to do with the fact that the area is an
established residential and business node. It is next to the N2 highway and
within easy reach from East London's main roads and the airport. As a result,
the value of this development has not been included in the analysis.
The final property value changes are those in Queenstown. Based on the
opinions of local property agents, the Queens Casino and Hotel has had only a
limited effect on Queenstown property prices. Some houses close to the casino
have been converted to offices and a few bed and breakfast establishments
have opened up in the hope of providing accommodation for out-of-town
gamblers.
Residential properties in the immediate vicinity of the casino along Ebden
Street have experienced a rise in value. According to local estate agents, the
roughly 200 properties on Ebden Street and close to the casino have
appreciated by an average of 20%. Multiplying the property premium by the
number of properties and the average price of R600 000 in the surrounding
area, the total direct property impact is an estimated R24m.
In total therefore property prices have increased by about R1 084m on average
as a result of the building of the three new casinos.
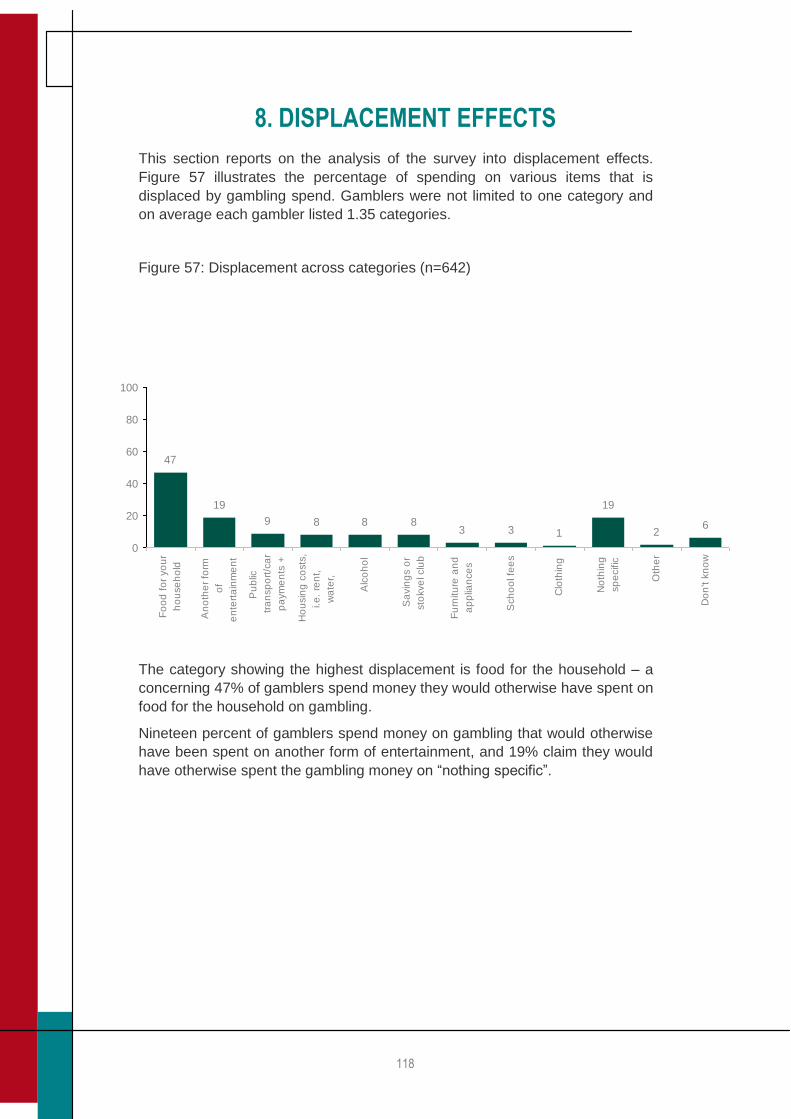
118
8. DISPLACEMENT EFFECTS
This section reports on the analysis of the survey into displacement effects.
Figure 57 illustrates the percentage of spending on various items that is
displaced by gambling spend. Gamblers were not limited to one category and
on average each gambler listed 1.35 categories.
Figure 57: Displacement across categories (n=642)
The category showing the highest displacement is food for the household – a
concerning 47% of gamblers spend money they would otherwise have spent on
food for the household on gambling.
Nineteen percent of gamblers spend money on gambling that would otherwise
have been spent on another form of entertainment, and 19% claim they would
have otherwise spent the gambling money on “nothing specific”.
47
19
9 8 8 83 3 1
19
26
0
20
40
60
80
100
Fo
od
fo
r yo
ur
ho
use
ho
ld
An
oth
er
form
of
en
tert
ain
me
nt
Pu
blic
tra
nsp
ort
/ca
r
pa
ym
en
ts +
Ho
usin
g c
osts
,
i.e
. re
nt,
wa
ter,
Alc
oh
ol
Sa
vin
gs o
r
sto
kve
l clu
b
Fu
rnitu
re a
nd
ap
plia
nce
s
Sch
oo
l fe
es
Clo
thin
g
No
thin
g
sp
ecific
Oth
er
Do
n't k
no
w
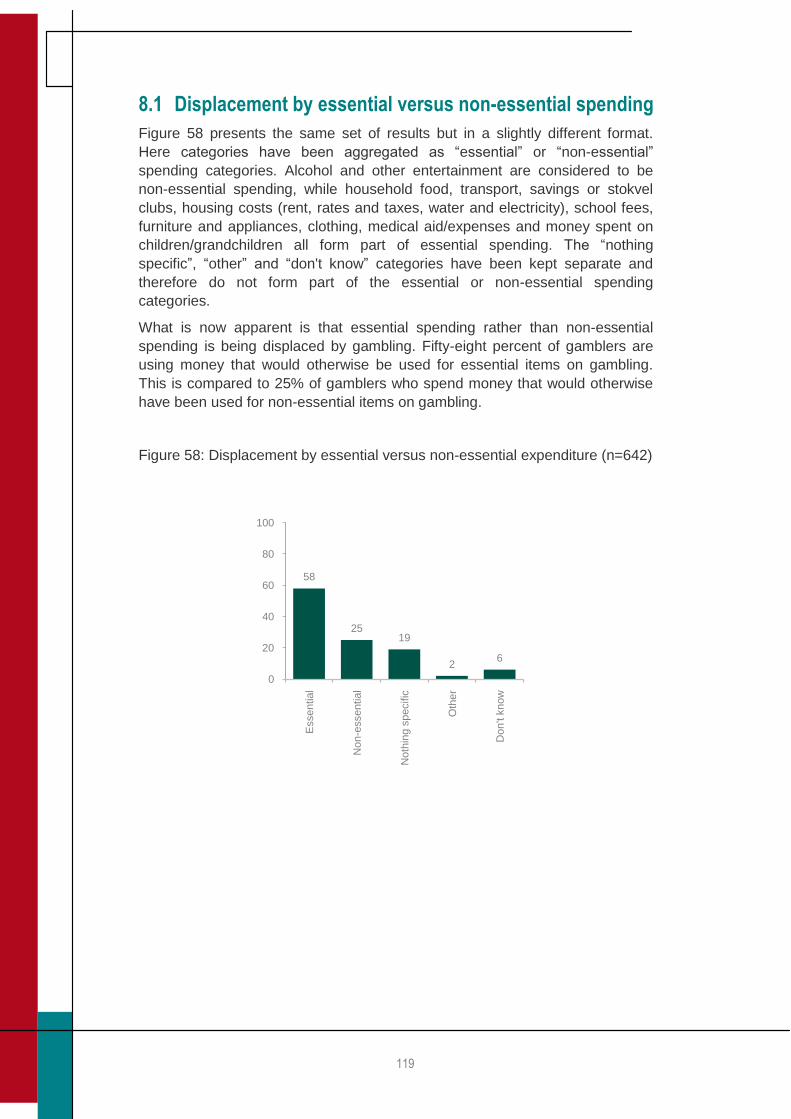
119
8.1 Displacement by essential versus non-essential spending
Figure 58 presents the same set of results but in a slightly different format.
Here categories have been aggregated as “essential” or “non-essential”
spending categories. Alcohol and other entertainment are considered to be
non-essential spending, while household food, transport, savings or stokvel
clubs, housing costs (rent, rates and taxes, water and electricity), school fees,
furniture and appliances, clothing, medical aid/expenses and money spent on
children/grandchildren all form part of essential spending. The “nothing
specific”, “other” and “don't know” categories have been kept separate and
therefore do not form part of the essential or non-essential spending
categories.
What is now apparent is that essential spending rather than non-essential
spending is being displaced by gambling. Fifty-eight percent of gamblers are
using money that would otherwise be used for essential items on gambling.
This is compared to 25% of gamblers who spend money that would otherwise
have been used for non-essential items on gambling.
Figure 58: Displacement by essential versus non-essential expenditure (n=642)
58
2519
26
0
20
40
60
80
100
Essentia
l
Non-e
ssentia
l
Noth
ing s
pecific
Oth
er
Don't k
now
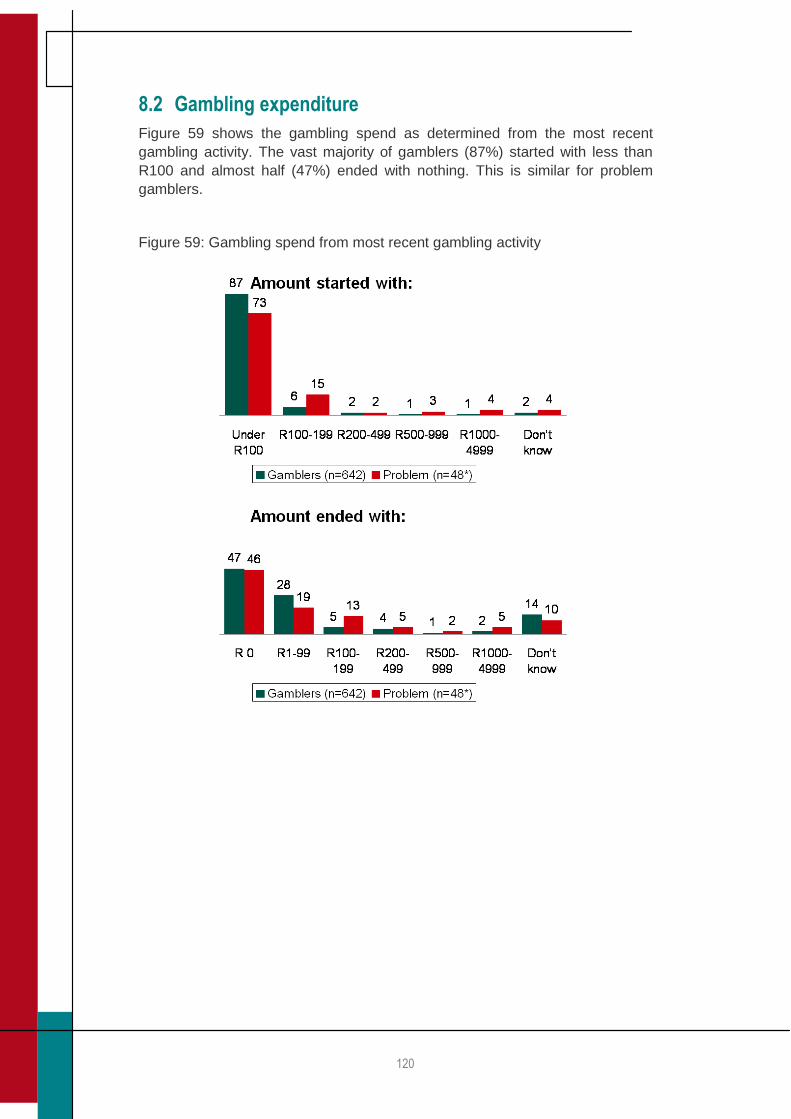
120
8.2 Gambling expenditure
Figure 59 shows the gambling spend as determined from the most recent
gambling activity. The vast majority of gamblers (87%) started with less than
R100 and almost half (47%) ended with nothing. This is similar for problem
gamblers.
Figure 59: Gambling spend from most recent gambling activity
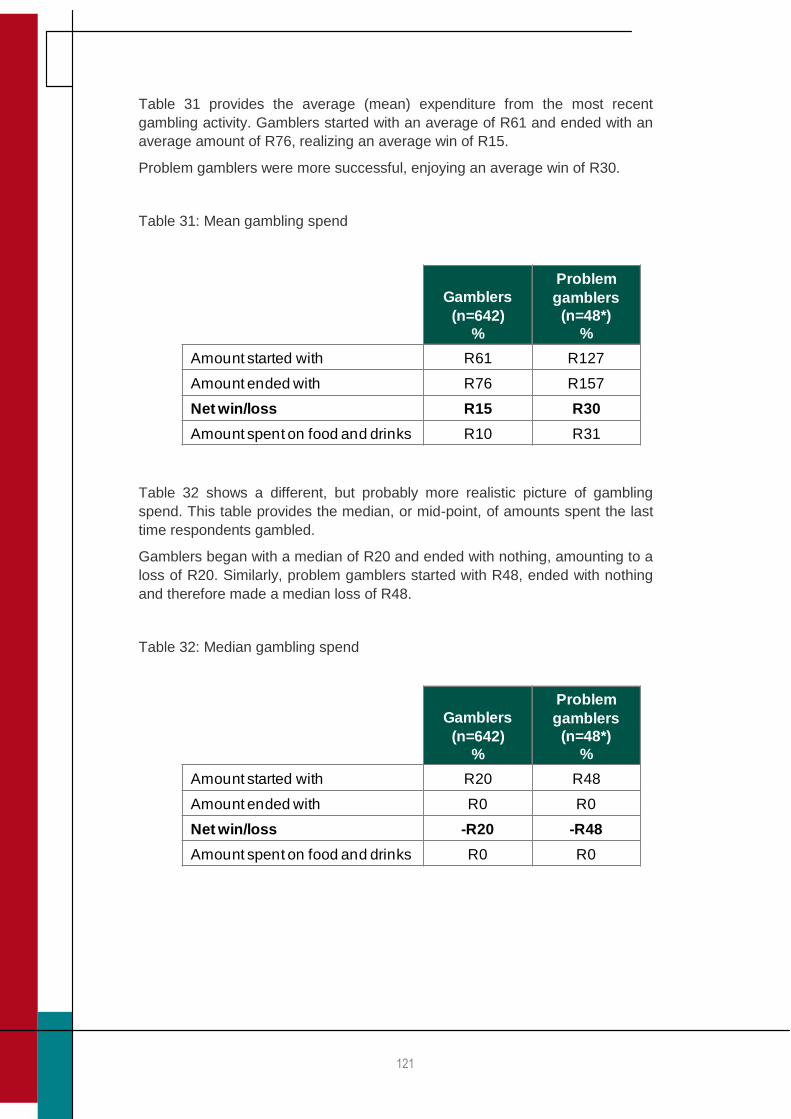
121
Table 31 provides the average (mean) expenditure from the most recent
gambling activity. Gamblers started with an average of R61 and ended with an
average amount of R76, realizing an average win of R15.
Problem gamblers were more successful, enjoying an average win of R30.
Table 31: Mean gambling spend
Table 32 shows a different, but probably more realistic picture of gambling
spend. This table provides the median, or mid-point, of amounts spent the last
time respondents gambled.
Gamblers began with a median of R20 and ended with nothing, amounting to a
loss of R20. Similarly, problem gamblers started with R48, ended with nothing
and therefore made a median loss of R48.
Table 32: Median gambling spend
Gamblers
(n=642)
%
Problem
gamblers
(n=48*)
%
Amount started with R61 R127
Amount ended with R76 R157
Net win/loss R15 R30
Amount spent on food and drinks R10 R31
Gamblers
(n=642)
%
Problem
gamblers
(n=48*)
%
Amount started with R20 R48
Amount ended with R0 R0
Net win/loss -R20 -R48
Amount spent on food and drinks R0 R0
122
SECTION E
Summary
123
9. SUMMARY
9.1 Incidence of gambling
The research has revealed 39% of the adult population (18 years and above) in
the Eastern Cape has taken part in a gambling activity. Most of these people
have taken part in the lottery (33%), scratch cards (14%), informal gambling
(6%), casino gambling (5%) and other formal gambling (4%). The highest
participation in gambling activities is in metropolitan areas (Nelson Mandela
and Amatole districts). The chance of winning big money is the primary
motivator for gambling.
Forty-four percent of Eastern Cape residents have never tried gambling.
Reasons for this include gambling being perceived to be a waste of money, an
activity that lacks appeal or having never considered it. Twelve percent of
those who never tried gambling say gambling is not available in their area
(75% of these people live in rural areas). The greatest desire for more
gambling sites amongst residents is in the OR Tambo and Alfred Nzo
districts.
9.2 Perceptions of gambling
Gambling is generally perceived to be acceptable (69%) by most adults of
the province. However, attitudes vary greatly between gamblers and non-
gamblers, with only 50% of non-gamblers feeling it is acceptable.
Overall gambling is seen to have a socio-economic impact score of 48.6,
where the higher the score, the more positive the perceived impact.
The regulation and control of the gambling industry in the province is
perceived positively. Responsible gambling campaigns and marketing of
ECGBB as the regulator needs to be heightened as 60% of gamblers (and 45%
of problem gamblers) are unaware of any gambling entities or support
programmes. Only 17% of gamblers were familiar with the Eastern Cape
Gambling and Betting Board, however, 44% of gamblers feel the Eastern
Cape gambling sector is well controlled. The research reveals though ECGBB
may not be known by name, its contribution to the gambling industry is
recognized.
9.3 Youth and gambling
In the Eastern Cape 38% of the youth (18-24 year olds) do take part in
gambling activities. They are more likely than older gamblers to participate in
informal gambling, particularly pool betting and card games for money. A
large proportion of youth start gambling regularly as soon as they reach the
legal age. They tend to feel that 18 year olds are responsible enough to
manage their own money and that those still under the age of 18 years should
be allowed to gamble.
124
9.4 Informal gambling
This was framed to reflect participation in illegal gambling activities. The
research reveals that there is six percent informal gambling participation in the
Eastern Cape. There was no informal gambling participation amongst
pathological problem gamblers in the intercepts sample. Ninety-three percent
of pool betters are unaware that this mode is illegal.
On the other hand, a large portion of other informal gamblers are aware their
modes are illegal and yet continue playing (possibly due to lack of regulated
gambling sites in their area). Nearly half (49%) of informal gamblers believe
gambling modes are only illegal if you can get arrested for participating in
them. Forty-four percent feel that many illegal types of gambling should be
made legal.
9.5 Problem gambling
Only 2.8% of the sample could be classified as problem gamblers – way below
the national average of approximately 4%. The incidence of problem gambling
seems to be higher amongst people who live in Port Elizabeth and the Alfred
Nzo district, who are in LSM 4-6, aged 40-49 years and are frequent gamblers.
These people tend to claim that gambling is their first choice of entertainment
and that gambling is very important in their lives.
9.6 Economic impact of gambling
Like throughout the world, casinos dominate the gambling landscape in the
Eastern Cape. Liberalized gambling has had significant economic benefits.
On the whole it is not the poor who gamble at casinos, LPMs or on betting.
The research did indicate that, perhaps, displacement of essential spending
can be a cause for concern.
9.6.1 Job creation
The gambling industry created and sustains three types of jobs. These are:
a) Provincial construction industry where the construction and ongoing
maintenance have sustained jobs in the industry.
b) Those jobs due to the ongoing running of the industry.
c) Those jobs that are the so-called indirect jobs which are the result of the
multiplied spending on construction and operations.
Employment by the gambling industry has sustained over 4 000 in the
province. A total of 4 568 direct jobs were sustained in the financial year of
2008/2009. This is the equivalent of 0.3% of all formal employment in the
Eastern Cape. In the same period, 7 503 indirect jobs were created, with the
majority resulting from the casinos. Total contribution to jobs (both direct and
indirect) totalled 12 070.
125
9.6.2 Corporate social investment
The total value of corporate social investment (CSI) increased from R30 000 in
2001 to over R5.6m in 2008. Most of this comes from casino contributions.
Total contribution to CSI since 2001 exceeded R16.7m.
CSI expenditure by the casino industry covers a wide range of initiatives.
These include community support like HIV/AIDs, supporting orphanages and
youth hostels; supporting local sports clubs and music events. There is poverty
alleviation; support for education; and promotion of arts and culture.
9.6.3 Contribution to tourism
Casino development has stimulated tourism in place like The Boardwalk and
Wild Coast Sun. The Boardwalk has added significant value to Port Elizabeth‟s
tourism sector and has enhanced Port Elizabeth‟s tourist appeal. Over 22
million people have visited The Boardwalk since its opening. It featured
second, after the beaches, on the list of the top 10 favourite attractions of
visitors to Nelson Mandela Bay, outranking Bayworld in third place.
The Wild Coast Sun is a well known destination casino that draws patrons from
far and wide. In particular most of the gambling taxes that accrue to the
Eastern Cape come from people living in other provinces. In 2007 the bulk of
people visiting the Wild Coast Sun were from KwaZulu-Natal, with 31%
originating from the Durban metropolitan area. Surprisingly 16% were from
Gauteng and only 3% from the Eastern Cape.
9.6.4 Property prices
In total, property prices have increased by about R1 084m on average as a
result of the building of the three new casinos.
9.6.5 Contribution to revenue
The gambling industry revenue has increased over the year - in 2000/01 the
total gross gaming revenue (GGR) was a little over R500m with racing
contributing R70.1m. By 2008/9 the GGR had grown to R1.1bn with LPMs
making a R108m contribution and racing a R120m contribution. Similarly
gambling taxes collected grew from R26m in 2001 to R87m in 2008/09.
9.6.6 Macro-economic contribution
In the 2008 financial year the Eastern Cape Gambling and Betting Board
(ECGBB), casinos, LPMs and the horse racing industry contributed R1.578bn
to GDP. Between 2001 and 2008 the cumulative contribution to GDP totalled
R9.7bn. The total contribution to Eastern Cape GGP amounted to R85.2m in in
2001 and R87.0m in 2008. Between 2001 and 2008 the gambling industry
made a cumulative contribution to Eastern Cape GGP of R545.2m.
The gaming industry in the Eastern Cape has contributed to both direct and
indirect taxes. Gaming levies and VAT payments have increased from R68.0m
in 2001 to R203.7m in 2008. At the same time other forms of direct revenue to
126
the government, such as company tax and PAYE, increased from R30.8m to
R127.0m. Total direct taxes in 2008 amounted to R330.7m. Indirect taxes,
generated through the multiplier effect and linkages in the economy, have
increased from R216.9m in 2001 to R318.6m in 2008. Total direct and indirect
taxes amounted to R649.3m in 2008, while the cumulative contribution to all
forms of taxes since 2001 exceeds R3.3bn.