THE SMALL WORLD OF INVESTING: BOARD CONNECTIONS AND MUTUAL ... · BOARD CONNECTIONS AND MUTUAL FUND...
55
NBER WORKING PAPER SERIES THE SMALL WORLD OF INVESTING: BOARD CONNECTIONS AND MUTUAL FUND RETURNS Lauren Cohen Andrea Frazzini Christopher Malloy Working Paper 13121 http://www.nber.org/papers/w13121 NATIONAL BUREAU OF ECONOMIC RESEARCH 1050 Massachusetts Avenue Cambridge, MA 02138 May 2007 We would like to thank Malcolm Baker, Nick Barberis, John Campbell, Judy Chevalier, Jennifer Conrad, Kent Daniel, Will Goetzmann, Steve Kaplan, Owen Lamont, Alexander Ljungqvist, Toby Moskowitz, Fiona Scott Morton, Ludovic Phalippou, Bob Shiller, Jeremy Stein, Mike Weisbach, and seminar participants at the University of Chicago, Yale University, London Business School, Harvard University, University of Illinois, Erasmus Universiteit Rotterdam, 2007 Asset Pricing Mini Conference at Washington University, AQR Capital Management, and Goldman Sachs Asset Management for helpful comments. We also thank BoardEx and Linda Cechova for providing firm board data, and Morningstar and Annette Larson for providing mutual fund data. The views expressed herein are those of the author(s) and do not necessarily reflect the views of the National Bureau of Economic Research. © 2007 by Lauren Cohen, Andrea Frazzini, and Christopher Malloy. All rights reserved. Short sections of text, not to exceed two paragraphs, may be quoted without explicit permission provided that full credit, including © notice, is given to the source.
Transcript of THE SMALL WORLD OF INVESTING: BOARD CONNECTIONS AND MUTUAL ... · BOARD CONNECTIONS AND MUTUAL FUND...

NBER WORKING PAPER SERIES
THE SMALL WORLD OF INVESTING:BOARD CONNECTIONS AND MUTUAL FUND RETURNS
Lauren CohenAndrea Frazzini
Christopher Malloy
Working Paper 13121http://www.nber.org/papers/w13121
NATIONAL BUREAU OF ECONOMIC RESEARCH1050 Massachusetts Avenue
Cambridge, MA 02138May 2007
We would like to thank Malcolm Baker, Nick Barberis, John Campbell, Judy Chevalier, Jennifer Conrad,Kent Daniel, Will Goetzmann, Steve Kaplan, Owen Lamont, Alexander Ljungqvist, Toby Moskowitz,Fiona Scott Morton, Ludovic Phalippou, Bob Shiller, Jeremy Stein, Mike Weisbach, and seminar participantsat the University of Chicago, Yale University, London Business School, Harvard University, Universityof Illinois, Erasmus Universiteit Rotterdam, 2007 Asset Pricing Mini Conference at Washington University,AQR Capital Management, and Goldman Sachs Asset Management for helpful comments. We alsothank BoardEx and Linda Cechova for providing firm board data, and Morningstar and Annette Larsonfor providing mutual fund data. The views expressed herein are those of the author(s) and do not necessarilyreflect the views of the National Bureau of Economic Research.
© 2007 by Lauren Cohen, Andrea Frazzini, and Christopher Malloy. All rights reserved. Short sectionsof text, not to exceed two paragraphs, may be quoted without explicit permission provided that fullcredit, including © notice, is given to the source.

The Small World of Investing: Board Connections and Mutual Fund ReturnsLauren Cohen, Andrea Frazzini, and Christopher MalloyNBER Working Paper No. 13121May 2007JEL No. G10,G11,G14
ABSTRACT
This paper uses social networks to identify information transfer in security markets. We focus on connectionsbetween mutual fund managers and corporate board members via shared education networks. We findthat portfolio managers place larger bets on firms they are connected to through their network, andperform significantly better on these holdings relative to their non-connected holdings. A replicatingportfolio of connected stocks outperforms a replicating portfolio of non-connected stocks by up to8.4% per year. Returns are concentrated around corporate news announcements, consistent with mutualfund managers gaining an informational advantage through the education networks. Our results suggestthat social networks may be an important mechanism for information flow into asset prices.
Lauren CohenYale School of Management135 Prospect StreetNew Haven, CT [email protected]
Andrea FrazziniGraduate School of BusinessUniversity of Chicago5807 South Woodlawn AvenueChicago, IL 60637and [email protected]
Christopher MalloyLondon Business SchoolRegent's ParkLondon NW1 4SAUnited [email protected]

The Small World of Investing — Page 1
Information moves security prices. How information disseminates through
agents in financial markets and into security prices, though, is not as well
understood. We study a particular type of this dissemination in the form of social
networks. Social networks are network structures composed of nodes (usually
people or institutions) that are connected through various social relationships
ranging from casual to close bonds. In the context of information flow, social
networks allow a piece of information to flow, often in predictable paths, along the
network. Thus, one can test the importance of the social network in disseminating
information by testing its predictions on the flow of information. One convenient
aspect of social networks is that they have often been formed ex-ante, sometimes
years in the past, and their formation is then frequently independent of the
information to be transferred. This is the case with the social network we examine.
Specifically, we define social networks as those tied to educational institutions. The
nodes of our social networks are mutual fund portfolio managers and senior officers
of publicly traded companies. We then examine the information flow between these
nodes, and test predictions on the portfolio allocations and returns earned by
mutual fund managers on securities within and outside their networks.
We believe the two agents of our social network (senior officers and portfolio
managers) provide a useful setting because one side likely possesses private
information, while the other side has a large incentive to access this private
information. Similarly, the stock market is a valuable setting in which to examine
private information flow through a social network because of the information’s
eventual revelation into prices, and so easy relation to stock return predictability.
We examine how private information flows from top senior firm officers (and board
members) to fund portfolio managers connected through a network.
Our tests focus on educational institutions providing a basis for social
networks. Specifically, our goal is to use social networks to study information
dissemination in security markets. We use academic institutions attended for both
undergraduate and graduate degrees as our network measure and test the
hypothesis that mutual fund managers are more likely to place larger bets in firms
run by individuals in their network, and earn higher average returns on these

The Small World of Investing — Page 2
investments. We motivate the use of educational institutions as a basis for social
networks in three ways. First, people often select into undergraduate and graduate
programs made up of social groups having aligned interests to their own,
generating both a higher level of interaction and a longer relationship length from
relationships built.1 Second, outside of donations to religious organizations,
educational institutions are the largest beneficiary of individuals’ charitable
donations. Over 1 in 7 dollars donated in 2005 went to educational institutions,
suggesting the presence of ties to academic institutions past graduation.2 Lastly,
there is direct evidence that school relationships are on average more homophilous
than those formed in other settings (Flap and Kalmijn (2001)) and that
communication between parties is more effective when the two parties are more
alike (Bhowmik and Rogers (1971)).
There are a number of potential ways information could be moving through
networks. First, there could be a direct transfer from senior firm officers to
portfolio managers. Second, the networks could simply lower the cost of gathering
information for portfolio managers. So, for instance, it may take fewer calls, or
people may be more forthcoming with information if they are inside the network.
This explanation would be a case where agents have comparative advantages in
collecting certain types of information. Third, it could be that networks may make
it cheaper to access information on managers, and so assess managerial quality (for
similar reasons as above). We are not able to completely rule out any of these
mechanisms, but we do provide evidence of all three working to some extent in the
data.
To test whether information is disseminated through education networks,
we use trading decisions of mutual fund portfolio managers in firms that have
senior officials in their social network (connected firms) and firms that do not
(non-connected firms). Grossman and Stiglitz (1976) offer a simple intuition that
when agents have comparative advantages in collecting certain types of
1 See Richardson (1940), Lazarsfeld and Merton (1954), McPherson et. al (2001), Fischer et al. (1977). 2 Data from The Giving Institute. In 2005, 15% of charitable donations ($38.6 billion) were given to educational institutions. The largest recipient, religious organizations, received 36% ($93.2 billion) (Giving USA (2006)).

The Small World of Investing — Page 3
information, we should observe them earning abnormal returns to this information.
We attempt to identify exactly these situations where portfolio managers are
expected to have a comparative advantage from their respective social networks.
We then examine both their portfolio allocation decisions, and ability to predict
returns, in both the connected and non-connected classes of stocks.
To better understand our approach, consider the following example.3 In
March 1996, Mr. Smith was the sole portfolio manager of the Phantom Aggressive
Fund, a large cap/blend mutual fund with around $2.8 billion under management.
Mr. Smith holds an MBA from Harvard Business School (hereafter HBS), class of
1983. According to the March 1996 SEC filing, between September 30th 1995 and
March 29th 1996, Mr. Smith purchased 233,000 shares of Cummins Engine Co. Inc,
a large engine maker that he did not previously own. At the quarter’s end on
March 29th 1996, Cummins’ shares closed at $40.365 bringing the fund total
position to $9.41 million.
Cummins is an example of a “Harvard Stock”: In 1996, 62% of the board of
directors held a degree from Harvard University and 46% of the board held an
MBA from HBS. Over the year after Mr. Smith established a position, a series of
good events befell Cummins, pushing up its stock price. In May 1996, Cummins
announced a joint venture with the Fiat group to manufacture a new series of
diesel engines. Between March 1996 and June 1996 the Phantom Aggressive Fund
purchased an additional 105,500 shares. Then, in July 1996 the company
announced a joint venture with Dongfeng Motor Corp, China’s largest truck
producer. 1996 turned out to be a record year for Cummins in terms of sales.
Cummins’ good fortunes continued into 1997, as in January 1997 Cummins
announced that its main machinery was selected for a new class of search and
rescue craft designed and manufactured in Italy.
Mr. Smith then unloaded the entire fund’s position in Cummins (338,700
shares valued at $23.9 million) in June 1997. Between March 1996 and June 1997
Cummins’ stock price rose by 72%, beating the S&P500 Index by 36%. Moreover,
3 This is an actual example from our sample, although we have altered the name of both the portfolio manager and the mutual fund.

The Small World of Investing — Page 4
the Phantom Aggressive Fund, in addition to earning a large return, unloaded the
shares at a market peak: After the liquidation of the entire position by the fund,
Cummins’ stock performance was poor. Over the subsequent year, Cummins’ stock
price dropped by 18%, underperforming the S&P500 Index by 52%. A graphical
depiction of the timeline of events is shown in the accompanying Figure 1.
Cummins, however, is not the only Harvard stock in the Phantom
Aggressive Fund’s portfolio. More generally, between 1993 and 2003 Mr. Smith
managed a variety of different funds. Looking at his holdings over time reveals a
tendency to place larger bets in companies run by his HBS classmates. Between
1993 and 2003, Mr. Smith’s average portfolio weight is only 0.55%, while the
average weight on stocks where the company’s CEO, CFO, or Chairman holds a
Harvard MBA and overlapped with the money manager on the Harvard campus is
2.56%, nearly five times larger.
Not only did Mr. Smith make larger bets on his Harvard-run holdings, but
he also received higher average returns on them. Specifically, between 1993 and
2003 Mr. Smith’s “connected” investments in companies where a senior officer was
also an HBS alumni and overlapped with him, outperformed the “non-connected”
portion of his portfolio by 15.1% a year. His “connected” stock picks also
outperformed the S&P500 Index (15% per year) and a passive value weighted
index of Harvard stocks (12.7% per year).
In this paper we show that the above example represents in fact a much
more systematic pattern, in both holdings and returns, across the entire universe of
US mutual fund portfolio managers: fund managers place larger concentrated bets
on companies to which they are connected through an education network, and
perform significantly better on these connected positions than on non-connected
positions.
We create calendar time portfolios that mimic the aggregate portfolio
allocation of the mutual fund sector in connected and non-connected securities and
show that portfolio managers earn higher returns on their connected holdings. A
strategy of buying a mimicking portfolio of connected holdings and selling short a
mimicking portfolio of non-connected holdings yields returns up to 8.36% per year.

The Small World of Investing — Page 5
Furthermore, the portfolio of connected stocks held by portfolio managers
outperforms the portfolio of connected stocks that managers choose not to hold by
6.32% per year. Both the portfolio allocation and return predictability results are
increasing with the strength of the connection.
We test a number of alternative hypotheses. We include firm characteristics,
fund characteristics, and industry, none of which can explain managers’ large bets
on connected stocks or the abnormal returns managers earn on these connected
positions. Another alternative hypothesis is that our findings are driven by the
geographical effects documented in Coval and Moskowitz (2001). So, perhaps
Michigan students tend to locate around Detroit, while Stanford students tend to
locate around Silicon Valley. To test this, we examine fund holdings in local and
distant firms and find no differences in our results, suggesting that geographic
effects are unlikely to explain our findings. We also show that are results are not
driven by a few top schools (ex. Ivy League), or by small fund managers, or by a
certain part of our sample period.
We also examine the returns of connected and non-connected stocks around
news events. If the high return of connected securities is due to information flow
through the network, we would expect to see the bulk of the return premium when
the news is eventually released to the investing public. Consistent with this
hypothesis, we find that nearly the entire difference in return between stocks
within and outside a manager’s network is concentrated around corporate news
announcements.
We then look at changes in a fund’s portfolio manager, and focus on the
specific case where the previous manager and the new manager share no
educational connection. We find that incoming managers unload securities within
the old manager’s network, and at the same time purchase securities within their
own network. Finally, we show that managers who share a common education
network tend to herd with each other in their trading decisions, and do so
significantly more on connected stocks within their portfolios.
The remainder of the paper is organized as follows. Section I provides a brief
background and literature review. Section II describes the data, while Section III

The Small World of Investing — Page 6
explores which schools are most connected to firms and mutual funds. Section IV
details the portfolio allocation results. Section V establishes the main education
network return results. Section VI provides robustness checks and considers
alternative explanations. Section VII examines portfolio weights around mutual
fund manager changes, while Section VIII explores fund manager behavior. Section
IX concludes.
I. Background and literature review
Our work links a large literature on the portfolio choices and investment
performance of mutual fund managers with a growing literature on the role of
social networks in economics.
The strand of the mutual fund literature most closely related to our paper is
the body of work exploring whether mutual fund managers possess stock-picking
ability. The evidence on this question is decidedly mixed. Several papers (Jensen
(1968), Malkiel (1995), Gruber (1996), and Carhart (1997)) find that active
managers fail to outperform passive benchmark portfolios (even before expenses),
while others (Grinblatt and Titman (1989, 1993), Grinblatt, Titman, and Wermers
(1995), Daniel et al. (1997), and Wermers (1997)) find that active managers do
exhibit some stock-picking skills.4 The evidence is similarly mixed as to whether it
is possible to identify particular types of mutual funds (or managers) that perform
consistently better than others.5 Carhart (1997), for example, concludes that most
of the persistent performance (net of fees) in the fund industry is a result of
managers buying stocks which tend to be high-performing momentum stocks
(Jegadeesh and Titman (1993)), with much of the remaining persistence
attributable to the worst-performing funds.
Among the very few papers that have been able to successfully link mutual
4 Note that Berk and Green (2004) argue that failing to beat a benchmark does not imply a manager lacks skill. 5 See Hendricks, Patel, and Zeckhauser (1993), Goetzmann and Ibbottson (1994), Brown and Goetzmann (1994), Gruber (1996), and Elton et al. (1993) for evidence of persistence at various horizons up to 5 years, and Malkiel (1995) and Carhart (1997) for countervailing evidence. See also Cohen, Coval, and Pastor (2005).

The Small World of Investing — Page 7
fund outperformance to measurable characteristics, Chevalier and Ellison (1999)
investigate biographical data on managers and find that fund managers from
undergraduate institutions with higher average SAT scores earn higher returns.
Other evidence from manager-level data indicates that fund managers tend to
overweight nearby companies (Coval and Moskowitz (1999), and earn higher
returns on their local holdings (Coval and Moskowitz (2001)), suggesting a link
between geographic proximity and information transmission.6 We add to this list
by exploring connections between board members and mutual fund managers, and
in doing so identify another channel through which fund managers achieve superior
returns.
Directly exploring the role of social networks, connections, and influence in
financial markets is a relatively new development in the finance literature.7 Closest
to our work are the findings in Hong, Kubik, and Stein (2005), who document
word-of-mouth effects between same-city mutual fund managers with respect to
their portfolio choices, and Kuhnen (2005), who documents a link between past
business connections between mutual fund directors and advisory firms and future
preferential contracting decisions.8 Also related are the findings in Massa and
Simonov (2005), documenting a relation between the portfolio choices of individual
investors and their past educational backgrounds.9
Our empirical strategy is motivated by a network sociology literature (see,
for example, Mizruchi (1982, 1992), Useem (1984)) that employs corporate board
linkages as a measure of personal networks. Board linkages are typically isolated by
looking at direct board interlocks between firms (as in Hallock (1997), "back-door"
links among directors across firms (as in Larcker et al. (2005) and Conyon and
6 Chen et al (2005) and Christofferson and Sarkissian (2002) also explore how location affects mutual funds' behavior. 7 See Jackson (2005) for a survey on the economics of social networks. 8 See also Hong, Kubik, and Stein (2004) for evidence that measures of sociability are linked to increased stock market participation, Hochberg, Ljungqvist, and Lu (2005) for evidence of a positive impact of venture capital networks on investment performance, and Perez-Gonzalez (2006) for evidence of a negative impact of nepotism on firm performance in the context of CEO succession. 9 See also Parkin (2006), who identifies school clustering of lawyers at law firms that cannot be explained by quality or location, and a link between promotion chances in law firms and the concentration of partners with similar educational backgrounds.

The Small World of Investing — Page 8
Muldoon (2006)), or direct and indirect links between board members and
government agencies or officials (as in Faccio (2006) and Fisman et al. (2006),
among others), and have shown to be important mechanisms for the sharing of
information and the adoption of common practices across firms.10 Our approach is
different in that we focus on direct connections between board members and
mutual fund managers via shared educational backgrounds.
II. Data
The data in this study is collected from several sources. Our data on mutual
fund holdings come from the CDA/Spectrum Mutual Funds database, which
includes all registered mutual funds filing with the SEC. The data show holdings of
individual funds collected via fund prospectuses and SEC N30D filings at either
quarterly or semi-annual frequency. We focus the analysis on actively managed US
equity funds by including funds with the investment objectives of aggressive
growth, growth, or growth and income in the CDA dataset. Additionally, we
manually screen all funds and exclude index funds, foreign-based funds, US-based
international funds, fixed income funds, real estate funds, precious metal funds,
balanced funds, closed-end funds, and variable annuities.
We obtain portfolio managers’ biographical information from Morningstar,
Inc. For each mutual fund, Morningstar provides the name(s) of the portfolio
manager(s), a brief vitae including the manager’s starting date as well as previous
funds managed, all the undergraduate and graduate degrees received, the year in
which the degrees were granted, and the institution granting the degree.
Morningstar started collecting the manager’s educational background in 1990.
More details on the data collection process are given in the appendix. We match
Morningstar’s biographical data to the CDA fund holdings using the MFLINKS
data link provided by Wharton Research Data Services. Our final mutual fund
10 Examples of the latter include the adoption of poison pills (Davis (1991)), corporate acquisition activity (Haunschild (1993)), CEO compensation (Khurana (2002)), and the decision to make political contributions (Mizruchi (1992)).

The Small World of Investing — Page 9
sample includes survivorship-bias free data on holdings and biographical
information for 1,648 US actively managed equity funds and 2,501 portfolio
managers between January 1990 and December 2006. This is the base sample of
our tests.
Stock return and accounting data is from CRSP/COMPUSTAT. We focus
the analysis on common stocks only.11 We also collect headlines news from Dow
Jones newswires for all CRSP firms between 1990 and 2006. Details of our news
database are given in the appendix.
Board of directors and senior company officers’ biographical information was
provided by BoardEx of Management Diagnostics Limited, a private research
company specialized in social network data on company officials of US and
European public and private companies. The data contain relational links among
board of directors and other officials for active companies. Additionally, Boardex
provided us with historical files on inactive companies. Links in the dataset are
constructed by cross referencing employment history, educational background and
professional qualifications. A typical entry would be as follows: in the year 2001,
Mr. Smith, CEO of Unicorn Inc., was “connected” to Mr. White, President of ABC
Inc. since between 1992 and 1997 they both served on the board of directors of
XYZ Inc, respectively as CFO and COO. The data contain current and past role of
every company official with start date (year) and end date (year), a board dummy
indicating whether the individual serves (served) on the board of directors in the
current (past) employment position, all the undergraduate and graduate degrees
received, the year in which the degrees were granted, and the institution granting
the degree. Firms are identified by CUSIP number.
For each firm in the sample, we use the historical link files for all
individuals to reconstruct the annual time series of identities and educational
background of board members and senior officers (defined as CEO, CFO or
Chairman). The first entry in our sample is in the year 1939, the last is in 2006.
Given the focus of our analysis, we restrict the sample to US publicly traded firms.
The social networks we examine in the paper are defined over educational
11 CRSP share codes 10 and 11.

The Small World of Investing — Page 10
institutions, and thus we have to link each member of the social network by these
institutions. Thus, we match institutions and degrees on Morningstar and Boardex.
We group the degrees into 6 categories: (i) business school (MBA), (ii) medical
school, (iii) general graduate (MA or MS), (iv) PhD, (v) law school, and (vi)
general undergraduate. More details are given in the appendix.
Finally, we match company officials’ biographical information to stock
return data from CRSP. The final sample includes educational background on
42,269 board members and 14,122 senior officials for 7,660 CRSP stocks between
January 1990 and December 2006.
Table I gives summary statistics for the matched samples of firms-boards-
funds from January 1990 — December 2006. From Panel A, we average around 700
funds per year, which comprise 84% of the mutual fund universe. Our sample of
firms averages roughly 4,500 per year, which comprise 96% of total market value.
The number of academic institutions in our sample averages 354 per year. In Panel
B we report statistics by firm-year or fund-year. The academic institutions in our
sample average 22 senior officers and 6 portfolio managers per institution.
III. Most connected institutions
Our data allow us to quantify how “connected” universities are to both
publicly traded firms and mutual funds. In Table I, Panel A we list the most
connected academic institutions to both firms and mutual funds. Here, a
connection to an academic institution is defined as: (i) for firms, any of the senior
officers (CEO, CFO, and Chairman) having attended the institution and received a
degree, and (ii) for funds, any of the portfolio managers having attended the
institution for a degree. Thus, a given firm (fund) can be connected to multiple
academic institutions. From Panel A, the most connected university to both
publicly traded firms and mutual funds, is Harvard University. Harvard is
connected to 12% of US publicly traded firms. These connections are not merely to
mid-level managers, but to senior officers in the firm. Similarly, Harvard is
connected to 16% of active equity mutual funds. University of Pennsylvania,
University of Chicago, and Columbia University also consistently appear in the top

The Small World of Investing — Page 11
5 most connected schools to both publicly traded firms and mutual funds. It is
worth noting that excluding the top connected academic institutions does not
affect any of the results in the paper12.
The breakdown of the degrees is in Panel B of Table I. Comparing graduate
degrees between senior officers and portfolio managers, portfolio managers are more
likely to have any post-undergraduate degree, with a higher frequency of MBA
degrees. The right side of Panel B in Table I shows the graduation dates of senior
officers and of portfolio managers. There is a large overlap in graduation dates
between the two groups, occurring in the 1960’s and 1970’s. The distribution of
graduation years suggests that portfolio managers may be on average younger than
senior top officers at firms, as the portfolio managers received their degrees later.
The significant overlap in years, however, allows us to exploit variation in the
networks of those attending the same institution during the same (as opposed to
different) years.
IV. Results: Holdings of connected securities
In this section we examine mutual fund managers’ portfolio choices. We
compare allocations in stocks to which they are connected within their education
network, relative to stocks to which they are not. To begin, we need a metric to
define “connected” holdings. We define four types of connections between the
portfolio manager and firm, based on whether the portfolio manager and a senior
official of the firm (CEO, CFO, or Chairman): attended the same school
(CONNECTED1), attended the same school and received the same degree
(CONNECTED2), attended the same school at the same time (CONNECTED3),
and attended the same school at the same time, and received the same degree
(CONNECTED4).13 We attempt to define these in increasing degree of strength of
the link. We view CONNECTED1 and CONNECTED2 as the weakest
connections. For example, individuals that attended the same institutions and/or 12 See the discussion in Section VI and Table IX. 13 We have also used boards of directors to measure connectedness. We define a board as being connected if at least 50% of its members have an education connection to the portfolio manager. We report these results in the appendix.

The Small World of Investing — Page 12
earned the same degree may interact as part of the alumni network. We view
CONNECTED3 and CONNECTED4 as the strongest links, providing the highest
likelihood of direct social interaction with the connected individual while attending
school.
Equity portfolio managers may exhibit preferences for certain securities based
on a number of characteristics. Managers may tend to overweight all securities in
their network, perhaps due to a form of familiarity bias (see Huberman (2001)), or
managers may place large concentrated bets in certain connected securities due to
comparative advantages in collecting information through their network. Our focus
is on the role of the social network in the transfer of information to security prices,
via the trading of actively managed funds. Thus, we look at stocks that managers
actively choose to hold and compare the portfolio weights of those inside and
outside of the managers’ networks. We discuss unconditional overweighting (or the
lack of it) in section VIII.
Table III shows OLS pooled regressions of portfolio weights on connected
dummies and a series of controls. The dependent variable is the fund’s portfolio
weight in a given stock, in basis points. The units of observation are stock-fund-
quarter. All regressions include quarter fixed effects. Controls include %STYLE,
the percentage of the fund’s total net assets invested in the style corresponding to
the stock in question (the stock’s style is calculated as in DGTW (1997)), ME, BM
and R12 defined as percentiles of market value of equity, book to market, and past
12 month return. Columns 1 to 4 of Panel A show the basic result: compared to
the average weight in a given stock, mutual funds place larger bets on connected
securities. Looking at column 1, compared to the average weight of 89.4 basis
points, mutual funds invest an additional 28.45 basis points in securities where the
firm’s senior officials attended the same institution. Moreover, the additional
allocation to connected securities is increasing with the strength of the connection:
fund managers place an additional 41bp in firms where the senior officer and the
portfolio manager overlapped on the school campus (and received the same
degree), roughly 44% higher relative to non-connected stocks. In addition, in other
specifications we use industry, firm, fund, and fund investment objective code fixed

The Small World of Investing — Page 13
effects.14 Although these do explain part of the variation in managers’ portfolio
choices, all the specifications tell a consistent story: portfolio managers place larger
bets in connected securities.
Panel B presents similar tests, although we define the connections slightly
differently. In Panel A, CONNECTED1, for instance, measures the cases where the
portfolio manager attended the same school as a senior officer of the firm. This will
include cases where the senior officer did and did not earn the same degree as the
manager, and cases where they did and did not overlap in their time at the school.
To isolate the effects of each of these components, we create three non-nested
versions of the connection variables. So, in Panel B: CONNECTED1 measures
cases where the portfolio manager and senior officer attended the same school, but
did not earn the same degree and did not overlap in years; CONNECTED2
measures those cases where the portfolio manager and senior officer attended the
same school and earned the same degree, but did not overlap in years;
CONNECTED3 measures those cases where the portfolio manager and senior
officer overlapped at the school, but did not earn the same degree. From Panel B,
all three of these connection proxies result in significantly larger bets on connected
stocks. Column 1 shows that simply attending the same school, even with no
degree or overlap, is associated with portfolio managers significantly placing larger
bets in the connected stocks held. Panel B makes it clear that overlapping of years
at the same institution seems to create the strongest tie to an education network:
an additional weight of 43 bp, or 47%, more than in stocks where the portfolio
manager did not overlap with a senior manager at the same university. Including
controls and other fixed effects (as in Panel A) leads to similar conclusions.15
14 The additional weight is more difficult to interpret with control as now the constant is measured relative to these. In Columns 5-10 we include CONNECTED1 and CONNECTED4 together in each regression. The reason we do not include all connections is that most of our degrees are either an undergraduate or an MBA. This causes CONNECTED1 and 2 to be highly correlated (0.71), as well as CONNECTED3 and 4 (0.70). Thus, we include only one from each pair. 15 Here we are able to include all connection variables together.

The Small World of Investing — Page 14
V. Results: Returns on connected holdings
A. Portfolio Tests
The mere fact that fund managers place large bets in connected stocks need
not imply that these portfolio choices are beneficial. In this section we explore the
performance of fund managers’ connected holdings compared to their non-
connected holdings, and test the hypothesis that managers earn higher returns on
securities within their network.
We use a standard calendar time portfolio approach. At the beginning of each
calendar quarter, we assign stocks in each mutual fund portfolio (based on the
most recent SEC filing) to one of two portfolios: connected or non-connected. We
use same four types of connections defined in section IV. We compute monthly
returns on connected and non-connected holdings between reports, based on the
assumption that funds did not change their holdings between reports. Portfolios
are rebalanced every calendar quarter and within a given fund portfolio, stocks are
weighted by the fund’s dollar holdings (i.e., connected stocks are weighted by the
fund’s dollar holdings in the connected portfolio, and non-connected stocks are
weighted by the fund’s dollar holdings in the non-connected portfolio). Finally, we
compute value weighted calendar time portfolios by averaging across funds,
weighting individual fund portfolios by the fund’s total net asset value at the end
of the previous quarter. This approach has the advantage of corresponding to a
simple investment strategy of investing in connected and non-connected securities
in proportion to the amount held by the universe of funds.
Table IV illustrates our main result. This table includes all available stocks
and all available funds, and focuses on the highest degree of connection
(CONNECTED4). We report average annual portfolio returns minus Treasury bill
returns (in percent) for the period 1990 to 2006. Table IV indicates that connected
holdings earn excess returns of 16.05% annually on average, compared to 7.81% for
all holdings, and 7.69% for non-connected holdings. A long-short portfolio that
holds the connected portfolio and sells short the non-connected portfolio earns on
average 8.36% per year (t-statistic of 3.78). These high average returns on
connected stocks are not accompanied by increased levels of risk. Table IV reveals

The Small World of Investing — Page 15
a Sharpe ratio on connected holdings of 0.80 (compared to 0.42 for all holdings,
and 0.41 for non-connected holdings); the Sharpe ratio on the long-short portfolio
is even higher at 0.92.
In Table V we analyze the risk-adjusted returns of our calendar time
portfolios. We risk-adjust in two ways: first by calculating characteristically
adjusted returns (“DGTW returns”) as in Daniel et al (1997), and second by
computing five-factor alphas. For each stock, we compute DGTW returns by
subtracting the return on a value weighted portfolio of all CRSP firms in the same
size, market-book, and one year momentum quintile, from the stock’s raw return.
The five-factor alpha is the intercept on a regression of monthly portfolio excess
returns on the monthly returns from the three Fama and French (1993) factor-
mimicking portfolios, Carhart’s (1997) momentum factor and Pastor and
Stambaugh’s (2003) liquidity factor. Table V reports average annual returns and
alphas in percent, for all four degrees of connection (not just the strongest
connection as in Table IV).
Table V indicates that connected holdings outperform non-connected holdings
in a statistically and economically significant way for all four degrees of
connectedness, and for both methods of risk-adjustment.16 Connected holdings earn
between 14.76% and 20.08% annually in raw returns. The magnitude of the long-
short portfolio returns is large, and increases as the strength of the connection
increases: the portfolio earns 3.03% for same school connections (CONNECTED1),
3.71% for same school/degree connections (CONNECTED2), 6.85% for same
school/year connections (CONNECTED3), and 8.36% for same school/degree/year
connections (CONNECTED4). The corresponding DGTW returns on the long-
short portfolio range from 1.69% to 5.46% annually, while the 5-factor alphas range
from 2.96% to 8.74% annually, all of which are statistically significant and
economically large. Figure 2 shows annual returns of the calendar time portfolios.
Table V also reports portfolio returns for the portfolio of connected holdings
using the non-nested measures of holdings that do not overlap by year, degree (or
16 For brevity, we do not report results for the equally-weighted calendar time portfolios. These results, which are qualitatively and quantitatively similar to those shown here, are available on request.

The Small World of Investing — Page 16
both), defined as in Table III. These help to identify the different components
driving the return results, and ensure that the returns to each type of connection
are not driven solely by high average returns on the CONNECTED4 portfolio (as
all measures include all stocks identified by this definition). These non-nested
results look similar to those reported using our standard connection measures. The
long-short portfolio of connected minus non-connected generates abnormal returns
between 1.5% and 5%. Returns increase with the strength of the connection.
However, since most managers and senior officers in our sample hold MBA degrees,
requiring a year overlap but no common degree yields very undiversified portfolios;
hence for CONNECTED3 we are unable to reject the null of no return
predictability.
In addition to examining replicating portfolios of the fund’s holdings, we
also compute returns on the connected stocks that managers choose not to hold.
We are interested in testing the hypothesis that managers have an informational
advantage in securities within their network. Since mutual funds are often
restricting from short selling, their active portfolio allocation may not reflect their
full information advantage. Using the same portfolio construction approach as
before, we compute value weighted returns on portfolios of connected securities
that managers choose not to hold. For example the “connected not-held portfolio”
would consist of a value weighted portfolio of all Stanford stocks that a Stanford
manager chooses not to hold in a given quarter. As shown in Table VI, the
portfolio of connected stocks held by portfolio managers outperforms the portfolio
of connected stocks that managers’ choose not to hold by up to 6.32% per year
(t=3.50) for the strongest connection, CONNECTED4.
The results in Table III to Table VI lend support to the hypothesis that
fund managers have comparative advantages in gathering information about
connected firms. Funds earn higher returns on holdings where the portfolio
managers and the firm’s senior management have a higher likelihood of social
interaction. As a result, a long-short equity portfolio that replicates aggregate
funds’ holdings in connected and non-connected securities earns large subsequent
returns.

The Small World of Investing — Page 17
B. Purchases and Sells of Connected Stocks
In Table VII we investigate trading in connected and non-connected stocks.
At the beginning of every calendar quarter stocks purchased within each mutual
fund portfolio are assigned to one of two portfolios (connected and non-connected).
In this table, “purchases” are defined as first-time purchases of a stock (“pickups”)
plus all instances where a fund increases its portfolio weight in a given stock
relative to its prior position; “sells” are defined as all instances where a fund
decreases its portfolio weight in a given stock relative to its prior position, or sells
off its entire remaining position in a stock. Table VII indicates that purchases of
connected stocks outperform purchases of non-connected stocks by 2.69% annually
(t-statistic = 2.27) for CONNECTED1, and a striking 9.04% annually (t-statistic
= 3.65) for CONNECTED4. Similarly, the DGTW-adjusted long-short portfolio for
same CONNECTED4 purchases earns 6.50% per year, while the corresponding 5-
factor alpha is 7.01% annually. Focusing solely on first-time purchases of a stock
(“pickups”) we find similar results (albeit with less power in some cases):
CONNECTED1 pickups outperform non-connected pickups by 4.41% (DGTW) to
5.03% (5-factor alpha) per year.
Panel B reports returns subsequent to net sales of connected and non-
connected stocks. If mutual funds correctly anticipated the arrival of negative
signals we would expect to see low returns on funds’ net sales in connected stocks.
Looking at returns on funds’ net sales reveals a fundamental asymmetry in their
ability to earn high returns on connected firms: a portfolio that is long non-
connected sells and short connected sells actually earns negative abnormal returns.
Furthermore, for most of the specifications in panel B we are unable to reject the
hypothesis of no predictability after a fund unwinds a position in connected
securities.
These results suggest that although portfolio managers earn high returns on
their connected holdings and purchases, the managers are not timing the sells of
these positions well. This combined return pattern for purchases and sells is
consistent with portfolio managers being more likely to receive (and act upon)

The Small World of Investing — Page 18
positive information through the social network. For example, senior firm officers
may be more reluctant to disclose negative information about the firm’s prospects.
Overall, these results indicate that portfolio managers outperform dramatically on
their connected purchases (relative to their non-connected purchases), but actually
underperform on their connected sells (relative to their non-connected sells),
suggesting that fund managers lack timing ability on their connected sells.17
C. Returns around News
In Table VIII we begin to explore the mechanism behind the high returns
earned by portfolio managers on securities within their network. As noted earlier,
one way that social networks may benefit fund managers is by facilitating the flow
of private information. If the returns to connected stocks are driven by information
flow through the network, we would expect to see managers making the bulk of the
return premium when the news that was transferred through the network (and so
caused the manager to purchase the stock) is eventually incorporated into prices.
In order to test this hypothesis, we split the monthly returns for each individual
stock into returns on earnings announcements (defined as returns in calendar
months with scheduled quarterly earnings releases), returns on “other headlines”
(defined as returns in calendar months with at least 1 news announcement on the
Dow Jones Newswires, as described in the appendix, but no scheduled earnings
announcements), and “no news returns” (defined as returns in calendar months
with no news announcements on the Dow Jones newswires and no scheduled
quarterly earnings releases). We then compute monthly news returns and no-news
returns on connected and non-connected holdings.18
In panel B we report the average return of the long-short portfolio that holds
the portfolio of connected stocks and sells short the portfolio of non-connected
stocks, and test the null hypothesis that the difference in returns between the
connected and the non-connected portfolio on news (no-news) is equal to zero. 17 See Daniel et al (1997) for evidence that the universe of mutual fund managers lacks timing ability in general. 18 This decomposition is similar to that in Baker et al. (2005). Focusing on trades (rather than level holdings) prior to earnings announcements, they find that mutual fund managers do seem to exhibit ability in predicting future returns around these earnings announcements.

The Small World of Investing — Page 19
Looking at months with no headlines or earnings announcement, we are unable to
reject the null hypothesis of no difference between the connected and the non-
connected portfolio. Looking at the return on earnings announcements or other
headlines news reveals that the difference in average returns between a portfolio of
connected holdings and one of non-connected holdings is entirely concentrated in
news months: for all four types of connections, the premium of connected holdings
over non-connected is large and significant (ranging from 1.36% to 4.58% annually)
in months with corporate news announcements and it is not statistically different
from zero in months with no headline news.
Panel B also reports similar results for news returns adjusted using a matched
sample. Since the release of information moves security prices, it is possible to
expect most of the difference in returns between any two portfolios to be
concentrated around news release. Thus, the results in panel B may simply reflect
the fact that most price movements occur around public announcements. We
address this issue using a random control sample. At the beginning of every
calendar quarter we sample a random portfolio of 500 stocks from the universe of
mutual fund holdings, and compute monthly returns on news and no news. We
rebalance the portfolio quarterly to maintain value weights. We bootstrap with
replacement 100,000 of such random portfolios. Finally we compute simulation-
adjusted returns as raw returns minus the average return of random portfolios in
the same average return quintile. We then report average (adjusted) return of the
long-short portfolio that holds the portfolio of connected stocks and sells short the
portfolio of non-connected stocks. Hence we are testing the null hypothesis that the
difference in returns between the connected and the non-connected portfolio on
news (no-news) is equal to the difference in returns between two random portfolios
with the same average return. Results are shown in Panel B. Although adjusting
for the average return in news and no news month does reduce the magnitude of
the difference in returns, the premium of connected holdings is large and entirely
concentrated around news releases. In other words, portfolios of stocks that are
located in a fund’s education network display a disproportionate amount of (net)
positive news (defined as high returns in news months) with respect to a portfolio
The Small World of Investing — Page 20
of firms outside the fund’s network or a random portfolio with the same average
return. Taken together, these results are consistent with the hypothesis that social
networks facilitate the flow of private information. The difference in performance
between connected and non-connected stocks is disproportionably concentrated at
times when information is being released to the investing public in the form of
public announcements. In other words, the transfer of information surrounding
news releases seems to be a key determinant of the out-performance of connected
holdings that we document in the paper.
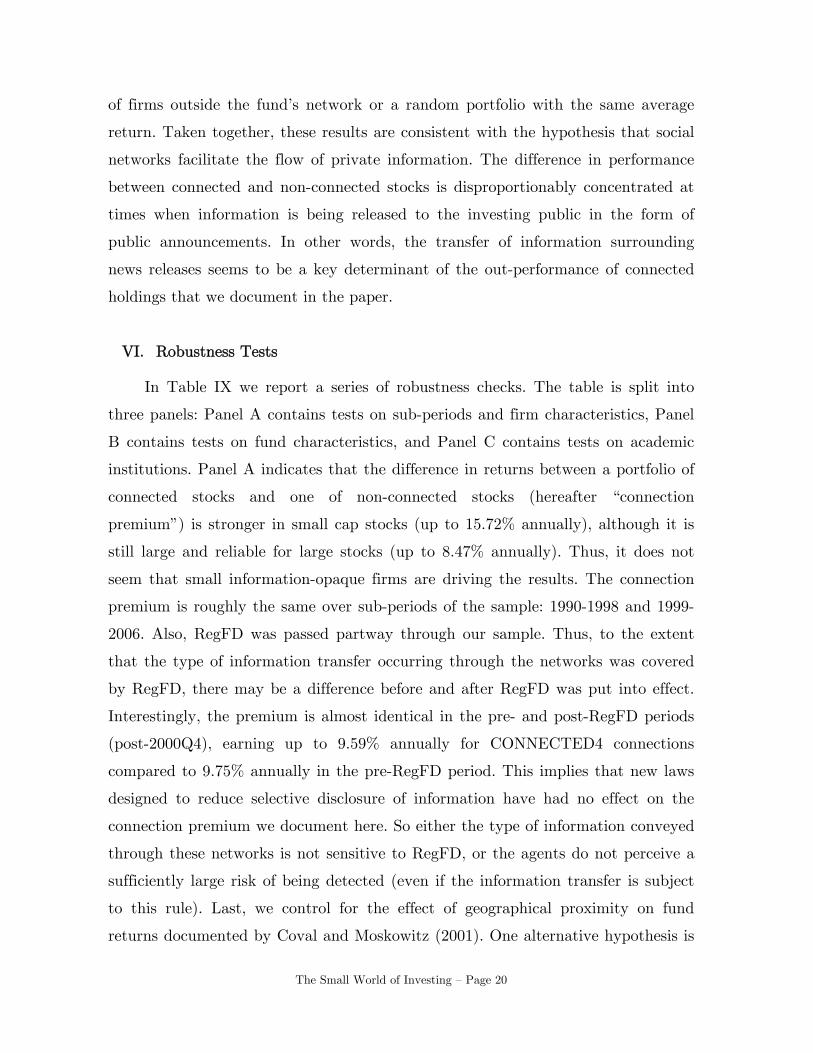
VI. Robustness Tests
In Table IX we report a series of robustness checks. The table is split into
three panels: Panel A contains tests on sub-periods and firm characteristics, Panel
B contains tests on fund characteristics, and Panel C contains tests on academic
institutions. Panel A indicates that the difference in returns between a portfolio of
connected stocks and one of non-connected stocks (hereafter “connection
premium”) is stronger in small cap stocks (up to 15.72% annually), although it is
still large and reliable for large stocks (up to 8.47% annually). Thus, it does not
seem that small information-opaque firms are driving the results. The connection
premium is roughly the same over sub-periods of the sample: 1990-1998 and 1999-
2006. Also, RegFD was passed partway through our sample. Thus, to the extent
that the type of information transfer occurring through the networks was covered
by RegFD, there may be a difference before and after RegFD was put into effect.
Interestingly, the premium is almost identical in the pre- and post-RegFD periods
(post-2000Q4), earning up to 9.59% annually for CONNECTED4 connections
compared to 9.75% annually in the pre-RegFD period. This implies that new laws
designed to reduce selective disclosure of information have had no effect on the
connection premium we document here. So either the type of information conveyed
through these networks is not sensitive to RegFD, or the agents do not perceive a
sufficiently large risk of being detected (even if the information transfer is subject
to this rule). Last, we control for the effect of geographical proximity on fund
returns documented by Coval and Moskowitz (2001). One alternative hypothesis is

The Small World of Investing — Page 21
that individuals tend to be employed close to their last academic institution (e.g.
Yale graduates tend to operate in firms or funds based in CT), thus generating
overlap between academic networks and geographical proximity. To control for
proximity, we extract the headquarter location for firms and mutual funds in our
sample from their SEC filings on the EDGAR system19. We compute “local”
(“distant”) holdings on connected and non-connected stocks, defined as firms
located within (beyond) 100Km from the fund. Table IX shows that the connection
premium is equivalent for both local and distant holdings, suggesting that
geographical proximity is unlikely to be driving our results.
Panel B of Table IX shows that the connection premium is also not driven by
a given fund investment style. It is robust across various fund manager investment
objective codes (ex. Growth compared to Growth and Income), although it is
somewhat stronger among large cap funds, particularly for strong connections
(CONNECTED4). Interestingly, multi-manager funds earn a higher connection
premium than single-manager funds, particularly for strong connections (up to
12.56% annually for CONNECTED4, compared to 6.71% for single-manager
funds). This could possibly be due to the increased number of education networks
these funds have through which to receive information.
Panel C reports tests controlling for different characteristics of the academic
institutions. Our results do not appear to be driven by a few top schools; as we
split the sample into Ivy League and non-Ivy League schools, the connection
premium is roughly equivalent (if anything, it is smaller for Ivy League schools for
the highest degrees of connection). Another possibility is that only schools with
very large education networks (many firms and portfolio managers) are able to
realize returns to the education social network. To test this, we split the sample
into the five most connected schools (from Table II), and the rest of the sample.
The connection premium is almost identical between the two sub-samples,
suggesting that our results are not driven solely by the most connected schools.
19 We use all the 10-K forms (firms) and NSAR forms (mutual funds) on the Edgar system from 1993 to 2006. We match zip codes to their corresponding latitude and longitude and compute the distance between each fund and its holdings using the following
approximation: 2 2distance = [69.1(latitude1-latitude )] + [53(longitude1-longitude2)] .

The Small World of Investing — Page 22
Lastly, we test the hypothesis of a common school effect using a different measure
than Table VI. We create “school-adjusted returns” for each stock, which is the
stock’s return minus a value-weighted portfolio of all stocks that have senior
officers that received at least one degree from the same institution as a senior
officer from the given firm. Similar to the connected not-held results in Table VII,
the school-adjusted return results indicate that even after this adjustment,
portfolio managers’ choices of connected firms significantly outperform those
connected firms the portfolio manager chooses not to hold.
VII. Manager Changes
This section examines changes in a fund’s portfolio manager. We use
manager replacements as a convenient lab to study how changes in the available
network influence a fund’s portfolio allocation. If the effect we find in Sections IV-
VI is indeed driven by school connections, we expect to see incoming managers
replacing stocks in the previous manager’s network with securities within his own
network. We follow a standard event-study methodology. In order to obtain a
clean measure of changes in the available network, we restrict the analysis to funds
managed by a single portfolio manager (not a team) and to manager changes
where the new portfolio manager and the prior portfolio manager did not receive a
degree from the same academic institution (e.g. a Yale manager replaced by a
Stanford manager).
Figure 3 shows changes in portfolio allocation. We measure the changes in
holdings in event time from the date of the manager change. Period -1 represents
the last portfolio snapshot of the old manager and Period +1 represents the first
portfolio snapshot of the new manager. Weight is defined as the percentage holding
of a stock averaged over the last 2 quarters (for event quarter <0) or over the next
2 quarters (for event quarter >0).20 The red line in the figure shows the fund’s
portfolio weights of stocks connected to the old manager (which are by definition
not connected to the new manager). The blue line shows the weights in stocks
connected to the new manager (again by definition not connected to the old
20 We average across consecutive quarters since funds’ holdings are either quarterly or semi-annual.

The Small World of Investing — Page 23
manager). Consistent with school connections having an impact on managers’
portfolio choices, the incoming manager significantly decreases exposure to firms
connected to the previous manager, while at the same time significantly increasing
exposure to firms in her network. Both the new manager’s drop in portfolio weight
in stocks connected to the old manager (-24.73 basis points, t-statistics =-3.17),
and the increase in weight in stocks in her network (59.95 basis points, t-
statistics=5.25) are economically large, given the average weight in our sample of
89 basis points.
Table X presents a more formal analysis using a regression approach. An
alternative explanation of the findings in figure 3 is that a new manager
unconditionally unwinds all positions of the old manager (and replaces them with
new ones). A regression approach allows us to control for this effect as well as
other determinants of portfolio choices at the stock and fund level. We regress
changes in portfolio weights on a series of dummy variables and control variables.
The dependent variable is the average fund portfolio weight in the stock in the
year following manager change, minus the average fund holding in the year before
manager change. The independent variables include a series of dummies and
controls. New Manager’s Stock (New Manager’s Connected Stock) is a categorical
variable equal to 1 for any (connected) stock held in the new manager’s portfolio.
Old Manager’s Stock and Old Manager’s Connected Stock are defined equivalently.
By definition New Manager’s Connected Stock and Old Manager’s Connected
Stock are mutually exclusive sets, while New Manager’s Stock and Old Manager’s
Stock can both be equal to 1 since the new manager and old manager can both
hold the same stock.
The results in Table X indicate that on average, new managers tend to
unwind previous managers’ positions and replace them with fresh ones (coefficients
on New Manager’s Stock and Old Manager’s Stock), but controlling for this effect,
managers show a tendency to immediately place significant larger bets in stocks
within their network.21 Looking at column 1, the coefficient on New Manager’s
21 Jin and Scherbina (2006) find evidence that new managers sell inherited momentum losers. Running these regressions interacting all categorical variables with past returns, and with categorical variables for negative past returns, did not change the magnitude or significance of the

The Small World of Investing — Page 24
Connected Stock implies that the new manager nearly doubles the weight in stocks
within his network (from 55 to 101 basis points), a large and statistically
significant effect. Looking at sales of stocks previously owned by the old manager,
although the decrease in weights is larger for previously-connected stocks, we are
unable to reject the null hypothesis of no difference in behavior between connected
and non-connected securities. Taken together, these results suggest that new
managers unwind previous managers’ positions unconditionally, and immediately
place larger bets in stocks within her networks relative to all newly chosen
positions.
VIII. Fund manager behavior
In this section we further examine the trading behavior of the fund managers
in our sample. As demonstrated in Section IV, fund managers tend to place larger
concentrated bets on companies to which they are connected through their
education network. Specifically, among the stocks they choose to hold, managers
place a greater weight on connected stocks relative to non-connected stocks. A
separate but related question is the extent to which fund managers unconditionally
overweight all connected stocks. Panel A reports the average fraction of fund
holdings invested in connected securities, the average fraction of connected
securities in the market portfolio, and the difference between them. Panel A shows
that fund managers tend to underweight connected stocks relative to their weights
in the market portfolio, for all four connection definitions. This result suggests that
managers do not simply overweight all connected stocks, as a familiarity
explanation might suggest, but instead actively decide which connected stocks to
hold and which not to hold. And for those connected stocks that they do choose to
hold, they place large bets on them and earn large abnormal returns on them,
consistent with comparative advantages in the collection of information through a
network.
Given the large abnormal returns to investing in connected stocks that we
results.

The Small World of Investing — Page 25
document in this paper, a natural follow-up question is: why don’t fund managers
invest even more of their portfolio in connected stocks? To explore this question
we conduct two tests. The first test is to compute the average Sharpe ratios of
individual mutual funds’ connected holdings and overall holdings (unlike the
Sharpe ratios shown in Table 4, which are computed at the aggregate mutual fund
portfolio level). As shown in Panel B, the average Sharpe ratio at the individual
fund level on CONNECTED1 stocks is significantly lower than the average Sharpe
ratio at the fund level for all holdings (.37 compared to .52); we obtain similar
results for the other three connection definitions. This result suggests that for a
given mutual fund, it may not be optimal to invest more in connected stocks given
the fact that this would yield a more undiversified portfolio.
To address this question formally, we conduct a second test to identify the
managers for whom it would have been optimal to invest more in connected stocks
during our sample period. Specifically, for each fund manager, we run a time-series
regression of the fund’s monthly return in connected securities on the fund’s total
return. A significant alpha in this regression indicates that a fund manager could
have chosen some linear combination of the left- and right-hand side portfolios in
order to have increased his in-sample Sharpe ratio. We compute the percentage of
funds for which we are able to reject the null hypothesis that the alpha is equal to
zero, i.e., the percentage of funds that chose a sub-optimal weight in connected
stocks in-sample. Column 3 of Panel B shows that this number ranges from 1.9%
of funds (for CONNECTED4 stocks) to 5.4% of funds (for CONNECTED1 stocks),
indicating that very few funds would have been made better off by investing more
than what they already did in connected stocks during our sample period.
We also investigate the extent to which fund managers who are connected to
each other through shared educational backgrounds tend to herd in their trading
decisions, particularly on connected stocks. We explore this issue by identifying, for
a given portfolio manager j, all fund managers that attended the same academic
institution as manager j ; we then sum up the dollar holdings of this connected
manager portfolio (excluding manager j’s holdings). To test connected manager
herding, we regress the change in the percentage holding of a stock (dw) by a given

The Small World of Investing — Page 26
fund manager j in a given quarter on the change in the connected manager
portfolio (DWMC) for that stock in that quarter. We also interact this connected
manager portfolio with a dummy variable (Z1) equal to one if the stock in question
is a connected stock, to test if fund managers herd with managers to whom they
are connected and specifically on connected stocks. Panel C in Table XI shows that
fund managers’ trades are significantly positively related to the trades of managers
to whom they are connected (i.e., connected managers herd with each other), even
controlling for the overall tendency of managers to herd with each other (captured
by DWALL, the change in the overall mutual fund portfolio for a given stock).
Further, the positive and significant coefficient on the interaction term (DWMC*Z1)
indicates that connected managers herd more with each other especially on
connected stocks.
IX. Conclusions
This paper suggests that social networks are important for information flow
between firms and investors. Specifically, we provide evidence consistent with the
hypothesis that the social network formed through education links allows portfolio
managers to gather information on firms. We find that portfolio managers place
larger concentrated bets on stocks they are connected to through their education
network, and do significantly better on these holdings relative to non-connected
holdings, and relative to connected firms they choose not to hold. A portfolio of
connected stocks held by managers outperforms non-connected stocks by up to
8.4% per year. This connection premium is not driven by firm, fund, school,
industry, or geographic location effects, and is not driven by a subset of the school
connections (ex. Ivy League). Further, we find that the bulk of this premium
occurs around corporate news events such as earnings announcements, lending
support to the hypothesis that the excess return earned on connected stocks is
driven by information flowing through the network.
We believe social networks provide a natural framework to test the flow of
private information into security prices. Information can be followed in a
predictable path along the network. Further, as the information will eventually be
revealed into stock prices, advance knowledge implies return predictability. In this

The Small World of Investing — Page 27
paper we exploit education networks between portfolio managers and firm senior
officers. The advantage of these educations networks is that they are formed on
average decades before the private information being transferred, and are most
often independent of the information being transferred. What we document using
these networks is not an isolated situation or constrained to a few portfolio
managers or firms, but rather a systematic effect across the entire universe of U.S.
firms and portfolio managers. We believe the avenue of future research in social
networks should examine both various forms of social networks and to what extent
different types of information are delivered across different networks.
Understanding these issues could give a better idea of how information flows, and
how investors receive information, in security markets and so allow us to better
predict how and when prices will respond to new information.

The Small World of Investing — Page 28
References
Baker, Malcolm, Lubomir Litov, Jessica A. Wachter, and Jeffrey Wurgler, 2005, Can mutual fund managers pick stocks? Evidence from their trades prior to earnings announcements, Working paper, NYU.
Berk, Jonathan B., and Richard C. Green, 2004, Mutual fund flows and performance in rational markets, Journal of Political Economy 112, 1269-1295.
Brown, Stephen J., and William N. Goetzmann, 1995, Performance persistence, Journal of Finance 50, 679-698.
Carhart, Mark, 1997, On persistence in mutual fund performance, Journal of Finance 52, 57-82.
Chen, Joseph, Harrison Hong, Ming Huang, and Jeffrey D. Kubik, 2004, Does fund size erode mutual fund performance? The role of liquidity and organization, American Economic Review 94, 1276-1302.
Chevalier, Judith, and Glenn Ellison, 1999, Are some mutual fund managers better than others? Cross-sectional patterns in behavior and performance, Journal of Finance 54, 875-899.
Christoffersen, Susan, and Sergei Sarkissian, 2002, Location overconfidence, Working paper, McGill University.
Cohen, Randolph, Joshua Coval, and Lubos Pastor, 2005, Judging managers by the company they keep, Journal of Finance 60, 1057-1098.
Conyon, Martin J., and Mark R. Muldoon, 2006, The small world of corporate boards, Journal of Business Finance and Accounting 33, 1321-1343.
Coval, Joshua, and Tobias Moskowitz, 1999, Home bias at home: Local equity preference in domestic portfolios, Journal of Finance 54, 2045-2074.
Coval, Joshua, and Tobias Moskowitz, 2001, The geography of investment: Informed trading and asset prices, Journal of Political Economy 109, 811-841.
Daniel, Kent, Mark Grinblatt, Sheridan Titman, and Russ Wermers, 1997, Measuring mutual fund performance with characteristic-based benchmarks, Journal of Finance 52, 394-415.
Davis, Gerald F., 1991, Agents without principles? The spread of the poison pill through the inter-corporate network, Administrative Science Quarterly 36, 583-613.
Elton, Edwin J., Martin J. Gruber, Sanjiv Das, and Matt Hlavka, 1993, Efficiency with costly information: A re-interpretation of evidence from managed

The Small World of Investing — Page 29
portfolios, Review of Financial Studies 6, 1-21.
Faccio, Mara, 2006, Politically connected firms, American Economic Review 96, 369-386.
Feld, Scott, 1982, Social structural determinants of similarity among associates, American Sociological Review 47, 797-801.
Fischer, Claude, Robert Jackson Ann Stueve, Kathleen Gerson, Lynne Jones. 1977. Networks and Places. New York: Free Press. Fisman, David, Ray Fisman, Julia Galef, and Rakesh Khurana, 2006, Estimating
the value of connections to Vice-President Cheney, Working paper, Columbia University.
Flap, Henk and Matthijs Kalmijn. 2001 “Assortative meeting and mating: Unintended consequences of organized settings for partner choices.” Social Forces 79(4) 1289-1312.
Giving Institute, The. 2006 Giving USA 2006. Giving USA Foundation. Goetzmann, William N., and Roger G. Ibbotson, 1994, Do winners repeat?
Patterns in mutual fund performance, Journal of Portfolio Management 20, 9-18.
Grinblatt, Mark, and Sheridan Titman, 1989, Mutual fund performance: An analysis of quarterly portfolio holdings, Journal of Business 62, 394-415.
Grinblatt, Mark, and Sheridan Titman, 1993, Performance measurement without benchmarks: An examination of mutual fund returns, Journal of Business 66, 47-68.
Grinblatt, Mark, Sheridan Titman, and Russ Wermers, 1995, Momentum investment strategies,, portfolio performance, and herding: A study of mutual fund behavior, American Economic Review 85, 1088-1105.
Grossman, Sanford and Joseph Stiglitz. 1976 “Information and competitive price systems.” American Economic Review 66-2 246-253.
Gruber, Martin J., 1996, Another puzzle: The growth in actively managed mutual
funds, Journal of Finance 51, 783-810.
Hallock, K. F., 1997, Reciprocally interlocking board of directors and executive compensation, Journal of Financial and Quantitative Analysis 32, 331-344.
Haunschild, Pamela R., 1993, Interorganizational imitation: The impact of interlocks on corporate acquisition activity, Administrative Science Quarterly 38, 564-592.

The Small World of Investing — Page 30
Hendricks, Darryll, Jayendu Patel, and Richard Zeckhauser, 1993, Hot hands in mutual funds: Short-run persistence of performance, 1974-1988, Journal of Finance 48, 93-130.
Hochberg, Yael, Alexander Ljungqvist, and Yang Lu, 2005, Whom you know matters: Venture capital networks and investment performance, Journal of Finance forthcoming.
Hong, Harrison, Jeffrey D. Kubik, and Jeremy C. Stein, 2004, Social interaction and stock market participation, Journal of Finance 59, 137-163.
Hong, Harrison, Jeffrey D. Kubik, and Jeremy C. Stein, 2005, Thy neighbor’s portfolio: Word-of-mouth effects in the holdings and trades of money managers, Journal of Finance 60, 2801-2824.
Huberman, Gur, 2001, Familiarity breeds investment, Review of Financial Studies 14, 659-680.
Jackson, Matthew O., 2005, The economics of social networks, in Richard Blundell, Whitney Newey, and Torsten Persson, (eds.) Proceedings of the 9th World Congress of the Econometric Society, Oxford University Press forthcoming.
Jegadeesh, Narasimhan, and Sheridan Titman, 1993, Returns to buying winners and selling losers: Implications for stock market efficiency, Journal of Finance 48, 65-91.
Jensen, Michael C., 1968, The performance of mutual funds in the period 1945-1964, Journal of Finance 23, 389-416.
Jin, Li, and Anna Scherbina, 2006, Inheriting Losers, Working paper, HBS.
Khurana, Rakesh, 2002, Searching for a corporate savior: The irrational quest for charismatic CEOs, Princeton University Press.
Kuhnen, Camelia M., 2005, Social networks, corporate governance and contracting in the mutual fund industry, Working paper, Stanford University.
Larcker, David F., Scott A. Richardson, Andrew J. Seary, and Irem Tuna, 2005, Back door links between directors and executive compensation, Working paper, University of Pennsylvania.
Lazarsfeld, Paul and Robert Merton. 1954 “Friendship as social process: a substantive and methodological analysis.” Freedom and Control in Modern Society. (eds) Morroe Berger, Theodore Abel, and Charles Page 18-66.
Malkiel, Burton G., 1995, Returns from investing in equity mutual funds 1971-
1991, Journal of Finance 50, 549-572.

The Small World of Investing — Page 31
Massa, Massimo, and Simonov, 2005, History versus geography, working paper, Stockholm School of Economics.
McPherson, M., L. Smith-Lovin and J. Cook. (2001). Birds of a feather: Homophily in Social Networks. Annual Review of Sociology. 27:415-44.
Mizruchi, Mark S., 1982, The American Corporate Network, 1904-1974, Beverly
Hills: Sage Publications.
Mizruchi, Mark S., 1992, The Structure of Corporate Political Action: Inter-firm Relations and Their Consequences, Harvard University Press.
Parkin, Rachel, 2006, Legal careers and school connections, Harvard University working paper.
Perez-Gonzales, Francisco, 2006, Inherited control and firm performance, American Economic Review 96, 1559-1588.
Richardson, Helen. 1940 “Community of values as a factor in friendships of college and adult women.” Journal of Social Psychology 11 303-312.
Useem, Michael, 1984, The Inner Circle, Oxford: Oxford University Press.
Wermers, Russ, 1997, Momentum investment strategies of mutual funds, performance persistence, and survivorship bias, Working paper, University of Colorado.

The Small World of Investing — Page 32
Table I: Summary statistics: mutual funds
This table shows summary statistics as of December of each year for the sample of mutual funds and their common stock holdings between 1990 and 2006. We include in the sample of funds/portfolio managers actively-managed, domestic equity mutual funds from the merged CDA/Spectrum - Morningstar data with a self-declared investment objective of aggressive growth, growth, or growth-and-income and non missing information on the portfolio manager’s identity and educational background. The sample of stocks includes the funds’ holdings in common stocks (CRSP share codes 10 or 11) from the merged CRSP/BOARDEX data with non missing information on the educational background of members of the board of directors and senior officers of the firm (CEO, CFO or Chairman). “Fund turnover in portfolio managers” is the fraction of funds with at least one complete manager(s) replacement during the calendar year.
Panel A: Time series (annual observations, 1990—2006) mean median min max Stdev
Number of funds per year 709 747 331 924 168Number of portfolio managers per year 821 825 397 1,174 197
% of active equity fund universe (% of funds) 0.75 0.74 0.67 0.86 0.06% of active equity fund universe (% of total assets) 0.84 0.85 0.74 0.94 0.05
Fund turnover in portfolio managers (% of funds) 0.14 0.14 0.06 0.32 0.06Fund turnover in portfolio managers (% of total assets) 0.14 0.13 0.05 0.33 0.08
Number of firms per year 4,543 4,462 3,281 5,881 864Number of board members per year 25,027 25,540 12,569 35,754 8,285Number of firm’s senior officers per year 7,207 7,798 3,446 9,698 2,296
% of CRSP common stock universe (% of stocks) 0.76 0.78 0.59 0.89 0.10% of CRSP common stock universe (% of total market value) 0.96 0.97 0.91 0.99 0.03
Number of academic institutions per year 354 359 218 406 49
Panel B: Pooled firm-year or fund-year observation mean median min max Stdev Number of academic institutions per firm 9.8 7.0 1.0 139.0 9.4Number of board members per academic institution 64.9 20.0 1.0 3954.0 173.1Number of firm’s senior officers per academic institution 21.7 7.0 1.0 1159.0 54.9
Number of academic institutions per fund 2.9 2.0 1.0 25.0 2.5Number of portfolio managers per academic institution 6.0 2.0 1.0 130.0 11.2
Number of board members per firm 4.1 3.0 1.0 26.0 3.1

The Small World of Investing — Page 33
Table II: Summary statistics: academic institutions
This table shows summary statistics of the sample of academic institutions between 1990 and 2006. We include in the sample of funds/managers all actively-managed, domestic equity mutual funds from the merged CDA/Spectrum-Morningstar database with a self-declared investment objective of aggressive growth, growth, or growth-and-income and non missing information on the portfolio manager’s identity and the manager’s educational background. The sample of stocks includes the funds’ holdings in common stocks (CRSP share codes 10 or 11) from the merged CRSP/BOARDEX data with non missing information on the educational background of members of the board of directors and senior officers of the firm (defined as CEO, CFO or Chairman). Panel A shows the top 5 most connected academic institutions, ranked by the average number of connected firms (portfolio managers) over the period 1990 to 2006. In this table an institution is defined as connected to a firm (fund) if a senior officer (portfolio manager) holds any degree from that that institution. Panel B shows the distribution of degrees and graduation years over the entire sample.
Panel A: top 5 most connected academic institutions, 1990 — 2006 (all degrees)
Firm’s senior officers Portfolio managers
Academic institution Average # of firms
Average % of CRSP firms
Academic institution Average # of managers
Average % of managers
1 Harvard University 1,014 0.12 Harvard University 147 0.16 2 Stanford University 384 0.05 University of Pennsylvania 98 0.11 3 University of Pennsylvania 325 0.04 Columbia University 90 0.09 4 Columbia University 257 0.03 University of Chicago 92 0.09 5 University of Chicago 201 0.02 New York University 85 0.08
Panel B: distribution of degree and graduation years
Degree Firm’s senior officers
Portfolio managers
Graduation year Firm’s senior officers
Portfolio managers
Business school 0.37 0.58 ≤ 1950 0.01 0.02 Medical school 0.01 0.00 1950 — 1959 0.12 0.05 Graduate (nondescript) 0.18 0.14 1960 — 1969 0.34 0.25 PH.D. 0.06 0.03 1970 — 1979 0.33 0.31 Law School 0.07 0.02 1980 — 1989 0.17 0.32 Undergraduate 0.86 0.91 ≥ 1990 0.02 0.06

The Small World of Investing — Page 34
Table III: OLS regression, portfolio weights in connected vs. non-connected stocks
This table reports pooled OLS quarterly regressions of mutual funds’ portfolio weights in connected and non-connected stocks. The sample period is 1990-2006 and the units of observation are fund-stock-quarter. The dependent variable in the regressions is the fund’s dollar investment in a stock as a percentage of total net assets of the fund ( w ). The independent variables of interest are those measuring the connection of the portfolio manager to the given firm. In Panel A, these are categorical variables for whether a senior officer (CEO, CFO, or Chairman) of the given firm and the given mutual fund manager attended the (i) same school CONNECTED1, (ii) the same school and received the same degree CONNECTED2, (iii) the same school and overlapped in years CONNECTED3, and (iv) the same school, received the same degree, and overlapped in years CONNECTED4. The control variables included where indicated are: %STYLE, the percentage of the fund’s total net assets invested in the style corresponding to the stock being considered (style is calculated as in DGTW (1997)), ME, BM and R12 which are percentiles of market value of equity, book to market, and past 12 month return. Panel B differs from Panel A in that the connections are orthogonalized to one another. So, CONNECTED1 measures the case where the portfolio manager and senior officer attended the same school, but did not receive the same degree nor overlap in years. CONNECTED2 in Panel B measures cases of the same school and same degree, but no overlap in years, while CONNECTED3 measures cases of the same school and year overlap, but not the same degrees. Quarter fixed effects are included in each regression, and industry (Fama-French 48), firm, fund’s investment objective code (IOC), and fund fixed effects are included where indicated. Standard errors are adjusted for clustering at the quarter level and are reported in brackets below the coefficient estimates. 5% statistical significance is indicated in bold.
Panel A: OLS regression Basic connection measure
1 2 3 4 5 6 7 8 9 10
Constant 89.4 90.0 90.4 90.5 89.4 -57.2 -57.9 -32.9 -66.4 -27.4 [0.05] [0.03] [0.01] [0.00] [0.05] [2.85] [2.40] [4.34] [2.46] [2.91]
CONNECTED1 28.45 28.02 10.01 9.76 2.79 10.37 9.02 Same School [1.30] [1.23] [0.58] [0.55] [0.66] [0.58] [0.39]
CONNECTED2 27.03 Same School, same degree [1.59]
CONNECTED3 41.42 Same School, year overlap [3.43]
CONNECTED4 40.00 13.14 10.16 10.61 8.37 10.51 11.97 Same School, same degree, year overlap [4.55] [3.82] [3.35] [3.37] [3.23] [3.29] [2.32]
Controls No No No No No Yes Yes Yes Yes Yes
Fixed effect Quarter Quarter Quarter Quarter Quarter Quarter Quarter Quarter Quarter Quarter
Fixed effect Industry Firm IOC Fund
R2 0.01 0.01 0.01 0.01 0.01 0.17 0.18 0.22 0.17 0.49

The Small World of Investing — Page 35
Table III (continued): OLS regression, portfolio weights in connected vs. non-connected stocks
Panel B: OLS regression orthogonal connection measure
1 2 3 4 5 6 7 8 9
Constant 90.0 90.0 90.5 89.4 -57.2 -57.9 -32.8 -66.4 -27.5 [0.02] [0.02] [0.00] [0.04] [2.85] [2.40] [4.34] [2.46] [2.91]
CONNECTED1 27.6 28.2 11.74 11.09 3.58 12.23 7.92 Same School only [1.32] [1.32] [0.65] [0.65] [0.80] [0.65] [0.55]
CONNECTED2 26.0 26.1 7.20 7.26 1.01 7.37 9.55 Same School, same degree, no overlap [1.45] [1.43] [0.90] [0.86] [0.79] [0.91] [0.60]
CONNECTED3 42.6 38.6 20.1 20.9 12.8 20.96 9.04 Same School, year overlap, not same degree [3.13] [3.03] [2.66] [2.62] [2.38] [2.58] [1.92]
Controls No No No No Yes Yes Yes Yes Yes
Fixed effect Quarter Quarter Quarter Quarter Quarter Quarter Quarter Quarter Quarter
Fixed effect Industry Firm IOC Fund
R2 0.01 0.01 0.01 0.01 0.17 0.18 0.22 0.17 0.49

The Small World of Investing — Page 36
Table IV: Returns on connected holdings, 1990 — 2006 This table shows calendar time portfolio excess returns. At the beginning of every calendar quarter stocks in each mutual fund portfolio (based on the most recent SEC filing) are assigned to one of two portfolios (connected and non-connected). In this table, connected companies are defined as firms where at least a senior official (CEO, CFO or Chairman) received the same degree from the same institution as the fund’s portfolio manager, and overlapped with the portfolio manager during the pursuit of the degree. We compute monthly returns on connected and non-connected holdings between reports based on the assumption that funds did not change their holding between reports. Portfolios are rebalanced every calendar quarter and within a given fund portfolio, stocks are weighted by the fund’s dollar holdings. Finally, we compute value weighted calendar time portfolios by averaging across funds, weighting individual fund portfolios by the fund’s total net asset value at the end of the previous quarter. This table includes all available stocks and all available funds. We report average portfolio returns minus Treasury bill returns in the period 1990 to 2006. Returns are in annual percent, t-statistics are shown below the coefficient estimates. L/S is the annual average return of a zero cost portfolio that holds the portfolio of connected stocks and sells short the portfolio of non-connected stocks. t-statistics are shown below the coefficient estimates, and 5% statistical significance is indicated in bold. Annual value-weighted excess returns
All holdings Connected holdings
Non-connected L/S
Mean 7.81 16.05 7.69 8.36 t-statistic (1.73) (3.28) (1.71) (3.78) Std deviation 18.59 20.17 18.54 9.12 Skewness -0.96 -1.54 -0.96 -0.42 Kurtosis -0.30 0.31 -0.32 -0.19
Sharpe ratio 0.42 0.80 0.41 0.92

The Small World of Investing — Page 37
Table V: Connected holdings, abnormal returns 1990 — 2006
This table shows calendar time portfolio returns. At the beginning of every calendar quarter stocks in each mutual fund portfolio (based on the most recent SEC filing) are assigned to one of two portfolios (connected and non-connected). In this table, connected companies are defined as firms where at least a senior official (CEO, CFO or Chairman) received any degree from the same institution as the fund’s portfolio manager (CONNECTED1), received the same degree from the same institution as the fund’s portfolio manager (CONNECTED2), received any degree from the same institution as the fund’s portfolio manager and overlapped with the portfolio manager during the pursuit of the degree (CONNECTED3) or received the same degree from the same institution as the fund’s portfolio manager, and overlapped with the portfolio manager during the pursuit of the degree (CONNECTED4). In columns 8-10 the connections are orthogonalized to one another. So, CONNECTED1 measures the case where the portfolio manager and senior officer attended the same school, but did not receive the same degree nor overlap in years. CONNECTED2 measures cases of the same school and same degree, but no overlap in years, while CONNECTED3 measures cases of the same school and year overlap, but not the same degrees. We compute monthly returns on connected and non-connected holdings between reports based on the assumption that funds did not change their holding between reports. Portfolios are rebalanced every calendar quarter and within a given fund portfolio, stocks are value weighted by the fund’s dollar holdings. Finally, we compute value weighted calendar time portfolios by averaging across funds, weighting individual fund portfolios by the fund’s total net asset value at the end of the previous quarter. This table includes all available stocks and all available funds. We report average returns, DGTW-adjusted returns and 5-factor alphas in the period 1990 to 2006. DGTW characteristic-adjusted returns are defined as raw returns minus the returns on a value weighted portfolio of all CRSP firms in the same size, market-book, and one year momentum quintile. Alpha is the intercept on a regression of monthly portfolio excess returns. The explanatory variables are the monthly returns from Fama and French (1993) mimicking portfolios, Carhart (1997) momentum factor and Pastor and Stambaugh (2003) liquidity factor. Returns and alphas are in annual percent. L/S is annual average return of a zero cost portfolio that holds the portfolio of connected stocks and sells short the portfolio of non-connected stocks. t-statistics are shown below the coefficient estimates, and 5% statistical significance is indicated in bold.
Value weighted annual returns Raw return DGTW-adjusted return 5-factor alpha Orthogonal connection measure
All holdings 11.85
0.41 0.08
Raw return
DGTW 5-factor
(2.62) (0.89) (0.14)
Not connected 11.73 0.37 -0.04 (2.60) (0.85) (-0.06)
Connected holdings L/S
Connected holdings L/S
Connected holdings L/S
L/S L/S L/S
CONNECTED1 14.76 3.03 2.06 1.69 2.92 2.96 2.50 1.55 2.35 Same School (3.00) (2.74) (2.63) (2.62) (3.16) (3.40) (2.29) (2.17) (2.33)
CONNECTED2 15.44 3.71 2.29 1.91 3.25 3.28 3.46 1.81 3.04 Same School, same degree (3.13) (3.25) (2.52) (2.58) (3.17) (3.21) (3.06) (2.39) (2.99)
CONNECTED3 18.58 6.85 4.78 4.41 6.50 6.54 5.03 4.06 5.05 Same School, year overlap (3.66) (4.62) (3.63) (4.25) (3.76) (3.80) (1.52) (0.52) (1.82)
CONNECTED4 20.08 8.36 5.83 5.46 8.70 8.74 Same School, same degree, year overlap (4.02) (3.78) (3.24) (3.30) (3.80) (3.80)

The Small World of Investing — Page 38
Table VI: Connected holdings not held, abnormal returns 1990 — 2006
This table shows calendar time portfolio returns. At the beginning of every calendar quarter stocks in each mutual fund portfolio (based on the most recent SEC filing) are assigned to one of two portfolios (connected and non-connected). In this table, connected companies are defined as firms where at least a senior official (CEO, CFO or Chairman) received any degree from the same institution as the fund’s portfolio manager (CONNECTED1), received the same degree from the same institution as the fund’s portfolio manager (CONNECTED2), received any degree from the same institution as the fund’s portfolio manager and overlapped with the portfolio manager during the pursuit of the degree (CONNECTED3) or received the same degree from the same institution as the fund’s portfolio manager, and overlapped with the portfolio manager during the pursuit of the degree (CONNECTED4). We compute monthly returns on connected and non-connected holdings between reports based on the assumption that funds did not change their holding between reports. Portfolios are rebalanced every calendar quarter and within a given fund portfolio, stocks are value weighted by the fund’s dollar holdings. Finally, we compute value weighted calendar time portfolios by averaging across funds, weighting individual fund portfolios by the fund’s total net asset value at the end of the previous quarter. Similarly, we compute value weighted portfolios of connected stocks not held by the mutual fund managers. This table includes all available stocks and all available funds. Column 2 reports the average number of connected CRSP stocks (“all CRSP connected”), columns 3 and 4 report the equally weighted (EW) or value weighted (VW) fraction of connected stocks held by the aggregate mutual fund sector. In columns 5 -10 we report average returns, and DGTW-adjusted returns. DGTW characteristic-adjusted returns are defined as raw returns minus the returns on a value weighted portfolio of all CRSP firms in the same size, market-book, and one year momentum quintile. Returns and alphas are in annual percent. L/S is annual average return of a zero cost portfolio that holds the portfolio of connected stocks held by the funds and sells short the portfolio of connected stocks not held by the funds. t-statistics are shown below the coefficient estimates, and 5% statistical significance is indicated in bold.
Connected universe Return DGTW-adjusted return
All CRSP connected
% held EW
% held VW
Connected not held
Connected held
L/S Connected not held
Connected held
L/S
CONNECTED1 2,381 0.35 0.80 13.06 14.76 1.70 0.71 2.06 1.35 Same School (2.94) (3.00) (1.46) (1.67) (2.63) (2.15)
CONNECTED2 2,258 0.23 0.65 13.16 15.44 2.28 0.77 2.29 1.51 Same School, same degree (2.95) (3.13) (2.13) (1.75) (2.52) (2.22)
CONNECTED3 1,592 0.09 0.42 13.50 18.58 5.08 0.45 4.78 4.33 Same School, year overlap (2.96) (3.66) (3.76) (1.10) (3.63) (3.51)
CONNECTED4 1,308 0.06 0.31 13.76 20.08 6.32 0.78 5.83 5.05 Same School, same degree, year overlap (2.96) (4.02) (3.50) (0.34) (3.24) (2.89)

The Small World of Investing — Page 39
Table VII: Connected holdings, purchases and sells, abnormal returns 1990 — 2006
This table shows calendar time portfolio excess returns. At the beginning of every calendar quarter stocks purchased within each mutual fund portfolio (based on a comparison of the most recent SEC filing with the prior filing) are assigned to one of two portfolios (connected and non-connected). In this table, “purchases” are defined as first-time purchases of a stock (“pickups”) plus all instances where a fund increases its portfolio weight in a given stock relative to its prior position; “sells” are defined as all instances where a fund decreases its portfolio weight in a given stock relative to its prior position, or sells off its entire remaining position in a stock. Connected companies are defined as firms where at least a senior official (CEO, CFO or Chairman) received any degree from the same institution as the fund’s portfolio manager (CONNECTED1), received the same degree from the same institution as the fund’s portfolio manager (CONNECTED2), received any degree from the same institution as the fund’s portfolio manager and overlapped with the portfolio manager during the pursuit of the degree (CONNECTED3) or received the same degree from the same institution as the fund’s portfolio manager, and overlapped with the portfolio manager during the pursuit of the degree (CONNECTED4). We compute monthly returns on connected and non-connected holdings between reports based on the assumption that funds did not change their holding between reports. Portfolios are rebalanced every calendar quarter and within a given fund portfolio, stocks are value weighted by the fund’s dollar holdings. Finally, we compute value weighted calendar time portfolios by averaging across funds. Value weighted portfolios are computed by weighting individual fund value weighted portfolios by the fund’s total net asset value at the end of the previous quarter. This table includes all available stocks and all available funds. We report average returns, DGTW-adjusted returns and 5-factor alphas in the period 1990 to 2006. DGTW characteristic-adjusted returns are defined as raw returns minus the returns on a value weighted portfolio of all CRSP firms in the same size, market-book, and one year momentum quintile. Alpha is the intercept on a regression of monthly portfolio excess returns. The explanatory variables are the monthly returns from Fama and French (1993) mimicking portfolios, Carhart (1997) momentum factor and Pastor and Stambaugh (2003) liquidity factor. Returns and alphas are in annual percent, t-statistics are shown below the coefficient estimates. In Panel A, “L/S” is the annual average return of a zero cost portfolio that buys a portfolio of connected purchases and sells short a portfolio of non-connected purchases; “L/S (Pickups)” restricts the definition of purchases to only first-time purchases (“pickups) of a stock, and equals the annual average return of a zero cost portfolio that buys a portfolio of connected pickups and sells short a portfolio of non-connected pickups. In Panel B, “L/S” is the annual average return of a zero cost portfolio that buys a portfolio of non-connected sells and sells short a portfolio of connected sells; “L/S (PminS)” is the annual average return of a zero cost portfolio that buys a portfolio of connected purchases and sells short a portfolio of connected sells. t-statistics are shown below the coefficient estimates, and 5% statistical significance is indicated in bold.
Panel A: Purchases Raw returns DGTW-adjusted returns 5-factor alpha
All purchases 12.06 0.31 -0.58 (2.56) (0.41) (1.12)
Not connected purchases 11.97 0.27 -0.67 (2.55) (0.37) (1.26)
Connected purchases L/S
L/S (Pickups)
Connected purchases L/S
L/S (Pickups)
Connected purchases L/S
L/S (Pickups)
CONNECTED1 14.66 2.69 6.49 1.52 1.24 4.41 1.29 1.96 5.03 Same School (2.85) (2.27) (4.12) (1.69) (1.62) (3.50) (1.70) (2.91) (4.29)
CONNECTED2 15.58 3.62 5.91 2.30 2.03 4.98 1.82 2.49 5.73 Same School, same degree (3.15) (3.08) (3.35) (2.25) (2.54) (5.48) (2.01) (2.94) (3.90)
CONNECTED3 19.64 7.68 2.80 5.88 5.61 1.95 4.96 5.63 3.56 Same School, year overlap (3.59) (5.32) (0.55) (3.77) (5.39) (0.48) (3.16) (3.72) (1.08)
CONNECTED4 21.01 9.04 4.01 6.78 6.50 2.26 6.34 7.01 7.49 Same School, same degree, year overlap (3.62) (3.65) (0.62) (3.53) (3.94) (0.53) (2.92) (3.31) (1.69)

The Small World of Investing — Page 40
Table VII (continued): Connected holdings, purchases and sells, abnormal returns 1990 — 2006
Panel B: Sells Raw returns DGTW-adjusted returns 5-factor alpha
All sells 11.28 0.61 1.55 (2.62) (1.61) (2.52)
Not connected sells (NCS) 11.10 0.54 1.44 (2.60) (1.30) (2.27)
Connected sells
L/S L/S (PminS)
Connected sells
L/S L/S (PminS)
Connected sells
L/S L/S (PminS)
CONNECTED1 15.17 -4.07 -0.51 2.72 -2.18 -1.20 4.09 -2.66 -2.81 Same School (3.32) (3.33) (0.35) (3.06) (2.51) (1.37) (4.32) (2.89) (3.14)
CONNECTED2 15.19 -4.09 0.39 2.70 -2.16 -0.40 3.86 -2.42 -2.04 Same School, same degree (3.09) (3.04) (0.24) (2.59) (1.96) (0.36) (3.51) (2.19) (1.94)
CONNECTED3 15.93 -4.83 3.71 3.07 -2.53 2.81 4.79 -3.35 0.17 Same School, year overlap (3.03) (2.06) (1.54) (1.75) (1.35) (1.46) (2.37) (1.71) (0.07)
CONNECTED4 15.44 4.35 5.57 3.26 -2.72 3.52 4.68 -3.24 1.66 Same School, same degree, year overlap (3.54) (1.61) (1.43) (1.29) (1.07) (1.13) (2.03) (1.44) (0.60)

The Small World of Investing — Page 41
Table VIII: Returns around corporate news announcements
This table shows calendar time portfolio returns. At the beginning of every calendar quarter stocks in each mutual fund portfolio (based on the most recent SEC filing) are assigned to one of two portfolios (connected and non-connected). For each individual stock, we split monthly stock returns into returns on earnings announcements, “earnings announcements” defined as returns in calendar months with scheduled quarterly earnings releases, “other headlines” defined as returns in calendar months with at least 1 news announcement on the Dow Jones Newswires and no scheduled earnings announcements, and “no news returns” defined as returns in calendar months with neither news announcements on the Dow Jones newswires nor scheduled quarterly earnings releases. We compute monthly returns on connected and non-connected holdings between reports based on the assumption that funds do not change their holdings between reports. Portfolios are rebalanced every calendar quarter and within a given fund portfolio, stocks are value weighted by the fund’s dollar holdings. Finally, we compute value weighted calendar time portfolios by averaging across funds, weighting funds’ portfolios by the total net asset value at the end of the previous quarter. This table includes all available stocks and all available funds. Panel A reports the distribution of the news events in the period 1990 to 2006. In panel B we report average return of a zero cost portfolio that holds the portfolio of connected stocks and sells short the portfolio of non-connected stocks. Columns 3 to 5 test the null hypothesis that the difference in returns between the connected and the non-connected portfolio on news (no-news) is equal to zero. Columns 5 to 7 test the null hypothesis that the difference in returns between the connected and the non-connected portfolio on news (no-news) is equal to the difference in returns between two random portfolios with the same average return. To compute simulation-adjusted return we bootstrap with replacement 100,000 random portfolios iterating the following procedure: at the beginning of every calendar quarter we sample a random portfolio of 500 CRSP stocks. Stocks are value weighted within a given portfolio and portfolios are rebalanced quarterly. Simulation-adjusted returns are defined as raw returns minus the average return of random portfolios in the same average return quintile. Returns are in annual percent, t-statistics are shown below the coefficient estimates, and 5% statistical significance is indicated in bold.
Panel A: distribution of headlines news No news news
Percent of CRSP monthly return, % of firms 0.59 0.41 # of news events 2,681,914Percent of CRSP monthly return, % of ME 0.55 0.45 Average # of news per year 157,981
Panel B: Connected minus non-connected
L/S Returns L/S Simulation-adjusted returns
No news Earnings announce
ments
Other headlines
No news Earnings announce
ments
Other headlines
CONNECTED1 -0.02 1.36 1.70 -0.46 0.39 0.83 Same School (-0.03) (2.44) (2.77) (-0.69) (0.66) (1.35)
CONNECTED2 0.29 1.03 2.39 -0.14 0.05 1.53 Same School, same degree (-0.43) (1.89) (3.42) (-0.21) (0.10) (2.19)
CONNECTED3 -0.18 4.05 2.99 -0.61 3.08 2.13 Same School, year overlap (0.27) (3.67) (3.14) (-0.92) (2.79) (2.24)
CONNECTED4 0.09 3.69 4.58 -0.34 2.72 4.60 Same School, same degree, year overlap (0.07) (3.06) (3.07) (-0.34) (2.25) (3.09)

The Small World of Investing — Page 42
Table IX: Robustness checks
This table shows calendar time portfolio returns. We report the annual average return of a zero cost portfolio that holds the portfolio of connected stocks and sells short the portfolio of non-connected stocks. Connected companies are defined as firms where at least a senior official (CEO, CFO or Chairman) received any degree from the same institution as the fund’s portfolio manager (CONNECTED1), received the same degree from the same institution as the fund’s portfolio manager (CONNECTED2), received any degree from the same institution as the fund’s portfolio manager and overlapped with the portfolio manager during the pursuit of the degree (CONNECTED3) or received the same degree from the same institution as the fund’s portfolio manager, and overlapped with the portfolio manager during the pursuit of the degree (CONNECTED4). Panel A reports results by sub-period and firm characteristics. Panel B reports results by fund characteristics. Panel C reports results by institutions. School adjusted returns are defined as raw returns minus the value weighted average of a portfolio of all firms where at least a senior official (CEO, CFO or Chairman) received a degree from the same institution. “top 5 most connected” are academic institutions, ranked by the average number of connected firms (portfolio managers) over the period 1990 to 2006.
Panel A: sub periods and size CONNECTED1 CONNECTED2 CONNECTED3 CONNECTED4
Large cap stocks 3.48 4.20 7.17 8.47 Above NYSE median (2.85) (3.54) (4.70) (3.76)
Small cap stocks 6.58 10.65 21.59 15.72 Below NYSE median (2.16) (2.04) (2.19) (1.89)
1990 — 1998 5.16 5.37 7.71 8.07 (3.48) (3.83) (3.96) (2.35)
1997 — 2006 4.38 4.91 8.76 9.51 (2.86) (3.68) (4.31) (2.80)
Pre-Reg FD 4.64 5.48 9.22 9.76 (3.29) (4.10) (4.86) (3.17)
Post-Reg FD 4.40 5.33 8.74 9.59 (3.36) (4.34) (4.87) (3.40)
Panel B: fund characteristics
Aggressive growth funds 3.52 4.24 6.41 7.66 (2.07) (3.82) (2.66) (2.02)
Growth funds 3.08 4.03 5.73 6.91 (1.77) (3.38) (3.39) (2.70)
Growth and income funds 1.74 3.24 5.77 8.69 (1.02) (2.27) (2.71) (3.21)
Large cap funds 3.05 3.72 6.94 8.43 Above median (2.72) (3.24) (4.67) (3.82)
Small cap funds 2.95 3.73 2.81 4.59 Below median (2.85) (2.67) (1.40) (2.11)
Single portfolio manager 3.01 4.02 5.57 6.71 (2.37) (3.35) (3.85) (3.29)
Multiple portfolio manager 3.18 3.03 9.21 12.56 (3.31) (2.21) (2.51) (2.18)
Local holdings 2.77 4.41 7.55 10.03 <100Km, 1994 — 2006 (2.77) (3.27) (4.09) (4.17)
Distant local holdings 2.26 3.80 7.21 9.30 >100Km, 1994 — 2006 (2.19) (2.76) (4.14) (4.23)
Panel B: institutions
Only non-ivy league 4.63 4.81 8.13 9.68 (2.67) (3.08) (4.08) (3.18) Only ivy league 4.12 4.65 2.00 3.77 (4.86) (3.30) (0.89) (1.27) School-adjusted return 1.25 1.86 4.38 5.65 (1.94) (2.41) (4.70) (3.24)
Top 5 most connected 2.88 3.79 6.42 7.72 (2.46) (2.72) (3.89) (3.56)
Not Top 5 most connected 3.09 3.77 6.88 8.16 (2.78) (3.28) (4.62) (3.66)

The Small World of Investing — Page 43
Table X: Changes in portfolio weights around changes in portfolio managers
This table reports OLS regressions of changes in mutual funds’ portfolio weights around changes in educational connections. In this table, connected companies are defined as firms where at least a senior official (CEO, CFO or Chairman) received the same degree from the same institution as the fund’s portfolio manager, and overlapped with the portfolio manager during the pursuit of the degree. This figure included the universe of mutual funds managed by a single portfolio manager. A manager change represents a replacement of the fund’s portfolio manager where the new portfolio manager and the prior portfolio manager never received a degree from the same academic institution. The dependent variable is the average fund portfolio weight in the stock in the year following manager change (time zero), minus the average fund holding in the year before manager change. New Manager’s Stock is a categorical variable equal to 1 for any stock held in the new manager’s portfolio, while New Manager’s Connected Stock is a categorical variable equal to 1 for any stock held that is connected to the new manager. Old Manager’s Stock and Old Manager’s Connected Stock are defined equivalently. The control variables included where indicated are: %STYLE, the percentage of the fund’s total net assets invested in the style corresponding to the stock being considered (style is calculated as in DGTW (1997)), ME, BM and R12 which are percentiles of market value of equity, book to market, and past 12 month return. Quarter fixed effects are included in each regression, and firm, fund’s investment objective code (IOC), and fund fixed effects are included where indicated. Weights are in basis points; standard errors are adjusted for clustering at the quarter level, and t-statistics are reported in brackets below the coefficient estimates. 5% statistical significance is indicated in bold. OLS regression: Weight Change Following Manager Turnover
1 2 3 4 5
Constant -7.31 -17.87 -16.28 2.97 -31.02 (-1.84) (-3.41) (-1.79) (0.49) (-1.60)
New Manager’s Stock 55.15 53.30 53.48 53.42 56.10 (18.2) (17.1) (18.8) (17.0) (16.0)
New Manager’s Connected Stock 45.98 48.48 43.35 48.54 46.31 (2.49) (2.34) (2.12) (2.34) (2.18)
Old Manager’s Stock -58.03 -65.82 -69.08 -65.79 -71.48 (-9.88) (-11.7) (-13.8) (-11.7) (-11.1)
Old Manager’s Connected Stock -4.77 -3.11 -7.66 -3.16 -2.57 (-0.38) (-0.27) (-0.65) (-0.27) (-0.23)
Controls No Yes Yes Yes Yes
Fixed effect Quarter Quarter Quarter Quarter Quarter Fixed effect Firm IOC Fund
R2 0.19 0.21 0.25 0.21 0.27

The Small World of Investing — Page 44
Table XI: Fund manager behavior
Panel A reports the average fraction of fund holdings invested in connected securities, the average fraction of connected securities in the market portfolio and the difference between them. Fama MacBeth t-statistics are reported below the coefficient estimates. Panel B reports average Sharpe ratios of individual funds. For each fund manager j , we compute Sharpe ratios (SR) in connected securities and report the averages across funds:
(1/ ) jj
SR n SR= ∑
Column 3 of panel B reports the % of funds with in-sample increase in SR. For each fund manager j we run a time series regression of the fund’s monthly return in connected securities (CONNRET) on the funds total return (RET):
, , ,CONNRET RETj t j j j t j tα β ε= + +
Column 3 reports the fraction of funds where the null hypothesis α=0 is rejected at 5% significance. Panel C reports pooled, cross-sectional OLS regressions of mutual fund manager trading activity:
1 ( * 1), 1 _ , 2 3 _ , 4 ,i i i i idw a b DW b Z b DW Z b CONTROLSj t xj CONNECTED t xj CONNECTED t t j tε= + + + + +
The dependent variable ( itjdw , ) is the change in the percentage holding of a stock by a given
mutual fund in a given quarter. For a given portfolio manager j, we identify all fund managers that went to the same school as the fund manager j and then sum up all their dollar holdings (excluding manager j’s holdings). We then compute the change (DWMC) in this connected mutual fund portfolio, and include this as an explanatory variable in our regressions. We also include a dummy variable (Z1) equal to 1 if fund manager j is connected to stock i in quarter t, and an interaction term (DWMC*Z1) that captures the extent to which fund manager j’s trading behavior is related to the trading behavior of the connected mutual fund portfolio for connected stocks in particular. We compute aggregate mutual fund portfolio change (DWALL), equal to the change in the mutual fund portfolio of all fund managers. The other explanatory variables are the stock i’s lagged market capitalization (ME), stock i’s lagged book-to-market ratio, and stock i’s lagged quarterly return. Units are in percentage points; standard errors are adjusted for clustering at the quarter level, and t-statistics are reported in brackets below the coefficient estimates. 5% statistical significance is indicated in bold.
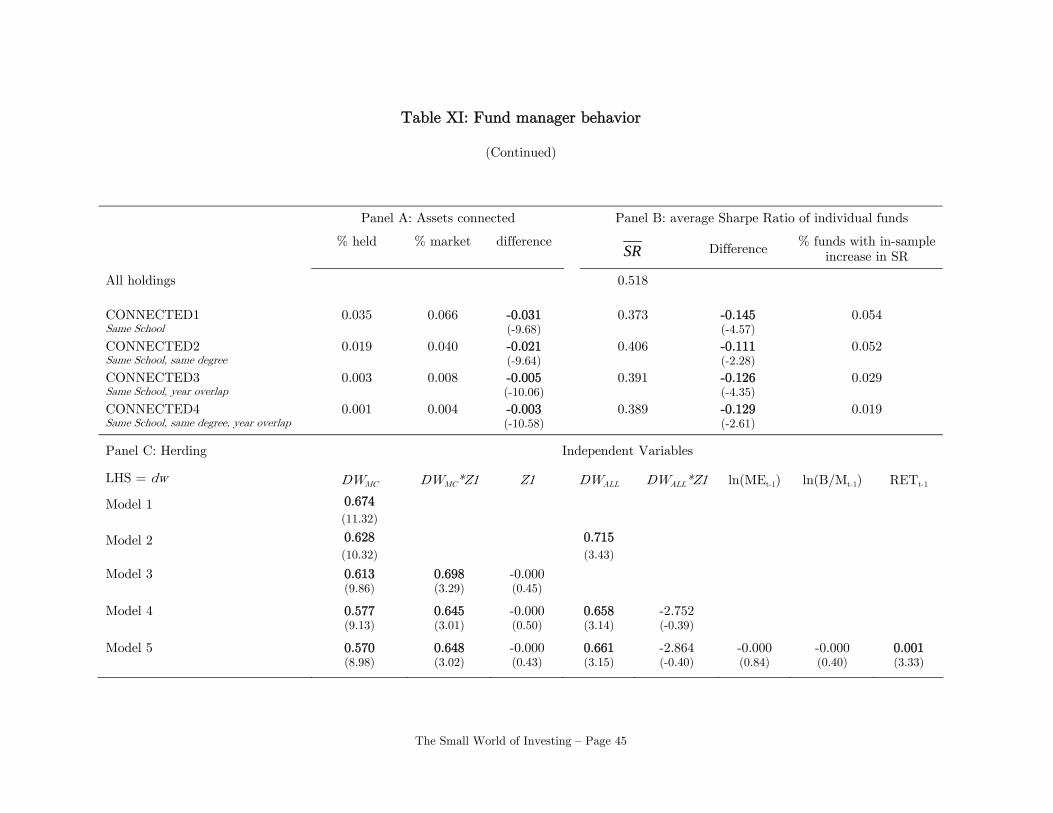
The Small World of Investing — Page 45
Table XI: Fund manager behavior
(Continued)
Panel A: Assets connected Panel B: average Sharpe Ratio of individual funds
% held % market difference SR Difference % funds with in-sample
increase in SR
All holdings 0.518
CONNECTED1 0.035 0.066 -0.031 0.373 -0.145 0.054 Same School (-9.68) (-4.57) CONNECTED2 0.019 0.040 -0.021 0.406 -0.111 0.052 Same School, same degree (-9.64) (-2.28) CONNECTED3 0.003 0.008 -0.005 0.391 -0.126 0.029 Same School, year overlap (-10.06) (-4.35) CONNECTED4 0.001 0.004 -0.003 0.389 -0.129 0.019 Same School, same degree, year overlap (-10.58) (-2.61)
Panel C: Herding Independent Variables
LHS = dw DWMC DWMC*Z1 Z1 DWALL DWALL*Z1 ln(MEt-1) ln(B/Mt-1) RETt-1
Model 1 0.674 (11.32)
Model 2 0.628 0.715 (10.32) (3.43)
Model 3 0.613 0.698 -0.000 (9.86) (3.29) (0.45)
Model 4 0.577 0.645 -0.000 0.658 -2.752 (9.13) (3.01) (0.50) (3.14) (-0.39)
Model 5 0.570 0.648 -0.000 0.661 -2.864 -0.000 -0.000 0.001 (8.98) (3.02) (0.43) (3.15) (-0.40) (0.84) (0.40) (3.33)
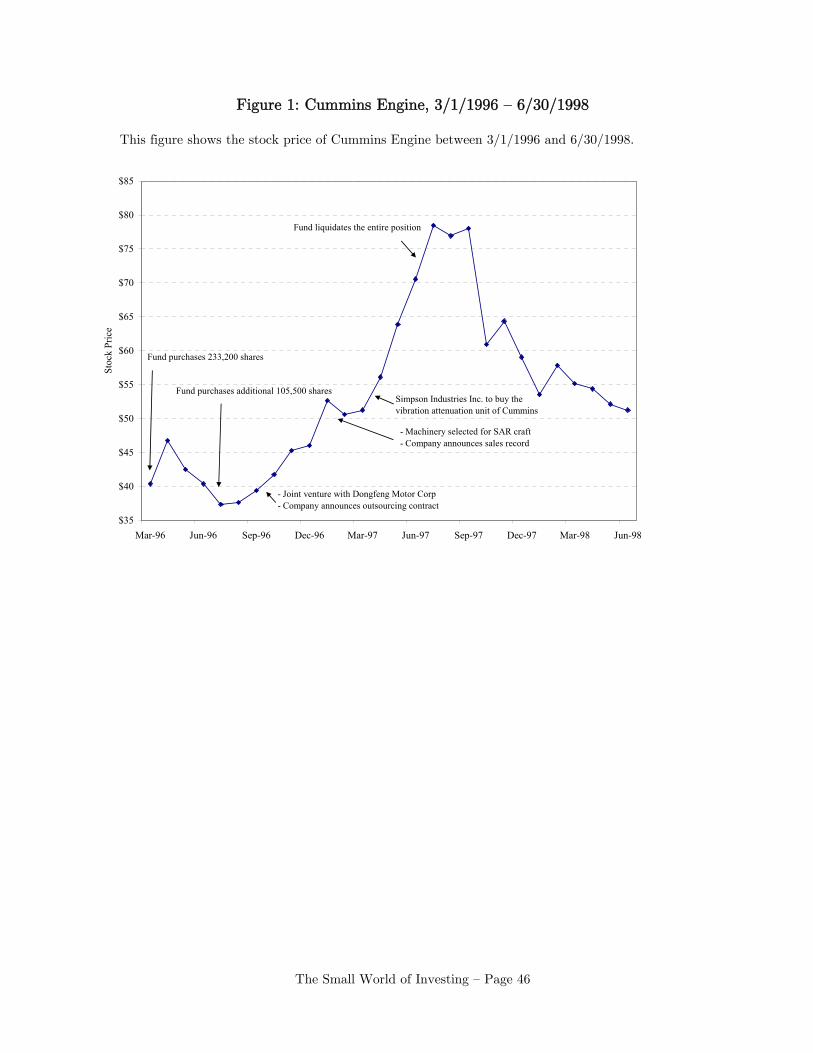
The Small World of Investing — Page 46
Figure 1: Cummins Engine, 3/1/1996 — 6/30/1998
This figure shows the stock price of Cummins Engine between 3/1/1996 and 6/30/1998.
$35
$40
$45
$50
$55
$60
$65
$70
$75
$80
$85
Mar-96 Jun-96 Sep-96 Dec-96 Mar-97 Jun-97 Sep-97 Dec-97 Mar-98 Jun-98
Stoc
k Pr
ice
Fund purchases 233,200 shares
Fund purchases additional 105,500 shares
Fund liquidates the entire position
- Joint venture with Dongfeng Motor Corp- Company announces outsourcing contract
- Machinery selected for SAR craft- Company announces sales record
Simpson Industries Inc. to buy thevibration attenuation unit of Cummins
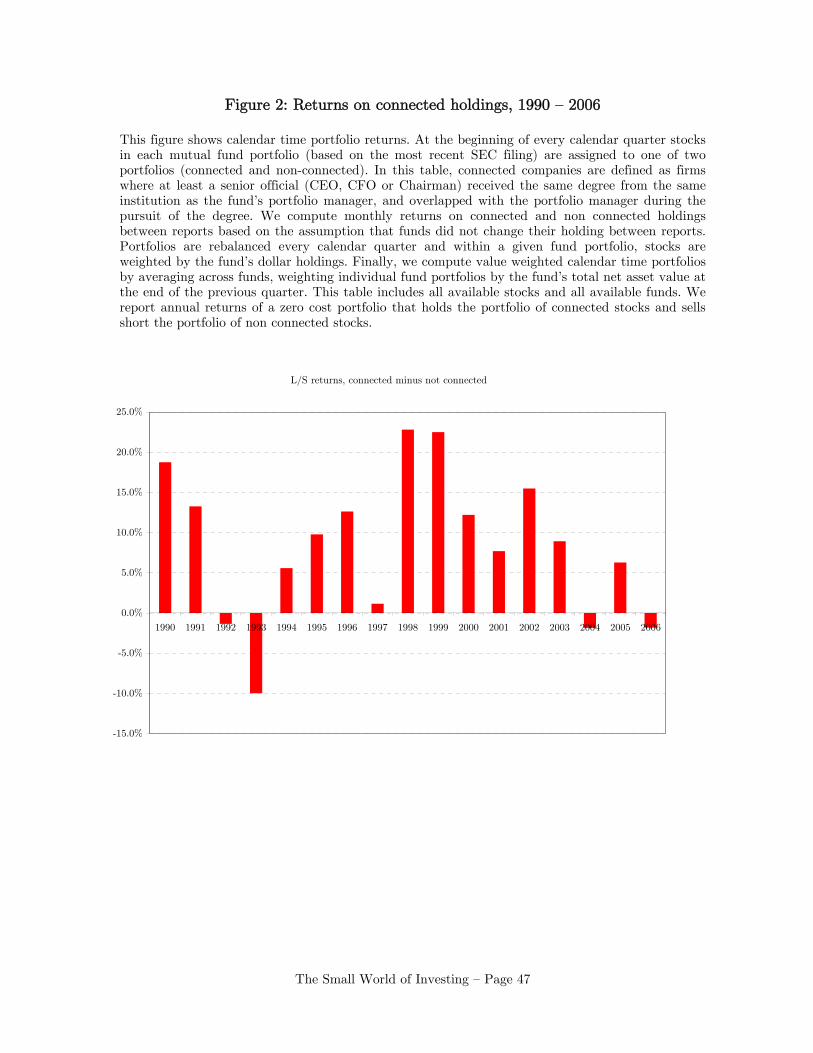
The Small World of Investing — Page 47
Figure 2: Returns on connected holdings, 1990 — 2006 This figure shows calendar time portfolio returns. At the beginning of every calendar quarter stocks in each mutual fund portfolio (based on the most recent SEC filing) are assigned to one of two portfolios (connected and non-connected). In this table, connected companies are defined as firms where at least a senior official (CEO, CFO or Chairman) received the same degree from the same institution as the fund’s portfolio manager, and overlapped with the portfolio manager during the pursuit of the degree. We compute monthly returns on connected and non connected holdings between reports based on the assumption that funds did not change their holding between reports. Portfolios are rebalanced every calendar quarter and within a given fund portfolio, stocks are weighted by the fund’s dollar holdings. Finally, we compute value weighted calendar time portfolios by averaging across funds, weighting individual fund portfolios by the fund’s total net asset value at the end of the previous quarter. This table includes all available stocks and all available funds. We report annual returns of a zero cost portfolio that holds the portfolio of connected stocks and sells short the portfolio of non connected stocks.
L/S returns, connected minus not connected
-15.0%
-10.0%
-5.0%
0.0%
5.0%
10.0%
15.0%
20.0%
25.0%
1990 1991 1992 1993 1994 1995 1996 1997 1998 1999 2000 2001 2002 2003 2004 2005 2006

The Small World of Investing — Page 48
Figure 3: Connected weights at manager Changes This figure shows the holdings of mutual funds around changes in educational connections. In this figure, connected companies are defined as firms where at least a senior official (CEO, CFO or Chairman) received the same degree from the same institution as the fund’s portfolio manager, and overlapped with the portfolio manager during the pursuit of the degree. This figure included the universe of mutual funds managed by a single portfolio manager. A manager change represents a replacement of the fund’s portfolio manager where the new portfolio manager and the prior portfolio manager did not receive a degree from the same academic institution. In the figure quarter -1 represents the last portfolio snapshot of the old manager and quarter +1 represents the first portfolio snapshot of the new manager. Weight is defined as percentage holding of a stock averaged over the last 2 quarters (for event quarter <0) or over the next 2 quarters (for event quarter >0). “Average weight in stocks connected to the old manager” measures the weights on stocks connected to the old manager, but not to the new manager. “Average weight in stocks connected to the new manager” measures the weights on stocks connected to the new manager, but not to the old manager. Weights are in basis points.
40
50
60
70
80
90
100
110
120
130
140
-3 -2 -1 1 2 3
event quarter
Bas
is P
oint
s
Average weight in stocks connected to the new manager Average weight in stocks connected to the old manager
Manager changeOld manager New manager

The Small World of Investing — Page A1
Appendix
A. Morningstar data
Since Morningstar only tracks active funds, we use all the historical Morningstar
OnDisk and Principia CD-ROM at monthly or quarterly intervals (depending
upon availability) and the Morningstar Mutual Fund Sourcebook between 1990
and 2003. Unfortunately, due to a change in Morningstar’s data storage process,
subsequent to 2003, most of the biographical information is no longer available
on the Principia CD-ROM. We obtain the remaining data directly from
Morningstar, which provided us with managers’ biographical information on both
active and inactive funds between 2003 and 2006. When data entries about a
fund or a portfolio manager are available from multiple source dates, we use data
from the most recent source date to account for data corrections in subsequent
releases. Funds on Morningstar are identified by a ticker-date combination.
B. Matching institutions
The first problem in matching institutions from BoardEx and Morningstar is the
situation in which there are multiple names for a given institution in both
BoardEx and Morningstar. In addition, there are names that could be potentially
matched to multiple institutions and the individual biography does not make it
clear which institution the portfolio manager or the firm’s officer attended. We
match institutions with multiple names by hand. Most specialized school names
are easy to match back to institution (e.g. Wharton), however if a specialized
school name could match multiple institutions (e.g. SOM), we drop these
observations from the sample. In addition, we match all entries given as simply
state names to the University of State Name. In dealing with multiple campuses,
we matched each satellite campus as a separate university (e.g. UCLA, UCSD,
and UC Berkeley are treated as separate universities). If just a university name is
given for a university system that has satellite campuses (e.g. Penn State for the
Penn State system of schools), we assume the entry refers to the main campus.
Whenever a single name is given that could apply to two educational institutions

The Small World of Investing — Page A2
(e.g. Augustana could refer to Augustana College or Augustana University) and
the individual biography does not make it clear which institution was attended,
we drop the observations from our sample. Lastly, although we are able to match
most international universities (outside US), some names refer to multiple
institutions in multiple countries. We are not able to uniquely match these, and
thus drop this small number of observations from the sample. Finally, we group
the degrees into six categories: (i) business school (MBA), (ii) medical school, (iii)
general graduate (MA or MS), (iv) PhD, (v) law school, and (vi) general
undergraduate. Most of the data on general graduate degrees or undergraduate
degrees do not allow us to reliably determine the major course of study, and thus
we classify them in the two broad categories of (iii) and (vi).
C. Headline news data
We extract headline news data from the Dow Jones newswires using the Factiva
web interface. First, we use the CRSP monthly stock name file to identify all
company names of CRSP firms between 1990 and 2006. We then select all the
Dow Jones Newswires available on Factiva (23 total) and for each stock on the
CRSP tape we extract all the news events where the firm’s name (or any of the
names if multiple names exist for a given stock) is mentioned in either the
headline or in the lead paragraph. We restrict the search to news items in
English containing at least 5 words. We exclude republished news and recurring
pricing or market data. For every news item we retain the headline, the release
date, the release time, the word count and the data source. The final sample
includes 2,685,684 headlines for 14,084 stocks between the year 1990 and 2006.
Table A1 gives the distribution of news count by data source.
D. Connected Boards
The use of senior officers to define connected firms has the advantage of being
simple and intuitive but it is obviously arbitrary. Table A2 reports calendar time
portfolio returns on connected and non-connected stocks using an alternative
definition of connected holdings that exploits the identity of the entire board of

The Small World of Investing — Page A3
directors of the firm, not just the top senior officers. We define connected
companies as firms where at least a 50% of the board of directors received a
degree from the same institution as the fund’s portfolio manager
(CONNECTED1). We further classify connected firms as CONNECTED2 if at
least one member of the board of directors received the same degree from the
same institution as the fund’s portfolio manager, CONNECTED3 if at least one
board member received any degree from the same institution as the fund’s
portfolio manager but overlapped with the portfolio manager during the pursuit
of the degree, and CONNECTED4 if at least one board member received the
same degree from the same institution as the fund’s portfolio manager, and
overlapped with the portfolio manager during the pursuit of the degree. Results
in table A2 confirm that, even under an alternative definition of connected firms,
mutual fund managers earn high returns on their connected holdings: a
replicating portfolio of their connected stocks consistently outperforms a
replicating portfolio of their non-connected holdings.

The Small World of Investing — Page A4
Table A1: News data, 1990 — 2006
# of news percent Dow Jones News Service 1,040,427 38.7 Professional Investor Report 352,818 13.1 Select Federal Filings Newswires 305,409 11.4 Federal Filings Newswires 230,016 8.6 Dow Jones News Service - Ticker 204,971 7.6 Other 552,043 20.6 All 2,685,684 100.0

The Small World of Investing — Page A5
Table A2: Board connections, abnormal returns 1990 — 2006
This table shows calendar time portfolio returns. At the beginning of every calendar quarter stocks in each mutual fund portfolio (based on the most recent SEC filing) are assigned to one of two portfolios (connected and non-connected). In this table, connected companies are defined as firms where at least 50% of the board of directors received a degree from the same institution as the fund’s portfolio manager (CONNECTED1). We further classify connected firms as CONNECTED2 if at least one member of the board of directors received the same degree from the same institution as the fund’s portfolio manager, received any degree from the same institution as the fund’s portfolio manager and overlapped with the portfolio manager during the pursuit of the degree (CONNECTED3) or received the same degree from the same institution as the fund’s portfolio manager, and overlapped with the portfolio manager during the pursuit of the degree (CONNECTED4). We compute monthly returns on connected and non-connected holdings between reports based on the assumption that funds did not change their holding between reports. Portfolios are rebalanced every calendar quarter and within a given fund portfolio, stocks are value weighted by the fund’s dollar holdings. Finally, we compute value weighted calendar time portfolios by averaging across funds and by weighting fund portfolios by the fund’s total net asset value at the end of the previous quarter. This table includes all available stocks and all available funds. We report average returns, DGTW-adjusted returns and 5-factor alphas in the period 1990 to 2006. DGTW characteristic-adjusted returns are defined as raw returns minus the returns on a value weighted portfolio of all CRSP firms in the same size, market-book, and one year momentum quintile. Alpha is the intercept on a regression of monthly portfolio excess returns. The explanatory variables are the monthly returns from Fama and French (1993) mimicking portfolios, Carhart (1997) momentum factor and Pastor and Stambaugh (2003) liquidity factor. L/S is annual average return of a zero cost portfolio that holds the portfolio of connected stocks and sells short the portfolio of non-connected stocks. Returns and alphas are in annual percent, t-statistics are shown below the coefficient estimates, and 5% statistical significance is indicated in bold. Panel A: value weighted returns Raw return DGTW-adjusted returns 5-factor alpha
Not connected 11.23 -0.06 -0.57 (2.51) (-0.13) (-0.81)
Connected holdings L/S
Connected holdings L/S
Connected holdings L/S
CONNECTED1 17.32 6.09 4.26 4.32 6.04 6.61 > 50% Same School (3.15) (2.68) (2.78) (2.51) (3.10) (3.35)
CONNECTED2 17.05 5.83 3.72 3.78 6.44 7.01 > 50% Same School and at least 1 same degree (3.03) (2.49) (2.44) (2.24) (3.23) (3.44)
CONNECTED3 17.49 6.26 3.58 3.64 8.88 9.45 > 50% Same School and at east 1 year overlap (3.07) (2.80) (3.17) (3.43) (3.52) (3.84)
CONNECTED4 19.71 8.48 5.05 5.11 10.82 11.39 > 50% Same School and at least 1 same degree - year overlap
(3.15) (2.64) (2.57) (2.75) (3.80) (3.98)