The size and scope of agri-tourism in South Africa CC van Zyl
214
The size and scope of agri-tourism in South Africa CC van Zyl orcid.org/0000-0001-5427-9922 Dissertation submitted in partial fulfilment of the requirements of the degree Master of Commerce in Tourism Management at the North-West University Supervisor: Prof Dr M Saayman Graduation: July 2019 Student number: 23375159
Transcript of The size and scope of agri-tourism in South Africa CC van Zyl

The size and scope of agri-tourism in South Africa
CC van Zyl orcid.org/0000-0001-5427-9922
Dissertation submitted in partial fulfilment of the requirements of the degree Master of Commerce in Tourism Management
at the North-West University
Supervisor: Prof Dr M Saayman Graduation: July 2019 Student number: 23375159

This study is dedicated to the late Prof Melville Saayman
24/05/1965 – 14/03/2019
This research will continue in his memory.
“My role model didn’t tell me, he showed me.” – Anonymous

i
FINANCIAL ASSISTANCE
NRF (National Research Foundation) and Professor Peet van der Merwe for the Grant-
holder linked bursary in 2018.
The NWU Masters Bursary that assisted for two years.
NWU TREES and Professor Melville Saayman for financial assistance in research.

ii
ACKNOWLEDGEMENTS
I would like to express my sincere appreciation to the following people who supported me
through this study:
My Heavenly Father for giving me the privilege, strength and knowledge needed to
complete this study. You were with me every late night, through every success and
failure. I am never alone. {“I can do all things through Him who strengthens me.” -
Philippians 4:13}
The late Professor Melville Saayman for sharing his insight, thoughts and ideas with me
and for believing enough in me to give me this challenge. Without his assistance I would
have been lost. I was very privileged to have be able to work under his guidance. My
mentor – my role model. I hope to make you proud!
My parents, Venter & Charlien van Zyl for their endless sacrifices to give me every
opportunity possible. Their unconditional love and non-stop support carried me through
the trying times. None of my accomplishments would have been possible without your
support and guidance – I owe you two everything that I have. Not only did they offer
emotional support, they assisted with courier arrangements for questionnaires, logistical
arrangements for events, financial contribution to the printing of questionnaires and they
were my fieldworkers at NAMPO Harvest Day.
Professor Elmarie Slabbert for her support and understanding.
FotoFirst, Gateway Shopping Centre, Hermanus for printing far over 1 000
questionnaires for distribution. Mr Andrew Maritz and Ms Fran Minnaar for all their hard
work to print and fold.
My friends and support system who listened to my endless stories and asked every day
on my progress, especially Bianca van Rensburg, Frances Ott and Maryke Jooste.
Mr Danie Steyl for the language editing and technical editing. His patience through the
process was irreplaceable and all his hours of hard work contributed to a successful
thesis.
NWU TREES and Ms Hanneri Borstlap for promoting the online questionnaire on their
Facebook page.

iii
Professor Peet van der Merwe for his financial assistance that allowed me to complete
this study.
Former Agri SA president, Mr Johannes Möller who gave me the opportunity to attend
and speak at Agri SA’s annual congress in 2017. He was without a doubt a breakthrough
in questionnaire distribution and support from other organisations.
Mr Bennie van Zyl, General Manager of TAU South Africa who always assisted me with
a positive attitude in distributing the online link to the e-questionnaire.
Mr Dan Kriek, president of Agri SA who was always able to assist me.
Mr. Cornie Swart, the President, Mr Carl Opperman, the CEO and Ms Helena van
Eeden, Member Information and PA manager at Agri Western Cape for their enthusiastic
participation and contribution in ensuring that physical questionnaires were distributed
and collected at all Agri Western Cape regional meetings. I received astounding results
due to their hard work and dedication.
The late Mr Henk van Wyk, former President, Mr H. Myburgh, CEO and Ms Marian van
der Westhuizen for assisting with research in the Northern Cape and the distribution of
questionnaires at the Agri Northern Cape chairpersons’ meeting.
Mr Gerhard Kriel, CEO of Free State Agriculture who assisted greatly in online
questionnaire distribution and Ms Elana Bester, Communications Officer at Free State
Agriculture for her help with the logistics to start the research within in agri community
and arranging surveys at the annual Young Farmer Congress.
Mr Kobus Visser, Director of Corporate Liaison who provided us with information
regarding Agri SA and organisations.
Mr Willem van Jaarsveld, CEO of Agri Limpopo for distribution the online questionnaire
several times. His persistence paid off.
Mr Robert Davel, CEO of Agri Mpumalanga, for giving us the amazing idea of a
shortened questionnaire for farmers that are not hosting agri-tourism that does not
include agri-tourism questions. This was a breakthrough that assisted in several
provinces.
Mr Boeta du Toit, CEO of Agri North West, for distributing the online questionnaire
several times.

iv
Dr Willem Pretorius, President of Agri Gauteng for his positive attitude and contribution.
Dr Andre Jooste, CEO of Potatoes South Africa for giving me the opportunity to
distribute questionnaires at the annual Potatoes SA congress as well as online
questionnaire distribution.
Ms Tharina Rossel, President of SAVLU and Ms Karien van Schalkwyk, President of
VLVK for their positive attitude towards the study.
Ms Yolandè Roodt, Editorial Assistant at Grootplaas TV programme and RSA Landbou
radio programme, and her team at Grootplaas, including Ms Elsa Esterhuizen for the
publicity and opportunity to promote the study on kykNET. The link to the online
questionnaire was also available on their website.
Ms Lisa Roberts and Mr Hennie Maas, Presenters on RGS – agriculture programme for
a follow-up interview after the Grootplaas programme with regards to promoting this
study nationwide. The link to the online questionnaire was also available on their
website.
Mr Francois Seymore, Editor of OVK News Magazine for the article places in the
magazine, explaining and promoting the study as well as providing the online link to the
questionnaire.
Ms Jacqui Taylor, Founder and Managing Director for Agritourism Africa for giving me
the opportunity to distribute questionnaires at the annual NAMPO Harvest Festival.
Without this opportunity, completing the research with such a high response rate would
not have been possible.
Mr Nwabisa Siyongwana – Makumule, Project Manager at Atone Works for assisting me
in questionnaire distribution at the AGRI 5 Commodities Workshop & Expo.
Ms Annelie Coleman and Farmers Weekly for posting the link to the online distribution
on their Facebook page.
A special thanks to all the farmers who completed the questionnaire!! It was long and
timely, but they still made time to be a part of this nationwide study and therefor are able
to share in these results.
v
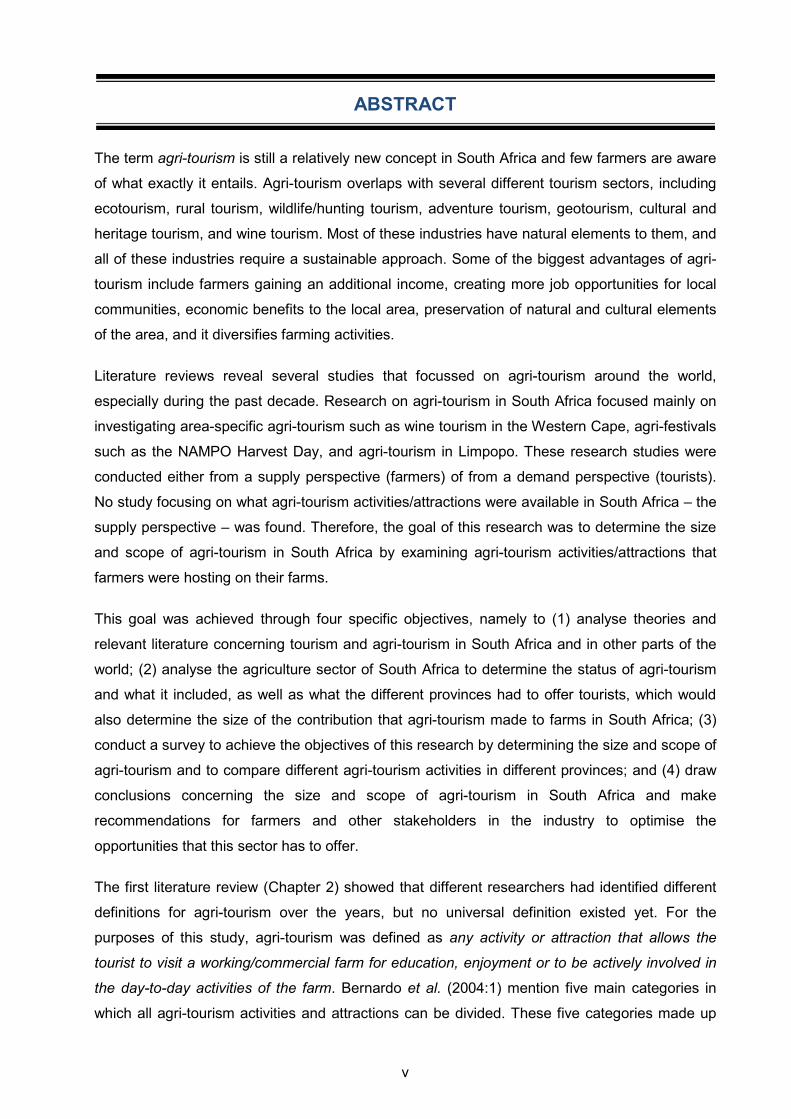
ABSTRACT
The term agri-tourism is still a relatively new concept in South Africa and few farmers are aware
of what exactly it entails. Agri-tourism overlaps with several different tourism sectors, including
ecotourism, rural tourism, wildlife/hunting tourism, adventure tourism, geotourism, cultural and
heritage tourism, and wine tourism. Most of these industries have natural elements to them, and
all of these industries require a sustainable approach. Some of the biggest advantages of agri-
tourism include farmers gaining an additional income, creating more job opportunities for local
communities, economic benefits to the local area, preservation of natural and cultural elements
of the area, and it diversifies farming activities.
Literature reviews reveal several studies that focussed on agri-tourism around the world,
especially during the past decade. Research on agri-tourism in South Africa focused mainly on
investigating area-specific agri-tourism such as wine tourism in the Western Cape, agri-festivals
such as the NAMPO Harvest Day, and agri-tourism in Limpopo. These research studies were
conducted either from a supply perspective (farmers) of from a demand perspective (tourists).
No study focusing on what agri-tourism activities/attractions were available in South Africa – the
supply perspective – was found. Therefore, the goal of this research was to determine the size
and scope of agri-tourism in South Africa by examining agri-tourism activities/attractions that
farmers were hosting on their farms.
This goal was achieved through four specific objectives, namely to (1) analyse theories and
relevant literature concerning tourism and agri-tourism in South Africa and in other parts of the
world; (2) analyse the agriculture sector of South Africa to determine the status of agri-tourism
and what it included, as well as what the different provinces had to offer tourists, which would
also determine the size of the contribution that agri-tourism made to farms in South Africa; (3)
conduct a survey to achieve the objectives of this research by determining the size and scope of
agri-tourism and to compare different agri-tourism activities in different provinces; and (4) draw
conclusions concerning the size and scope of agri-tourism in South Africa and make
recommendations for farmers and other stakeholders in the industry to optimise the
opportunities that this sector has to offer.
The first literature review (Chapter 2) showed that different researchers had identified different
definitions for agri-tourism over the years, but no universal definition existed yet. For the
purposes of this study, agri-tourism was defined as any activity or attraction that allows the
tourist to visit a working/commercial farm for education, enjoyment or to be actively involved in
the day-to-day activities of the farm. Bernardo et al. (2004:1) mention five main categories in
which all agri-tourism activities and attractions can be divided. These five categories made up
vi
the framework for the research and included outdoor recreation, educational experiences,
entertainment, hospitality services, and direct sales on the farm. The literature also refers to 84
different types of agri-tourism activities/attractions around the world that are divided into these
five categories. These activities/attractions were used as a basis to investigate agri-tourism in
South Africa.
The second literature review (Chapter 3) examined the agriculture and tourism sectors in South
Africa. Several parts of these sectors were discussed, but the most important revelation was
that the agriculture sector contributed 5.21% (2018) and the tourism sector contributed 4.35%
(2016) to job opportunities in South Africa.
The questionnaire “Agri-tourism in South Africa” was distributed among South African farmers
based in all nine provinces between July 2017 and June 2018. Physical questionnaires were
distributed at several agricultural events such as the Agri SA Congress, regional meetings of
Agri Western Cape, Agri Northern Cape chairpersons’ meeting, the NAMPO Harvest Day, the
AGRI 5 Commodities Workshop and Expo, the Agri Free State Young Farmer Congress, and
the Potatoes SA Congress. Google Forms was used to design the online questionnaire, and the
online link to this e-questionnaire was distributed to farmers through organisations such as Agri
SA, TLU, Agri Western Cape, Agri Mpumalanga, Agri Gauteng, Agri Limpopo, Agri Free State,
VLVK, VVLU, Farmer’s Weekly (social media), and Agri-tourism South Africa. Other
organisations that assisted with the questionnaire distribution included Grootplaas (KykNET),
RSG Radio Station, NWU TREES, and OVK News Magazine. A total of 557 usable
questionnaires were collected from farmers across the country.
Data collected from the e-questionnaires were captured by using Google Forms and exported to
Microsoft® Office Excel 2016. The questionnaires that were obtained by means of physical
distribution were captured in the same Microsoft® Office Excel sheet. Finally, all the data were
analysed by means of the Statistical Package for the Social Sciences (SPSS).
Key findings in the literature identified different agri-tourism methods, advantages, and
disadvantages from around the world. While some of these findings were not applicable to
South Africa, many of the theories, for instance motivations for hosting agri-tourism in a South
African context, could be examined.
Key findings in the survey results provided a profile of the average South Africa farmer. It also
identified several gaps in the agriculture and tourism sectors that could be filled and improved
with agri-tourism. While 76% of the respondents indicated that they were not hosting any form
of agri-tourism on their farms, agri-tourism activities/attractions that were hosted most in South
Africa included (in alphabetical order) animal rides, bird watching, camping, farm
vii
stay/accommodation, farm tours, fishing, hiking/nature trails, hunting, mountain climbing, off-
road vehicle driving/4x4 routes, picnicking, restaurants, social events, water activities, wedding
and special events, and wildlife viewing and photography. In terms of expansion, farmers
identified farm stay/accommodation, wildlife viewing and photography, hiking/nature trails,
cycling, and bird watching as activities/attractions that they planned to implement within the next
five years.
The results of the study can be used to improve and develop agri-tourism in South Africa. One
of the largest gaps that were identified in this study is education – a lack of knowledge about
agri-tourism. Many farmers were not aware of the opportunities that agri-tourism offered and
they were not aware of the support systems to assist them in implementing and managing agri-
tourism sustainably. While several organisations assisted with agri-tourism, there was a large
gap in information offered to farmers. Similar research that can be conducted on agri-tourism in
South Africa include developing a marketing model for local and international markets,
developing a model for sustainably implementing agri-tourism on a farm, or even determining
the financial contribution that agri-tourism makes to a farm.
Keywords: tourism, agriculture, agri-tourism, South Africa, agri-tourism activities and attractions

viii
OPSOMMING
Die term agri-toerisme is ʼn relatiewe nuwe konsep in Suid-Afrika, en min boere is bewus van
wat presies dit behels. Agri-toerisme oorvleuel met verskeie ander toerismesektore, insluitende
ekotoerisme, landelike toerisme, wildlewe-/jag-toerisme, avontuur-toerisme, geotoerisme,
kulturele en erfenis-toerisme, en wyn-toerisme. Die meeste van hierdie industrieë het ʼn
natuurlike element en word op ʼn volhoubare wyse benader. Van die grootste voordele van agri-
toerisme sluit in boere wat ʼn bykomende inkomste verdien, meer werksgeleenthede vir die
plaaslike gemeenskap, ekonomiese voordele vir die plaaslike area, bewaring van die area se
natuurlike en kulturele elemente, en dit diversifiseer boerdery-aktiwiteite.
Die literatuuroorsig het verskeie studies geïdentifiseer wat op agri-toerisme regoor die wêreld
fokus, veral in die laaste dekade. Navorsing in Suid-Afrika oor agri-toerisme het die meeste
gefokus op area-spesifieke agri-toerisme soos wyn-toerisme in die Wes-Kaap, agri-feeste soos
die NAMPO Oesdag en agri-toerisme in Limpopo. Hierdie navorsingstudies was benader vanuit
ʼn aanbodperspektief (die boer) of van ʼn vraag-perspektief (die toeris). Geen studie is
identifiseer wat fokus op watter agri-toerisme-aktiwiteite/-aantreklikhede in Suid-Afrika, dus die
aanbodkant, beskikbaar is nie. Die doel van hierdie navorsing was dus om die grootte en
omvang van agri-toerisme in Suid-Afrika te bepaal deur die agri-toerisme-aktiwiteite/-
aantreklikhede wat boere op hulle plase aanbied, te ondersoek.
Hierdie doel is bereik deur middel van vier spesifieke doelwitte, naamlik om (1) teorieë en
tersaaklike literatuur oor toerisme en agri-toerisme in Suid-Afrika en in ander dele van die
wêreld te ontleed; (2) die landbousektor van Suid-Afrika te ontleed om die status van agri-
toerisme, wat dit behels, wat die verskillende provinsies vir toeriste kan bied, en die omvang
van die bydrae wat agri-toerisme tot ʼn Suid-Afrikaanse plaas maak, te bepaal, (3) ʼn opname te
maak ten einde die doelwitte van die navorsing te bereik deur die grootte en omvang van agri-
toerisme te bepaal en verskillende agri-toerisme-aktiwiteite in verskillende provinsies te
vergelyk, (4) gevolgtrekkings te maak oor die grootte en omvang van agri-toerisme in Suid-
Afrika en aanbevelings te maak vir boere en ander belanghebbendes in die bedryf te einde die
geleenthede wat hierdie sektor bied, te optimaliseer.
Die eerste literatuuroorsig (Hoofstuk 2) toon dat verskillende navorsers oor die jare verskillende
definisies vir agri-toerisme identifiseer het, maar dat nog geen universele definisie bestaan nie.
Vir die doel van hierdie studie word agri-toerisme gedefinieer as enige aktiwiteit of
aantreklikheid wat ʼn toeris toelaat om ʼn werkende/kommersiële plaas te besoek vir opvoeding,
genot of om aktief by die daaglikse aktiwiteite van die plaas betrokke te wees. Bernardo et al.
(2004:1) het vyf kategorieë identifiseer waarin alle agri-toerisme-aktiwiteite en -aantreklikhede

ix
verdeel kan word. Hierdie vyf kategorieë was die raamwerk vir die navorsing en het buitelug-
ontspanning, opvoedkundige ervarings, vermaak, gasvryheidsdienste, en direkte verkope op die
plaas ingesluit. Die literatuur het ook 84 verskillende soorte agri-toerisme-aktiwiteite/-
aantreklikhede regoor die wêreld identifiseer wat in hierdie vyf kategorieë verdeel is. Hierdie
aktiwiteite/aantreklikhede is as grondslag gebruik om agri-toerisme in Suid-Afrika te ondersoek.
Die tweede literatuuroorsig (Hoofstuk 3) het die landbou- en toerismesektore in Suid-Afrika
ondersoek. Verskeie dele van hierdie sektore is bespreek, maar die belangrikste onthulling was
dat die landbousektor 5.21% (2018) en die toerismesektor 4.35% (2016) tot Suid-Afrika se
werksgeleenthede bygedra het.
Die vraelys “Agri-toerisme in Suid-Afrika” is tussen Julie 2017 en Junie 2018 onder Suid-
Afrikaanse boere versprei. Die fisiese vraelyste is by verskeie landbougeleenthede, insluitende
die Agri SA-kongres, Agri Wes-Kaap se streekvergaderings, Agri Noord Kaap se
voorsittersvergadering, NAMPO Oesdag, AGRI 5-kommoditeitswerkswinkel en -uitstalling, Agri
Vrystaat se Jongboer-kongres, en die Aartappels SA-Kongres versprei. Die aanlynvraelys is
ontwerp deur Google Forms te gebruik, en die aanlyn-skakel tot die e-vraelys is deur verskeie
organisasies, insluitende Agri SA, TLU, Agri Wes-Kaap, Agri Mpumalanga, Agri Gauteng. Agri
Limpopo, Agri Vrystaat, VLVK, VVLU, Farmer’s Weekly (sosiale media), en Agri-tourism South
Africa aan boere versprei. Ander organisasies wat ook by die verspreiding van die vraelys
betrokke was, sluit in Grootplaas (kykNET), RSG Radiostasie, NWU TREES en OVK
Nuustydskrif. ʼn Totaal van 557 bruikbare vraelyste is van boere reg oor die land ingesamel.
Data van die e-vraelys wat deur Google Forms ingesamel is, is uitgevoer na Microsoft® Office
Excel 2016. Die vraelyste wat deur fisiese verspreiding ingesamel is, is in dieselfde Microsoft®
Office Excel-blad ingevoer. Laastens is al die data ontleed deur die Statistiese Pakket vir die
Sosiale Wetenskappe (SPSS) te gebruik.
Sleutelbevindinge in die literatuur het verskillende agri-toerisme-metodes, -voordele en -nadele
regoor die wêreld identifiseer. Alhoewel sommige van hierdie bevindings nie op Suid-Afrika van
toepassing is nie, kan baie van die teorieë, byvoorbeeld die motivering vir boere om agri-
toerisme in ʼn Suid-Afrikaanse konteks aan te bied, ondersoek word.
Sleutelbevindinge uit die resultate van die opname het ʼn profiel van die gemiddelde Suid-
Afrikaanse boer verskaf. Dit het ook verskeie gapings in die landbou- en toerismesektore
identifiseer wat deur agri-toerisme gevul en verbeter kan word. Alhoewel 76% van die
respondente aangedui het dat hulle geen vorm van agri-toerisme op hulle plase aanbied nie, is
die volgende agri-toerisme-aktiwiteite/-aantreklikhede die meeste in Suid-Afrika aangebied,
insluitende (in alfabetiese volgorde) bergklim, jag, kampering, piekniek, plaastoere,

x
plaasverblyf/-akkommodasie, restaurante, sosiale geleenthede, stap-/natuurroetes, troues en
spesiale geleenthede, veldvoertuie/4x4 roetes, visvang, voëlkyk, wateraktiwiteite, en wildlewe
en fotografie. In terme van uitbreiding het boere plaasverblyf/-akkommodasie, wildlewe en -
fotografie, stap-/natuurroetes; fietsry, en voëlkyk as aktiwiteite/-aantreklikhede wat hulle in die
volgende vyf jaar op hulle plase sou implementeer, geïdentifiseer.
Die resultate van die studie kan gebruik word om agri-toerisme in Suid-Afrika te verbeter en te
ontwikkel. Een van die grootste gapings wat deur die studie geïdentifiseer is, is onderwys – ʼn
gebrek aan kennis oor agri-toerisme. Baie boere is nie bewus van die geleenthede wat agri-
toerisme bied nie. Hulle is ook nie bewus van die ondersteuningsisteme wat hulle kan help met
die implementering en bestuur van agri-toerisme op ʼn volhoubare wyse nie. Alhoewel verskeie
organisasies met agri-toerisme kan help, is daar ook ʼn groot gaping in inligting wat aan boere
gebied word. Soortgelyke navorsing wat ook op agri-toerisme in Suid-Afrika gedoen kan word,
sluit in om ʼn bemarkingsmodel vir beide plaaslike en internasionale markte te ontwikkel, om ʼn
model vir die volhoubare implementering van agri-toerisme op ʼn plaas te ontwikkel, of selfs om
die finansiële bydrae wat agri-toerisme tot ʼn plaas maak, te bepaal.
Sleutelwoorde: toerisme, landbou, agri-toerisme, Suid Afrika, agri-toerisme-aktiwiteite en -
aantreklikhede

xi
TABLE OF CONTENTS
FINANCIAL ASSISTANCE ........................................................................................................ I
ACKNOWLEDGEMENTS ......................................................................................................... II
ABSTRACT .............................................................................................................................. V
OPSOMMING ........................................................................................................................ VIII
LIST OF TABLES .................................................................................................................. XIX
LIST OF FIGURES ................................................................................................................ XXII
CHAPTER 1: INTRODUCTION AND PROBLEM STATEMENT ............................................... 1
1.1 INTRODUCTION .............................................................................................................. 1
1.2 BACKGROUND TO THE STUDY .................................................................................... 3
1.3 PROBLEM STATEMENT ................................................................................................. 8
1.4 GOAL OF THE STUDY .................................................................................................... 9
1.4.1 Goal ............................................................................................................. 9
1.4.2 Objectives ............................................................................................................. 9
1.5 RESEARCH DESIGN ...................................................................................................... 9
1.6 METHOD OF RESEARCH ............................................................................................. 10
1.6.1 Literature study ................................................................................................... 10
1.6.2 Empirical survey ................................................................................................. 10
1.6.2.1 Methods of collecting data .................................................................. 10
1.6.2.2 Sampling ............................................................................................. 11
1.6.2.3 Development of measuring instrument ................................................ 12
1.6.2.4 Survey and collection of data .............................................................. 13
1.6.2.5 Data analysis ...................................................................................... 14
1.7 DEFINING THE CONCEPTS ......................................................................................... 14
1.7.1 Tourist ........................................................................................................... 14
1.7.2 Tourism ........................................................................................................... 15
xii
1.7.3 Agriculture and commercial farms ....................................................................... 17
1.7.4 Agri-tourism ........................................................................................................ 18
1.7.5 Size and scope ................................................................................................... 23
1.8 CHAPTER CLASSIFICATION ....................................................................................... 23
CHAPTER 2: AN OVERVIEW OF AGRI-TOURISM ............................................................... 25
2.1 INTRODUCTION ............................................................................................................ 25
2.2 UNDERSTANDING AGRI-TOURISM............................................................................. 26
2.2.1 Defining agri-tourism ........................................................................................... 26
2.2.2 An agri-tourism typology ..................................................................................... 28
2.2.2.1 Non-working farm agri-tourism ............................................................ 29
2.2.2.2 Working farm, passive contact agri-tourism ......................................... 30
2.2.2.3 Working farm, indirect contact agri-tourism ......................................... 30
2.2.2.4 Working farm, direct contact, staged agri-tourism ............................... 30
2.2.2.5 Working farm, direct contact, authentic agri-tourism ............................ 30
2.2.3 An agri-tourism system model and marketing ..................................................... 31
2.2.4 The history of agri-tourism in South Africa .......................................................... 32
2.2.4.1 Wine tourism in South Africa ............................................................... 33
2.3 DEFINING AGRI-TOURISM ACTIVITIES ...................................................................... 35
2.3.1 Outdoor recreation .............................................................................................. 36
2.3.2 Educational experiences ..................................................................................... 40
2.3.3 Entertainment ..................................................................................................... 42
2.3.4 Hospitality services ............................................................................................. 42
2.3.5 On-farm direct sales ............................................................................................ 43
2.4 ADVANTAGES AND DISADVANTAGES OF AGRI-TOURISM ..................................... 44
2.4.1 Advantages of agri-tourism ................................................................................. 44
2.4.2 Disadvantages of agri-tourism ............................................................................ 47
2.5 PREVIOUS STUDIES/RESEARCH ON AGRI-TOURISM .............................................. 49

xiii
2.6 AGRI-TOURISM AROUND THE WORLD ...................................................................... 54
2.6.1 Examples of agri-tourism from the United States and Canada ............................ 55
2.6.2 Examples of agri-tourism from Australia and New Zealand ................................ 58
2.6.3 Examples of agri-tourism in Europe ................................................................... 60
2.6.4 Examples of agri-tourism in Asia ........................................................................ 63
2.7 CONCLUSION ............................................................................................................... 64
CHAPTER 3: AN ANALYSIS OF AGRICULTURE AND TOURISM IN THE NINE SOUTH AFRICAN PROVINCES .......................................................................................................... 66
3.1 INTRODUCTION ............................................................................................................ 66
3.2 BACKGROUND TO SOUTH AFRICA ........................................................................... 66
3.2.1 Employment in South Africa ................................................................................ 69
3.2.1.1 Employment per province ................................................................... 69
3.2.1.2 Employment in the agriculture sector .................................................. 70
3.2.1.3 Employment in the tourism sector ....................................................... 73
3.3 AGRICULTURE SECTOR IN SOUTH AFRICA ............................................................. 74
3.3.1 Statistical background ......................................................................................... 75
3.3.2 Economic aspects ............................................................................................... 77
3.3.2.1 Providers of financial services ............................................................. 79
3.3.3 Agriculture associations, role players, and shows ............................................... 80
3.4 COMMERCIAL FARMING IN SOUTH AFRICA ............................................................. 83
3.4.1 Commercial farmers ............................................................................................ 83
3.4.2 Types of farming activities ................................................................................... 86
3.4.2.1 Dairy ................................................................................................... 86
3.4.2.2 Poultry ................................................................................................ 86
3.4.2.3 Game .................................................................................................. 86
3.4.2.4 Crops .................................................................................................. 87
3.4.2.5 Livestock ............................................................................................. 87

xiv
3.4.2.6 Animal products .................................................................................. 87
3.4.2.7 Mixed products.................................................................................... 87
3.4.2.8 Horticulture crops ................................................................................ 87
3.4.2.9 Horticulture products ........................................................................... 87
3.4.2.10 Other ................................................................................................... 87
3.4.3 Production in South Africa ................................................................................... 88
3.4.3.1 South African imports .......................................................................... 89
3.4.3.2 South African exports .......................................................................... 90
3.5 TOURISM IN SOUTH AFRICA ...................................................................................... 90
3.5.1 South Africa’s strengths and weaknesses in competitiveness ............................. 92
3.5.2 Tourism spending in South Africa ....................................................................... 93
3.5.3 Tourism products ................................................................................................ 94
3.5.4 Visitor information centres ................................................................................... 95
3.5.5 Tourism and agriculture – an agri-tourism route .................................................. 96
3.6 A BREAKDOWN OF AGRICULTRE AND TOURISM IN THE NINE PROVINCES OF SOUTH AFRICA ..................................................................................................................... 97
3.6.1 KwaZulu-Natal .................................................................................................... 97
3.6.1.1 Agriculture ........................................................................................... 97
3.6.1.2 Tourism ............................................................................................... 98
3.6.2 Mpumalanga ....................................................................................................... 98
3.6.2.1 Agriculture ........................................................................................... 98
3.6.2.2 Tourism ............................................................................................... 99
3.6.3 Limpopo ........................................................................................................... 99
3.6.3.1 Agriculture ......................................................................................... 100
3.6.3.2 Tourism ............................................................................................. 101
3.6.4 Gauteng ......................................................................................................... 101
3.6.4.1 Agriculture ......................................................................................... 101
3.6.4.2 Tourism ............................................................................................. 102

xv
3.6.5 North-West ....................................................................................................... 102
3.6.5.1 Agriculture ......................................................................................... 102
3.6.5.2 Tourism ............................................................................................. 103
3.6.6 Free State ......................................................................................................... 103
3.6.6.1 Agriculture ......................................................................................... 104
3.6.6.2 Tourism ............................................................................................. 104
3.6.7 Eastern Cape .................................................................................................... 105
3.6.7.1 Agriculture ......................................................................................... 105
3.6.7.2 Tourism ............................................................................................. 106
3.6.8 Northern Cape .................................................................................................. 106
3.6.8.1 Agriculture ......................................................................................... 106
3.6.8.2 Tourism ............................................................................................. 107
3.6.9 Western Cape ................................................................................................... 107
3.6.9.1 Agriculture ......................................................................................... 107
3.6.9.2 Tourism ............................................................................................. 108
3.7 CONCLUSION ............................................................................................................. 109
CHAPTER 4: EMPIRICAL RESULTS ................................................................................... 110
4.1 INTRODUCTION .......................................................................................................... 110
4.2 METHOD OF RESEARCH ........................................................................................... 110
4.2.1 Research design and method of collecting data ................................................ 110
4.3 DISCUSSION OF RESULTS ....................................................................................... 112
4.3.1 Background of respondents .............................................................................. 112
4.3.1.1 Gender .............................................................................................. 112
4.3.1.2 Age groups ....................................................................................... 113
4.3.1.3 Highest level of education ................................................................. 114
4.3.1.4 Generation farmer ............................................................................. 115
4.3.1.5 Age first exposed to farming .............................................................. 115

xvi
4.3.1.6 Age at which respondents decided to become farmers ..................... 116
4.3.1.7 Number of years actively farming ...................................................... 117
4.3.1.8 Member of a tourism society ............................................................. 118
4.3.1.9 South African farmer’s profile (summary) .......................................... 119
4.3.2 Farm statistics ................................................................................................... 120
4.3.2.1 Number of farms owned by farmers in KwaZulu-Natal ...................... 120
4.3.2.2 Number of farms owned by farmers in Mpumalanga ......................... 120
4.3.2.3 Number of farms owned by farmers in Limpopo ................................ 121
4.3.2.4 Number of farms owned by farmers in Gauteng ................................ 121
4.3.2.5 Number of farms owned by farmers in the North-West ...................... 122
4.3.2.6 Number of farms owned by farmers in the Free State ....................... 123
4.3.2.7 Number of farms owned by farmers in the Eastern Cape .................. 123
4.3.2.8 Number of farms owned by farmers in the Northern Cape ................ 124
4.3.2.9 Number of farms owned by farmers in the Western Cape ................. 124
4.3.2.10 Size of farms ..................................................................................... 125
4.3.2.11 Type of ownership ............................................................................. 127
4.3.2.12 Number of full-time employees on the farm ....................................... 127
4.3.2.13 Farming activities .............................................................................. 129
4.3.2.14 Summary of the South African farm profile ........................................ 130
4.3.3 Agri-tourism characteristics ............................................................................... 130
4.3.3.1 Number of employees involved in agri-tourism .................................. 130
4.3.3.2 Years hosting agri-tourism activities on the farm ............................... 131
4.3.3.3 Motivation for implementing agri-tourism ........................................... 134
4.3.3.4 The importance of different marketing media to promote agri-tourism 135
4.3.3.5 Target market ................................................................................... 136
4.3.3.6 Sizes of groups that respondents could accommodate on farms ....... 137
4.3.3.7 Annual income from agri-tourism activities or attractions ................... 138
4.3.4 Current state of agri-tourism in South Africa...................................................... 139

xvii
4.3.4.1 Outdoor recreation ............................................................................ 139
4.3.4.2 Educational experiences ................................................................... 142
4.3.4.3 Entertainment ................................................................................... 144
4.3.4.4 Hospitality services ........................................................................... 145
4.3.4.5 Direct sales on the farm .................................................................... 146
4.3.5 Future expansion of agri-tourism in South Africa ............................................... 146
4.3.5.1 Outdoor recreation ............................................................................ 146
4.3.5.2 Educational experiences ................................................................... 148
4.3.5.3 Entertainment ................................................................................... 149
4.3.5.4 Hospitality services ........................................................................... 150
4.3.5.5 Direct sales on the farm .................................................................... 150
4.3.6 Farmers’ feedback ............................................................................................ 151
4.3.6.1 Planning expansions in the future ..................................................... 151
4.3.6.2 Suggestions on how to promote agri-tourism in South Africa ............ 152
4.4 CONCLUSION ............................................................................................................. 153
CHAPTER 5: CONCLUSIONS AND RECOMMENDATIONS ............................................... 154
5.1 INTRODUCTION .......................................................................................................... 154
5.2 CONCLUSIONS ........................................................................................................... 155
5.2.1 Key findings in the literature .............................................................................. 155
5.2.2 Key findings in the survey results ...................................................................... 159
5.3 RECOMMENDATIONS ................................................................................................ 163
5.3.1 Recommendations from the study ..................................................................... 163
5.3.1.1 Recommendations for the South African Government....................... 163
5.3.1.2 Recommendations for Agri SA and similar organisations .................. 164
5.3.1.3 Recommendations for farmers .......................................................... 165
5.3.2 Recommendations for future studies ................................................................. 165
5.4 LIMITATIONS OF THE STUDY ................................................................................... 166

xviii
5.5 CONCLUSION ............................................................................................................. 166
REFERENCE LIST ............................................................................................................... 167
APPENDIX A: STATEMENT BY LANGUAGE EDITOR ....................................................... 183
APPENDIX B: QUESTIONNAIRE ......................................................................................... 184

xix
LIST OF TABLES
Table 1.1: Primary and secondary tourism aspects ................................................................. 16
Table 1.2: The main sectors of the tourism industry ................................................................ 17
Table 2.1: Wine production over the world............................................................................... 34
Table 2.2: Previous research on agri-tourism .......................................................................... 49
Table 3.1: Employment per province ....................................................................................... 70
Table 3.2: Key labour market indicators .................................................................................. 71
Table 3.3: Employment in the agriculture sector (2012-2017) .................................................. 72
Table 3.4: Labour force characterised by gender in the agriculture sector (2012-2017) ........... 72
Table 3.5: Agriculture employment per province (2012-2017).................................................. 73
Table 3.6: Employment in the tourism sector (2012-2016) ....................................................... 74
Table 3.7: Land utilisation in South Africa ................................................................................ 76
Table 3.8: Gross value of agricultural production ..................................................................... 78
Table 3.9: Associations and bodies providing financial services in South Africa ...................... 80
Table 3.10: National associations involved in agriculture in South Africa ................................. 81
Table 3.11: Provincial agricultural role players ........................................................................ 81
Table 3.12: Agricultural shows and conferences...................................................................... 82
Table 3.13: Personal characteristics of commercial farmers .................................................... 83
Table 3.14: Farm characteristics among commercial farmers .................................................. 84
Table 3.15: South Africa’s tourism performance in 2017 .......................................................... 91
Table 3.16: Percentage of tourist trips per province ................................................................. 92
Table 3.17: Agricultural production in KwaZulu-Natal (2016/2017) .......................................... 97
Table 3.18: Agricultural production in Mpumalanga (2016/2017) ............................................. 99
Table 3.19: Agricultural production in Limpopo (2016/2017) .................................................. 100

xx
Table 3.20: Agricultural production in Gauteng (2016/2017) .................................................. 101
Table 3.21: Agricultural production in the North-West Province (2016/2017) ......................... 103
Table 3.22: Agricultural production in the Free State (2016/2017) ......................................... 104
Table 3.23: Agricultural production in the Eastern Cape (2016/2017) .................................... 105
Table 3.24: Agricultural production in the Northern Cape (2016/2017) .................................. 106
Table 3.25: Agricultural production in the Western Cape (2016/2017) ................................... 108
Table 4.1: Physical questionnaire distribution ........................................................................ 111
Table 4.2: Online questionnaire distribution ........................................................................... 111
Table 4.3: Completed questionnaires received per province ................................................. 112
Table 4.4: Highest level of education ..................................................................................... 114
Table 4.5: Generation farmer................................................................................................. 115
Table 4.6: Tourism associations and organisations in South Africa ....................................... 118
Table 4.7: Number of farms owned by farmers in KwaZulu-Natal .......................................... 120
Table 4.8: Number of farms owned by farmers in Mpumalanga ............................................. 121
Table 4.9: Number of farms owned by farmers in Limpopo .................................................... 121
Table 4.10: Number of farms owned by farmers in Gauteng .................................................. 122
Table 4.11: Number of farms owned by farmers in the North-West Province ......................... 122
Table 4.12: Number of farms owned by farmers in the Free State ......................................... 123
Table 4.13: Number of farms owned by farmers in the Eastern Cape .................................... 123
Table 4.14: Number of farms owned by farmers in the Northern Cape .................................. 124
Table 4.15: Number of farms owned by farmers in the Western Cape ................................... 125
Table 4.16: Average sizes of farms in South Africa ............................................................... 125
Table 4.17: Average size of farms per province ..................................................................... 126
Table 4.18: Average number of full-time employees per farmer ............................................. 128
Table 4.19: Average number of full-time employees per farm (smaller than 10 000
hectares) ........................................................................................................... 128
Table 4.20: Types of farming activities .................................................................................. 129

xxi
Table 4.21: Years hosting agri-tourism per province .............................................................. 133
Table 4.22: Farmers’ motivation for implementing agri-tourism in South Africa ...................... 134
Table 4.23: The importance of marketing media to promote agri-tourism .............................. 136
Table 4.24: Sizes of groups that respondents could accommodate on farms ....................... 138
Table 4.25: Annual income generated from agri-tourism activities or attractions ................... 139
Table 4.26: Outdoor recreation .............................................................................................. 147
Table 4.27: Educational experiences ..................................................................................... 149
Table 4.28: Entertainment ..................................................................................................... 149
Table 4.29: Hospitality service ............................................................................................... 150
Table 4.30: Direct sales on the farm ...................................................................................... 150
Table 4.31: Planning future expansions in agri-tourism ......................................................... 151

xxii
LIST OF FIGURES
Figure 1.1: The distribution of agri-tourism between a demand and supply side ........................ 4
Figure 1.2: Agri-tourism in the tourism industry ....................................................................... 19
Figure 2.1: A typology for defining agri-tourism ....................................................................... 29
Figure 2.2: An agri-tourism system model ............................................................................... 31
Figure 2.3: History of agri-tourism in South Africa .................................................................... 35
Figure 3.1: Estimated South African population from 2003 to 2018, per province .................... 68
Figure 3.2: Percentage size of each province in South Africa .................................................. 69
Figure 3.3: Percentage change in agricultural production from 2015/16 – 2016/17 .................. 75
Figure 3.4: Percentage of households involved in agriculture activities by province, 2015 ....... 77
Figure 3.5: Total income by type of product ............................................................................. 79
Figure 3.6: Production of commodities in South Africa (1) ....................................................... 88
Figure 3.7: Production of commodities in South Africa (2) ....................................................... 89
Figure 3.8: Tourism spending per province .............................................................................. 94
Figure 3.9: Tourism product distribution .................................................................................. 95
Figure 3.10: Visitor information centres ................................................................................... 96
Figure 4.1: Gender of respondents ........................................................................................ 113
Figure 4.2: Age groups of respondents .................................................................................. 114
xxiii
Figure 4.3: Age at which respondents were first exposed to farming ..................................... 116
Figure 4.4: Age at which respondents decided to become farmers ........................................ 117
Figure 4.5: Number of years actively farming ........................................................................ 118
Figure 4.6: Member of a tourism society ................................................................................ 119
Figure 4.7: Type of farm ownership ....................................................................................... 127
Figure 4.8: Average number of full-time agri-tourism employees ........................................... 131
Figure 4.9: Total number of years hosting agri-tourism .......................................................... 132
Figure 4.10: Number of years hosting agri-tourism per province ............................................ 133
Figure 4.11: Agri-tourism target market per province ............................................................. 137
Figure 4.12: Outdoor recreation (1) ....................................................................................... 140
Figure 4.13: Outdoor recreation (2) ....................................................................................... 141
Figure 4.14: Outdoor recreation (3) ....................................................................................... 141
Figure 4.15: Educational experiences (1) .............................................................................. 142
Figure 4.16: Educational experiences (2) .............................................................................. 143
Figure 4.17: Entertainment .................................................................................................... 144
Figure 4.18: Hospitality service .............................................................................................. 145
Figure 4.19: Direct sales on the farm ..................................................................................... 146

1
CHAPTER 1: INTRODUCTION AND PROBLEM STATEMENT
1.1 INTRODUCTION
Tourism can be seen throughout history as it has evolved into different sectors. The earliest
form of tourism is recorded as large groups of people travelling together as pilgrims, migrants
and nomads, and smaller groups such as business traders and scholars travelling together
(Leiper, 2004:4). Singh (2012:2) believes that a person’s need to wander around and to seek
out new places has always been a part of human nature. Lately, tourists have been travelling
more for pleasure, and in the process, tourist destinations have emerged (Mason, 2008:25).
Currently, tourism is one of the fastest growing industries in the world and is described as the
largest industry (George, 2007:3; Muchapondwa & Stage, 2013:80; Saayman, Saayman &
Rhodes, 2001:443).
The tourism industry has many advantages to offer. For example, it contributes to the gross
domestic product (GDP), diversifies the local economy, raises national income, and creates job
opportunities (Booyens, 2012:112). However, tourism also has disadvantages that can have a
negative effect on a country, such as inflation, opportunity cost, seasonality of demand and
supply, the tax income that an area earns from tourists that may not be sufficient to improve the
infrastructure for tourism in the area, and tourism development that takes place only in certain
areas, which can lead to geographic economic distortion (Saayman, 2013:144; Vanhove,
2005:13). Rogerson (2002:150) points out that tourism still plays a significant role and should be
appreciated, especially because of the positive economic effect it has on the host country,
including South Africa. Akinboade and Braimoh (2010:169) agree that tourism contributes to
sustainable economic growth, especially in developing countries. Meyer and Meyer (2015:211)
identify local economic development as the main goal of many organisations, which requires
focused and integrated local policies and strategies. One of the main strategies for local
economic development is the tourism industry. Components such as training, access to finding
and providing incentives to support local small business development are part of the tourism
strategy.
Over the years, there has been significant growth in the disciplinary focuses covered by tourism
journals (Cheng, Li, Petrick & O’Leary, 2011:56). While only 17 disciplinary focuses were
published before 1970, over 26 disciplinary focuses were covered after 1991, which indicates
more diverse tourism research (Cheng et al., 2011:56). Ateljevic et al. (2012:11) support this
tremendous growth in the tourism research field. Not only was there a growth in the number of
tourism-related programmes that higher education institutions have to offer, but there are also
about 150 tourism-related journals today, of which half were established within the last decade
2
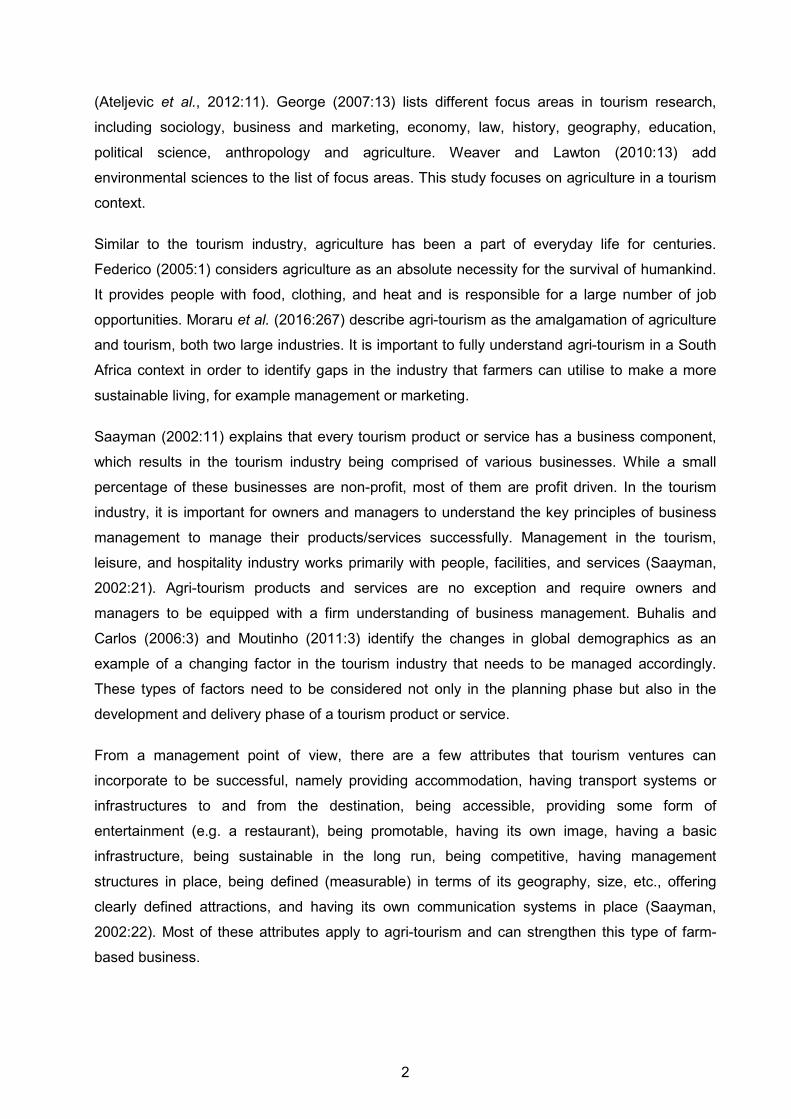
(Ateljevic et al., 2012:11). George (2007:13) lists different focus areas in tourism research,
including sociology, business and marketing, economy, law, history, geography, education,
political science, anthropology and agriculture. Weaver and Lawton (2010:13) add
environmental sciences to the list of focus areas. This study focuses on agriculture in a tourism
context.
Similar to the tourism industry, agriculture has been a part of everyday life for centuries.
Federico (2005:1) considers agriculture as an absolute necessity for the survival of humankind.
It provides people with food, clothing, and heat and is responsible for a large number of job
opportunities. Moraru et al. (2016:267) describe agri-tourism as the amalgamation of agriculture
and tourism, both two large industries. It is important to fully understand agri-tourism in a South
Africa context in order to identify gaps in the industry that farmers can utilise to make a more
sustainable living, for example management or marketing.
Saayman (2002:11) explains that every tourism product or service has a business component,
which results in the tourism industry being comprised of various businesses. While a small
percentage of these businesses are non-profit, most of them are profit driven. In the tourism
industry, it is important for owners and managers to understand the key principles of business
management to manage their products/services successfully. Management in the tourism,
leisure, and hospitality industry works primarily with people, facilities, and services (Saayman,
2002:21). Agri-tourism products and services are no exception and require owners and
managers to be equipped with a firm understanding of business management. Buhalis and
Carlos (2006:3) and Moutinho (2011:3) identify the changes in global demographics as an
example of a changing factor in the tourism industry that needs to be managed accordingly.
These types of factors need to be considered not only in the planning phase but also in the
development and delivery phase of a tourism product or service.
From a management point of view, there are a few attributes that tourism ventures can
incorporate to be successful, namely providing accommodation, having transport systems or
infrastructures to and from the destination, being accessible, providing some form of
entertainment (e.g. a restaurant), being promotable, having its own image, having a basic
infrastructure, being sustainable in the long run, being competitive, having management
structures in place, being defined (measurable) in terms of its geography, size, etc., offering
clearly defined attractions, and having its own communication systems in place (Saayman,
2002:22). Most of these attributes apply to agri-tourism and can strengthen this type of farm-
based business.

3
A successful management strategy also includes a well-rounded marketing strategy. To attract
tourists to the farmer's land successfully, the farmer/manager needs to display a positive image
of the farm and the activity or attraction. Saayman (2001:197) lists eight dimensions that tourists
look for in a tourism ventures’ image, namely integrity, innovation, service, social responsibility,
imagination/creativity, quality, value for money, and reliability. Several components can be used
to ensure a positive image of the agri-tourism activity or attraction, including the efficacy of the
farm, being client orientated, displaying the magic of the farm, successful branding, the sensory
effect of the farm, the history of the farm, the virtue of the farm, and the atmosphere that is
created by the farm.
This chapter provides a background to the study on agri-tourism, gives a clear problem
statement, and discusses the goal and objectives of the study. Furthermore, the research
design and method of research are discussed in detail to ensure that the research method is
efficient and relevant to the study. Some terms will be defined to understand the context in
which those words will be used throughout the study. Finally, a chapter classification provides a
layout of the elements of the study.
1.2 BACKGROUND TO THE STUDY
Tibane (2016:vi) identifies six key economic sectors in South Africa, namely the mining service,
transport, energy, manufacturing, tourism and agriculture. According to the 2017 budget review
(National Treasury, 2017:23), tourism accounts for 4.5% of the total employment in South
Africa. It is also stated that expanding the tourism industry would be beneficial to South Africa,
as it continues to create a large number of job opportunities. The White Paper on the
Development and Promotion of Tourism in South Africa (South Africa, 1996) provides a list of
reasons why tourism has a positive effect on different sectors in the economy. The most
important reasons include tourism as the largest creator of job opportunities in the world that
can provide immediate employment; the industry created numerous opportunities for
entrepreneurship; it develops rural areas; it has the power to build cross-cultural relations; it has
a multiplier effect; and South African tourism is already a global leader.
According to Raghunandan et al. (cited by Myer & De Crom, 2013:298), there is a definite gap
in education among children about human dependence on the environment and the importance
of food production for which farmers are responsible. Agri-tourism can help to bridge this gap. It
may help people understand the significant contribution that agriculture makes to a country by
educating them on the importance of food security, as well as increase awareness of food
production in societies. Petroman et al. (2016:83) describe agri-tourism as an “incredible
educational tool with varied expected effects on the education plan”. Agri-tourism can offer a
4
better understanding of the traditional rural cultures, agricultural processes such as production
and distribution, and how to preserve the environment.
The tourism industry is made up of different sectors that each contains its own elements. This
study focuses on the agri-tourism sector and the different elements it contains. Many
researchers have defined agri-tourism, but no universal definition exists yet. Rogerson and
Rogerson (2014:93) provide a simple definition of agri-tourism as “an evolving form of rural
tourism which is targeted at mainly urban consumers”. Research surrounding tourism and many
aspects such as local economic development has received significant attention over the years.
In the past decade, South Africa has seen considerable growth in scholarly research
surrounding the tourism industry (Rogerson & Rogerson, 2014:97). However, research that
focuses directly on agri-tourism activities, especially in South Africa, is limited (Rogerson &
Rogerson, 2014:93).
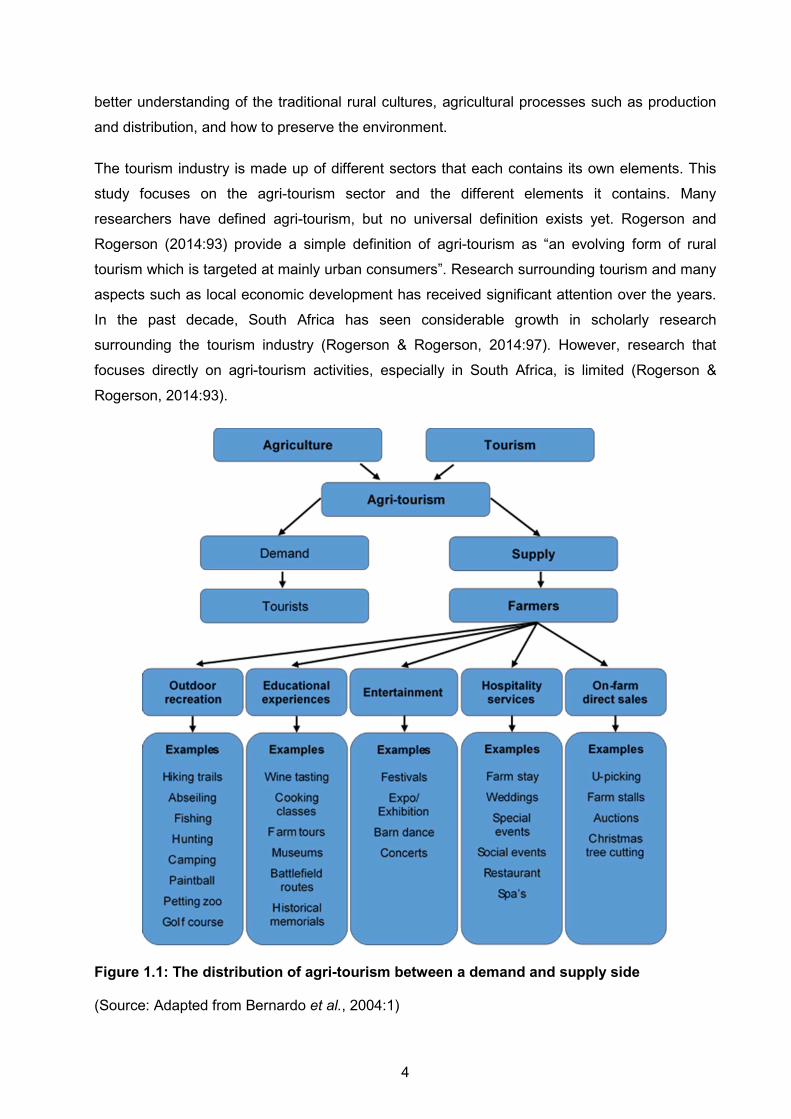
Figure 1.1: The distribution of agri-tourism between a demand and supply side
(Source: Adapted from Bernardo et al., 2004:1)

5
The tourism industry can be divided into the demand side and the supply side. Frechtling
(2001:4) defines tourism demand as “a measure of visitors’ use of a good or service”. Thus, it
focuses on tourists and their wants and needs. On the supply side, it can be any organisation or
business selling its products or service. This study refers to the tourism supply side as the
farmer or manager who hosts the agri-tourism activity or attraction on a farm. Figure 1.1
illustrates how the supply side of agri-tourism can be divided further into five categories that
farmers can host on their farms, namely outdoor recreation, educational experiences,
entertainment, hospitality services, and on-farm direct sales. These five categories comprise the
different agri-tourism activities and attractions that farmers can host on their farms.
One of the few publications in South Africa that focus on agri-tourism and agri-tourism activities
was led by researcher Tifflin (2005:1), who focuses on agri-tourism in KwaZulu-Natal. Tifflin
(2005:4) identifies agri-tourism activities such as the Royal Agricultural Show in KwaZulu-Natal,
as well as the Midlands Meander destination. Popular activities located in the Eston area
include strawberry picking, rides and picnicking. Other agri-tourism activities on the East
Griqualand farms include trout fishing, hiking, 4x4 driving, and accommodation establishments.
This research paper provides a summary of agri-tourism activities in the area. By listing the
activities that farms host on their farms, the researcher focuses on the supply side of agri-
tourism. However, there is still a large gap in understanding what agri-tourism is in a South
African context and what contribution it makes to the country.
Other researchers such as Van der Merwe et al. (2013:16) draw attention to the Western Cape
by explaining the potential application of spatial computing technologies to support the planning
of agri-tourism. The research focuses primarily on the use of geographical information systems,
which is represented in a map format (Van der Merwe et al., 2013:31). A framework was
designed to identify the key features that were relevant to the spatial planning and modelling of
agri-tourism activities (Van der Merwe et al., 2013:21). The study identified key features of an
agri-tourism experience, namely access, accommodation, infrastructure and service, local
product value adding, consumption attractions recreational activities, natural attractions or
landscape aesthetics, and critical mass. Each of these features is controlled mainly by the
supply side, where farmers can change and contribute to each of these features. On the
demand side, these features should be in line with the tourists’ wants and needs; therefore, they
are also influenced by the tourist. The study concludes with a warning against the overuse of
tourism resources that are based in the Western Cape (Van der Merwe et al., 2013:31). This
conclusion is based on signs of stagnation and the decline of tourist interest in the destination
that is already showing in some regions in the province.

6
Also in the Western Cape, researchers investigated the establishment and growth of wine
tourism and the wine routes that expanded significantly during the past few decades. Ferreira
and Muller (2013:72) identify the Stellenbosch Wine Route as the oldest wine route in South
Africa and in terms of membership as the largest wine route in South Africa. The study
examines the evolution of the Stellenbosch Wine Route as well as the ability of some wineries
to be innovative and to diversify their wine tourism products. The study concludes that the
pairing of food and wine is a successful innovation that wineries have implemented (Ferreira &
Muller, 2013:82).
A different element of agri-tourism includes agri festivals such as the Nampo Harvest Day.
Fourie (2015:1) conducted a study to investigate the factors that influence visitor loyalty at
South African agri festivals. The study illustrates that the majority of the respondents who
attended these types of events were males between the ages of 25 and 34 years. They were
Afrikaans-speaking farmers with a gross income of between R221 001 and R305 000 (Fourie,
2015:179). This study allowed the researcher to make recommendations for the NAMPO
Harvest Day to enhance its visitor loyalty. Aspects such as agricultural exposure and edification;
lifestyle, escape and socialization; general management; price and quality of implements,
machinery and livestock; price and quality of food and beverages; signage and marketing;
amenities; networking and trade; as well as value were discussed (Fourie, 2015:182). Finally,
the conclusion was made that agri festivals that are managed correctly can have a large and
positive effect on the tourism industry in South Africa. This study focuses only on the demand
side of agri-tourism and what the tourist wants from an agri festival.
A large agri-tourism sector in South Africa is wildlife tourism (game farms). According to Kruger
et al. (2015:2), wildlife tourism is the largest tourism aspect in South Africa and contributes to
almost 80% of the tourism offerings of the country. The main enterprises of the wildlife industry
include trophy and recreational hunting, taxidermy, live wildlife sales, tourism, wildlife capture
and translocation, and meat products (Du P Bothma et al., 2016:85). According to Kruger,
Barrat and Van der Merwe (2015:2), most of these enterprises are located on privately owned
game farms and reserves. Du P Bothma et al. (2016:85) researched the economic value of the
wildlife industry in Southern Africa and found that it contributed R7.7 billion (or 9.8%) of South
Africa’s agriculture gross domestic product in 2010. The Game Theft Act, which allows private
ownership of wildlife, led to a growing industry. A large portion of South Africa’s wildlife farms
(ranches) is located in Limpopo. Other provinces that are home to wildlife farms include the
Northern Cape, North-West, and the Eastern Cape. According to Du P Bothma et al. (2016:86),
the largest wildlife farm in South Africa is located in the Northern Cape. Many researchers have
focused on research on the South African wildlife industry, including studies to determine the

7
economic significance of lion-breeding operations (Van der Merwe et al., 2017:314), the
evolution of scientific game ranching (Carruthers, 2008:160), the effect of hunting trips on the
hunters’ quality of live (Kruger et al., 2015:1), the potential of trophy hunting to create incentives
for wildlife conservation (Lindsey, Alexander, Frank, Mathieson & Romanach, 2015:283), trophy
hunting as a sustainable use of wildlife resources (Baker, 1997:306), and game ranching in the
Northern Province (Van Der Waal & Dekker, 2000:151).
Rogerson and Rogerson (2014:93) emphasise the importance of tourism in local economic
development. In a South African context, tourism is one of the priority industries for national
economic development. A national audit in 2014 identified 368 accommodation establishments
in South Africa that offer activities linked to agri-tourism (Rogerson & Rogerson, 2014:98). Most
of these establishments are located in the Western Cape (42.2%). Based on the results of
accommodation-linked agri-tourism activities, the leading agri-tourism destination in South
Africa is Stellenbosch in the Western Cape (Rogerson & Rogerson, 2014:99).
In a more recent study, Moraru et al. (2016:267) focused on determining the motivations and
challenges for entrepreneurs in agri-tourism. The study found that there are two basic motives
for farmers to be involved in agri-tourism ventures, namely economic and social motives.
However, the farmers that are involved in agri-tourism businesses face a number of challenges,
namely a lack of knowledge, a lack of experience among the farmers who run the tourism
business, limited marketing channels and linkages, expertise and training in the field of tourism,
and the necessity to develop new skills in order to manage tourists and their expectations. This
study identifies the motives behind the supply side of agri-tourism and why farms choose to be
involved in agri-tourism or not. Khanal and Mishra (2014:65) identify several factors that can
affect farmers’ drive towards agri-tourism, including the level of education and age of the farmer,
the financial condition of the farm, as well as the farm location. Ainley and Kline (2014:404)
describe agri-tourism as a traditional process that is built through business skills and
entrepreneurial capacities, including networks.
Nickerson et al. (2001:20) identify eleven “motivational reasons” in a literature review
concerning the diversification of a farm business. These reasons include fluctuations in
agricultural income, employment of family members, creating an additional income, loss in
government agriculture programmes, meeting the need in the recreation market, a tax incentive,
companionship with guests/users, its attraction as an interest or a hobby, better use of farm
resources, the success of other farm recreation businesses, and its education of the consumer.
From the consumers’ point of view, Myer and De Crom (2013:300) state that one of the primary
reasons why visitors are interested in participating in agri-tourism activities is to enhance their
knowledge. The general opinion is that people are not aware of how food is produced or where

8
it comes from. Agri-tourism creates the opportunity for visitors/tourists to meet producers and to
experience first-hand how their food is produced. Both the demand and supply sides of agri-
tourism were included in their study. Weaver (2004:518) describes the amalgamation of
research in the tourism industry and the agriculture industry as “essential”.
This concludes that only a few elements of agri-tourism have been researched in depth, from
either a tourism demand or a supply point of view. South African researchers have focused on
the demand side of specific tourism attractions or activities, for example, an agri festival such as
the Nampo Harvest Day. The same approach is used on the supply side, where researchers
focus on identifying what farmers have to offer in a specific region or area, for example, the East
Griqualand farms in KwaZulu-Natal or the wine route in the Western Cape. Most research on
agri-tourism in South Africa has focused on the Western Cape and wine tourism. To date, no
research has been conducted to determine the size and scope of agri-tourism in South Africa or
to identify the different agri-tourism activities that are available on farms in South Africa.
1.3 PROBLEM STATEMENT
With the focus on agri-tourism in South Africa, research can be conducted from a tourism
demand or from a tourism supply point of view. The purpose of this study is to determine the
size and scope of agri-tourism in South Africa; therefore, the focus was on the tourism supply
side to indicate what farmers are offering tourists on their farms. While researchers have
focused on agri-tourism activities and attractions in specific areas such as the Western Cape
and KwaZulu-Natal, no research that investigated the different agri-tourism activities and
attractions across the country was identified. Therefore, this raises the question of what South
Africa has to offer in terms of agri-tourism and what the different provinces offer in terms of agri-
tourism. While it can be assumed that some agri-tourism activities are more popular in certain
areas than in others, there is no existing research to support this.
Each province has a unique agricultural setup and farm characteristics or attributes that are
specific to the area. These characteristics or attributes need to be explored in order to
understand the agri-tourism activities and attractions that are located in an area. This identifies
a second problem, how to develop and maximise agri-tourism in South Africa if the current
status of this sector is unknown. Only once the size and scope have been determined, gaps in
the agri-tourism sector can be identified. This will lead to recommendations about how farmers
can include a tourism-based activity in a farm context to increase profits and awareness of the
farm. This can guide many farmers in troubling agricultural times to generate additional income
from their farms.

9
This research attempted to answer the following main question: What is the size and scope of
agri-tourism in South Africa?
1.4 GOAL OF THE STUDY
This study consisted of a main goal and four objectives that were designed to assist in reaching
the goal.
1.4.1 Goal
The goal of this study was to determine the size and scope of agri-tourism in all nine provinces
of South Africa.
1.4.2 Objectives
Objective 1 The first objective was to analyse theories and relevant literature concerning tourism and agri-
tourism in South Africa and in other parts of the world.
Objective 2 The second objective was to analyse the agriculture sector of South Africa to determine the
status of agri-tourism and what it included, as well as what the different provinces had to offer
tourists. This analysis would also determine the size of the contribution that agri-tourism made
to a farm in South Africa.
Objective 3 The third objective was to conduct a survey to achieve the goal of this research by determining
the size and scope of agri-tourism and to compare different agri-tourism activities in the nine
different provinces of South Africa.
Objective 4 The fourth objective was to draw conclusions concerning the size and scope of agri-tourism in
South Africa and to make recommendations for farmers and other stakeholders in the industry
to optimise the opportunities that this sector has to offer.
1.5 RESEARCH DESIGN
While agri-tourism is not a new phenomenon, defining agri-tourism is relatively new to the
literature. Firstly, two literature reviews were conducted in order to understand the state of agri-
tourism from literature perspective. The first literature review focused on agri-tourism and the
second literature review focused on tourism and agriculture in South Africa. Secondly, a

10
quantitative research method was used in order to achieve the goal of the study. Williams
(2007:65) explained that this method is used when numerical data is required from the
respondents. Further, a descriptive research approach was followed in order to analyse the
current state of agri-tourism (Williams, 2007:66). This was achieved through survey research
(Williams, 2007:67). Data was gathered from the respondents through the distribution of
questionnaires. The pre-constructed standardised questionnaire is a key element of quantitative
research (Yilmaz, 2013:131).
1.6 METHOD OF RESEARCH
A quantitative research method was used in this study.
1.6.1 Literature study
The literature study was conducted through different sources such as academic articles, internet
websites, books, and other academic sources were used to conduct the literature study.
Keywords in the study included tourism, agriculture, agri-tourism, and agri-tourism activities.
Different agri-tourism activities were determined to define the size of agri-tourism in general for
the literature study. These activities were then included in the research (empirical survey) to
determine the size of agri-tourism in South Africa. A variety of electronic databases such as
EBSCOhost, Google Scholar, Scopus, and Sabinet SA ePublications were used as sources of
academic articles to examine and understand the literature. Other keywords also included in the
search were commercial farms, South African agriculture, and agriculture history.
1.6.2 Empirical survey
This section explains when, where and how the primary data were collected to complete the
study and answer the research question successfully.
1.6.2.1 Methods of collecting data
The quantitative research was conducted by sending surveys that consists of a set of standard
questions with predetermined response options that is given to a large number of respondents
(Burns & Bush, 2014:146). For this study, primary data sources were used to conduct the
quantitative research (Jennings, 2001:64).
Three methods were used to collect data. All three methods used the exact same questionnaire
with the same questions are were given to the same population (farmers that live in the nine
provinces of South Africa). These three methods are further referred to as method 1, method 2
and method 3 as explained below:
11
Method 1: The questionnaire was converted to an electronic format using Google Forms. The
link to this e-questionnaire was then sent to respondents where they completed the
questionnaire online. To reach the respondents, different provincial affiliations of Agri SA
assisted in sending the link to the e-questionnaire per email to the farmers on their database.
Thus, only farmers (the population) received this link. Agri SA is a non-profit organisation that is
committed to the development of agriculture in South Africa. It consists of nine provincial and 24
commodity organisations. Each provincial organisation has its own database of farms in that
specific province (Agri SA, 2017).This questionnaire as active for twelve months. For this
method the data collected was computer administered (Burns & Bush, 2014:175). Around 80
questionnaires were collected through this method.
Method 2: For this method the physical questionnaire was distributed at different agriculture
events across the country. At most of these events, the organisers assisted and took
responsibility for the questionnaire distribution and collection. The data collected was self-
administered (Burns & Bush, 2014:175). Over 200 questionnaires were collected through this
method.
Method 3: Similar to method 2, this method was also self-administered using physical
questionnaire distribution (Burns & Bush, 2014:175). In this method, questionnaires were
distributed at NAMPO Harvest Day. Since this is South Africa’s largest agriculture show, a very
large number of farmers attend the event. A team of fieldworkers attended the trade show for
four days. While the event focussed on agricultural elements, it is very popular and a screening
question was very important to ensure accurate results. Almost 250 questionnaires were
collected at this event.
1.6.2.2 Sampling
The research was conducted on a national level throughout South Africa to include commercial
farmers in all nine provinces of South Africa. The population of this research can be defined as
all commercial farms in South Africa. According to Statistics South Africa (2007:3), there are 39
966 active farms in South Africa’s commercial sector. However, many of the farmers own more
than one farm. Thus, while there are almost 40 000 active farms in the country, it is not a
realistic reflection of the sample, which will be significantly smaller. According to Krejcie and
Morgan (1970:608) a sample size of 380 is sufficient for a population of 40 000. Therefore, the
total of 557 questionnaires received are more than efficient for accurate and credible results.
A non-probability sampling method was used. According to Burns and Bush (2014, 254), a non-
probability sampling is based on a selection process that is bias in order to reduce the cost of
sampling. More specifically, a convenience (non-probability) sampling method was used for this

12
research. High-traffic locations, such as agricultural events and conferences were used as a
sample frame (Burns & Bush, 2014:255). This method was controlled by asking a screening
question to each respondent before they completed the questionnaire, namely: “Are you a
commercial farmer?”
1.6.2.3 Development of measuring instrument
A newly designed questionnaire was developed for this research. Based on the goal of the
study, different sections of the questionnaire was designed. As no research has been
conducted on this specific topic before, the questionnaire is a new initiative. First,
demographical questions were asked to determine the context of the farm. This included
questions about the geography and topography of the farm, as well as the province in which the
farm is located. In the literature review (Chapter 2), agri-tourism activities were defined
(Bernardo, Valentin & Leatherman, 2004:1; Chikuta & Makacha, 2016:106; Kukorelli, 2001:23;
Pittman, 2006:5; Roberts & Hall, 2001:2; Sharpley & Sharpley, 1997:8; Van der Merwe &
Rogerson, 2018:189). These activities were then included in the questionnaire. Therefore, it
was important to give clear definitions in the literature review. Most activity-based questions
were closed questions where the respondent only had to select the activities that were based on
their farms. The financial contribution that agri-tourism made to a commercial farm was
determined by using an interval scale, which made it easier for farmers to answer the question.
Once the questionnaire was drafted completely, it was sent to personnel at Agri SA for input. It
was important to view the questionnaire from a different perspective, for instance, the
perspective of an individual who worked closely with farmers. Feedback from Agri SA indicated
the no changes had to be made to the draft questionnaire. A detailed discussion of the
questionnaire is given in 4.2.2 (questionnaire development).
The questionnaire consisted of four sections:
Section A: Information of farmers and farm
This sector determined the demographic (background) information of the respondents (farmers)
in South Africa, including the gender, age, generation farmer, age of fist exposure to farming,
age the respondent decided to become a farmer, years actively farming, and whether the
participant is part of a tourism society. This section also determined the profile of the farm,
including the number of farms owned in each province, total size of the farms, type of
ownership, number of full-time employees and number of employees involved in agri-tourism
activities. The last question is based on a Likert scale to determine to which extent various
farming activities are represented on the farm.

13
Section B: Agri-tourism activities
This section focused on agri-tourism and agri-tourism elements. The first questions determines
how long farmers have been hosting agri-tourism activities on their farm. This also serves as a
screening question to the respondents if they need to complete the section. Based on a Likert
scale, respondents were asked to indicate how important a list of reasons were in their decision
to offer agri-tourism. A list of all the activities/ attractions that were identified were given where
respondents were asked to indicate what activities/ attractions they are currently hosting on
their farms. Finally, another Likert scale was used so that respondents could indicate to which
extent they consider implementing items on the same list of agri-tourism activities/ attractions.
Section C: Marketing
The marketing section is also only applicable only to respondents who were hosting agri-tourism
activities or attractions. The questions determined the respondents’ market (international or
local), the size groups they could accommodate and the percentages of the farms’ incomes that
were generated by agri-tourism activities or attractions. Finally, the section determined the
importance of different marketing mediums that respondents used to promote agri-tourism.
Section D: Other
The last section consisted of open questions to the respondents with regard to future expansion
plans, ways to improve and develop agri-tourism in South Africa and any suggestions or
comments that respondents had.
1.6.2.4 Survey and collection of data
The physical questionnaire was designed using Microsoft® Office Excel (2016) and converted
to a portable document format (PDF) to allow for easy printing. Over 2 000 physical
questionnaires were printed and used for the research. Many of these questionnaires were lost
at events while other questionnaires were not fully completed and thus invalid. Many of the
events that were targeted for physical questionnaire distribution attracted farmers for different
provinces around the country, for example NAMPO Harvest Day that farmers from all nine
provinces visited.
The e-questionnaire was drafted using Google Forms. This allowed the creation of different
sections in the questionnaire, which made it easier to understand, as well as different methods
of answering questions including long answers, short answers, tick boxes, and different scales.
Once the e-questionnaire was final, the online link to the Google Forum questionnaire was sent
per email to the nine different provincial organisations of Agri SA. In turn, they e-mailed the

14
online link of the e-questionnaire to the respondents (farmers) in the database that each has
compiled and updated over the years. This was voluntary and each provincial affiliation of Agri
SA decided if they wanted to participate in the research. Not all provinces were actively involved
in the distribution of the e-questionnaire.
1.6.2.5 Data analysis
All data from the e-questionnaire were collected electronically by using Google Forms, and
could be viewed either as a summary or individually by respondent. These results were
exported to Microsoft® Office Excel 2016. The data that had been collected from physically
distributing the survey were added to the electronic feedback in the Microsoft® Office Excel
2016 sheet. By making use of the tools that Microsoft® Office Excel 2016 provides, the data
were then processed by adding formulas to the variables and to analyse the data by creating
graphs and charts to explain the findings.
While Microsoft® Office Excel 2016 has the ability to design graphs, charts and tables, the data
were also analysed using the SPSS software version 22.0 (Statistical Package for the Social
Sciences), which allowed two or more variables to be considered simultaneously. Therefore, the
data were also processed by SPSS for in-depth understanding. SPSS analysed the data and
provided a statistical calculation of the mean, standard deviation, frequency, percent, valid
percent and cumulative percent.
A descriptive analysis was used to interpret the data. Since the questionnaire included many
different elements that resulted in a lot of data that needed to be analysed, only a summary of
the findings were provided (Burns & Bush, 2014:317).
1.7 DEFINING THE CONCEPTS
The following concepts needed to be explained to understand the full context of the proposed
title: a tourist; tourism; agriculture and commercial farms; and agri-tourism.
1.7.1 Tourist
Saayman (2013:5) provides two basic definitions of the term tourist. First, a tourist can be
described as a person who makes an economic contribution to any other area as the one in
which he/she works or lives. Secondly, a tourist can be described as a person who freely
chooses to visit a place that is not his/her usual residence for a period of longer than 24 hours.
By examining these two definitions, it is clear that certain elements are used to describe a
tourist, namely (Saayman, 2013:5):

15
the persons’ reasons for travelling;
the period that the person stays at the destination;
the place from which the tourists originates;
the size of the group in which the person is travelling;
the method the person uses to travel.
Saayman (2013:5) also identifies different types of tourists, including persons who:
visit a place for pure pleasure or for the sake of interest;
travel to attend to business matters;
visit their relatives or friends;
are motivated to travel for a sports meeting, study purposes, religious events, or any
other special events or sights.
Tourists can also be classified by their nature (Saayman, 2013:6). Researchers such as
Vanhove (2005:6) and Saayman (2013:6) identify different types of tourists, including domestic,
inbound, outbound, national, and international tourists. This study focused only on three groups,
namely international tourists, domestic tourists, and excursionists. International tourists include
any person who is visiting South Africa from another country. Since each country’s’ agriculture
is different, the agri-tourism activities that are hosted by South Africa can attract international
tourists. Domestic tourists include any South African who travels about in the country, from
province to province, from area to area. Finally, excursionists are also referred to as ‘day
visitors’ and are not classified as tourists by definition because they stay in an area for less than
24 hours. Since most of the agri-tourism activities last only a few hours and can be described as
day activities, international tourists, domestic tourists, and excursionists were included in this
study.
1.7.2 Tourism
Over the years, tourism has grown into one of the largest industries in the world (Asiedu &
Gbedema, 2011:28). Some of the biggest advantages include generating foreign exchange and
contributing more to the direct and indirect employment than most of the other traditional
industries do. For South Africa’s national economic development, tourism is a priority sector
(Rogerson & Rogerson, 2014:93). While tourism has received significant attention in developing
the national economy, agri-tourism and issues surrounding this matter have been overlooked.
Tourism can be divided into different aspects. Different researchers have identified different
aspects that they would use to define tourism. While some researchers only identify the
aspects, other researchers categorise them into primary and secondary aspects, depending on

16
how important they rank the aspects. Saayman (2013:17) combined many of these researchers’
work and compiled a list of primary and secondary aspects, which are displayed in Table 1.1.
Even though the tourism industry can be divided into different sectors and agriculture is only a
secondary aspect, agriculture also plays a key role in tourism.
Table 1.1: Primary and secondary tourism aspects
Primary aspects Secondary aspects Transport Accommodation and catering Entertainment Attractions Services
Agriculture Urban and regional planning Legislation Marketing and information Geography Psychology Sociology Demography Ecology Anthropology Parks and recreation Public and private sector Training and education Business management Safety management and ergonomics
(Source: Saayman, 2013:17)
Vanhove (2005:10) follows a different approach and divides the tourism industry into five main
sectors. Each of these sectors can be divided further into different elements. Table 1.2
illustrates the five sectors with different elements underneath each sector. The two main sectors
that stand out are the attraction sector and the accommodation sector, since many of the
elements can be classified as agri-tourism activities or attractions once they are located on a
working/commercial farm. For example, a natural or cultural attraction can be located on a farm,
as well as a bed and breakfast accommodation facility.

17
Table 1.2: The main sectors of the tourism industry
Attraction sector Accommodation sector Transport sector Natural attractions Cultural attractions Theme parks Museums National parks Wildlife parks Gardens Heritage sites Entertainment Events
Hotels Motels Bed and breakfast Guesthouses Apartments, villas and flats Condominium timeshare Campsites Touring caravans Holiday villages Marinas
Airlines Railways Bus and coach
operators Car rental operators Shipping lines
Travel organiser sector Destination organisation sector
Tour operators Travel agents Incentive travel
organisers
National tourist offices Regional tourist offices Local tourist offices Tourism associations
(Source: Vanhove, 2005:10)
The White Paper on the Development and Promotion of Tourism in South Africa (South Africa,
1996) defines tourism as travelling for any purpose that leads to one or more nights that a
person spends away from home. Gunn (cited by Saayman, 2002:3) has a different approach,
defining tourism as all travelling, except commuting. Kelly (1989) expands this definition by
defining tourism as “recreation on the move”, which includes activities that take place when a
person is away from home. Throughout the years, definitions that are more extensive have
been developed, although no universal definition exists yet.
Saayman (2002:3) provides a well-rounded definition: “Tourism is the total experience that
originates from the interaction between tourists, job providers, government systems, and
communities in the process of providing attractions, entertainment, transport, and
accommodation to tourists.” Briefly, tourism is the practice and theories of being a tourist
(Leiper, 2004:44).
1.7.3 Agriculture and commercial farms
The world’s land-use decisions are dominated by agriculture. Power (2010:2959) states that
agricultural ecosystems are essential to the human well-being because they provide key
elements such as forage, food, pharmaceuticals, and bio energy. According to Van
Huylenbroeck et al. (2007:5), throughout history, agriculture has played a fundamental role in
developing rural areas and shaping rural landscapes. Today, agriculture remains an important

18
economic activity and an important factor for creating employment and wealth, although the
dominant role that agriculture has played in the rural economy is declining. This resulted in the
current discussions that surround the future role of agriculture in rural areas. Srinivasan
(2006:3) identifies an urgent need for increasing farm production over the next few years. This
would be done by further intensification that would be done by using less land and less water.
However, it would involve substantial economic, social, and environmental cost. Therefore, it
has become a priority to find methods to minimise these costs by enhancing economic profits
and productivity while conserving the environment. One of the tools that can be used is
precision agriculture. In simple terms, Srinivasan (2006:3) defines precision agriculture as a
“holistic and environmentally friendly strategy in which farmers can vary input use and
cultivation methods – including application of seeds, fertilizers, pesticides, and water, variety
selection, planting, tillage, harvesting – to match varying soil and crop conditions across a field”.
Commercial agriculture remains an important industry that contributes to South Africa’s
economy. While it contributed to less than 3% of South Africa’s gross domestic product in 2007,
Hall (2009:125) lists several attributes that make commercial agriculture important, namely that
it provides products for processing to agribusinesses, creates a market for agricultural inputs,
earns foreign exchange, is responsible for a significant portion of the labour force, and ensures
that South Africa is a net exporter of agricultural products in most years.
South African agriculture can be divided into two categories of farmers, namely subsistence
farmers and commercial farmers (Agri Africa, 2016). This study focused on agri-tourism
activities and attractions that were located on a commercial farm. A commercial farmer farms
with the goal of selling his/her products in the marketplace (Dastrup, 2016). These products are
rarely sold directly to the consumer; raw products are usually sold to processing companies
where they are processed into products that are sold commercially.
1.7.4 Agri-tourism
Until recent years, no in-depth research on the relationship between local agriculture and the
global tourism industry has been conducted. Torres and Momsen (2011:1) suggest that the
relationship between agriculture and tourism tend to be multifaceted, place-specific, and highly
complex. Throughout the years, the definition of agri-tourism has been rephrased and
redefined, but no universal definition of the concept agri-tourism currently exists in the literature
(Bwana et al., 2015:79). Different authors have different opinions about what the industry
entails.
The American Farm Bureau Federation (cited by Pittman, 2006:4) defines agri-tourism as a
business located on a working farm, ranch, or agricultural plant with the purpose of enjoyment,

19
education, or being actively involved with the farm activities or operations that generate an
additional income for the owner. Veeck et al. (2006:235) agree that agri-tourism consists of
visiting a farm with the purpose of enjoyment and education, but also add the reason of on-site
retail purchases. Che et al. (2005:227) provide a more practical definition that describes agri-
tourism as any type of agricultural operation that is aimed directly at tourists through retail sales
or by providing services such as food, flowers, trees, and other farming products. In South
Africa, agri-tourism is also understood as ‘farm tourism’ (Saayman & Snyman, 2005:160). These
definitions illustrate how the same concept can have different meanings and understanding for
different people (Saayman & Snyman, 2005:106).
Finally, Irshad (2010:2) provides the most comprehensive definition of agri-tourism, defining it
as “the act of visiting a working farm or any agricultural, horticultural, or agribusiness operation
for the purpose of enjoyment, education, or active involvement in the activities of the farm or
operation”. For the purpose of this study, agri-tourism is defined as any activity or attraction that allows the tourist to visit a working or commercial farm for the purpose of education, enjoyment or to be actively involved in the day-to-day activities of the farm.
Agri-tourism is not a tourism aspect on its own but overlaps with many other tourism aspects.
Figure 1.2 illustrates the different aspects that affect agri-tourism. It is important to understand
that each aspect can be defined on its own, but once the activity or attraction is farm-based, it
can also be defined as an agri-tourism activity or attraction.
Figure 1.2: Agri-tourism in the tourism industry

20
A short definition of each of these aspects will follow, as well as the link it has to agri-tourism.
Wildlife tourism provides tourists with the opportunity to experience non-domesticated animals
first-hand, either in their natural environment or in captivity, and includes consumptive and non-
consumptive activities. Examples of wildlife tourism activities include whale watching, bird
watching, safaris, hunting, and fishing. This is in close relation with the hunting industry that
includes any business or agency that provides any facility or service that is used in hunting (Van
der Merwe, 2014:8). This includes transportation, entertainment, accommodation, attractions,
food, and drink. Most of these wildlife tourism activities are farm-based and can be classified as
agri-tourism activities if they are located on commercial farms.
Researchers such as Sharpley and Sharpley (1997:7) define rural tourism as a state of mind
where the tourist is actively seeking a leisure experience that is based in a rural environment.
Rural areas include the countryside, which is beyond major towns and cities. The definition of
rural areas broadens when rural areas are based on non-urban areas. Other researchers such
as Irshad (2010:2) define rural tourism as the ‘country experience’ that includes a variety of
activities and attractions that take place in a non-urban or agricultural area. According to
Saayman and Snyman (2005:164), rural tourism should be considered as a whole with
elements that complement one another in a holistic approach. General characteristics of rural
tourism include the wide-open spaces, the opportunities for tourists to experience the
agricultural and natural environments directly in their visit, and the low levels of tourism
development in the area. Rural tourism can be linked to several other tourism aspects, including
farm-based tourism, ecotourism, adventure tourism, heritage tourism, and agri-tourism (Irshad,
2010:2; Petroman & Cornelia, 2010:268).
Wine tourism is a significant component that forms part of the wine industry as well as the
tourism industry (Hall et al., 2000:1). Wine has become an important component of
attractiveness to destinations in the tourism industry and can be regarded as an important
motivating factor for tourists. This type of tourism includes wineries, wine festivals and shows,
vineyards, and wine tasting. Wine tourism is especially popular in the Western Cape and
Stellenbosch areas, where the first wine route was started in 1971 (Preston-Whyte, 2002:103).
These tourism activities or attractions are based on commercial farms and can be classified as
agri-tourism activities or attractions.
Ecotourism consists of three major elements, namely that it is nature-based, environmentally
educative, and managed sustainably. Geldenhuys (2009:5) identifies a variety of concepts that
defines ecotourism, namely it is responsible tourism, a learning experience, an approach rather
than an activity, sustainable development, a tool for conservation, about conserving fauna and

21
flora as well as culture, about an interaction between the tourist, nature and culture, an
enlightening experience, provides economic opportunities, aims to maintain a balance between
community, conservation, tourism and culture, and tries to balance the economy and the
ecology. Al of these elements can be linked to a farm and tourist activities based on a farm.
Nature-based tourism has become significantly more popular over the years (Geldenhuys,
2009:13). Similar terms include co-, green, alternative, sustainable, and responsible tourism.
Each of these terms has its own link to a natural environment. Geldenhuys (2009:14)
categorises nature-based tourists into three groups, namely hard-core nature tourists, dedicated
nature tourists, and mainstream nature tourists. This confirms that there are different elements
to nature-based tourism. This type of tourism forms a large part of agri-tourism, because agri-
tourism is based on a farm (and in nature).
Timothy (2011:6) explains that, based on people’s desires or the currency of the resources,
some authors distinguish between cultural tourism and heritage tourism, while he is of the
opinion that the differences, if there are any at all, are rather subtle in cultural heritage tourism.
Sigala and Leslie (2005:5) state that the two terms have been used interchangeably, but the
term “heritage and cultural tourism” places special emphasis on heritage and cultural
attractions. These attractions include displays, museums, archaeological sites, performance,
other musical performances, traditional religious practices, cultural performances, and
handcrafts. Many of these attractions are based on farms to attract tourists.
Cultural tourism can refer to tourists who are visiting or even participating in living cultures,
music, art, or other elements of modern culture. It can also be viewed from two sides. On the
supply side, each destination has its own distinctive cultural tourism offering with unique
culturally tangible and intangible elements. On the demand site, the main motivator of cultural
tourism is to experience the culture of a destination (Ivanovic, 2008:75; Timothy, 2011:4). While
most of these elements are city-based, they can also occur on farms.
According to Swartbrooke et al. (2003:23), culture in tourism includes:
“high art” (opera, classical music, ballet, modern dance, painting, sculpture etc.);
youth and alternative cultures (revolving around music, dancing, and the drugs
scene);
heritage and history (based on buildings and architecture, folk museums, etc.); and
anthropological/ethnographic interest in people and regions.
Heritage tourism is similar to cultural tourism and refers to tourists who are visiting built heritage
sites, living culture, or contemporary arts, while the foundation of heritage tourism is heritage

22
attractions. Resources are both tangible and intangible and can be found in urban or rural
settings. A number of motivations are behind heritage tourism, namely the desire to enhance
one’s own cultural self, satisfy one’s curiosity, learn something new, use up excess time, or
spend time with one’s family and friends. The experience is different for each tourist and every
place that the tourist visits (Timothy, 2011:3; Timothy & Boyd, 2003:20).
Geotourism focuses on geology and landscape and is thus a form of natural area tourism. This
type of tourism is used to “promote tourism to geosites and the conservation of geo-diversity
and an understanding of earth science through appreciation and learning” (Newsome &
Dowling, 2010:4). This is done through various activities such as the use of viewpoints, geo-
activities, visits to geological features, guided tours, the use of geo-trails and geosite visitor
centres (Newsome & Dowling, 2010:4). Typically, these nature-based activities are also
classified as agri-tourism activities.
Adventure tourism includes guided commercial tours that usually entail outdoor activities that
are based on a natural terrain, and specialised equipment is required generally. Excitement is a
key element for the tourist that involves physical, intellectual, spiritual, or emotional risks and
challenges (Buckley, 2006:1; Swartbrooke et al., 2003:27). Most of the activities mentioned in
Table 1.3 are farm-based and can be classified as agri-tourism activities.
Table 1.3: Examples of adventure tourism activities
Adventure tourism Abseiling
Aircraft (aerobatic)
Ballooning
Blackwater jumping
Caving
Cross-country skiing
Diving
Parapente/Paragliding
Rock climbing
Sail boating
Sailing
Zorbing
Downhill ski/snowboarded
Expedition cruises
Gliding
Hang-gliding
Heliski/boarding
Hiking
Quad biking/ATV
Sea kayaking
Skydiving
Snowshoeing
Surfing
Wildlife watching
Horse-riding
Ice climbing
Jet boating
Kite boarding
Mountain biking
Mountaineering
Off-road 4WD
River expedition
Whale-watching
White-water kayaking
White-water rafting
(Source: Buckley, 2006:27)
23
This concludes that while different tourism aspects overlap with one another, agri-tourism will be
the focus of this study. However, it is important to understand that the elements of each of these
aspects have to be implemented and managed sustainably. Swarbrooke (1999:13) identifies
sustainable tourism management as any “forms of tourism which meet the needs of tourists, the
tourism industry, and host communities today without compromising the ability for future
generations to meet their own needs”.
1.7.5 Size and scope
The main goal of this research is to determine the size and scope of agri-tourism, therefor it is
important to understand what is meant by the size and scope.
The English Oxford Living Dictionary (Oxford University Press, 2019) describe ‘size’ as how big
the object or subject is. The Cambridge Dictionary (Cambridge University Press, 2019) define
‘size’ as a noun that refers to measuring. In other words, size is “measured according which
goods are made or sold”. Thus for this study, the size of agri-tourism refers to how big the
industry is currently in South Africa.
The English Oxford Living Dictionary (Oxford University Press, 2019) describe ‘scope’ as “the
extent of the subject to which it is relevant”, in other words what is included. The Cambridge
Dictionary (Cambridge University Press, 2019) define ‘scope’ as a noun that refers to range. In
other words, to which extent the subject is covered. Thus for this study, the scope of agri-
tourism refers to what agri-tourism activities/attractions are currently being hosted in the South
Africa industry.
1.8 CHAPTER CLASSIFICATION
This study consists of five chapters.
Chapter 1: Introduction and problem statement
This chapter includes a background of the study that gives a broad overview of the tourism
industry, the problem statement that defined the research question that would be answered in
the study, the goal and objectives that needed to be met through the research question, the
research methods that were used to conduct the research, as well as definitions that necessary
to understand the context of the study.

24
Chapter 2: An overview of agri-tourism
The second chapter represents a full literature review of agri-tourism. It includes analysing agri-
tourism, defining agri-tourism activities, and listing the advantages and disadvantages of hosting
agri-tourism activities on a farm. Finally, a brief historic overview of agri-tourism is provided
Chapter 3: An analysis of agriculture and tourism in the nine South Africaan provinces
The second literature review chapter focuses on the agricultural state of each province in South
Africa. While South Africa is divided into nine provinces, each province has its own agricultural
features that contribute to the choice of agri-tourism activities hosted in the area. It is also
important to understand the contribution agriculture makes to each province, in order to identify
the gaps for agri-tourism.
Chapter 4: Empirical results
This consists of analyses of all quantitative research. Surveys were conducted by means of a
questionnaire. The data that were collected from the questionnaire were analysed and
interpreted in this chapter to understand the size and status of agri-tourism activities in South
Africa.
Chapter 5: Conclusion and recommendations
The final chapter contains a well-rounded conclusion what summarises the study. It also
includes recommendations for the tourism industry, especially to eliminate gaps that have been
identified, focusing on the agri-tourism sector. All the information gathered throughout the study
was used to answer the research question.

25
CHAPTER 2: AN OVERVIEW OF AGRI-TOURISM
2.1 INTRODUCTION
Sznajder, Przezborska and Scrimgeour (2009:3) interpret the word “agri-tourism” as the
combination of the prefix agri- and the word tourism (noun). These researchers believe that
agri-tourism is a type of holiday that a tourist spends on a farm in order to familiarise oneself
with the recreation and work activities of the agriculture environment. Torres and Momsen
(2011:1) refer to the links between agriculture and tourism as the basis for new solutions to
some of the challenges that many countries face, including rising food prices, climate change,
and even the global financial crises. Other reasons why farms have to explore alternative
economic strategies include rising production cost, industrialisation, globalisation, poor
agriculture commodity prices, the loss of government-supported agriculture programmes, as
well as the elasticity of commodity markets (McGhee & Kim, 2004:161). Torres and Momsen
(2011:1) also identify the links between these two industries and the world economy. Agriculture
and the processing of farmlands can be seen throughout history and can be seen in the global
economy as one of the oldest and most basic industries. On the other hand, tourism is a
relatively new industry but has shown such a rapid growth rate that it has become one of the
world’s largest industries (Torres & Momsen, 2011:1).
Malkanthi and Routry (2011:45) agree that agri-tourism is an important strategy that can be
used to contribute to agricultural development. This can be done by diversifying farming
activities by providing the opportunity for visitors to enjoy, relax, rest, and study farming
methods and practices. Most of the worlds’ countries promote agri-tourism in an attempt to
promote sustainable rural development.
Agri-tourism is still a relatively new term to many countries, but it has gained significant
popularity with farmers who need ways to generate an additional income. Other motivations
include the contribution it makes to the preservation of farmers’ communities as well as their
personal lifestyles (Mace, 2005:1). Although economics is a big motivator towards starting an
agri-tourism product, it is not the only reason. Mace (2005:9) refers to agri-tourism motivations
as “a complex set of economic and social variables”. While the literature regarding agri-tourism
development is growing by the day, organised research is still required to maximise the success
of which agri-tourism is capable (McGhee & Kim, 2004:161).
The purpose of this chapter is to understand what the term agri-tourism entails, as well as to
understand how it forms part of the larger tourism industry. Furthermore, this chapter includes
different types of agri-tourism activities divided into different categories. While agri-tourism is a

26
wide subject, a brief history of agri-tourism in South Africa is discussed. A list of the advantages
and disadvantages of agri-tourism is provided, and previous studies on agri-tourism are
discussed. Finally, agri-tourism around the word is discussed to understand how it has
developed in other countries, as well as potential ways in which it can be utilised.
2.2 UNDERSTANDING AGRI-TOURISM
To understand fully exactly what agri-tourism is, it is important to define agri-tourism. Also, an
agri-tourism typology that explains five types of agri-tourism is examined, and an agri-tourism
system model is discussed. Finally, a brief history is provided to see how agri-tourism evolved in
South Africa.
Sznajder et al. (2009:15) identify several factors that contribute to the development of agri-
tourism, including urbanisation, the declining state of rural infrastructure, low income from
farming activities, and the redistribution to agri-tourism farms from urban people’s income.
2.2.1 Defining agri-tourism
Agri-tourism has been defined and redefined throughout the years. An early definition by
Sharpley and Sharpley (1997:9) describe agri-tourism as a tourism product that has a direct link
with agrarian products, the agrarian environment, or even agrarian stay. Therefore, farm-based
tourism is an element of agri-tourism, but agri-tourism covers a broader concept of museums,
craft shows, festivals, and other cultural events and attractions. Simple definitions of agri-
tourism include attracting visitors to practices developed on a working farm (Barbieri &
Mshenga, 2008:168), for farmers and rural people to provide a range of amenities, activities,
and services to attract tourists with the purpose of generating an extra income (Kiper,
2011:171), and a form of farm-based tourism that provides economic benefits to farmers and
provides activities, entertainment, or products to visitors on the farm (Malkanthi & Routry,
2011:45).
In other studies, agri-tourism has been defined as hospitality activities that are hosted by
agriculture entrepreneurs along with family members, while these activities remain connected to
farming activities to complement them (Sonnino, 2004:286). Bernardo et al. (2004:1) classify
agri-tourism as a subdivision of rural tourism that attracts tourists to the countryside, such as off-
site farmers’ markets, resorts, non-profit agricultural tours, and other leisure and hospitality
activities. Rogerson and Rogerson (2014:93) provide a similar definition that classifies agri-
tourism as an evolving form of rural tourism that focuses on urban consumers. Marques
(2006:151) combines these definitions by stating that agri-tourism falls under rural tourism
where an agriculture estate is integrated and inhabited by the proprietor, which allows visitors to

27
be actively involved in agriculture or any complementary activities that are hosted on the
property. The rural enterprises (agri-tourism) are made up of two parts, namely a working farm
environment as well as a commercial tourism component (McGhee, Kim & Jennings, 2007:280).
The American Farm Bureau Federation (cited by Pittman, 2006:4) define agri-tourism as a
business located on a working farm, ranch, or agricultural plant with the purpose of enjoyment,
education, or being actively involved with the farm activities or operations that generate an
additional income for the owner. Veeck et al. (2006:235) agree that agri-tourism consists of
visiting a farm with the purpose of enjoyment and education, but also add the reason for on-site
retail purchases.
Che et al. (2005:227) provide a more practical definition that describes agri-tourism as any type
of agricultural operation that is aimed directly at tourists through retail sales or by providing
services such as food, flowers, trees, and other farming products. Karthik and Gajanand
(2017:1) describe agri-tourism as rural agriculture environments with farm commodities and
tourism services.
Some of the most comprehensive definitions of agri-tourism include the following:
“Agri-tourism is a term that can be used to describe nearly any activity in which a
visitor to the farm or other agricultural setting contemplates the farm landscape or
participates in an agricultural process for recreation or leisure purposes” (Tew &
Barbieri, 2012:216).
“Stated more technically, ‘agri-tourism’ can be defined as any business conducted
by a farmer or processor for the enjoyment or education of the public to promote the
products of the farm and to generate additional farm income” (Pittman 2006:4).
“As a form of commercial enterprise that links agricultural production and/or
processing with tourism in order to attract visitors onto a farm, ranch, or other
agricultural business for the purposes of entertaining and/or educating the visitors
and generating income for the farm, ranch, or business owner” (Pittman, 2006:4).
Agri-tourism is linked directly to a farm that draws the conclusion that animals can form part of
agri-tourism. Markwell (2015:1) mentions multiple ways in which animals contribute to tourism.
First, they are an attraction, whether they are alive, dead, wild, or in captivity. Other ways
include using them in different means of transport, to symbolise the destination, as travel
companions, or as a component of regional cuisine. Cohen (2009:114) encourages the element
of animals in tourism, as it is an ideal way to explore human-animal relationships. It provides
opportunities for interaction in various forms, such as viewing, playing, eating, hunting, and
fishing.

28
Different farmers have different motivations for implementing agri-tourism elements on their
farms. Daugstad and Kirchengast (2013:180) identify a variety of motivations, including that
agri-tourism started ‘unintentionally’ on the farm through tourists showing interest in the farms;
the change in infrastructure caused an increase in tourist opportunities and allowed for agri-
tourism in the area; and the farmers being truly interested in starting a new business or
enterprise.
2.2.2 An agri-tourism typology
Researchers identify and discuss four main characteristics that are used to define agri-tourism
(Arroyo et al., 2012:40; Karampela et al., 2016:164; Phillip et al., 2010:755;). These four
characteristics include the following:
i. The type of setting
In some countries, it is required that the product be based on a ‘working farm’ where agriculture
is being practised currently. However, Arroyo et al. (2012:40) state that any type of agricultural
setting can be sufficient.
ii. The nature of contact between tourists and agricultural activities
Agri-tourism combines the tourist experience with a tangible agricultural product. This includes
different types of activities that are involved, such as education or lodging.
iii. The authenticity of the agricultural experience
This identifies the degree of authenticity that the tourist experiences when taking part in the
agricultural activity. Cohen and Cohen (2012:1298) divide authenticity between “cold”
authentication and “hot” authentication. “Cold” authentications can be validated by scientific
knowledge, expertise, or personal knowledge, while “hot” authentication is based on emotion
and belief rather than proof.
iv. The need for travel
A fourth ontological issue that relates to the ‘tourism’ component of the term agri-tourism was
identified later, namely the need for travel that takes place when visiting an agricultural setting.
These four characteristics were used to develop a typology of agri-tourism. The typology was
revised later and changed slightly (Flanigan et al., 2015:132). The original typology is illustrated
in Figure 2.1.

29
Figure 2.1: A typology for defining agri-tourism
(Source: Phillip et al., 2010:756)
From Figure 2.1, five different types of agri-tourism were identified to explain the context and
reach of the industry fully (Karampela et al., 2016:164; Phillip et al., 2010:756). While several
references to the typology are illustrated in Figure 2.1, Brandth and Haugen (2011:38) identify
only three different types of agri-tourism, including agri-tourism as the main activity, agri-tourism
and agriculture as an equal combination, and agri-tourism as an additional activity or hobby.
According to Phillip et al., (2010:756), the following defines agri-tourism:
2.2.2.1 Non-working farm agri-tourism
These tourist activities are not based on a working farm. However, these activities still have an
agricultural or agricultural heritage connection such as the location or image, but has no direct
connection with crops, farm animals, processes, or machinery. Examples of this type of agri-
tourism include a farmhouse that is converted into accommodation, demonstrations of sheep
shearing that is located at a woollen mill, horse-riding on converted farms, or even walking in
areas where the working farm is not the main point of tourist activities. Non-working farm agri-
tourism differs from rural tourism, based on the connection that is made with agriculture or
agricultural heritage in any other way than a working farm location.

30
2.2.2.2 Working farm, passive contact agri-tourism
These tourist activities are based on a working farm where tourists have passive contact with
agricultural activities. Farmers use this type of agri-tourism commonly to capitalise on the
existing resources that are available on their farms to generate an additional income, without
interfering with their agricultural activities. Examples of this type of agri-tourism include any
tourism activities or products that are based on the farm resources, such as activity centres that
are outdoor spaces, as well as outbuildings that have been disused previously but are now used
as holiday cottages.
2.2.2.3 Working farm, indirect contact agri-tourism
These tourist activities are based on a working farm where tourists have indirect contact with
agricultural activities; thus, the agriculture on the farm begins to integrate with the tourism
product that is presented on the farm. This is done indirectly, since the agricultural commodities
feature in the tourism product, and not the agricultural activities themselves. Examples of this
type of agri-tourism include farm-based accommodation such as self-catering cottages,
camping sites, farmhouse bed and breakfast accommodation, farm shops, outdoor activities
such as horse-riding and country field sports, and visitor attractions such as natural attractions
and children’s play parks.
2.2.2.4 Working farm, direct contact, staged agri-tourism
These tourist activities are based on a working farm where tourists have direct contact with
agricultural activities, but do not experience an authentic agricultural activity. This allows tourists
to experience agricultural activities, even though they are staged for tourism purposes and not
an authentic activity. This is done either through reproduction such as a model farm or through
organisation such as a farm tour of the agricultural activities that focus on tourism. Examples of
this type of agri-tourism include interaction with farm animals, crops, machinery, or processes
that are staged or reproduced for tourism benefits, such as farm tours, open farms, or farm
attractions.
2.2.2.5 Working farm, direct contact, authentic agri-tourism
These tourist activities are based on a working farm where tourists have direct contact with
agricultural activities and experience an authentic agricultural activity. Tourists experience first-
hand what the physical agricultural activities entail. This allows tourists to make a physical
investment in the economy of the farm. Examples of this type of agri-tourism include
participating in farm tasks and activities such as handpicking grapes, olives, and berries.

31
2.2.3 An agri-tourism system model and marketing
McGhee (2007:111) focuses on the needs and obstacles of farm families that are acting as the
agri-tourism providers on the supplier’s side, as the destination marketing organisation (DMO)
to sell their farm/area, as well as the agritourist. Using these three primary stakeholders,
McGhee invented an agri-tourism system model (Figure 2.2). This model has not been applied
yet, however, and is thus only theoretical, based on the literature.
Figure 2.2: An agri-tourism system model
(Source: McGhee, 2007:119)
The agri-tourism system model focuses on the agri-tourism providers (the farm families) who
deliver different agri-tourism products and services to the agritourists (visitors) who then
‘consume’ the products and services that they receive from the agri-tourism provider (McGhee,
2007:117). The DMOs have an important role in the process, which is to make the informational
transactions between the agri-tourism provider (the farm families) and the potential agritourists
(visitors) as efficient as possible. The DMOs primarily have a formally rational role. In terms of
literature, the rationality is both a formal and substantive mix. The DMOs mainly focus their
activities on the diffusion of information by marketing communication and on promoting the
destination area. Saayman (2006:111) identifies two components when working with a tourism

32
product, namely tangible and intangible aspects. Both of these aspects should be considered in
the marketing element of the tourism product.
McGhee (2017:119) used the system model identified in Figure 2.2 to identify the following
three research questions, namely:
(a) What are the needs and motivations of each agri-tourism stakeholder group? How is
their rationality – formal, substantive, or both?
(b) What obstacles does each stakeholder group face in fulfilling its role in the
successful agri-tourism system? How can these obstacles be reduced or
eliminated?
(c) What obstacles waken communication among agri-tourism stakeholder groups?
How can these obstacles be reduced or eliminated? How might the recognition of
the rationality of each relationship (formal, substantive, or a mix, or both) improve
communication among the groups?
Middleton, Fyall, Morgan, Morgan & Ranchhod (2009:24) present their own list of marketing
elements that need to be understood when engaging in the tourism industry, similar to
McGhee’s model, namely:
• the wants and needs of both existing and prospective clients;
• when, where, how much, at what price and how often clients choose the product or
service;
• how the clients receive their information and other offerings;
• if after-sale services are needed; and
• how the client feels after the experience of using the product or service.
2.2.4 The history of agri-tourism in South Africa
Different agri-tourism activities and attractions started in South Africa over the years, of which
the following are a few examples:
Ostriches:
Agri-tourism in South Africa dates back to the establishment of ostrich farms near Oudtshoorn in
the Western Cape (Viljoen & Tlabela, 2007:15). Farmers began farming with ostriches for their
plumes in the 1860s (Adams, 2010:50). In the 1940s, farmers began producing both meat and
leather. Finally, in the 1960s, separate farms were opened to the public, introducing agri-tourism
activities such as ostrich races and ostrich-riding.

33
Trade shows:
Agri-tourism also includes shows, exhibitions, and expos. The NAMPO Harvest Day is South
Africa’s largest agriculture trade show. According to Theron and Muller (2016:232), it began in
1967 with eight exhibitors and 203 attendees. Over the years, it expanded with great success to
685 exhibitors and more than 75 000 attendees in 2016.
Game farms:
Also in the 1960s, the game-ranching industry in South Africa began to grow (Van der Waal &
Dekker, 2000:155). Today, it covers a significant part of commercial agricultural land in the
country, especially in Limpopo. Based on a study in Limpopo in 2000, several farmers were
already hosting the following activities on their game-ranches: game viewing, photo safaris,
night drives, birdwatching, walking trails, horse-riding, fishing, mountain biking, and day visits
(Van der Waal & Dekker, 2000:153). Trophy hunting is very popular in South Africa. Lindsey,
Roulet and Romanach (2006:456) describe trophy hunting as a paying tourist who is usually
accompanied by a professional hunter who targets a specific animal based on its physical
attributes. Game is also hunted for biltong (dried meat) in South Africa (Saayman, van der
Merwe & Rossouw, 2001:02).
2.2.4.1 Wine tourism in South Africa
Trading in South Africa can be traced back to 1652 when Jan van Riebeeck was sent to South
Africa by the Dutch East India Company to establish the first victualling stop for the merchants
who were en route to the East Indies (Preston-Whyte, 2002:106). According to Elias (2012:14),
it is documented that in 1659, Jan van Riebeeck noted in his diary, “Today, praise be to God,
wine was made for the first time from the Cape grape.” Since then, vineyards in the Western
Cape have grown significantly, as wine producers take full advantage of the characteristic
rainfall and temperature conditions of the coastal areas.
During a tour of the Route de Vins at Morey St Denis in Burgundy, Frans Malan of the Simonsig
Estate got the idea of establishing wine tours. In collaboration with Neil Joubert (Spier Estate)
and Spatz Sperling (Delheim Estate), the group, also known as the ‘Three Angry Men with a
Cause’, challenged the government to fight for the liquor law to change to allow the tasting of
wine on estates. The first wine route in South Africa was located in the Stellenbosch area and
opened in 1971 (Elias, 2012:15; Preston-Whyte, 2002:106). Ferreira and Müller (2013:76)
confirm the first three wineries to offer cellar-door wine tasting in 1973 were Simonsig, Spier,
and Delheim. South Africa started with three wine farms, and the industry has since grown to
more than 300 in 2007 (Viljoen & Tlabela, 2007:16). Today, there are more than thirteen wine

34
routes in the South-western Cape. Most of them are located within 100 km of Cape Town, while
there is one along the Orange River (Preston-Whyte, 2002:103). Agri-tourism activities
associated with wine farms include wine tasting, grape picking, wine cellar tours, production
facilities tours, restaurants, accommodation, horse-riding, fishing, visiting farm animals (petting
zoo), on-farm markets, and on-farm concerts (Govindasamy & Kelley, 2014:130). Preston-
Whyte (2002:108) mention other activities such as racehorse breeding, rose and fruit growing,
river rafting, trout fishing, and cheese production, many of which are agri-tourism products.
Fourie (2015:23) argues wine tourism is largely responsible for the development of the agri-
tourism sector.
Cusmano, Morrison and Rabellotti (2010:1592) identified the following production volumes of
wine in different countries around the world. As illustrated in Table 2.1, wine production in South
Africa has increased significantly over the past 40 years.
Table 2.1: Wine production over the world (Tonnes ’00)
Country 1975-79 1980-84 1985-89 1990-94 1995-99 2000-04 2005-07
Australia 3 550 3 855 4 298 4 693 6 773 11 061 12 752
Chile 5 423 5 311 3 951 3 488 4 364 6 186 7 943
France 67 484 68 062 66 378 56 215 57 588 53 505 51 085
Italy 71 482 76 787 67 329 61 058 56 150 49 641 47 571
South Africa 5 812 7 443 7 477 7 382 7 953 7 748 9 196
USA 15 388 17 043 18 782 17 575 20 994 24 098 24 793
World 317 160 342 096 299 971 269 516 268 456 279 280 275 397
(Source: Cusmano, et al., 2010:1592)

35
Figure 2.3: History of agri-tourism in South Africa
(Sources: Adapted from Adams, 2010:50; Cheng et al., 2011:56; Ferreira and Müller, 2013:76;
Preston-Whyte, 2002:106; Theron and Muller, 2016:218; Van der Waal and Dekker, 2000:155;
Viljoen and Tlabela, 2007:15)
2.3 DEFINING AGRI-TOURISM ACTIVITIES
Bernardo et al. (2004:1) suggest five main categories into which agri-tourism activities can be
divided, namely outdoor recreation, educational experiences, entertainment, hospitality
services, and on-farm direct sales. Each of these categories will be discussed individually by

36
providing practical examples of each. Different agri-tourism activities were identified from
different sources (Chikuta & Makacha, 2016:106; Kukorelli, 2001:23; Pittman, 2006:5; Roberts
& Hall, 2001:2; Sharpley & Sharpley, 1997:8; Van der Merwe & Rogerson, 2018:189).
2.3.1 Outdoor recreation
Several outdoor recreation activities and attractions were identified that are based in a natural
and outdoor environment (Chikuta & Makacha, 2016:106; Kukorelli, 2001:23; Pittman, 2006:5;
Roberts & Hall, 2001:2; Sharpley & Sharpley, 1997:8; Van der Merwe & Rogerson, 2018:189).
Hiking/Nature trails
Hiking trails differs in length, difficulty, and scenery. Depending on the geography of the farm,
the trial can lead to picnic sites, up mountains, across rivers, and many more places. This is a
form of natural area tourism and facilitates a recreational experience while visitors enjoy natural
landscapes. The outlined trails are meant to focus visitors’ attention to help prevent soil erosion
and trampling of ecosystems in those areas (Newsome, Moore & Dowling, 2002:98).
Mountain climbing
Farms that are more diverse typographically can include mountain ranges. Some farmers open
these areas to the public and allow tourists to go mountain climbing. On some farms, trails may
be laid out in the mountains, while other farms keep the mountains as natural as possible.
Usually, more natural surroundings require climbers to be more specialised.
Rock climbing
This can be combined with mountain climbing, or be an activity on its own. Specialised
equipment is needed for this activity, which can be provided by farmers, or tourists can be
required to bring along their own. In many cases, beginners will take part in this activity;
therefore, the farmer or his employers will be assigned to the group to assist them with the
activity.
Abseiling
Abseiling can be combined with rock climbing or mountain climbing, or it can be an activity on
its own. This activity also requires special equipment that is usually provided by the farmer, but
there are cases where tourists can use their own equipment. Similar to rock climbing, this
activity is popular among scholars on tour. While most of the visitors will then be beginners, the
farmer or his employers will be assigned to the group to assist them with the activity.

37
Cave visiting
Cave visits can be combined with mountain climbing or hiking tours. Some farms have natural
caves that are open for public viewing. While this is a natural wonder, man-made aspects such
as cave paintings can also be promoted.
Visits to geological phenomena
With a country rich in natural attractions, many geological phenomena are located on farmland.
This includes rock formation and fossil sites.
Fishing
Fishing can be classified as a sport. Farmers with large dams or ponds on their farms can invite
tourists to fish in them. This can be done when fish are in their natural habitat, or farmers can
buy fish to breed in their dams or ponds for fishing purposes.
Hunting
South Africa is known for its wildlife, and many tourists travel to the country to hunt, especially
for trophies. Many commercial farmers surround their farms with the appropriate fences to allow
wildlife to roam around freely on these lands. These wildlife animals mostly consist of different
buck species. Farmers then invite tourists to hunt on their farms, as the number of wildlife
grows. Another possibility occurs when buck cross the farmland; the farmers invite tourists to
hunt these animals to refrain them from eating the farmers’ pastures, which are meant for their
livestock. Each farmer compiles his own packages from which tourists can choose.
Cycling
This is done on an outlined course on the farm where cyclists can bring their bicycles and ride
through the courses. Different difficulty levels can also be implemented to accommodate
different types of cyclists. If can also focus on mountain biking.
Wildlife viewing and photography
Some farmers take tourists on a game drive to view the wildlife that they have on their farm, and
tourists get the opportunity to take pictures of the wildlife. This is especially popular among
international tourists, who want an authentic South African experience.

38
Animal rides
Many farmers keep tamed animals on their farm, with the purpose of allowing tourists to ride on
them. This is aimed at children or adults and sometimes both. This can be horses, ponies,
ostriches, camels, or even elephants. This is done at own risk, and usually, the farmer or a
worker is trained to assist the tourist and guide the animal.
Bird watching
South Africa has a variety of bird species that can be found in different areas of the country.
Bird watching is usually done with a camera, but many visitors also prefer to take photographs
of the different bird species that they see.
Camping
Camping can be combined with hiking trails, to allow visitors to overnight on the farm. Visitors
can bring their own camping gear, or in some cases, it may be provided by the farmer.
Picnicking
Picnicking is a popular social outdoor activity and is usually done in a scenic environment. It can
be either on a large lawn area, near a river or in a more wood-like area. Some farms that
usually have restaurants give visitors the option to buy a picnic basket from them, while others
allow visitors to bring their own picnic baskets.
Clay-bird shooting
This is a popular sport in many countries. Visitors can shoot flying objects in the sky.
Off-road vehicle driving/4x4 routes
This can also be referred to as “bundu-bashing”. Visitors bring their own vehicles and drive
through the different routes that consist of different terrains that are laid out on the farm.
Water activities
Many farms have large dams or rivers running through them. Some activities can take place
only on a dam, while others require a river with a strong flow. Water activities include canoe
trips, white-water rafting, river rafting, boat rides, water-skiing, tubing, and more. The equipment
for these activities is usually rented from the farmer, who also provides a guide for most
activities or assists the tourists.

39
Petting zoo
This type of activity is usually aimed at children. This entails relatively small farm animals that
are tamed so that they are not a threat to humans, specifically small children. For example,
Imhoff Farm in the Western Cape has a petting zoo that offers children the opportunity to pet
pigs, duck, geese, goats, sheep, rabbits, chickens, guinea pigs, and ponies (Mond, 2017).
Farm maze route
Several farms that offer different tourist activities also have mazes. This is a large area with high
grass hedges that form a pattern. The goal is to find the exit without seeing the bird’s eye view
of the maze. Examples of these farms are Imhoff Farm at Kommetjie and Redberry Farm near
George.
Paintball
This activity is played in groups; thus, it attracts a number of tourists to the farm. This can be a
social event, or it can be arranged as a teambuilding exercise. The farms rent the safety gear,
paintball guns and paintball bullets to tourists against a price.
Helicopter/chopper tours
Some farmers have small aeroplane strips on their farms for their aircraft. Farmers can use it for
recreational purposes, or it can be a spray aircraft that is used to spray chemicals on the crops.
Selected farmers allow tourists to take guided tours of the area or to watch first-hand how the
crops are sprayed by the aircraft. Tourists must pay for this experience, and it is done at their
own risk.
Cart riding
Farmers with their own carriages can use donkeys, ponies, or horses to pull them. The farmer
will also assign a trained driver to assist the tourists, or in some cases farmers give driving
lessons to the tourists to teach them how to drive a carriage.
Golf course
Farmers with large land areas that are not used as pasture or for crops sometimes convert the
land into a golf course. This is a very popular recreation activity.

40
2.3.2 Educational experiences
There are several educational experiences that tourists can take part in on a farm (Chikuta &
Makacha, 2016:106; Kukorelli, 2001:23; Pittman, 2006:5; Roberts & Hall, 2001:2; Sharpley &
Sharpley, 1997:8; Van der Merwe & Rogerson, 2018:189).
Cooking/Culinary classes
Cooking classes are usually done on farms where visitors can learn to make traditional dishes
that are authentic to the area.
Wine tasting
Many wine farms offer a wine-tasting experience. Visitors can taste the various wines that the
farm produces and can buy wine directly from the farmer. Prices differ from farm to farm, while
some farms even offer wine pairing, which is done by combining wine with food, chocolate,
nougat, and more.
Beer tasting
Many farms in South Africa brew beer and offer beer tasting to the public. This is also a
marketing tactic to attract tourists and encourage them to buy their beer products.
Tea tasting
Some farms produce different types of teas. Farms such as the Skimmelberg farm in the
Western Cape offer tea tasting of their trademark red and green rooibos teas (Clanwilliam,
2019.
Food and beverage pairing
A variety of foods and beverages can be paired. This usually depends on the type of beverage
that the farm is already producing, such as wine, sparkling wine, beer, or even brandy. These
beverages are then served with a type of food or snack that complements the taste. For
example, pairing of pancake and wine, chocolate and wine, nougat and sparkling wine, and
even chocolate, biscuit and wine/brandy (Moerat, 2016).
Farm tours
This includes any tour on the farm where the farmer or an employee of the farmer takes visitors
on a guided tour of the farm. In this way, visitors have an authentic experience and see first-

41
hand what the day-to-day activities on a farm entail, for example, tours of breweries, orchards,
vineyards, wine cellars, gardens/nurseries, ostrich farms, buchu and rooibos establishments,
and sugar cane plantations.
Museums
Some farms with a rich history can choose to preserve that history with a small museum
situated on the farm. These museums are sometimes combined with accommodation situated
on the farm. Entrance to the museum is usually free to guests stay over on farms. Examples of
farms that have museums situated on them include Ganora Guest Farm and Glen Avon Farm
(South Africa, 2017).
Monuments
Some farmers have monuments on their farms that represent or commemorate historical
events. These monuments are then made available for public viewing.
Battlefield routes
Throughout history, many battles have taken place on South African soil. Today, many of these
areas are historic sites and open to the public. Some of these sites are located on commercial
farms.
Historical memorials
South Africa is rich in history and has many historical sites, memorial sites, burial sites, and
other special sites. Many of these sites are located on commercial farmers’ land and are open
to the public to visit these sites.
Rehabilitation centres
Some farmers open rehabilitation centres on their farms for orphaned or injured animals. They
care for and help these animals until they are strong enough to be released into the wild, or for
the remainder of their lives. Many of these wild animals are domesticated to the point where
they cannot fend for themselves and cannot be released into the wild again. The farmer
provides them with food, shelter, and medical assistance when needed.

42
2.3.3 Entertainment
Different entertainment can be hosted that draws tourists to the farm (Chikuta & Makacha,
2016:106; Kukorelli, 2001:23; Pittman, 2006:5; Roberts & Hall, 2001:2; Sharpley & Sharpley,
1997:8; Van der Merwe & Rogerson, 2018:189).
Festival
Some communities that are more actively involved in the agriculture sector in their area support
local festivals. This includes a harvest festival that is hosted annually. Many wine farms have
annual harvest festivals such as the one on Delheim Wine Farm, the Robertson Hands-on
Harvest and the Vrede en Lust Harvest Franschhoek (Cape Town Magazine, 2018). Other
festivals include the NAMPO Harvest Day. These festivals are usually combined with food and
beverages, music, live entertainment, and areas for visitors to socialise. The South African
Cheese Festival and Agri Expo is held on Sandringham Farm near Stellenbosch each year.
Expo/Exhibition
Many farmers host expos or exhibitions on their farms if they have the facilities for it. These can
be farm-related expos and exhibitions or related to another industry that is just hiring or making
use of the farmer’s facilities.
Barn dance
Barn dances are not as popular in South Africa as they are in many other countries. This entails
traditional square dances that are typically in a cowboy style, usually accompanied by country-
style music.
Concerts
Many farmers have large field areas that can be used for concerts to entertain tourists, or even
to screen a film. Farmers can invite visitors to attend only the concert, or they can add a picnic
basket or refreshments at an additional price.
2.3.4 Hospitality services
Other services that can be added to a farm experience is hospitality services (Chikuta &
Makacha, 2016:106; Kukorelli, 2001:23; Pittman, 2006:5; Roberts & Hall, 2001:2; Sharpley &
Sharpley, 1997:8; Van der Merwe & Rogerson, 2018:189).

43
Farm stay/accommodation
Many farms offer accommodation to visitors that can be in an old farmhouse that is restored, or
new accommodation facilities are built. Different types of accommodation include bed and
breakfast accommodation, guesthouses, manors, cottages, lodges, home stays, and ranches
(Slabbert & Saayman, 2003:7).
Wedding and special events on farms
Many farms have wedding facilities built on the farm. They can host both the wedding and the
reception on the farm. These facilities can also be used for other events. Some of these farms
focus on the landscape that the farm has, or the facilities themselves.
Social events
These include any social events that are arranged on the farm to gather different people. This
refers to farmers’ days or exhibitions that take place at certain times of the year, or at random
as the farmer sees fit or arranges. These types of events are more for locals, but it can also
attract visitors from afar.
Restaurant
Farm-based restaurants have become more popular in recent years. While this is an extra
income for farmers, they can keep this area separate from their day-to-day activities on the
farms so that tourists do not disrupt them. Products such as meat, fresh fruit, and vegetables
can be produced on the farm, which guarantees freshness as well as lower costs.
Spas
Since this is a very specialised service, it can also be combined with accommodation facilities.
Farmers with hot-water springs on their lands can combine the springs with a spa.
2.3.5 On-farm direct sales
Finally, on-farm direct sales can also be hosted on a farm and is considered as an agri-tourism
element Chikuta & Makacha, 2016:106; Kukorelli, 2001:23; Pittman, 2006:5; Roberts & Hall,
2001:2; Sharpley & Sharpley, 1997:8; Van der Merwe & Rogerson, 2018:189).

44
U-pick operations
This refers to any fruit or vegetable that visitors can pick for themselves directly from the land.
This includes different types of berries, strawberries, cherries, peaches, pears, plums, apples,
and other fruits. Visitors pay based on the size of the container they want to fill, and then they
can fill these containers by picking the items from the stem in the fields or orchards.
Roadside stand/Farm stall
Many farmers produce their own products on their farms and sell them to the public who passes
by their farms. Products may include milk, cheese, fresh fruit, and fresh vegetables.
Christmas tree farms/Cut your own
In some countries, farmers allow visitors to cut down their own Christmas tree, or to buy one
that has already been cut.
Auctions
Many farmers who farm with cattle and sheep attend regular auctions. Not all of these auctions
are held at an auction facility. Many auctions take place on the farmers’ farm. Different farmers
from the area attend these auctions, where they can buy livestock.
2.4 ADVANTAGES AND DISADVANTAGES OF AGRI-TOURISM
There are several advantages and disadvantages to hosting agri-tourism activities or attractions
on a farm.
2.4.1 Advantages of agri-tourism
General advantages of tourism products or services include the following (Saayman, 2013:26):
It creates new job opportunities for the people of that area.
The tourism industry works primarily with people; therefore, it is labour-intensive.
There is a variety of entrepreneurial opportunities in the industry.
Infra- and superstructures are better developed around tourism products.
Cross-cultural relationships are built in tourism.
International tourists generate foreign currency that in turn enhances the local
economy.
Tourism not only benefits one area, but also has a multiplying effect that generates
more money and more opportunities.

45
It is a great opportunity to expand education and to teach tourists about different
aspects of the industry.
Tourism helps to preserve the heritage and traditions of people in that area.
Each of these advantages of tourism has a positive effect on agri-tourism.
Benefits of agri-tourism to tourists, producers, and communities include the following
(Balmurugan et al., 2012:45; Bernardo et al., 2004:2; Jensen et al., 2014:118; Malkanthi &
Routry, 2011:46; Myer & De Crom, 2013:297; Pittman, 2006:8; Privitera, 2009:2; Schilling et al.,
2014:69):
It creates the opportunity for producers to generate an additional income (through
accommodation, tours, or direct marketing and selling to consumers).
It creates new employment opportunities that stimulate economic development in
communities.
It expands the operations of a farm to allow them to take part in more activities.
It stimulates the upgrading of local facilities and services to accommodate more
people travelling to that area.
It helps to diversify the local economy with different agri-tourism products and
stabilises the economy with the constant flow of tourists.
It creates the opportunity to educate visitors, particularly children, on the agriculture
industry and food production.
It provides an alternative use for agricultural land that might be converted for
residential or commercial use. To remain under agriculture use, it helps to maintain
the viability of the operation.
It creates awareness of local agricultural products among people.
It creates the opportunity to develop new business enterprises in communities.
Since local resources are used in agri-tourism, outside employers and the threat of
being outsourced is not important.
It contributes to the long-term sustainability of the farm as a business.
It provides an alternative form of tourism to tourists/visitors in the form of outings
without much planning that is affordable and easily accessible.
It creates the opportunity for local tourism officials to promote existing tourism
attractions in the area.
It helps to achieve certain tourism goals such as increasing the volume of visitors to
the specific area and to increase the period that visitors stay in the area.
It creates a win-win situation for both the agricultural and tourism sectors by bringing
the major primary agriculture industry and the major service tourism sector together.

46
It facilitates the expansion of the agricultural and tourism sectors.
It creates opportunities for the tourism sector to enlarge.
Sharpley and Sharpley (1997:40) identify several benefits for the development of rural tourism,
namely:
There can be new job opportunities in tourism-related businesses, including
transport, entertainment, catering, accommodation, and retailing.
Existing service employment opportunities such as transport, medical care,
hospitality, crafts, and traditional rural industries are safeguarded.
The local economy becomes broader and more stable because the rural tourism
diversifies the economy.
The existing businesses in the area are supported better by the continuous flow of
tourists.
New businesses might see the opportunity to expand to particular areas, which
further diversifies and strengthens the local economy.
Local services, such as health care and public transport, are maintained and
supported better.
New attractions and facilities, such as sport centres, cultural or entertainment
facilities, can be built for the new tourists.
Different communities come together through rural tourism; thus, there is an
increase in social contact.
Rural tourism helps to create greater awareness of the crafts, customs, and cultural
identities of the local communities.
Rural tourism provides financial support and stimulus to protect, improve, and
conserve the natural rural environment.
Historically built environments such as gardens, parklands, and country houses are
preserved and improved.
Rural tourism can also lead to environmental improvements in rural towns and
villages, including traffic regulations, general improvements to buildings, and litter
disposal.
In a study conducted by Myer and De Crom (2013:301), tourists identified the following as
possible benefits of agri-tourism activities on farms in order of importance:
Educating tourists
Offer exposure for the farmer
An income for farmers

47
Increase in local tourist activities or attractions
Add value to products
Gain recognition for farmers
2.4.2 Disadvantages of agri-tourism
General disadvantages of any tourism product or service include the following (Saayman,
2002:17; Saayman, 2013:27):
The industry can be very seasonal since many tourism products are dependent on
the weather, especially outdoor activities.
With the seasonality of tourism, prices of local products may rise for peak seasons.
Local businesses see the opportunity to make a profit from the tourists, but the local
communities/permanent residents must also pay these price increases, which can
have a negative effect on the local communities/permanent residents.
In an underdeveloped area, a tourism product or attraction can lead to large
economic growth. However, if the area is fully dependent on this tourism product or
attraction, a sudden closure of the product/attraction for some reason can lead to
the bankruptcy of the entire area.
A risk that comes with the infra- and superstructure development of an area is
overdevelopment where natural resources are exhausted, or the local communities
are affected negatively.
The risk of developing tourism opportunities only in certain areas may lead to a
geographic, economic distortion.
The tourism industry also has opportunity costs, such as promoting this industry at
the expense of another industry competing in the same market.
With the new job opportunities, comes the risk of employing ‘outsiders’ instead of
the local communities. There is also a risk of imported services and supplies.
Tourism can lead to additional expenses for the local area such as littering,
pollution, or ever the destruction of property.
The conflict between the local community/permanent residents and the tourists who
are there for a holiday can occur.
The moral conduct between the tourist and the host community can differ with
regard to safety and security, languages, gambling, health, and religion, causing a
negative effect on the host community.
The risk of noise pollution, visual pollution, air pollution, water pollution,
overcrowding, ecological disruption, improper waste disposal, environmental
hazards, and congestion.

48
Certain risks that farmers who implement agri-tourism must take can also be disadvantages of
implementing agri-tourism on their farms (Myer & De Crom, 2013:302):
The farmers need to pay very high liability insurance for the people who are visiting
their farms.
Any damages to the farmer’s crops need to be carried by the farmer himself/herself.
Any damages to the farmer’s property need to be carried by the farmer
himself/herself.
Day visitors to the farm disrupt the normal farming activities of the day.
There is an increase in noise levels.
Farmers carry the risk of animals coming to their farm and infecting their farm
animals with diseases.
Sharpley and Sharpley (1997:42) have identified several costs or disadvantages for rural
tourism development, namely:
When there is an increase in demand, the cost of public services such as medical
services, police, and refuse collection also increases to satisfy the needs of the
increase in tourists.
The job opportunities that rural tourism creates may be seasonal or just part-time.
Rural tourism can lead to an increase in the prices of goods, services, land, and
buildings.
The social costs of rural tourism can include antisocial behaviour such as an
increase in crime.
There can be a reduction in local services to make room for more commercialised
shops, such as replacing a traditional shop with a souvenir shop or restaurant to
accommodate the tourists.
From a cultural view, rural tourism introduces new styles, ideas, and behavioural
modes, which can put a strain on the traditional culture, views, and values of the
local community.
A lack of housing can cause conflict between the local community and new
residents because of the increase in demand.
The strong presence of the human factor in tourism can cause damages to the
natural and man-made environment.
Rural tourism can cause high levels of pollution in rural areas, such as noise, visual,
air, or rubbish pollution.

49
2.5 PREVIOUS STUDIES/RESEARCH ON AGRI-TOURISM
Table 2.2 examines a few different research papers that were written on agri-tourism nationally
and internationally during the past ten years in order to understand what has been done in this
regard.
Table 2.2: Previous research on agri-tourism
Author(s) conducting the research
Title of the research paper
The goal and outcome of the research
Barbieri & Mshenga (2008)
The role of firm and owner characteristics on the performance of agri-tourism farms.
This research was done to identify the characteristics of farmers who successfully implement agri-tourism in terms of annual gross sales. The authors identified several characteristics, including the period the farmers had operated a business, the number of employees on the farm, as well as the size of the farm. Other characteristics that were identified included if it was a working farm, the location of the farm, whether the farmer had a business and marketing plan, the farmer’s education level, as well as the source of his start-up capital.
Hatley (2009) The nature of agri-tourism in the Buffalo City Municipality.
This study was conducted in the Eastern Cape Province of South Africa to evaluate the nature of agri-tourism in a certain area. The author found that most of the farms in the area were less than 10 hectares in size, mostly involved with poultry, cattle, pigs, dairy cows, horses, and horticulture. Popular agri-tourism activities in the area included horse-trails, swimming, walking, bird watching, beer brewing, freshwater angling and volleyball.

50
Author(s) conducting the research
Title of the research paper
The goal and outcome of the research
Phillip, Hunter & Blackstock (2010)
A typology for defining agri-tourism.
The authors developed a typology to understand and define agri-tourism better. The five main types were identified as:
• non-working farm agri-tourism;
• working farm, passive contact agri-tourism;
• working farm, indirect contact agri-tourism;
• working farm, direct contact, staged agri-tourism; and
• working farm, direct contact, authentic agri-tourism.
Phelan & Sharpley (2011)
Exploring agri-tourism entrepreneurship in the UK.
The authors found that although many farmers were investing in agri-tourism as an alternative way to generate additional income, they lacked many of the skills needed to operate this type of business successfully. Some of the most important skills that farmers thought they needed to manage a successful agri-tourism enterprise were managerial skills, customer service in terms of service expectations and dealing with problems, managing financial resources, accounting and budgeting, and marketing and sales skills.
Tew & Barbieri (2012)
The perceived benefits of agri-tourism: The provider’s perspective.
The perceived benefits of agri-tourism were investigated by considering 16 entrepreneurial goals among which were capturing new customers, educating the public on agriculture, enhancing the quality of family life, serving current customers better, keeping you active, better utilisation of farm resources, keeping the farm in the family, etc.

51
Author(s) conducting the research
Title of the research paper
The goal and outcome of the research
Rogerson (2012) Tourism-agriculture linkages in rural South Africa: Evidence from the accommodation sector.
The study focused on the food supply chain of 80 luxury African safari lodges and analysed the linkages between tourism and agriculture. Positive trends that were identified include an increase in niche market production, a rise in food quality and variety in SA, and an increase in tourist interest in local food and fair trades.
Myer & De Crom (2013)
Agri-tourism activities in the Mopani District Municipality, Limpopo Province, South Africa: Perceptions and opportunities.
The results of this study revealed that 57% of the respondents had heard of the term agri-tourism before. This identified a large gap in the perception of people in the area regarding agri-tourism, since the term is still relatively unknown. One of the main reasons for participating in agri-tourism activities was to expand their knowledge. The authors identified two major locations that had much agri-tourism potential, namely Magoebaskloof and Tzaneen. Recommendations by the authors included to nurture subsistent farmers into small-scale farmers as a model to develop agri-tourism, as well as to work together and host ‘farmer markets’ in the area.
Van Niekerk (2013) The benefits of agri-tourism: Two case studies in the Western Cape.
The author did two case studies, namely Keisies Cottages (outside Montagu) and Tierhoek Cottages (outside Robertson). International trends as well as new findings that were relevant to the South African context were found. Four themes were discussed with regard to the case studies, namely agri-tourism and food, women and agri-tourism, farm workers and Sen’s capabilities approach, and challenges faced by agri-tourism farmers.
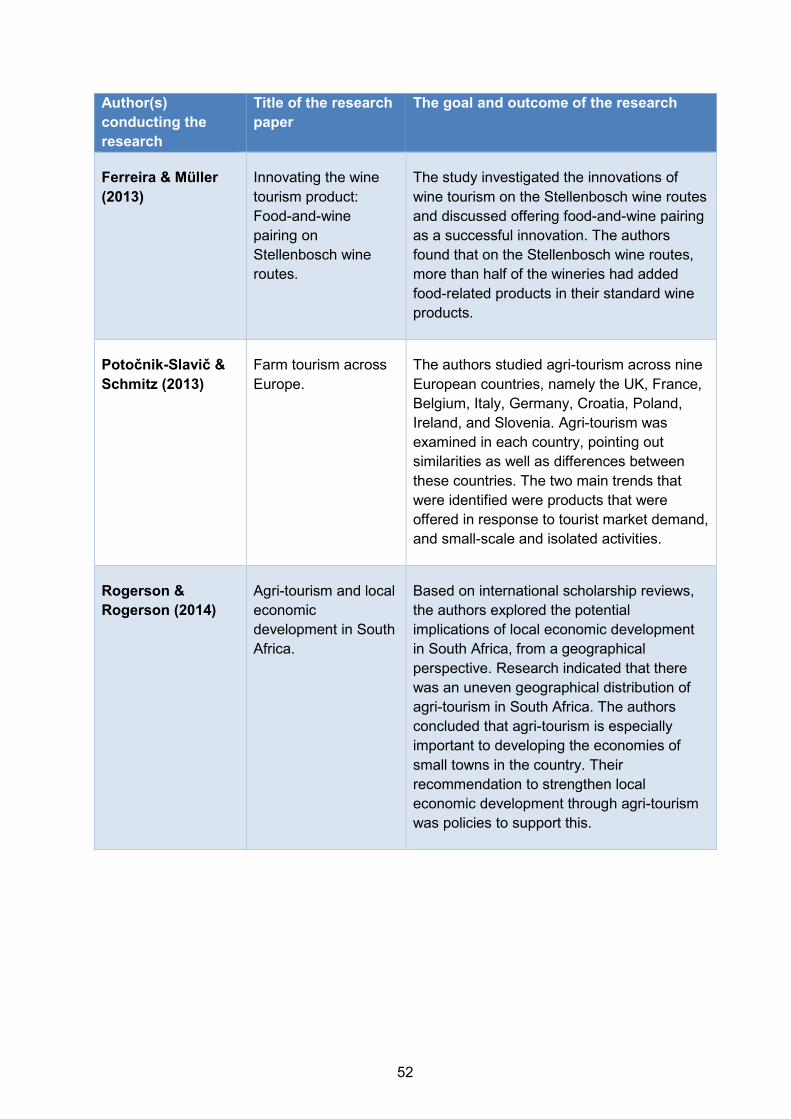
52
Author(s) conducting the research
Title of the research paper
The goal and outcome of the research
Ferreira & Müller (2013)
Innovating the wine tourism product: Food-and-wine pairing on Stellenbosch wine routes.
The study investigated the innovations of wine tourism on the Stellenbosch wine routes and discussed offering food-and-wine pairing as a successful innovation. The authors found that on the Stellenbosch wine routes, more than half of the wineries had added food-related products in their standard wine products.
Potočnik-Slavič & Schmitz (2013)
Farm tourism across Europe.
The authors studied agri-tourism across nine European countries, namely the UK, France, Belgium, Italy, Germany, Croatia, Poland, Ireland, and Slovenia. Agri-tourism was examined in each country, pointing out similarities as well as differences between these countries. The two main trends that were identified were products that were offered in response to tourist market demand, and small-scale and isolated activities.
Rogerson & Rogerson (2014)
Agri-tourism and local economic development in South Africa.
Based on international scholarship reviews, the authors explored the potential implications of local economic development in South Africa, from a geographical perspective. Research indicated that there was an uneven geographical distribution of agri-tourism in South Africa. The authors concluded that agri-tourism is especially important to developing the economies of small towns in the country. Their recommendation to strengthen local economic development through agri-tourism was policies to support this.

53
Author(s) conducting the research
Title of the research paper
The goal and outcome of the research
Fourie (2015) Factors influencing visitor loyalty at an agri-festival in South Africa.
Factors that influence visitors’ loyalty to an agri-festival such as Nampo include image, visitor attributes, customer satisfaction, festival attributes, behavioural intentions, and travel motives. A demographic profile drawn up from the respondents’ data concluded that most of the visitors were male (65%), with an average age of 39 years, 32% from the Free State Province, 77% Afrikaans-speaking and 31% were farmers.
Agbeh & Jurkowski (2016)
Preparing for Baby Boomers as an Agri-tourism market.
With an increase in the number of people over the age of 60 who were travelling, this study focused on making recommendations for strategies focusing on the needs of the agri-tourism market. It also considered tourists who were mobile impaired or disabled and identified ways to accommodate them.
Maksymov (2017) Descriptive analysis of agri-tourism in Louisiana: Motivation. Marketing. Limitations.
In this study, the author analysed ways to promote agri-tourism and found that most of the farmers did not spend much money on advertisements and mostly relied on word of mouth. Four key issues that farmers faced in operating agri-tourism were identified as legal, financial, marketing and management issues.
Broccardo, Culasso & Truant (2017)
Unlocking value creation using an agri-tourism business model.
This study was aimed at analysing key success factors of Italian agri-tourism. The authors identify internal employees as key partners and key resources who support the core business and key agri-tourism activities. Financial sources, mainly by family investments, are also a key factor. Customer satisfaction and an increase in efficiency are other ways to add value.

54
2.6 AGRI-TOURISM AROUND THE WORLD
Over thirty years ago, agriculture was described as the “most important industry of tropical
Africa” (Upton, 1987:3). Over time, the farm gate prices (the value of the products leaving the
farm) fell and more and more farmers diversified their farms into tourism to stay in business
(Jamal & Robinson, 2009:360). This situation can be seen in many developed countries over
the world.
Grigg (1974:1) states that the origin of agriculture dates back at least 10 000 years. About four
fifths of the world’s population did not live in urban or suburban areas until just more than a
century ago. Thus, most people were directly or indirectly dependent on agriculture. Even after
industrialisation and urbanisation, about half of the world’s working population is still actively
involved in the agriculture industry.
Whittlesey (sited by Grigg, 1974:3) identified several major types of farming around the world,
namely:
Shifting agriculture
Wet-rice cultivation in Asia
Pastoral nomadism
Mediterranean agriculture
Mixed farming in Western Europe and North America
Dairying
The plantation system
Ranching
Large-scale grain production
The general perception of agriculture is that it includes both the cultivation of crops and the
rearing of livestock.
According to Lew (2012), agri-tourism is not a new phenomenon, since this form of travel has
been around for many years. In this respect, a list of the top eight agri-tourism destinations in
the world was compiled and included the following:
Taiwan (Asia)
Tuscany (Italy – Europe)
Mallorca (Spain – Europe)
Brazil (South America)
Hawaii (US – North America)
55
Grenada (Caribbean – North America)
California (US – North America)
Philippines (Asia)
Van Niekerk (2013:48) identifies the following international trends in the literature on agri-
tourism:
Agri-tourism is beginning to be a fast-growing sector in the world.
The most popular agri-tourism activity is accommodation on farms.
Agri-tourism has its limits, as it is not always the answer to problems on farms (a
substantial economic increase in income is not guaranteed).
An important element that should be considered when exploring agri-tourism as a
diversification option is accessibility.
2.6.1 Examples of agri-tourism from the United States and Canada
According to Holland and Wolfe (2001:3), agri-tourism such as farm-related recreation and
tourism dates back to the late 1800s. Families living in urban areas would visit their farming
relatives when the city temperatures were too high. In the 1920s, country visits escalated due to
the number of people who began making use of automobiles. During the Great Depression and
World War 2 in the 1930s and 1940s, rural recreation became popular once again in an attempt
to escape from stress (Holland & Wolfe, 2001:3). The industry started growing, resulting in
widespread interest in farm nostalgia, farm petting zoos and horseback-riding in the 1960s and
1970s. In the 1980s and 1990s, bed and breakfast accommodation, farm vacations, and
commercial farm tours became very popular (Holland & Wolfe, 2001:3).
According to Holland and Wolfe (2001:4), the term agri-tourism were used more in the US
during the 1990s to “describe anything that relies or builds on the relationship between farming
and tourism”. In certain areas of the US such as Michigan, agricultural restructuring have
affected smaller farms disproportionately(Che et al., 2005:225). Entrepreneurial farmers in
these areas turned to agri-tourism. This value-added way was used to capitalise on their
strengths such as their comparative advantages and their locations near tourist-generating
areas (Che et al., 2005:225). Agri-tourism was utilised successfully by working cooperatively,
rather than competitively. This was done by combining resources in order to achieve more, such
as producing brochures and web linkages, sharing information that could improve one’s
operations and products, referrals to other businesses, and working together so that a place-
based agri-tourism identity was created (Che et al., 2005:232).

56
Holland and Wolfe (2001:8) state that there is not one comprehensive strategy that can be used
to guarantee success. Similar to a road map that shows a person how to get from where he is to
where he wants to be, Holland and Wolfe (2001:8) compare a marketing plan to a road map that
guides a person to where he wants to be. A marketing plan is a creative process that can
provide invaluable information with regard to the marketplace to the farmers. Holland and Wolfe
(2001:9) divide a marketing plan into eight elements.
From a statistical approach, Holland (2015:1) identified the following growth in agriculture in
Tennessee from 1997 to 2012:
Farmers with direct sales to consumers: +36.6%
Value of farm products sold directly to consumers: +128.9%
Farms producing and selling value-added products: +30.6%
Farms marketing products through community-supported agriculture: +5.98%
From 2007 to 2012, there was a 20.8% increase in the number of farms with both agriculture
and recreational sales, as well as an 83.1% increase in the value of these sales (Holland,
2015:1). According to a survey of agri-tourism operations in Tennessee in 2013, there was an
average of 1 000 visitors per agri-tourism farm per year (Holland, 2015:1). The average sales
per visitor were calculated as $35.12, which resulted in a total state-wide economic
enhancement of $34.4 million per year.
In a study conducted in Virginia in 2004, researchers identified the most popular types of
agricultural businesses that farms operated (McGhee & Kim, 2004:161). The most popular form
was a ‘working farm’ (55.1%), followed by ‘pick-your-own’ (27.4%) as well as an ‘on-farm
market’ (26.6%). Other farm activities included ‘Christmas tree farm’ (18.8%), ‘roadside stand’
(15.9%), and ‘educational activities’ (13.8%). Some of the least popular activities in the area
included ‘farm vacation’ (0.08%) and ‘guiding/outfitting’ (0.05%). The survey also identified the
motivations that farmers had for operating agri-tourism activities on their farms, which included
to generate an additional income, to utilise resources fully, to educate consumers, to employ
family members, and as a tax incentive.
In a study conducted in Missouri and North Carolina in 2010, respondents were asked to
identify the most important words that they believed should be included in the definition of agri-
tourism (Rich et al., 2012:1). Respondents clearly understood the farm aspect and identified
both ‘farm’ and ‘farming’ as essential words, together with an ‘agricultural setting’. Other aspects
such as ‘entertainment’, ‘education’ and ‘recreation’ were also identified, as they were clear
motives to attract tourists to the activity/attraction. An interesting word that was identified was
‘working’. Since the definition of each word was not stated in the survey, it can be interpreted

57
either as the working farm activities that tourists saw and experienced, or as the tourists having
to be actively involved in the farm activities and work physically.
From a study conducted on Americans in 2000, Carpio et al. (2008:268) identified that the
average visitor demanded to travel to a farm 10.3 times per year. Factors influencing a person’s
decision to become a farm visitor include race and location of the resident.
Carpio et al. (2008:225) mention three factors that are believed to have led to an increase in
demand for agri-tourism. First, an increase in discretionary income has resulted in a general rise
in demand for outdoor recreation. According to certain trends and future projections, this
demand will continue to increase. Second, families are more content to travel together,
especially by car, while seeking recreational activities and experiences. Third, a few authors
have indicated that the public shows a growing interest in supporting local farmers in their
areas/countries (Carpio et al., 2008:255). The estimated annual income that is generated from
agri-tourism on US farms ranges from $800 million to $3 billion.
The Agri-business Council of Oregon (2003:25) compiled an ‘Agri-tourism Workbook’. They
advise farmers to investigate the following aspects while planning to implement agri-tourism:
Zoning and land use regulations
Licensing requirements (where applicable)
Liability insurance and risk management
Developing a business plan
Financing your enterprise
Marketing your product
Networking and identifying resources
Comen and Foster (2006:1) identify several critical success factors for agri-tourism, namely:
Ability to manage the visitor’s experience
Passion for learning
Creativity
Ability to match core assets with customers’ requirements
Strong social skills
Financial/enterprise analysis
Location (proximity to other attractions)
Marketing/understanding customer needs and expectations

58
Brookover and Jodice (2010:11) created a product development plan for agri-tourism based on
a study in South Carolina. The main elements in the plan for training/outreach/education include
the following:
Educating/informing the local community about the agri-tourism opportunities
Creating a curriculum around agri-tourism for early education
Providing resources for both potential and existing agri-tourism
Based on a study in Canada, Oredegbe and Fadeyibi (2009:11) make several
recommendations to assist farms who want to diversify their farms to include agri-tourism
activities or attractions. First, the farmer needs to re-evaluate his/her operations constantly to
remain competitive and successful. As the industry and the tourists’ needs are changing
constantly, new strategies and practices should be developed to target more visitors and to
encourage them to spend more money and stay longer. For example, Agbeh and Jurkowski
(2016:1) identify an increase in baby boomers travelling to agri-tourism destinations. This new
trend creates the need to accommodate tourists with mobility impairments or other disabilities of
which farmers should be aware. Second, without infrastructures and other essential services,
the success of developing and promoting agri-tourism is uncertain. Therefore, Oredegbe and
Fadeyibi (2009:11) suggest that the provincial government and municipalities should invest in
rural infrastructures. Third, there should be assistance and training support with regard to the
business and marketing plans of agri-tourism elements on farms. By examining these plans,
practical recommendations can be made that will make the implementation process more
efficient. Last, it is important to identify the person responsible for the agri-tourism on the farms,
whether it is the man or the woman. This knowledge is an essential guideline when planning
essential training and assistance.
2.6.2 Examples of agri-tourism from Australia and New Zealand
In Australia, agri-tourism and food tourism play significant roles in the growth of rural and
regional communities (Ecker et al., 2010:1). Ecker et al. (2010:1) identify two main reasons for
the growth in the agri-tourism and food tourism industries. First, structural and market
adjustments have caused significant changes in the agricultural sector, forcing farmers to
investigate other potential sources of income. This includes agri-tourism and food tourism
opportunities. Second, there has been an increase in people living in urban areas who want to
know and understand more about rural life. This includes experiencing the origins of food on a
farm first-hand. Other factors that have influenced these industries and the growth rate are the
increase in mobility of people as well as a decline in population in some areas, from rural to
urban or vice versa (Ecker et al., 2010:1). Little attention has been devoted to research about

59
agri-tourism and food tourism in Australia, causing major gaps in national knowledge about
these areas (Ecker et al., 2010:4).
Ecker et al. (2010:4) summarised several studies conducted in Australia from 1998 to 2007. The
researchers concluded that out of 5514 surveys, only 2.2% of the respondents indicated that
they had farm accommodation or ecotourism operations on their farms. Other authors have
identified this percentage to be even smaller (Ecker et al., 2010:4). In a more recent study
conducted by Ecker et al. (2010:11) among farmers who were hosting agri-tourism and/or food
tourism on their farms, the researchers found an average of 10.8 years that their businesses
had been operational. The highest values recorded were from three respondents who had been
operating their businesses between 30 and 40 years. The role of women in agri-tourism and
food tourism was also investigated. Ecker et al. (2010:15) found that of their female
respondents, 36% represented principal owners, 46% principal managers, 59% co-managers,
and 59% co-owners.
Ecker et al. (2010:14) identified the following benefits of agri-tourism and food tourism:
It is an additional source of income
Helps to create a recognisable brand name for the agricultural products of the farm
Helps to educate consumers/visitors about farming activities and the rural heritage
of the area
Increases the motivation among locals and visitors to protect the natural resources
and natural amenities
Multiplier effect – creates economic development opportunities for the local
communities with addition tourists visiting their town
Several barriers regarding agri-tourism and food tourism were identified (Ecker et al., 2010:22):
Regulations (e.g. food, safety, building, etc.)
A lack of involvement of farmers and the agriculture industry in leadership roles in
agri-tourism ventures
A lack of labour/skill shortage
Issues with small business resources
Issues with signage
Issues with roads and infrastructure
Public liability (as well as insurance requirements)
A lack of knowledge and/or commitment to agri-tourism

60
Ecker et al. (2010:26) identify food festivals and special events as key marketing strategies to
promote local products and experiences. Even though these festivals also receive criticism, they
are regarded as a large factor in promoting the region in which they are hosted. However, Ecker
et al. (2010:26) point out that these events should be highly organised and well-supported.
From an online survey, Ecker et al. (2010:28) identify the following marketing methods that were
used by agri-tourism businesses: word-of-mouth (18%); internet (16%); tourist visitor centres
(15%); local tourism organisations (14%); roadside signs (12%); flyers and brochures (11%);
and printed media (11%).
In conclusion, Ecker et al. (2010:37) identify six key aspects that can support and enhance
involvement in agri-tourism:
Define agri-tourism
Understand the market and how to respond to it
Develop strategic approaches
Models and methods of training should be developed
Enhance the elements, from the products to distribution
Integrate resources (agri-tourism and food tourism)
In New Zealand, Agritour is the largest tourism company that specialises in agricultural tours
(Agritour, 2008). It focuses on agricultural, horticultural, garden, forestry, rural, and special-
interest tours. Their interests include sheep farming, beef raising, meat packing, meat industry
research, dairying, kiwifruit production, sheep and cattle breeding systems, agricultural
broadcasting, and printed media journalism.
2.6.3 Examples of agri-tourism in Europe
In a study done in Eastern Europe (Romania), Călina, Călina and Stan (2017:33) investigated
the potential of tourism and agri-tourism in protected areas in the Cozia National Park. By
means of a SWOT analysis and other research over a period of 20 years, the researchers found
that the principles of ecologic sustainability were the only workable option for tourism and agri-
tourism practices in the area of the national park. These principles focus on not damaging the
natural environment but rather building it and contributing to a positive economic and social-
cultural life.
European farms used agri-tourism involving farm accommodation as well as branded regions
for cheese, wine, and fruit to help them deal with the falling prices of commodities in the late
nineteen-hundreds (Veeck et al., 2006:238). According to Sidali (2011:4), agri-tourism in central
Europe (Germany) dates back to the 1850s but began to boom only in the 1970s. Owing to

61
uncertainty in the agriculture market during the 1990s, there was significant investment in the
agri-tourism sector. A common activity was renovating farm buildings into tourist
accommodation (Sidali, 2011:4). It is estimated that agri-tourism is offered by about 25 000
farms in Germany, generating an annual turnover of € 943 million, which contributes to between
25% and 35% of the overall income (Sidali, 2011:5).
In other parts of central Europe, researchers identified nine motivations for entering
the agri-tourism business in the Czech Republic (Pilař et al., 2012:61). The top
motives are listed in order of importance, as follows:
The farmers’ economic survival depends on the success of their agri-tourism
businesses.
The farmers’ interest in agri-tourism is driven by their need for new sources of
income.
The farming and ranching business is not lucrative enough to make a living from it.
Farmers can work from the farm when implementing agri-tourism and do not need to
travel for their jobs.
The economic survival of the community is partly dependent on agri-tourism.
The farmers’ interest in agri-tourism is driven by their desire for a prosperous
community.
Less important motives for farmers to implement agri-tourism include the following:
Agri-tourism provides more satisfaction in terms of operating a business than the
extra income it generates.
The social element of meeting new people through agri-tourism is more important
than the money they make.
The farmers’ interest in agri-tourism is driven by the possibility of receiving grants.
Pilař et al. (2012:61) identify the most important motive for implementing agri-tourism on farms
as the financial advantages that it offers the farmer and the community. According to Niedziolka
and Brzozowska (2009:105), the agri-tourism industry in Poland has grown to thousands of
farms in the area.
Agri-tourism in western and southern Europe (Italy) developed rather late when compared to the
northern European countries and was announced officially in the 1980s (Sidali, 2011:12). Some
of the first agri-tourism activities include business from winemakers. Since the rapid growth of
the sector, agri-tourism in Italy has grown by 65% between 1997 and 2004, resulting in around
14 017 agri-tourism farms. Agri-tourism in Italy is supported by associations such as Agritourist,
Terranostra, and Turismo Verde, which in turn are supported by the national agriculture
associations (Sidali, 2011:14). Strengths that were identified for Italian agri-tourism include the

62
wide variety of farmhouses built with great architectural precision, a rich heritage in oenology
and gastronomy, the positive and fascinating image of Italy, and the legal status of agri-tourism
in the country that provides its own fiscal advantages (Sidali, 2011:17).
Potočnik-Slavič and Schmitz (2013:268) identify several common characteristics that some of
the European countries offer in terms of agri-tourism, namely:
Agri-tourism contributions in all the studied countries were rather moderate in terms
of the general tourist market. This was concluded from the perception of total
income, the number of overnight stays, or the number of farm tourism properties.
To date, there has been no common understanding of agri-tourism or even an
operational definition of agri-tourism in these countries.
Common reasons for implementing agri-tourism include an attempt to gain a stable
income on the farm, the practical use of existing farm potential and capital stock, as
well as a desire for socialisation.
A common challenge is to balance these new agri-tourism activities with the main
income activities (usually agricultural).
All agri-tourism farmers noted the continuous changes in the demands of the
tourists, creating the need to examine and follow new trends.
In terms of marketing and communication, web portals and central registration
systems were used to bring agri-tourism closer to a wider world market.
Major advantages that agri-tourism offer in comparison to other forms of tourism
include authenticity, attractiveness, uniqueness, and personal contact.
Another positive effect of agri-tourism is the intimate links with nature.
Haugen and Vik (2008:321) describe farmers who host agri-tourism as farm entrepreneurs.
Around 2008, European agriculture was under considerable economic pressure, which led to
the increased development of farm-based tourism (Haugen & Vik, 2008:328). Haugen and Vik
(2008:323) state that agri-tourism is not a new phenomenon in Europe or in Norway, as agri-
tourism in Norway could already be seen in the 1870s through the upper-class European
travellers who discovered the Norwegian valleys and fjords. In a study on Norwegian farmers,
Haugen and Vik (2008:333) identify several individual characteristics of farm-tourism
entrepreneurs (farmers hosting agri-tourism), including that they have a higher level of
education, agri-tourism is a not an individual farmer strategy but rather a household strategy,
they are married with the majority of the women actively involved in the farm, and the main
farming activities are dairy and livestock.

63
2.6.4 Examples of agri-tourism in Asia
Malkanthi and Routry (2011:53) performed a field survey in Sri Lanka in 2009. These
researchers identified strengths and weaknesses in the internal environment of agri-tourism
development, as well as opportunities and threats in the external environment of agri-tourism
development in the country. Although these elements were identified in a Sri Lanka context,
most of these elements are applicable to agri-tourism development in any country and are
mentioned only in general terms.
(a) Strengths
A significant number of farmers with private property are available for developing
agri-tourism.
Many attractive agricultural landscapes are available for developing agri-tourism
with unique features in the area.
A clean and healthy environment with beautiful natural landscapes is available.
There are knowledgeable and energetic farmers in the communities who can be
useful in developing agri-tourism.
Significant levels of family labour are available.
Traditional farming activities such as organic farming are present.
Traditional cultural activities that include various livelihoods are available.
Owing to the absence of industrial activities in certain areas, there is a preserved
environment that can be used for developing agri-tourism.
(b) Weaknesses
There is a lack of large-scale farms in Sri Lanka.
Agri-tourism is not a common term among farmers in terms of tourism and
attractiveness.
Farmers have a poor level of management and entrepreneurship skills.
There are low levels of production in terms of farm products.
There is insufficient infrastructure such as rural road systems, public water supply
systems, power supply, and waste management systems for agri-tourism.
Funding and external resources available for building renovations for agri-tourism
purposes are insufficient.
Sufficient rules, regulations, and policies are not in place to improve agri-tourism
effectively.

64
(c) Opportunities
Several attractive tourist locations are available.
There is an opportunity for mutual co-operation between farmers and local
organisations.
The high unemployment rate among the youth is high and can be utilised as
employment in the agri-tourism sector.
The government focuses more on developing sustainable rural tourism.
There is an increase in the demand for agri-tourism among visitors.
(d) Threats
There is a lack of concern and contribution from the government with regard to
agricultural problems of the area.
There is competition from other holiday destinations that are more traditional.
The accumulation of non-decaying waste in the farming areas.
Agri-tourism can cause gradual damage to the environment, which makes it more
difficult to protect the environment.
Owing to the changes in the natural landscape of the area, the urbanisation of rural
places has increased.
2.7 CONCLUSION
To conclude, the aim of this chapter to understand what the term agri-tourism entails, as well as
to understand how if forms part of the larger tourism industry. This chapter defined many
different types of agri-tourism elements in the literature, from definitions to typologies and
system models. It is important to understand what agri-tourism is in order to implement
successfully and sustainably. All agri-tourism activities or attractions can be divided into five
categories, namely outdoor recreation, educational experiences, entertainment, hospitality
services, and on-farm direct sales. While a long list of different activities or attractions has been
discussed in this chapter, more activities or attractions may still be available in the world of agri-
tourism. The most well-known and popular activities or attractions were discussed briefly to
understand what they entail.
Agri-tourism offers a long list of advantages to farmers and local communities in terms of job
opportunities, additional income, local economic input, entrepreneurial opportunities,
infrastructural upgrades, and more. All these can be long-term advantages if agri-tourism is
implemented sustainably. However, disadvantages to implementing agri-tourism need to be

65
managed from the beginning. For example, the risk of pollution when implementing a tourism
element can be managed when the farmer is aware of it.
A list of previous studies/research over the past ten years was discussed to understand what
type of research was conducted and on what the researchers focused. This identified relevant
South African research on area-specific agri-tourism elements that farmers have implemented.
A brief overview of agri-tourism around the world identified several elements of agri-tourism in
the United States, Australia, New Zealand, Europe, and Asia. Many of these countries have
conducted SWOT analyses with regard to agri-tourism or designed models including marketing
models.
This chapter covers all the tourism aspects that should be included in the questionnaire section
of the study, including and most importantly the different agri-tourism activities or attractions that
can be found in South Africa.

66
CHAPTER 3: AN ANALYSIS OF AGRICULTURE AND TOURISM IN THE NINE SOUTH AFRICAN PROVINCES
3.1 INTRODUCTION
Several forces influence Agriculture directly and indirectly. Oredegbe and Fadeyibi (2009:10)
identify internal and external forces. Internal forces include the available resources on the farm,
the farmer’s financial capital, risk tolerance level, and other assets. External forces include
economic stability, political stability, changes in technology, and the policies and laws that the
government implements.
The purpose of this chapter is to provide an overview of the agriculture and tourism industries in
South Africa. First, a background to South Africa focuses on employment. Employment in both
the agriculture and the tourism industries will be discussed. Focusing on agriculture, the next
part will examine the agriculture industry in South Africa, including economic aspects, role
players, and shows. Since this study focuses on commercial farmers, this sector will be
discussed, including the different types of farming activities. Next, the tourism industry in South
Africa will be examined with regard to economic contribution and tourism products. Finally, a
broad overview of each province in South Africa will be given while examining the agricultural,
tourism, and economic effect of each province.
3.2 BACKGROUND TO SOUTH AFRICA
South Africa lies on the southernmost point of the African continent and covers a land surface
area of 1 219 602 km² that is divided into nine provinces (Tibane, 2016:vi). The country is home
to 56,52 million people, of whom 51% (roughly 28,9 million) are female (Statistics South Africa,
2017a:1). South Africa is multilingual with eleven official languages, namely English, Afrikaans,
Sesotho, Setswana, isiZulu, isiXhosa, isiNdebele, SiSwati, Sepedi, Setswana, Tshivenda and
Xitsonga (Tibane, 2016:12). Most South Africans can speak at least two or more languages.
South Africa is part of a subtropical zone (Nell, Maine & Basson, 2006:470). The diverse
topography in South Africa causes agricultural production to be practised under various
topographical and climatic conditions (Nell et al., 2006:467). The average temperature can
increase to as high as 40 °C on hot summer days, and drop as low as -17 °C during extreme
winter colds. The climatic conditions are affected mainly by the altitude of the area and the
proximity to the ocean. The West Coast and Cape area experience a winter rainfall, while more
inland regions have a dry, cold winter and summer rainfall. The East Coast and Durban areas
are known to be humid and have warm to hot conditions. Goldblatt (2010:2) agrees with the

67
background of the agricultural setting in South Africa provided by Nell et al. (2006:467).
Goldblatt (2010:2) states that South Africa can be divided into distinct farming regions. Farming
activities in these regions range from large crop productions in areas with winter rainfall and
high summer rainfall, to the Bushveld that is home to cattle ranching and more arid regions
where sheep farming is popular. When considering the geographical setting in South Africa,
only 12% of the country is suitable for the production of rain-fed crops, 3% is considered truly
fertile land, and 69% of the land is suitable for grazing. This concludes that livestock is the
largest agriculture sector in the country, according to Goldblatt (2010:2).
Water scarcity in South Africa has a great effect on agriculture in the country (Nell et al.,
2006:470). UNESCO (cited by Nell et al., 2006:469) examined the bioclimatology of South
Africa and concluded that 90% of the country is arid and semiarid. Arid refers to an area with
less than 500 mm rainfall per annum, while semiarid refers to an area that has between 500 mm
and 700 mm rainfall per annum. Goldblatt (2010:4) states that largely due to the water scarcity
and declining farming profitability, less than two thirds of the number of farms that was active in
South Africa in the 1990s was still active in 2010.
The Department of Agriculture, Forestry and Fisheries (DAFF) of South Africa issued a mandate
that focuses on policies, strategies, and programmes with the main goal of enhancing
sustainable usage, achieving economic growth, creating more job creations, food security, as
well as rural development (Tibane, 2016:14). In 2015/16, the DAFF reprioritised roughly R502
million for drought relief efforts when South Africa experienced dry weather conditions and
record high temperatures (Tibane, 2016:14). These efforts include delivering water, protecting
springs, procuring water tankers, and refurbishing and drilling boreholes.
South Africa has an industrialised and productive economy that has many characteristics
associated with a developing country (Nell et al., 2006:471). This includes the division of labour
between the formal and informal sector, as well as the uneven distribution of income and wealth
among sections of the population. The formal sector includes manufacturing, mining, services,
and agriculture, which are all relatively well developed in the country (Nell et al., 2006:472).
According to Nell et al. (2006:472) the U.S. Department of State described South Africa as
having a sophisticated financial structure, and ranked the country 18th in terms of the total
market specialisation.
Figure 3.1 illustrates the population distribution between provinces over the past fifteen years. It
is clear that Gauteng is the province with the most people, followed by KwaZulu-Natal and the
Eastern Cape. The population in Gauteng and the Western Cape has grown over the past
fifteen years, while the population in KwaZulu-Natal, the Eastern Cape, Limpopo and the Free

68
State has declined. The Northern Cape has the smallest population and is home to only 2% of
the population of the country.
Figure 3.1: Estimated South African population from 2003 to 2018, per province
(Source: Statistics South Africa 2018b:16)
Figure 3.2 illustrates the percentage of land surface that each province covers in South Africa.
Gauteng covers only 1% of South Africa’s total land surface, followed by Mpumalanga with 6%,
KwaZulu-Natal with 8%, North-West with 9%, and Limpopo with 10%. The Northern Cape
covers almost a third of the land surface in South Africa’s with 31%.
0%
5%
10%
15%
20%
25%
30%
Gauteng KwaZulu-Natal Eastern Cape Western Cape Limpopo Mpumalanga North West Free State Northern Cape
Pers
enta
ge o
f tot
al p
opul
atio
n
Province
Estimate population from 2003 to 20182003 2008 2013 2018
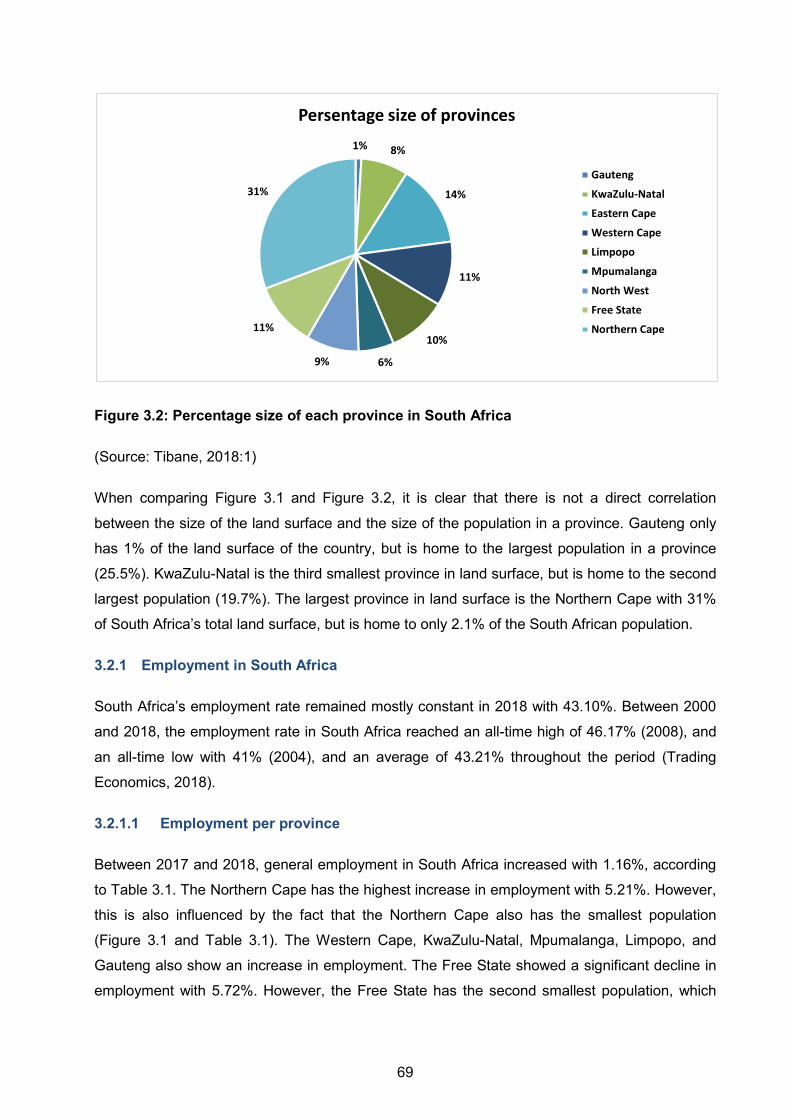
69
Figure 3.2: Percentage size of each province in South Africa
(Source: Tibane, 2018:1)
When comparing Figure 3.1 and Figure 3.2, it is clear that there is not a direct correlation
between the size of the land surface and the size of the population in a province. Gauteng only
has 1% of the land surface of the country, but is home to the largest population in a province
(25.5%). KwaZulu-Natal is the third smallest province in land surface, but is home to the second
largest population (19.7%). The largest province in land surface is the Northern Cape with 31%
of South Africa’s total land surface, but is home to only 2.1% of the South African population.
3.2.1 Employment in South Africa
South Africa’s employment rate remained mostly constant in 2018 with 43.10%. Between 2000
and 2018, the employment rate in South Africa reached an all-time high of 46.17% (2008), and
an all-time low with 41% (2004), and an average of 43.21% throughout the period (Trading
Economics, 2018).
3.2.1.1 Employment per province
Between 2017 and 2018, general employment in South Africa increased with 1.16%, according
to Table 3.1. The Northern Cape has the highest increase in employment with 5.21%. However,
this is also influenced by the fact that the Northern Cape also has the smallest population
(Figure 3.1 and Table 3.1). The Western Cape, KwaZulu-Natal, Mpumalanga, Limpopo, and
Gauteng also show an increase in employment. The Free State showed a significant decline in
employment with 5.72%. However, the Free State has the second smallest population, which
1% 8%
14%
11%
10%
6%9%
11%
31%
Persentage size of provinces
Gauteng
KwaZulu-Natal
Eastern Cape
Western Cape
Limpopo
Mpumalanga
North West
Free State
Northern Cape

70
also affects these statistics. Other provinces that showed a decline in employment include the
Eastern Cape and North-West.
Table 3.1: Employment per province
Province Jul – Sep 2017
Apr – Jun 2018
Jul – Sep 2018
% change from Jul –
Sep 2017 to Jul – Sep
2018
Thousand %
South Africa 16 192 16 288 16 380 + 1.16
Western Cape
Eastern Cape
Northern Cape
Free State
KwaZulu-Natal
North-West
Gauteng
Mpumalanga
Limpopo
2 399
1 421
307
821
2 536
983
5 068
1 204
1 452
2 480
1 402
317
788
2 620
977
5 055
1 212
1 436
2 494
1 390
323
774
2 635
979
5 077
1 231
1 478
+ 3.96
- 2.18
+ 5.21
- 5.72
+ 3.79
- 0.41
+ 0.18
+ 2.24
+ 1.79
(Source: Statistics South Africa, 2018b:5)
From another point of view, each province has its own unemployment rate with the Free State
had the highest unemployment rate in the quarter July to September 2018 (36.3%), followed by
the Eastern Cape (35.6%) and Mpumalanga (32.5%) (Statistics South Africa, 2018b:7). While
considering that the average unemployment rate in South Africa is 27.5%, according to
Statistics South Africa (2018b:7), provinces with a relatively average unemployment rate include
Gauteng (29.6%), North-West (28.0%), the Northern Cape (27.0%), KwaZulu-Natal (23%), and
the Western Cape (20.4%). Limpopo has the lowest unemployment rate in the country (18.9%).
3.2.1.2 Employment in the agriculture sector
From 2017 to 2018, there was an increase in both the population (age 16-64 years) and the
labour force in South Africa. Table 3.2 indicates a 0.83% increase in the labour force between
2017 and 2018, as well as a 1.16% increase in employment. The agriculture sector showed
significant growth with an increase of 3.95% in employment between 2017 and 2018. This

71
concludes that the agriculture sector contributed to 842 000 employment opportunities from July
to September 2018, which is 32 000 more employment opportunities than from July to
September 2017.
Table 3.2: Key labour market indicators
Labour Market Jul – Sep
2017
Apr – Jun
2018
Jul – Sep
2018
% change from Jul–
Sep 2017 to Jul-Sep
2018
Thousand
Populations
16 – 64 years 37 373 37 832 37 985 + 1.64
Labour force:
Employed
- Formal sector (non-agricultural)
- Informal sector (non-agricultural)
- Agriculture
- Private households
22 402
16 192
11 379
2 689
810
1 313
22 370
16 288
11 320
2 828
843
1 296
22 589
16 380
11 255
3 017
842
1 267
+ 0.83
+ 1.16
- 1.09
+ 12.20
+ 3.95
- 3.50
(Source: Statistics South Africa, 2018b:1)
Table 3.3 provides a summary of the contribution that the agriculture sector made in South
Africa over a period of six years. While the agriculture sector was significantly higher in 2017
than in 2012, the sector is declining in the number of employments since 2015, when it reached
the highest number in this time. The agriculture sector contributes to between 4.5% and 5.5% of
the total employment of all sectors.

72
Table 3.3: Employment in the agriculture sector (2012-2017)
2012 2013 2014 2015 2016 2017
Thousand
Agriculture sector 696 740 702 880 874 843
Total employment of all sectors 14 425 14 866 15 146 15 741 15 780 16 169
Percentage
Agriculture as a percentage of all sectors
4.82 4.98 4.63 5.59 5.54 5.21
(Source: Statistics South Africa, 2017b:41, 94)
While it is proven that there was significant growth in employment in the agriculture sector, there
is a difference in percentage growth with regard to the gender of the employment. Table 3.4
illustrates the labour force characterised by gender over a six-year period from 2012 to 2017.
The agriculture labour forced showed an increase of 21.12% from 2012 to 2017. When male
and female employees are examined individually, there were twice as many male as female
employees in 2012. This ratio fluctuated through the years. In 2017, 68.4% of the employees in
the agriculture sector were male.
Table 3.4: Labour force characterised by gender in the agriculture sector (2012-2017)
2012 2013 2014 2015 2016 2017
Thousand
Agriculture 696 740 802 880 874 843
Male
Female
470
227
510
230
488
213
587
293
607
267
577
265
(Source: Statistics South Africa, 2017b:122)
The various provinces contribute to a different share of the employment in the agricultural
industry in South Africa. Table 3.5 illustrates that the Western Cape contributed to 22.2% of the
agricultural employment in 2017, followed by Limpopo with 16.5%, and KwaZulu-Natal with

73
4.6%. The Northern Cape, North-West, and Gauteng respectively contributed to only about 5%
of the agriculture employment in the country.
Table 3.5: Agriculture employment per province (2012-2017)
2012 2013 2014 2015 2016 2017
Thousand
Agriculture (Total) 696 740 702 880 841 843
Western Cape 135 149 142 232 215 187
Eastern Cape 55 78 78 83 96 89
Northern Cape 46 44 44 36 48 44
Free State 63 72 57 71 65 76
KwaZulu-Natal 93 98 90 145 135 123
North-West 36 39 42 55 49 50
Gauteng 64 47 59 34 41 37
Mpumalanga 98 98 84 89 97 97
Limpopo 106 114 106 135 129 139
(Source: Statistics South Africa, 2017b:135)
3.2.1.3 Employment in the tourism sector
According to the World Travel and Tourism Council (2017:4), travel and tourism generated
716 500 jobs directly in South Africa in 2016, which contributed to 4.6% of the total employment
figure in the country.
According to the Department of Tourism (2018:35), 686 596 workers were employed directly in
the tourism sector in 2016, which contributed to 4.4% of the total employment in the country.
Table 3.6 provides a summary of the contribution that the tourism sector (persons directly
engaged in producing goods and services purchased by visitors) made in South Africa over a
period of five years. Employment in the tourism sector declined in 2015, but is still on its highest
value in 2016 for the five years. The tourism sector contributes to between 4.2% and 4.5% of
the total employment of all sectors.

74
Table 3.6: Employment in the tourism sector (2012-2016)
2012 2013 2014 2015 2016
Thousand
Tourism sector 646 390 657 766 681 915 668 651 686 596 Total employment of all sectors (rounded off to the nearest thousand)
14 425 000 14 866 000 15 146 000 15 741 000 15 780 000
Percentage Tourism as a percentage of all sectors 4.48 4.42 4.50 4.25 4.35
(Sources: Department of Tourism (2018b:35); Statistics South Africa, 2017b:41, 94)
3.3 AGRICULTURE SECTOR IN SOUTH AFRICA
The agriculture sector consists of different departments. Figure 3.3 illustrates the percentage
change from 2015/16 to 2016/17. The production of field cops showed a significant increase of
50.8%. The Department of Agriculture, Forestry and Fisheries (2018:01) explains this because
of an increase in the production of winter crops, summer crops, oilseed crops, hay, dry beans
and sugar cane in the year 2016/2017.
There was also an increase in the production of agriculture (7.7%) as well as the producer
prices of agriculture products (4.3%). However, there was a decrease in the percentage of
animal production. The Department of Agriculture, Forestry and Fisheries (2018:01) states that
this decrease was a result of fewer animals being slaughtered and less production of wool,
eggs, and ostrich feathers.
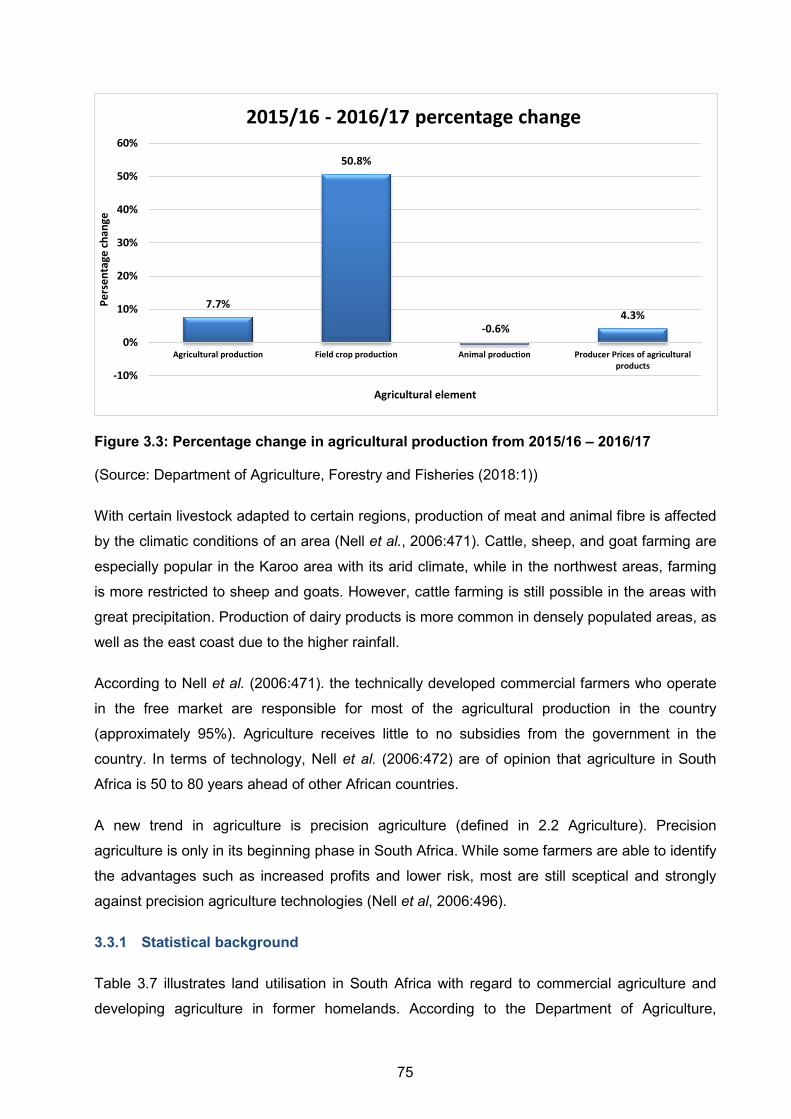
75
Figure 3.3: Percentage change in agricultural production from 2015/16 – 2016/17
(Source: Department of Agriculture, Forestry and Fisheries (2018:1))
With certain livestock adapted to certain regions, production of meat and animal fibre is affected
by the climatic conditions of an area (Nell et al., 2006:471). Cattle, sheep, and goat farming are
especially popular in the Karoo area with its arid climate, while in the northwest areas, farming
is more restricted to sheep and goats. However, cattle farming is still possible in the areas with
great precipitation. Production of dairy products is more common in densely populated areas, as
well as the east coast due to the higher rainfall.
According to Nell et al. (2006:471). the technically developed commercial farmers who operate
in the free market are responsible for most of the agricultural production in the country
(approximately 95%). Agriculture receives little to no subsidies from the government in the
country. In terms of technology, Nell et al. (2006:472) are of opinion that agriculture in South
Africa is 50 to 80 years ahead of other African countries.
A new trend in agriculture is precision agriculture (defined in 2.2 Agriculture). Precision
agriculture is only in its beginning phase in South Africa. While some farmers are able to identify
the advantages such as increased profits and lower risk, most are still sceptical and strongly
against precision agriculture technologies (Nell et al, 2006:496).
3.3.1 Statistical background
Table 3.7 illustrates land utilisation in South Africa with regard to commercial agriculture and
developing agriculture in former homelands. According to the Department of Agriculture,
7.7%
50.8%
-0.6%4.3%
-10%
0%
10%
20%
30%
40%
50%
60%
Agricultural production Field crop production Animal production Producer Prices of agriculturalproducts
Pers
enta
ge ch
ange
Agricultural element
2015/16 - 2016/17 percentage change

76
Forestry and Fisheries (2016:14), there is over 122 million hectares of agriculture land in South
Africa of which 82.3% is dedicated to farmland. Of the 122 million hectares of agriculture land,
around 17 million hectares is developing agriculture in former homelands, of which 84.6% is
farmland. The remaining 105 million hectares of agriculture land in South Africa is dedicated to
commercial agriculture, of which 81.6% is farmland.
Table 3.7: Land utilisation in South Africa
Land utilisation in South Africa
Total area ha
Farmland ha
% Farmland of total area
Total agriculture in SA 122 320 100 100 665 792 82.3 Developing agriculture in former homelands 17 112 800 14 476 766 84.6
Commercial agriculture 105 207 300 86 186 026 81.6
(Source: Department of Agriculture, Forestry and Fisheries, 2016:14)
Figure 3.4 illustrates the percentage households in each province that are involved in
agriculture activities. Limpopo boasts with 43.8% of their households involved in agriculture
activities, followed by the Eastern Cape (33.4%) and Mpumalanga (27.7%). This creates the
opportunity for agri-tourism elements, as so many households are already involved in
agriculture. Therefore, it will be easier for these provinces to implement agri-tourism, as they
already have the human resources. Gauteng is the province with the least number of
households involved in agriculture (percentage). While this is the province with the highest
population in South Africa, it is also the smallest province. Thus, there is not a large area of
farmland available for agri-tourism activities or attractions.
According to Statistics South Africa (2015b:61), an average of 16.9% of all South Africa
households are involved in agriculture production activities. Of this almost 17%, 11.8% were
cultivating farmlands, while 91.2% were responsible for creating backyard gardens.

77
Figure 3.4: Percentage of households involved in agriculture activities by province, 2015
(Source: Statistics South Africa, 2015b: 61)
Navarra (2009:79) points out that women play an immeasurable role in the contribution of food
supply in the word. This contribution can be seen all over the world, from Africa and Asia to
Europe and America. Therefore, Navarra (2009:79) believes that women should be equally
involved in developing and implementing policies. Figure 3.4 supports Navarra’s statement that
many households are involved in agriculture.
3.3.2 Economic aspects
In the South African economy, agriculture makes up about five present of the total gross
domestic product (GDP) of the country (Nell et al., 2006:470). Popular agriculture products in
the country include citrus and deciduous fruits, maize (corn), grapes, oilseeds, wheat, dairy
products, sugarcane, meat, tobacco, wine, and wool. On the world market, South African
agricultural products such as wine, vegetables, fruit, and sugar can successfully sustain
themselves, as they are well developed. Goldblatt (2010:18) describes South Africa as having a
dual agricultural economy that is home to both well-developed commercial farming as well as to
small-scale communal farming.
While three European countries are the largest producers of wine (France, Germany, and Italy),
followed by Australia and the United States in the second tier, South Africa, China, and
Argentina are the most important third-tier producers in the world (Davidson et al., 2009:10).
Together, these countries are responsible for more than 75% of the world’s wine production.
15.6%
33.4%
12.6%
18.1%20.3%
11.5%
3.3%
28.7%
43.8%
0%
5%
10%
15%
20%
25%
30%
35%
40%
45%
50%
WC EC NC FS KZN NW GP MP LP
Perc
enta
ge
Province
Households involved in agriculture activities

78
The Department of Agriculture, Forestry and Fisheries (2017:1) identified an increase of 12.7%
in the gross farming income of all agriculture products from 2015 to 2016. It was estimated at R
259 620 million in 2016. This income was the result of the following increase in farming income
from 2015 to 2016:
Horticultural products – 20.9% increase (R 79 043 million)
Field crops – 11.3% increase (R 51 227 million)
Animal products – 8.7% increase (R 123 559 million)
While the income from farming increased, expenses also increased. The Department of
Agriculture, Forestry and Fisheries (2017:6) identified an increase of 6% in 2016, compared to
an increase of 3.6% of the previous year, for the prices of farming requisites. This includes
implements and machinery (8.3% increase), materials needed for fixed improvements (7.4%
increase) and intermediate productions inputs and services needed (5.6% increase). An
increase in total farming debt was recorded (Department of Agriculture, Forestry and Fisheries,
2017:9). There was an estimated increase of 8.9% from R 133 089 million in 2015 to R 144 981
million in 2016.
Table 3.8 illustrates the gross value of agricultural production in the country for a five-year
period. The different agricultural productions such as field crops, horticulture, and animal
products are included to calculate the total value. Starting at R 114 305,3 million in 2010/2011,
the value has almost doubled to R 255 252,2 million in 2014/2015. This is a clear indicator of
the growth and expansion of agricultural production in South Africa.
Table 3.8: Gross value of agricultural production
Year Field crops Horticulture Animal production
Total
R million
2010/11 36 328,7 36 791,1 71 185,5 144 305,3
2011/12 47 679,8 41 818,3 79 158,3 168 656,4
2012/13 51 092,4 47 686,5 86 159,0 184 937,9
2013/14 59 774,6 53 694,0 96 621,6 210 090,2
2014/15 55 463,2 59 927,0 109 842,0 225 252,2
(Source: Department of Agriculture, Forestry and Fisheries, 2016:75)
According to Statistics South Africa (2015a:2) there was a significant increase of 12.5% in the
income earned by the farming sector between 2014 and 2015. Figure 3.5 illustrates how the
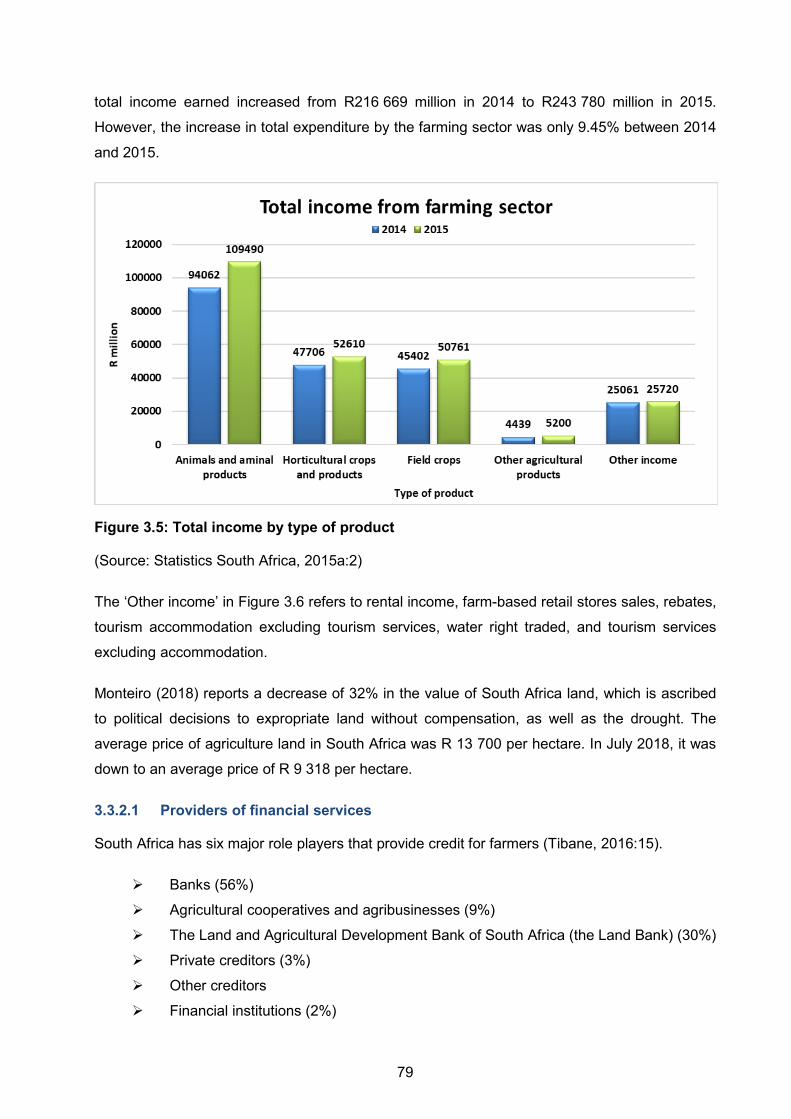
79
total income earned increased from R216 669 million in 2014 to R243 780 million in 2015.
However, the increase in total expenditure by the farming sector was only 9.45% between 2014
and 2015.
Figure 3.5: Total income by type of product
(Source: Statistics South Africa, 2015a:2)
The ‘Other income’ in Figure 3.6 refers to rental income, farm-based retail stores sales, rebates,
tourism accommodation excluding tourism services, water right traded, and tourism services
excluding accommodation.
Monteiro (2018) reports a decrease of 32% in the value of South Africa land, which is ascribed
to political decisions to expropriate land without compensation, as well as the drought. The
average price of agriculture land in South Africa was R 13 700 per hectare. In July 2018, it was
down to an average price of R 9 318 per hectare.
3.3.2.1 Providers of financial services
South Africa has six major role players that provide credit for farmers (Tibane, 2016:15).
Banks (56%)
Agricultural cooperatives and agribusinesses (9%)
The Land and Agricultural Development Bank of South Africa (the Land Bank) (30%)
Private creditors (3%)
Other creditors
Financial institutions (2%)

80
Table 3.9 provides a list of various associations and bodies that provide financial services in
South Africa. When running any business, including a farm, capital is needed for day-to-day
expenses and fixed expenses. Therefore, it is important to be aware of the options that South
Africa has to offer in terms of associations and other bodies.
Table 3.9: Associations and bodies providing financial services in South Africa
Associations and bodies
Actuarial Society of South Africa Institute of Retirement Funds of South Africa (IRF)
Alternative Investment Management Association (AIMA) National Consumer Commission
Association for Savings & Investment SA (ASISA) National Credit Regulator (NCR)
Association of Black Securities and Investment Professionals (ABSIP)
National Stokvel Association of South Africa (NASASA)
Banking Association of South Africa Pension Funds Adjudicator
Credit OMBUD Registrar for Medical Schemes
Fiduciary Institute of Southern Africa (FISA) South African Insurance Association (SAIA)
Financial Charter Sector Council South African Savings Institute (SASI)
Financial Intermediaries Association of Southern Africa (FIA)
South African Underwriting Managers Association
Financial Planning Institute of Southern Africa (FPI) The FAIS Ombud
Financial Sector Conduct Authority (FSCA) and Prudential Authority (PA) The Ombudsman for Banking Services
Financial Services Board (FSB) The Ombudsman for long-term insurance
Institute of Bankers in South Africa (IOBSA) The Ombudsman for Short-term Insurance
(Source: Macaskil,l(2013)
3.3.3 Agriculture associations, role players, and shows
In South Africa, farmers can participate in of be members of various associations, role players,
and even shows.
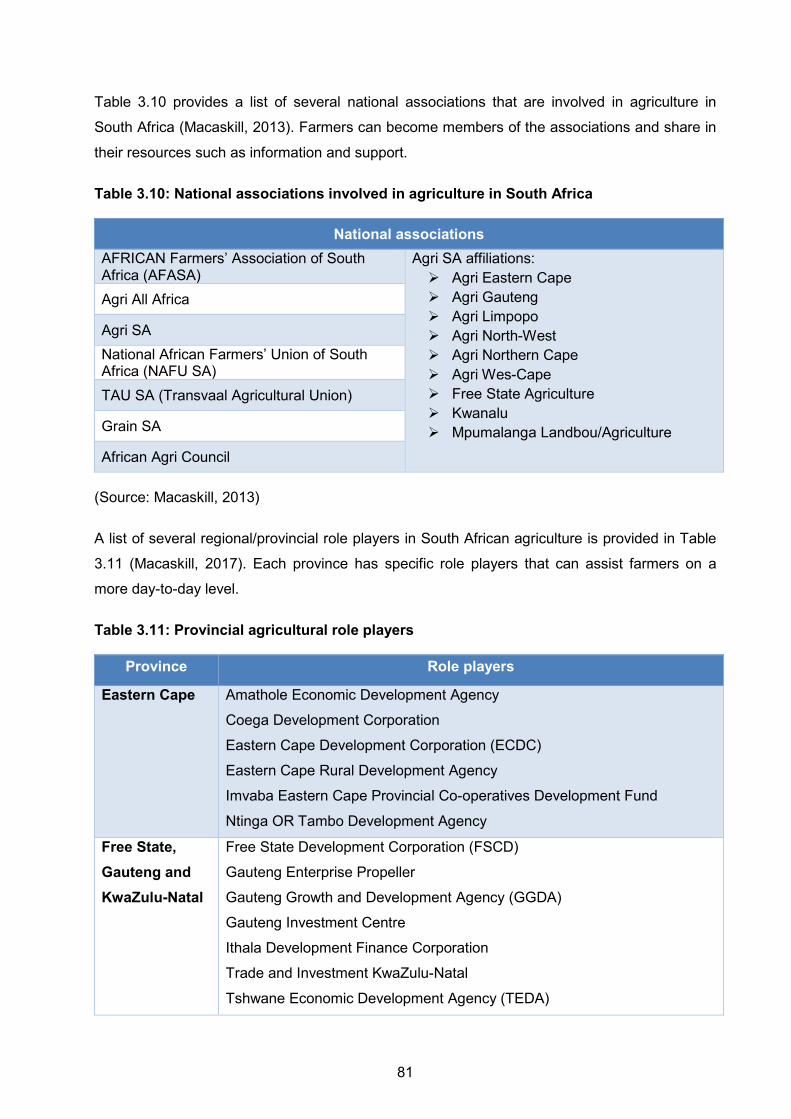
81
Table 3.10 provides a list of several national associations that are involved in agriculture in
South Africa (Macaskill, 2013). Farmers can become members of the associations and share in
their resources such as information and support.
Table 3.10: National associations involved in agriculture in South Africa
National associations AFRICAN Farmers’ Association of South Africa (AFASA)
Agri SA affiliations: Agri Eastern Cape Agri Gauteng Agri Limpopo Agri North-West Agri Northern Cape Agri Wes-Cape Free State Agriculture Kwanalu Mpumalanga Landbou/Agriculture
Agri All Africa
Agri SA National African Farmers’ Union of South Africa (NAFU SA) TAU SA (Transvaal Agricultural Union)
Grain SA
African Agri Council
(Source: Macaskill, 2013)
A list of several regional/provincial role players in South African agriculture is provided in Table
3.11 (Macaskill, 2017). Each province has specific role players that can assist farmers on a
more day-to-day level.
Table 3.11: Provincial agricultural role players
Province Role players
Eastern Cape Amathole Economic Development Agency
Coega Development Corporation
Eastern Cape Development Corporation (ECDC)
Eastern Cape Rural Development Agency
Imvaba Eastern Cape Provincial Co-operatives Development Fund
Ntinga OR Tambo Development Agency
Free State, Gauteng and KwaZulu-Natal
Free State Development Corporation (FSCD)
Gauteng Enterprise Propeller
Gauteng Growth and Development Agency (GGDA)
Gauteng Investment Centre
Ithala Development Finance Corporation
Trade and Investment KwaZulu-Natal
Tshwane Economic Development Agency (TEDA)

82
Province Role players
Limpopo, Mpumalanga and North-West
Limpopo Economic Development Agency (LEDA)
Mpumalanga Economic Growth Agency (MEGA)
North-West Development Corporation
Trade and Investment Limpopo (TIL)
Northern Cape and Western Cape
Cape Agency for Sustainable Integrated Development in Rural Areas
(CASIDRA)
Northern Cape Economic Development Agency
Western Cape (WESGRO)
(Source: Macaskill, 2013)
Finally, there are many agricultural events and shows in South Africa (Macaskill, 2017). Many of
the shows and conferences listed in Table 3.12 have been hosted for a long time, while others
such as Nampo Cape are still very new to South Africa.
Table 3.12: Agricultural shows and conferences
Agricultural shows and conferences
Africa’s Big Seven Nampo Cape African Investment Indaba, Agri Trade Congress Africa NAMPO Harvest Day
African Livestock Trade Fair Nedbank Eston Show
African Livestock Trade Fair (ALFA) Expo PMA Fresh Connections
Agri Food Fest Reitz Bieliemieliefees
Agri Mega Week Royal Show (PMB)
Agri-Expo Livestock South African Cheese Festival
AgriWorks Agricultural Expo South African Large Herds Conference
Bathurst Agricultural Show Sunday Tribune Garden Show
Bloemfontein Show Swartland Show
From The Earth Vryburg Show
George Agriculture Show Wine Farmers and Fruit Growers Exhibition
Jacaranda Agriculture Show
(Source: Macaskill, 2013)

83
3.4 COMMERCIAL FARMING IN SOUTH AFRICA
This section focuses on commercial farming in South Africa. This includes production in South
Africa as well as the different types of farming activities that farmers can host on their farms.
3.4.1 Commercial farmers
Saini and Chandra (2011:3) define commercial agriculture as production of crops intended to be
sold for large distribution. This includes cotton, tobacco, fishery, poultry, livestock, and
agriforestry. The researchers specify that commercial agriculture excludes any crops that are
grown for household consumption, for example in backyard gardens. In other terms, the farmer
and the consumer cannot be the same person, as a wholesaler or supermarket must be
involved in the process of selling the goods. Saini and Chandra (2011:3) identify capital
formation, scientific progress, and processes that are technology driven as significant elements
to commercial farming.
A study conducted by Menong, Mabe and Oladele (2013:140) was identified in Limpopo that
focused on many of the same elements that this study focuses on. While it is only based on a
certain area, it is a detailed representation for farmers in Limpopo. In 2013, researchers
Menong et al. (2013:140) distributed questionnaires among commercial farmers in the Ngaka
Modiri Molema District in the North-West Province. Out of a sample of 88 farmers, a total of 32
farmers were selected to form a sample of the study. In the first part of the questionnaire,
personal characteristics of the farmers were identified, while the second part identified
information that was more relevant to the agriculture sector. Figures 3.13 and 3.14 illustrate the
results gathered from the questionnaires.
Table 3.13: Personal characteristics of commercial farmers
Variables Frequency Percentage
Sex Female Male
3 29
8.8 %
85.3 %
Age 35 – 45 46 – 55 56 – 60 > 61
5 20 5 2
20.5 % 62.2 % 14.7 % 5.9 %
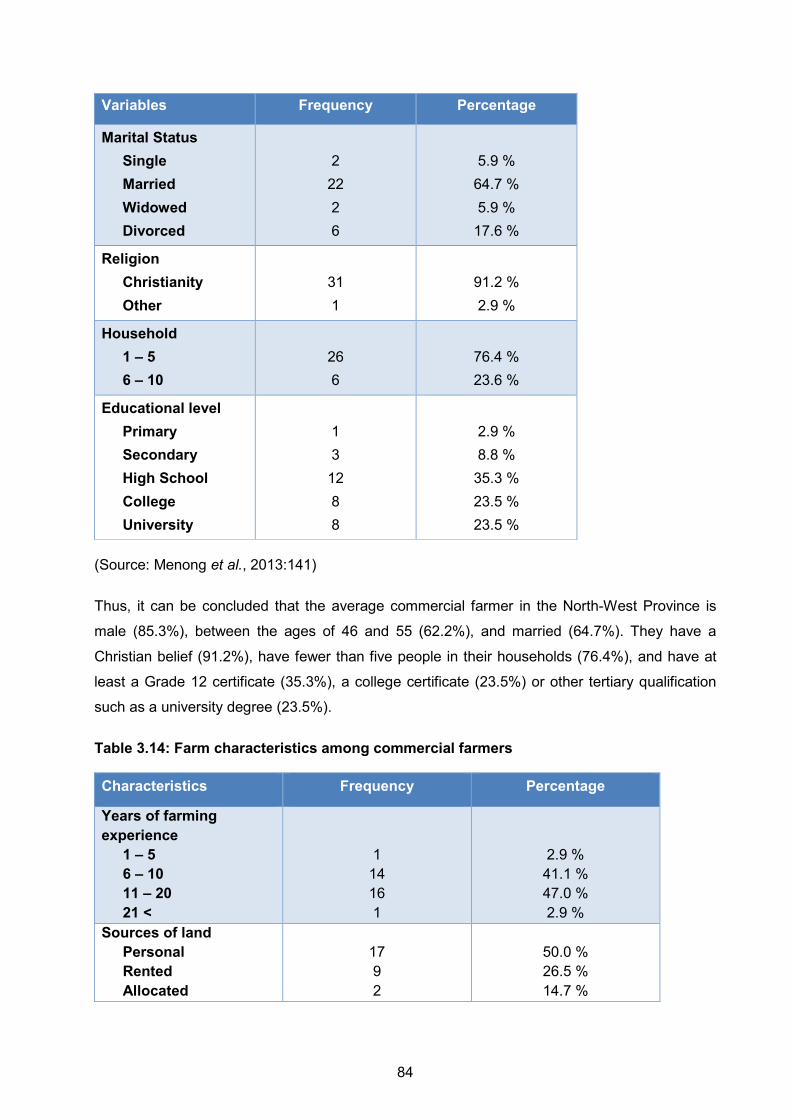
84
Variables Frequency Percentage
Marital Status Single Married Widowed Divorced
2 22 2 6
5.9 %
64.7 % 5.9 %
17.6 %
Religion Christianity Other
31 1
91.2 % 2.9 %
Household 1 – 5 6 – 10
26 6
76.4 % 23.6 %
Educational level Primary Secondary High School College University
1 3 12 8 8
2.9 % 8.8 %
35.3 % 23.5 % 23.5 %
(Source: Menong et al., 2013:141)
Thus, it can be concluded that the average commercial farmer in the North-West Province is
male (85.3%), between the ages of 46 and 55 (62.2%), and married (64.7%). They have a
Christian belief (91.2%), have fewer than five people in their households (76.4%), and have at
least a Grade 12 certificate (35.3%), a college certificate (23.5%) or other tertiary qualification
such as a university degree (23.5%).
Table 3.14: Farm characteristics among commercial farmers
Characteristics Frequency Percentage
Years of farming experience 1 – 5 6 – 10 11 – 20 21 <
1
14 16 1
2.9 % 41.1 % 47.0 % 2.9 %
Sources of land Personal Rented Allocated
17 9 2
50.0 % 26.5 % 14.7 %

85
Characteristics Frequency Percentage
Farm size 300 – 325 326 – 350 351 – 400 > 400
15 8 6 7
55.7 % 23.4 % 17.6 % 20.5 %
Farmer group member Yes No
27 5
79.4 % 14.6 %
Labour source Self Family Hired
1 6
25
2.9 % 17.6 % 73.7 %
Income per year Less than R 5 000 000 R 5 000 000 and
above
25 7
78.13 % 21.87 %
Farming system Livestock Crop Mixed
16 8 8
47.1 % 23.5 % 23.5 %
Access to market Yes No
31 1
91.1 % 2.9 %
Access to credit Yes No
28 4
82.4 % 11.8 %
Number of animals kept 100 – 250 251 – 300 351 – 400 > 400
5
12 7 7
14.6 % 41.2 % 20.4 % 20.4 %
(Source: Menong et al., 2013:142)
The survey identified the average commercial farmer in the North-West Province as a farmer
with 6 to 10 years (41.1%), 11 to 20 years (47.0%), or more years (2.9%) farming experience
that owns the land (50.0%) or rents the land (26.5%). Figure 3.16 also shows that farms are
relatively small, from 300 to 325 hectare (55.7%) or 326 to 350 hectares (23.4%) in size, while
the largest options are > 400 (20.5%). Most of these farmers have hired help (73.7%) and
mostly farm with livestock (47.1%). On average, these farmers keep 251 to 200 animals
(41.2%) on their farms. They have access to the market (91.1%) as well as to credit (82.4%).

86
The average income per year for the type of farm that has been described is less than
R5 000 000 per year (78.13%).
Darnhofer et al. (2012:6) analysed the modern farming system and identified three sets of
interacting factors, and all three factors need to be considered. First, each of the different
members of the farm family has his or her history, preferences, ideas, and projects. Second, the
physical farmland area consists of its resources and assets. Third, the environment consists of
different elements outside the farmers’ control such as the political incentives, economic
opportunities, and social networks. Darnhofer et. al. (2012:6) conclude that a farming system is
the combination of material conditions and social construction.
Throughout the world, people are becoming more health conscious about the quality of the food
they eat. This led to an increase in the demand for organic products (Marsh et al., 2017:125).
This ‘new’ type of farming, organic agriculture, is described as a production process that is
based on excluding as many synthetic products (Sharma, 2012:529). The process includes crop
rotations, crop residues, off-farm organic wastes, animal manures, green manures, legumes,
and similar products.
3.4.2 Types of farming activities
Ten types of farming activities are identified to understand what farmers produce or farm with.
3.4.2.1 Dairy
A dairy farmer requires high capital investments in terms of cattle, land, equipment, and facilities
(Flanders & Gillespie, 2015:705). This type of farming can provide a steady income and job
opportunities throughout the year. It is important to keep a thorough record of milk production,
breeding, calving, crops (available food), and the animals’ health.
3.4.2.2 Poultry
Poultry include domestic birds such as chickens, ducks, and turkeys that are raised for their
eggs, feathers, meat, and other products (Statistics South Africa, 2016:35). Flanders and
Gillespie (2015:638) identify three types of chicken enterprises, namely the hatching of eggs,
broilers production that involves raising chickens for their meat, and raising replacement pullets.
3.4.2.3 Game
Van der Merwe and Du Plessis (2014:8) defines the term ‘game’ as referring to non-domestic
animals that are hunted for mainly two purposes, namely food or sport (recreational purposes).

87
A game farm refers to a farm that contains a variety of game species that are kept in adequately
fenced areas. These game species are kept on the farm mainly for hunting, the production of
meet, or to sell at auctions (Van der Merwe & Du Plessis, 2014:8). Part of the hunting/wildlife
industry is biltong hunting, hunting with bow and arrow, and trophy hunting.
3.4.2.4 Crops
Crops include potatoes, sugar beets, cereals, protein crops, industrial crops, energy crops,
oilseed crops, fruit, vegetables, flowers, grapes and wine, olives, olive oil, and many more (Zhu
& Lansink, 2010:551).
3.4.2.5 Livestock
Livestock refers to animals that are domesticated and kept for breeding (Statistics South Africa,
2016:35). This includes cattle, sheep, pigs, and goats, excluding poultry (Statistics South Africa
2016:35; Zhu & Lansink, 2010:551).
3.4.2.6 Animal products
Animal products include cow’s milk and other products, chicken eggs, pig meat, poultry meat,
goat’s milk, animal skins, wool, and feathers (Zhu & Lansink, 2010:551)
3.4.2.7 Mixed products
Mixed products or mixed farming refers to both crop and livestock production on a farm
(Sharma, 2012:41) and can also include poultry (Statistics South Africa, 2016:35).
3.4.2.8 Horticulture crops
Horticulture crops can include fruit, vegetables such as cabbages, spinach, onions, tomatoes,
spices, coconuts, and other (Saini & Chandra, 2011.273; Statistics South Africa, 2016).
3.4.2.9 Horticulture products
Horticulture products refer to preserved fruit products, jellies, jams, pickles, vinegar, and wine.
Other products can include sauces, ketchup, and other canned products (Saini & Chandra,
2011:273).
3.4.2.10 Other
This category includes forestry products, organic fertiliser and forage, silage, and aquaculture
products.

88
3.4.3 Production in South Africa
Figures 3.6 and 3.7 illustrate the production of commodities in South Africa. From Figure 3.6, it
is clear that sugar cane and maize were the highest commodities being produced in 2017.
Maize production doubled from 2016 to 2017. Milk, whole fresh cow meat, potatoes and grapes
did not show a significant growth or decline in production over the three years.
Figure 3.6: Production of commodities in South Africa (1)
(Source: Food and Agriculture Organization of the United Nations, 2018)
Figure 3.7 indicates that the production of chicken meat and cattle meat remained relatively
constant from 2016 to 2017. Wheat production was very high in 2016, and soybean production
was very low in 2016. The production of oranges declined from 2015 to 2017.
14.86
9.96
3.542.49 2.01
15.07
7.78
3.522.15 1.97
17.39 16.80
3.202.45 2.03
0
2
4
6
8
10
12
14
16
18
20
Sugar cane Maize Milk, whole fresh cow Potatoes Grapes
Mill
ion
tonn
es
Products
Commodities Production in South Africa (1)2015 2016 2017

89
Figure 3.7: Production of commodities in South Africa (2)
(Source: Food and Agriculture Organization of the United Nations, 2018)
3.4.3.1 South African imports
According to the Department of Agriculture, Forestry and Fisheries (DAFF) (2017:11), there was
an increase of 22.5% in the estimated value of imports from 2015 to 2016. The approximate
value in 2016 was R 82 362 million. Five of South Africa’s largest import products in terms of
value in 2016 were the following:
Maize (R 9 257 million)
Rice (R 5 926 million)
Meat (R 5 465 million)
Wheat and meslin (R 4 488 million)
Palm oil (R 4 212 million)
The Department of Agriculture, Forestry and Fisheries (2017:11) also identified the five largest
trading partners for 2016 in terms of imported agricultural products:
Argentina (R 10 502 million)
Brazil (R 4 748 million)
The Netherlands (R 4 381 million)
The United Kingdom (R 4 177 million)
The United States (R 4 093 million)
1.73
1.44
1.76
1.07 1.07
1.68
1.91
1.37
0.74
1.09
1.661.54
1.451.32
1.01
0.0
0.5
1.0
1.5
2.0
2.5
Meat, chicken Wheat Oranges Soybeans Meat, cattle
Mill
ion
tonn
es
Products
Commodities Production in South Africa (2)2015 2016 2017

90
3.4.3.2 South African exports
South Africa also exports several agriculture products. In 2016, the Department of Agriculture,
Forestry and Fisheries (2017:11) identified a 13.7% increase in the estimated value of exports
to approximately R 97 901 million. While the increase in exports is not as big as the increase in
imports, South Africa still has a significantly higher value in exports than imports. South Africa’s
most important export products in terms of value in 2016 were the following (Department of
Agriculture, Forestry and Fisheries, 2017:11):
Citrus fruit (R 17 067 million)
Wine (R 9 090 million)
Grapes (R 7 822 million)
Apples, pears and quinces (R 7 790 million)
Wool (R 3 996 million)
South Africa’s largest trading partners in terms of exports of agricultural products include the
following (Department of Agriculture, Forestry and Fisheries, 2017:11):
The Netherlands (R 11 013 million)
The United Kingdom (R 9 465 million)
Zimbabwe (R 6 671 million)
Mozambique (R 6 352 million)
China (R 5 299 million)
By comparing the value of imported and exported agriculture products between South Africa
and its trading partners, it is clear that South Africa is a net exporter to the Netherlands, the
United Kingdom, Zimbabwe, Mozambique and China. This concludes that South Africa has a
strong agriculture sector in terms of exporting products and is valuable to the South African
economy.
This concludes the agricultural and farming elements in South Africa. Next, the tourism aspects
of South Africa will be discussed.
3.5 TOURISM IN SOUTH AFRICA
The Department of Tourism (2018:32) created a summary of South Africa’s tourism
performance in 2017. Table 3.15 highlights the different tourism performances in South Africa.
There was an increase of 2.4% in tourist arrivals from 2016 to 2017. Tourism contributed to
1 530 320 employment opportunities in South Africa in 2017. The 726 589 people that were
directly employed in tourism in 2017 is a significant increase from the 686 651 people who were

91
employed in the tourism sector in 2016 (Table 3.6). This concludes that the tourism sector was
directly responsible for 4.5% of the employment in 2017 (Table 3.3). It is also clear that the
tourism sector makes a large contribution to the GDP and there was a 6.9% increase in the total
direct foreign spending in South Africa from 2016 to 2017.
Table 3.15: South Africa’s tourism performance in 2017
Performance Value Source (cited by the Department of Tourism,
2018:32)
South Africa’s tourist arrivals 2017
10 285 197 2.4% increase from 2016
SA Tourism Annual Report, 2018
Tourism total employment contribution 2017 1 530 320 SA Report WTTC data cuts,
2018
Tourism direct employment contribution 2017 726 589 SA Report WTTC data cuts,
2018
Tourism total contribution to GDP 2017 R 41 454 million SA Report WTTC data cuts,
2018
Tourism direct contribution to GDP 2017 R 136 058 million SA Report WTTC data cuts,
2018
Total foreign direct spend 2017
R 80.7 billion 6.9% increase from 2016
SA Tourism Annual Report, 2017
Main Africa source market 2017 Zimbabwe SA Tourism Annual Report,
2017
Main overseas source market 2017 United Kingdom Stats SA, Tourism and
Migration, 2017
Main purpose of visit 2017 Visiting friends and relatives (VFR) – 60.0%
Stats SA, Tourism and Migration, 2017
(Source: Department of Tourism, 2018:32)
Table 3.16 summarises the percentage of tourism trips made in each province, listed as day
trips and overnight trips. It is clear that Limpopo is very popular with an average of 20.7% of
tourist trips, followed by Gauteng with an average of 18.5%. Table 3.16 also illustrates that
there are very few overnight trips to the Northern Cape and the Free State. This immediately
provides farmers in these provinces with the opportunity to attract more farmers to the area
through agri-tourism activities or attractions.

92
Table 3.16: Percentage of tourist trips per province
Province Day trips Overnight trips Average
Western Cape 14.9% 11% 13%
Eastern Cape 8.2% 11.8% 10%
Northern Cape 4.2% 3.1% 3.7%
Free State 7.1% 5.7% 6.4%
KwaZulu-Natal 5.8% 15.2% 10.5%
North-West 7.5% 9.6% 8.6%
Gauteng 23.5% 13.5% 18.5%
Mpumalanga 8.4% 9% 8.7%
Limpopo 20.3% 21.1% 20.7%
(Source: Statistics South Africa, 2018a:13)
3.5.1 South Africa’s strengths and weaknesses in competitiveness
Balan et al. (2009:979) identify competitiveness as a common concept for sustainable
development for the tourism industry. According to the Department of Tourism (2018:29), the
National Department of Tourism developed a model in order to determine the competitiveness
of South Africa’s tourism against its main competitors. The Department of Tourism concluded
that South Africa’s strengths lie in the following ten aspects:
Wildlife: South Africa has a wide variety of species, including the world-famous big five.
Wine and food: South Africa produces world-renowned fine wine and has a wide range
of world-class restaurants.
Number and quality of conference centres: South Africa has a wide range of
conference and exhibition facilities that include custom-built venues that meet top
international specifications. In 2015, South Africa was ranked 38th out of 127
destinations on the ICCA ranking.
Public perceptions of tourism branding and image: South Africa has a positive
tourism branding and image. This good public perception is an advantage against
competitors.
Exchange rate: With the weak rand, South Africa is a very affordable destination,
especially to the American and European markets.
Widely spoken English: English is a widely spoken language across the world. Most
South African can understand and communicate in English.

93
Adventure tourism: South Africa’s diverse landscapes, terrains and climate are suited
for many outdoor activities and adventure tourism.
Service quality: With high-quality and friendly service, many tourists regard South
Africa as offering a high level of service quality.
Cultural diversity: South Africa is rich in culture with 11 official languages and many
different ethnic groups.
Value for money: South Africa offers a wide range of experiences to tourism while
being regarded as a destination providing value for money.
There are also elements that need close attention to improve South Africa’s competitiveness.
The Department of Tourism (2018:29) identified four elements:
Cost of air-fare and regulations: Air-fares to South Africa are more expensive when
comparing them with those of key competitors.
Long-haul flight elements: South Africa is considered a long-haul destination, as it is
far to travel for America and European markets.
Tourism safety and health risks: South Africa has a high crime rate that causes major
safety and security issues.
Public transport: While the transportation systems in South Africa have improved over
the years, it is not widely available across the country.
While most South Africans cannot influence the four elements mentioned above directly, they
need to be considered when planning a tourism activity or attraction in South Africa.
3.5.2 Tourism spending in South Africa
Both international and domestic tourists spend money when they travel (Department of Tourism,
2018:40). Figure 3.8 illustrates the relationship between the nine provinces and tourist
spending, both internationally and domestically. In 2015, almost half of all international tourist
spending took place in Gauteng (43.6%). International tourists spent 21.8% in the Western
Cape and 11.7% in Limpopo. The North-West, Free State and Northern Cape were not popular
provinces for international tourists, according to Figure 3.9. For domestic tourists, KwaZulu-
Natal (23.4%), Limpopo (21.8%), and the Eastern Cape (17.4%) were popular provinces to visit
and to spend money. Similar to international tourists, domestic tourists do not spend much
money in the North-West, Free State, and Northern Cape. This concludes that there is a large
gap in the North-West, Free State, and Northern Cape for tourists.

94
Figure 3.8: Tourism spending per province (Source: Department of Tourism, 2018:40)
3.5.3 Tourism products
The Department of Tourism (2018:83) identified eight tourism product distribution contributions
for 2015. Figure 3.9 illustrates that passenger transportation services (36%) and non-specific
products (31%) were very popular tourism products. Accommodation services also made a
significant contribution (18%). Retail and shopping, travel agencies and similar services,
restaurants, and sports and recreational services all contribute between 3% and 5% individually.
Cultural services were extremely low, which points out a gap in tourism products.
6.9% 6.8%
11.7%
43.6%
3.0% 1.9%3.5%
0.9%
21.8%23.4%
7.7%
21.8%
10.0%
5.3% 4.4%
17.4%
1.4%
8.6%
0%
5%
10%
15%
20%
25%
30%
35%
40%
45%
KwaZulu-Natal Mpumalanga Limpopo Gauteng North West Free State Eastern Cape Northern Cape Western Cape
Perc
enta
ge
Province
Tourist spending per province (2015)International Domestic

95
Figure 3.9: Tourism product distribution
(Source: Department of Tourism, 2018:83)
3.5.4 Visitor information centres
In Chapter 2, it was indicated that visitor information centres are an important form of marketing
agri-tourism activities or attractions in Australia and New Zealand. South Africa boasts more
than 200 visitor information centres. Figure 3.10 illustrates the number of visitor information
centres in each province, as well as their status (government-owned or privately owned). The
Western Cape has 68 visitor information centres, followed by KwaZulu-Natal with 44 visitor
centres. This indicates that tourism information is widely available in these provinces. Thus, it
will be easier for farmers in these provinces to make use of their local visitor information centres
for assistance in marketing agri-tourism activities or attractions.
18%
3%
36%
4%
0%3%
5%
31%
0%
5%
10%
15%
20%
25%
30%
35%
40%
Accomoddationservices
Restaurant andsimilar
Passengertransportation
services
Travel agenciesand similar
services
Cultural services Sports andrecreational
services
Retail andShopping
Non-specficproducts
Pers
enta
ge
Tourism Product Distribution
Tourism product distribution contribution, 2015
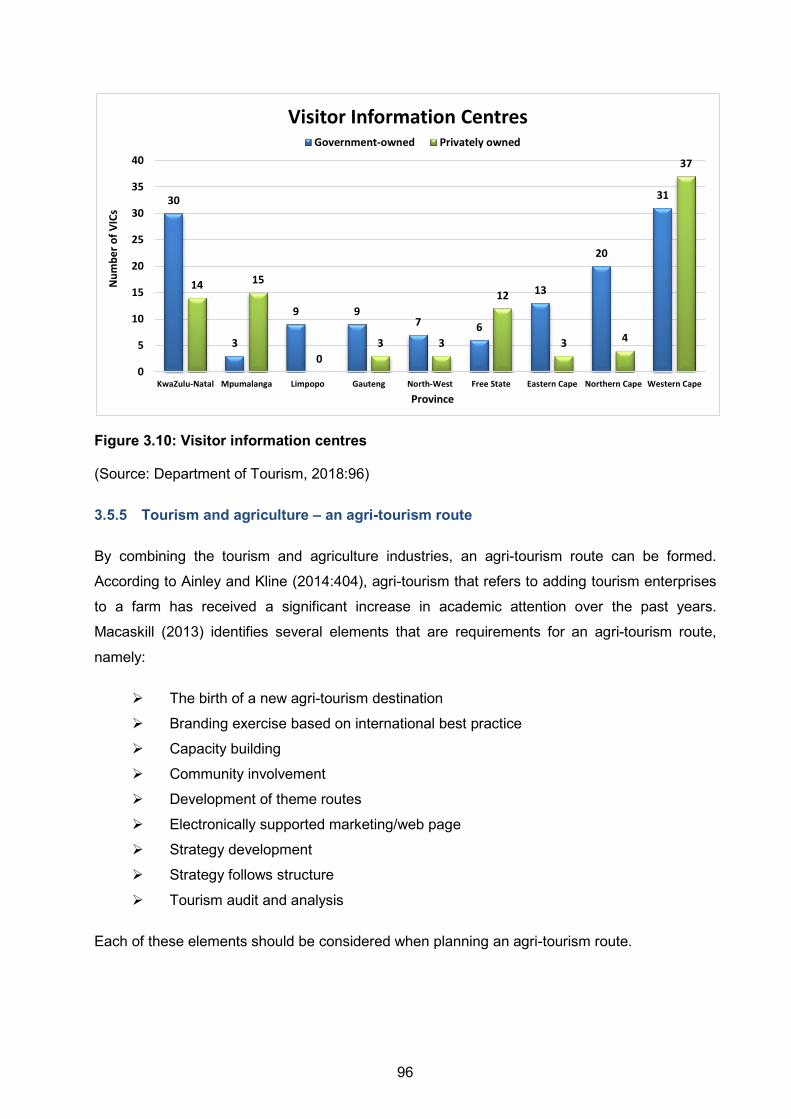
96
Figure 3.10: Visitor information centres
(Source: Department of Tourism, 2018:96)
3.5.5 Tourism and agriculture – an agri-tourism route
By combining the tourism and agriculture industries, an agri-tourism route can be formed.
According to Ainley and Kline (2014:404), agri-tourism that refers to adding tourism enterprises
to a farm has received a significant increase in academic attention over the past years.
Macaskill (2013) identifies several elements that are requirements for an agri-tourism route,
namely:
The birth of a new agri-tourism destination
Branding exercise based on international best practice
Capacity building
Community involvement
Development of theme routes
Electronically supported marketing/web page
Strategy development
Strategy follows structure
Tourism audit and analysis
Each of these elements should be considered when planning an agri-tourism route.
30
3
9 97 6
13
20
31
14 15
03 3
12
3 4
37
0
5
10
15
20
25
30
35
40
KwaZulu-Natal Mpumalanga Limpopo Gauteng North-West Free State Eastern Cape Northern Cape Western Cape
Num
ber o
f VIC
s
Province
Visitor Information CentresGovernment-owned Privately owned

97
3.6 A BREAKDOWN OF AGRICULTRE AND TOURISM IN THE NINE PROVINCES OF SOUTH AFRICA
There are nine provinces in South Africa, each with its own agriculture and tourism elements
(Fluri, 2009:5076). According to Chikuta and Makacha (2016:105), agri-tourism has been
successful in Europe and South America since the 1970s, and in Africa, South Africa is also
hosting agri-tourism. However, Chikuta and Makacha (2016:105) state that agri-tourism is still in
the developing phase and without any government support in many parts.
3.6.1 KwaZulu-Natal
The capital city of KwaZulu-Natal is Pietermaritzburg (Tibane, 2018:3). The main language
spoken in the province is isiZulu (82.5%), followed by English (12.5%), and Afrikaans (1%).
KwaZulu-Natal is a popular holiday destination and accessible by plane (King Shaka
International Airport), by several national road networks or by boat (port of Durban or the port of
Richards Bay).
3.6.1.1 Agriculture
Table 3.17 illustrates the percentage of livestock and crops that are produced in KwaZulu-Natal
compared to the rest of the country. KwaZulu-Natal is home to around 20% of the country’s
cattle, 13% of the country’s goats, and 10% of the country’s pigs. The province also produces
25.7% of the country’s milk. Crops in the province include dry beans, soybeans, maize, canola,
citrus fruit, cotton, subtropical fruit, and vegetables.
Table 3.17: Agricultural production in KwaZulu-Natal (2016/2017)
Livestock Crops
• 25.7% milk production
• 20% cattle
• 13% goats
• 10.3% chicken eggs
• 10.3% broiler birds
• 10% pigs
• 3% sheep
• 7.9% dry beans
• 5.3% soybeans
• 4% maize
• Canola crops
• Citrus fruit
• Cotton
• Subtropical fruit and vegetables
• Sugar cane
• Wheat
(Source: Department of Agriculture, Forestry and Fisheries, 2018)

98
3.6.1.2 Tourism
KwaZulu-Natal is home to several natural and man-made attractions that tourists can visit. Van
Lill (2006:169) identifies several lighthouses in the province, including Umzimkulu in Port
Shepstone that was built in 1906, and Umhlanga Rocks in Durban that was built in 1954. The
Great St Lucia Wetland Park was declared a world heritage site in 1999 (Van Lill, 2006:148).
The province also boasts the highest waterfall in Africa (947 m) the Thukela Falls, as well as the
third highest waterfall in Africa (457 m), the Ndedema Falls (Van Lill, 2006:32). Another popular
waterfall is the Howick Falls that are part of the so-called Midlands Meander, approximately 93
m high (Van Lill, 2006:59). Van Lill (2006:152) also identifies an area of the Drakensberg
Mountain range (discussed in 3.6.6.6). Part of the mountain range located in the province was
renamed uKhahlamba-Drakensberg Park and received World Heritage status in 2000 (Tibane,
2016:162; Tibane 2018:4).
3.6.2 Mpumalanga
Nelspruit is the capital city of Mpumalanga (Tibane, 2018:4). Popular languages in the province
are SiSwati (29.1%) and isiZulu (28.8%), followed by isiNdebele (10.1%) and Xitsonga (9.6%).
The name Mpumalanga is defined as “place where the sun rises” and has a large network of
roads, railways and small airports (Tibane, 2016:163; Tibane, 2018:4).
3.6.2.1 Agriculture
Table 3.18 focuses on Mpumalanga and the livestock and crops that the province produces
compared to the rest of the country. Mpumalanga is home to around 10% of the cattle and 7%
of the sheep in the country. The province also produces 2.1% of the milk in the country. Almost
half of the soybeans in the country are produced in Mpumalanga (42%), and much of the grain
sorghum in the country is produced in Mpumalanga (41.2%). The province is also home to a
large amount of maize production in the country with 20%. Other products that are produced in
the province include dry beans, potatoes, onions, sugar, citrus, litchis, pineapples, guavas,
subtropical fruit (bananas, avocados, mangoes, etc.), and cotton.

99
Table 3.18: Agricultural production in Mpumalanga (2016/2017)
Livestock Crops
• 20.3% broiler birds
• 10% cattle
• 7.9% pigs
• 7.7% chicken eggs
• 7% sheep
• 2.1% milk production
• 1.2% goats
• 42% soybeans
• 41.2% sorghum
• 20% maize
• 12.4% dry beans
• 12.4% commercial crops
• Citrus fruit
• Cotton
• Potatoes
• Subtropical fruit and vegetables
• Sugar cane
• Wool
(Source: Department of Agriculture, Forestry and Fisheries, 2018)
3.6.2.2 Tourism
Van Lill (2006:58) identified several waterfalls in Mpumalanga, including the Mac Mac River
Falls (65 m) and the Debegeni Falls located in the forests of the Woodbush Reserve. A popular
waterfall in the province is the Forest Falls, where adventurers can embark on the Forest Falls
Nature Walk to the only waterfall in this area that is wider than it is high (Van Lill, 2006:60). The
double stream of the Lisbon falls is 92 m high and falls over a semi-circular rock face. The
famous Motlatse Canyon (once known as the Blyde River Canyon) is located in Mpumalanga.
The Canyon is 5 km wide and 1 km deep. A different natural attraction is the Sudwala Caves
that are part of the Mankelekele Hills in the Houtbosloop Valley near Nelspruit (Van Lill,
2006:134). Van Lill (2006:152) also mentions that an area of the Kruger National Park also falls
within this province (discussed in 3.6.3.2) and the Drakensberg Mountain Range (discussed in
3.6.6.2). The Barberton Makhonjwa Mountains became the 10th World Heritage Site for South
Africa in 2018 (Tibane, 2018:5). It includes some of the world’s oldest geological structures and
contains volcanic and sedimentary rocks dating back billions of years (Tibane, 2018:5).
3.6.3 Limpopo
The capital city of Limpopo is Polokwane (Tibane, 2018:4). The main language spoken in the
province is Sepedi (59.0%). Other popular languages in the province include Tshivenda (17.1%)
and Xitsonga (16.6%). The largest section of the very popular and well-known Kruger National

100
Park is located in Limpopo. The province borders with neighbouring countries such as
Botswana, Zimbabwe, and Botswana. The province covers 125 755 km² (Van der Merwe et al.,
2014:382).
3.6.3.1 Agriculture
Table 3.19 illustrates the percentages of livestock and crops that are processed in Limpopo
compared to the rest of the country. Limpopo is home to 10% of arable land in the country.
Around half of the game farms in the country are located in this province. The province hosts
18% of the goats, 7% of the cattle, and 6% of the chicken eggs in the country. Limpopo has a
very rich fruit industry and is a major producer of avocados, tomatoes, papayas, and mangoes.
Other fruit include oranges, pineapples, litchis, and bananas. The province is also a top
producer of potatoes in the country. Tea and coffee plantations can also be found in Limpopo,
along with macadamias and a variety of nuts. Cotton is also produced in the province. Van der
Merwe et al. (2014:382) identify Limpopo as one of the top three hunting provinces of South
Africa. It is home to 50% of the 9 000 game farms in South Africa and hosts roughly 80% of
hunting ventures in South Africa.
Table 3.19: Agricultural production in Limpopo (2016/2017)
Livestock Crops
• 24% pigs
• 17.9% goats
• 7% cattle
• 6.8% chicken eggs
• 2.8% broiler birds
• 1% sheep
• 0.4% milk production
• 33.3% grain sorghum
• 18.9% dry beans
• 18.9% commercial crops
• 14.2% crop production
• 2% malting barley
• Canola
• Citrus fruit
• Cotton
• Peanuts
• Maize
• Potatoes
• Seed production
• Subtropical fruit and vegetables
(Source: Department of Agriculture, Forestry and Fisheries, 2018)

101
3.6.3.2 Tourism
More than 50 provincial and several private game reserves are located in Limpopo (Tibane,
2018:4). Located in both Limpopo and Mpumalanga is the Kruger National Park (Van Lill,
2006:152). This park is home to 147 mammal species, 507 bird species, 114 reptile species, 49
fish species, 34 amphibian species, and 336 species of trees. There are also nearly 130 rock-
art sites that have been recorded, as well as 254 known cultural heritage sites in the park. The
province is rich in scenery, wildlife, history, and culture (Tibane, 2016:163; Tibane, 2018:4).
3.6.4 Gauteng
While Gauteng is the smallest province in area, it is home to a quarter of the country’s
population, according to Figure 3.1. The capital city of the province is Johannesburg (Tibane,
2018:3). A variety of languages is spoken in Gauteng, including IsiZulu (23.0%), Sesotho
(12.7%), English (11.3%), and Afrikaans (10.1). According to Tibane (2018,3), the province is
responsible for 34.8% of the total GDP (gross domestic product) of the country. The largest
airport in the country, OR Tambo International Airport, is located in the province
(Johannesburg). The administrative capital of South Africa, Pretoria, is also located in the
province, along with the Union Buildings.
3.6.4.1 Agriculture
The agricultural sector in Gauteng mostly provides cities and towns with daily fresh products.
Table 3.20 illustrates the livestock and crops that are produced in Gauteng compared to the rest
of the country. Gauteng is home to over 10% of the pigs in the country and produces almost
25% of the eggs in the country. Fresh products include vegetables, dairy products, flowers, fruit,
and meat. Being the smallest province in the country, it has only 3% of the country’s arable
land.
Table 3.20: Agricultural production in Gauteng (2016/2017)
Livestock Crops
• 24.2% chicken eggs • 10.5% pigs • 10.1% broiler birds • 2.9% milk production • 2% cattle • 0.5% goats • 0.4% sheep
• 5% maize • 3.3% dry beans • Grain sorghum (small quantities) • Wheat (small quantities)
(Source: Department of Agriculture, Forestry and Fisheries, 2018)

102
3.6.4.2 Tourism
The Meander area in the province has expanded from a slow start in 1988 to 119 listings from
95 different product owners in 2017 (Rogerson & Van der Merwe, 2016:241). Many of these
listings are agri-tourism enterprises. From an economic point of view, the Johannesburg Stock
Exchange Limited, which is the largest securities exchange in Africa, is located in Gauteng
(Tibane, 2016:162; Tibane, 2018:3).
Part of Gauteng is The Cradle of Humankind where the Sterkfontein Caves are located (Van
Lill, 2006:132). The famous fossil, Mrs Ples, was found there in 1947, dates back 2,7 million
years, and attracts many tourists to the area. A natural attraction includes the Tswaing
Meteorite Crater. According to Van Lill (2006:120), it is still one of the best-preserved meteorite
sites in the world in terms of the craters found there. The rest of The Cradle of Humankind is
located in the North-West Province.
3.6.5 North-West
The North-West Province borders the country Botswana and is especially known for its
contribution to mining. Its capital city is Mahikeng (Tibane, 2018:5). The main language spoken
in the province is Setswana (71.5%). Other languages include Afrikaans (8.96%) and isiXhosa
(5.51%). The province offers many tourist attractions.
3.6.5.1 Agriculture
The North-West Province represents 20% of the arable land in the country and is a highly
productive agricultural area with major role players in the poultry sector. Table 3.21 illustrates
the relatively high percentages of livestock and crops that are processed in the North-West
Province compared to the rest of the country. The province has the highest number of pig farms
in the country (21%) and broilers (25%). With regard to other livestock, the province is home to
goats (12%), cattle (12%), and 11% of the milk production in the country. The province is also
very productive in crops and other products, including sunflower (34%), peanuts (19%), maize
(15%), dry beans (7%), grain sorghum (3%), soybeans, wheat, peppers, tobacco, cotton,
vegetables, and citrus fruit. Hunting is also popular in the province (Van der Merwe et al.,
2015:225).

103
Table 3.21: Agricultural production in the North-West Province (2016/2017)
Livestock Crops
• 22.4% broiler birds
• 21.2% pigs
• 12.2% goats
• 12% cattle
• 9.8% chicken eggs
• 4.7% milk production
• 3% sheep
• 39.3% peanuts
• 33% sunflower seed
• 19% maize
• 8% dry beans
• 6.6% grain sorghum
• 0.1% malting barley (small quantities)
• Canola
• Cotton
• Soybeans
• Wheat
(Source: Department of Agriculture, Forestry and Fisheries, 2018)
3.6.5.2 Tourism
A popular holiday destination for tourists is the Hartbeespoort Dam. The dam was built originally
as a water supply to nearly 160 km² of agricultural land (Van Lill, 2006:85). A part of the
Vredefort Dome is located in this province (Van Lill, 2006:118). Other parts of the Cradle of
Humankind are situated in the North-West Province, including the Cradle of Humankind Site
and the Taung Heritage Site (Tibane, 2018:5). Other natural wonders in the province include the
Pilanesberg National Park, the Madikwe Game Reserve, the Lesedi Cultural Village, and the De
Wildt Cheetah and Wildlife Trust (Tibane, 2018:5). Vryburg and the areas around the town are
also referred to as the Texas of South Africa because of the large cattle herds (Tibane,
2016:165). One of the largest man-made attractions in the country is the Sun City Resort
(Tibane, 2018:5).
3.6.6 Free State
The Free State is located in the heart of South Africa, and the capital city is Bloemfontein
(Tibane, 2018:2; Van der Merwe et al., 2014:383). The main language spoken in the province is
Sesotho (71.9%). Other languages include Afrikaans (10.9%) and isiXhosa (5.7%). The
province covers 129 825 km² of the surface area of the country (Van der Merwe et al.,
2014:383).

104
3.6.6.1 Agriculture
A quarter of the arable land (25%) in South Africa is located in the Free State. The province is
home to 20% of the sheep, 17% of the cattle, 12.3% of the chicken eggs and 8% of the pigs in
the country. Around 17% of the milk in South Africa is produced in the province. In terms of
crops, the Free State has the highest production of sunflower (58%), dry beans (48%) and
potatoes (40%) in the country. Other crops include grain sorghum (34%), maize (28%),
soybeans (20%), peanuts (16%), wheat (12%), asparagus, cherries, peaches, berries, apricots,
plums, and apples. The province is also one of the top three hunting provinces in South Africa
(Van der Merwe et al., 2014:382).
Table 3.22: Agricultural production in the Free State (2016/2017)
Livestock Crops
• 20% sheep
• 17% cattle
• 13.8% chicken eggs
• 8% pigs
• 6.1% milk production
• 5.8% broiler birds
• 4.2% goats
• 51.9% sunflower
• 46.7% dry beans
• 44% maize
• 41.8% soybeans
• 39.3% peanuts
• 18% wheat
• 16.3% grain sorghum
• 0.1% Malting barley
• Canola
• Potatoes
• Wool
(Source: Department of Agriculture, Forestry and Fisheries, 2018)
3.6.6.2 Tourism
The Vredefort Dome, which is mostly located in the Free State, was declared a world heritage
site in 2005 (Van Lill, 2006:118). The oldest and largest meteorite impact structure in the world
is located in this area. About 100 different plant species, 70 butterfly species, and 450 bird
species are located in the Vredefort Conservancy. The Gariep Dam located in the province is
mainly responsible for 2 000 km² of land irrigation (Van Lill, 2006:84). Another popular natural
wonder is the Drakensberg Mountain range (Van Lill, 2006:106). This mountain range forms
part of the Free State, KwaZulu-Natal, Mpumalanga, and Eastern Cape provinces. South
Africa’s largest river, the Orange River, runs through the province (Van Lill, 2006:44). A top

105
tourist attraction in the province is the charming village of Clarens (Tibane, 2018:3). Other
tourist attractions include the annual Cherry Festival in Ficksburg, the majestic Golden Gate
National Park and the Bethlehem Air Show hosted annually (Tibane, 2016:161; Tibane, 2018:3).
3.6.7 Eastern Cape
The capital city of the province is Bhisho (Tibane, 2018:2). The main language spoken in the
province is isiZulu (82.5%), followed by English (12.5%), and Afrikaans (1%). KwaZulu-Natal is
a popular holiday destination and accessible by plane (King Shaka International Airport), by
several national road networks or by boat through the port of Durban or the port of Richards Bay
(Tibane, 2016,160; Tibane, 2018:2).
3.6.7.1 Agriculture
The Eastern Cape is the second largest province in South Africa and hosts the largest
percentage of the livestock in the country. The province is home to the largest percentage of
goats (28%), chicken eggs (31%), and cattle (25%) in the country. Other livestock includes
sheep (12%) and milk production (15). The province grows a wide variety of crops, including
sunflower, dry beans, wheat, potatoes, olives, tea, sugar cane, sugar beet, chicory, tomatoes,
spinach, carrots, watermelons, cabbages, oranges, lemons, avocados, pineapples, lemons,
guavas, bananas, apricots, and peaches. Van der Merwe et al. (2015:225) also mention hunting
in the province.
Table 3.23: Agricultural production in the Eastern Cape (2016/2017)
Livestock Crops
• 38.5% goats
• 30.6% milk production
• 29% sheep
• 24% cattle
• 7.4% broiler birds
• 6% pigs
• 3.2 chicken eggs
• 1% maize
• 0.7% dry beans
• Canola
• Citrus fruit
• Mohair (largest in South Africa)
• Potatoes
• Subtropical fruit and vegetables
• Sugar cane
• Sunflower
• Wheat
• Wool (largest in South Africa)
(Source: Department of Agriculture, Forestry and Fisheries, 2018)

106
3.6.7.2 Tourism
The Eastern Cape has two lighthouses located in the Port Elizabeth area (Van Lill, 2006:169).
The Bird Island Lighthouse was built in 1852. The fourth oldest town in South Africa is located in
the Eastern Cape (Van Lill, 2006:110). Graaff-Reinet is the oldest town in the Eastern Cape and
is surrounded by the Camdeboo National Park. Only a few towns in the province are
surrounded by nature reserves. Van Lill (2006:152) also refers to the Orange River that runs
through the province (discussed in 3.6.6.2). The coastline, also known as the Wild Coast, is
renowned for its natural beauty (Tibane, 2018:2).
3.6.8 Northern Cape
The Northern Cape is the largest province in the country (372 889 km2) but has an average of
two people living in every square kilometre (Tibane, 2018:2; Van der Merwe et al., 2014:382).
The province hosts the second most game farms in the country after Limpopo. Table 3.26
illustrates the percentage of livestock and crops processed in the Northern Cape compared to
the rest of the country. A quarter of the sheep (25%) in South Africa are found in the province.
The Northern Cape is also the greatest producer of peanuts (56%) in the country.
3.6.8.1 Agriculture
Saayman (2013:185) lists large-scale ostrich farming in the province, as well as small-scale
goat and sheep farming. The province is listed as one of the top three hunting provinces in
South Africa (Van der Merwe et al., 2014:382).
Table 3.24: Agricultural production in the Northern Cape (2016/2017)
Livestock Crops
• 25% sheep
• 8.8% goats
• 4% cattle
• 1.6% pigs
• 1% milk production
• Broiler birds
• 7.1% peanuts
• 4% wheat
• 4% malting barley
• 1.9% dry beans
• Canola
• Cotton
• Dry fruit
• Viticulture (wine production)
• Wool
(Source: Department of Agriculture, Forestry and Fisheries, 2018)

107
3.6.8.2 Tourism
Popular attractions in the province include San rock art, 4x4 safaris, varying topographies,
game farming, and several national parks including the Kgalagadi Transfrontier Park (Tibane,
2016:164; Van der Merwe et al., 2014:383). A popular plant in the Northern Cape is the
elephant’s trunk (‘halfmens’ in Afrikaans). This typical desert plant always faces north (Van Lill,
2006:160). The Augrabies Falls, which forms part of the Orange River running through the
province, is the fifth largest waterfall in Africa in terms of volume (Van Lill, 2006:32, 152). Man-
made wonders in the province include the largest telescope in Southern Africa located near
Sutherland (Van Lill, 2006:186). This telescope is one of the best in Africa, as it can gather
about 25 times as much light as other telescopes in Africa. This astronomical observatory
makes a significant contribution to the tourism industry (Tibane, 2018:5).
3.6.9 Western Cape
The capital city of the Western Cape is Cape Town (Tibane, 2018:6). The main language
spoken in the province includes Afrikaans (46.6%), isiXhosa (31.1%), and English (19.6%). The
province has many wide beaches and breath-taking scenery, world-class restaurants and
entertainment and some of the best tourist destinations in the country.
3.6.9.1 Agriculture
The Western Cape includes 15% of the arable land in the country. With three climatic regions,
the province offers a great variety of agricultural products. The province produces almost a third
of the milk in the country (30%) and 24% chicken eggs (layers), as indicated in Table 3.25. With
regard to crops, almost half of the wheat (48%) and 77% of the barley in the country are
produced in the province. The Western Cape produces world-famous wines, a great variety of
vegetables, different ostrich products (meat, leather, and feathers), wool, and mutton. Saayman
(2013:188) lists table and wine grapes, fruit, and wheat as the main farm products.

108
Table 3.25: Agricultural production in the Western Cape (2016/2017)
Livestock Crops
• 26.5% milk production
• 24.2% chicken eggs
• 12% sheep
• 11% pigs
• 4% cattle
• 3.8% goats
• Broiler birds
• 93% malting barley
• 45% wheat
• 0.2% dry beans
• Canola
• Citrus fruit
• Dried fruit
• Mohair
• Potatoes
• Subtropical fruit
• Viticulture (wine mainly produced)
• Wool
(Source: Department of Agriculture, Forestry and Fisheries, 2018)
3.6.9.2 Tourism
The Western Cape has many natural and man-made attractions that tourists visit. One of the
most famous natural wonders in the world is Table Mountain with more than 350 hiking trails
(Van Lill, 2006:98). Located against the slopes of Table Mountain is the Kirstenbosch Botanical
Gardens. Another natural wonder is the Cederberg Mountains, popular for their waterfalls,
caves, colourful sandstone formations, and wild flowers (Van Lill, 2006:108). Situated right off
the coast of the Western Cape, Robben Island was declared a world heritage site in 1999 (Van
Lill, 2006:22). This island used to be a maximum-security prison to political prisoners. Around
300 000 tourists visited the Robben Island Museum in 2002. The most southern point in Africa
is located in the province – Cape L’ Agulhas (Van Lill, 2006:16). Another attraction located
inland is the Paarl Mountains (Van Lill, 2006:112). The granite domes were declared a national
monument in 1963. The popular Cango Caves are located in the Little Karoo (Van Lill,
2006:130). The cave system of 5,2 km is located in the Swartberg Mountains. The Cape
Floristic Region World Heritage Site consists of eight protected areas that cover over 553 000
ha of land (Tibane, 2016:166; Tibane, 2018:6). The Tsitsikamma region near Knysna is home to
the biggest indigenous forests in the country (Tibane, 2018:6). The Slangkop Point Lighthouse
in Kommetjie was completed in 1919, and the lighthouse at Cape Point can be seen up to 67
km (Van Lill, 2006:168).

109
3.7 CONCLUSION
The aim of this chapter was to provide an overview of the agriculture and tourism industries in
South Africa. In conclusion, South Africa can be divided into nine different provinces, each with
its own size and population. This chapter identified that while the Northern Cape is the largest
province, it has the smallest population in the country. Each province has its own set of
agricultural advantages and disadvantages.
The agriculture industry contributed 5.21% (842 000) of the job opportunities in the country in
2018 (a 3.95% increase from 2017), and the tourism industry contributed 4.35% (686 596) of
the job opportunities in the country in 2016 (a 0.1% increase from 2015). Limpopo was identified
as the province with the highest percentage of households involved in agricultural activities.
Several role players, associations, and organisations in South Africa are able to assist farmers
in the agricultural and tourism industries. They provide resources such as information, training,
and financial support to South Africans. The different types of farming that were identified
include dairy, poultry, game, crops, livestock, animal products, mixed products, horticulture
crops, horticulture products, and other farming activities.
From a tourism point of view, international tourists spend most of their money in Gauteng, while
domestic tourists spend the most money in KwaZulu-Natal. There was an increase of 2.4% in
tourist arrivals in South Africa from 2016 to 2017. Based on the products being produced in
South African provinces, soybeans are the most popular in Mpumalanga and the Free State,
and sorghum is popular in Mpumalanga and Limpopo. Other popular products produced in the
Free State are sunflower seed and dry beans.
From this chapter, it is clear that South Africa is a very diverse country in terms of agriculture,
tourism, the population, and natural resources. While each province has its own elements that
make it unique, it is important to understand the area before planning to implement agri-tourism
in the area.

110
CHAPTER 4: EMPIRICAL RESULTS
4.1 INTRODUCTION
This chapter focuses on the results from the data that were collated from distributing the
questionnaire “Agri-tourism in South Africa”. The physical questionnaire and the online
questionnaires were distributed to entities in the target market. The farm owners, farm
managers, and farmers’ wives who completed the questionnaires are referred to as the
respondents. First, the background of the respondents will create a profile of farmers in South
Africa. Next, the characteristics of a typical farm in South Africa will be discussed, including the
size and type of farm. The agri-tourism characteristics of South African farmers will be
discussed in depth, including their motivation for implementing agri-tourism. Other aspects such
as their target market and the total group size they are able to accommodate are also
discussed. The current state of agri-tourism activities or attractions in South Africa is discussed,
followed by the future expansion that respondents are considering for agri-tourism in South
Africa. Finally, a summary of the respondents’ suggestions, recommendations, and comments
is provided.
The purpose of this chapter is to report the results that were gathered from the survey that was
distributed.
4.2 METHOD OF RESEARCH
Chapters 2 and 3 were both literature reviews. This chapter uses quantitative data that were
collected from distributing questionnaires to respondents (farmers in South Africa).
4.2.1 Research design and method of collecting data
As explained in Chapter 1 (1.6.2.1) three different methods were used in order to collect
sufficient data. Table 4.1 provides a summary of the different events where questionnaires were
distributed physically as well as the average feedback that each event had in terms of
respondents (Method 2 and Method 3). This process was completed in 2017 and 2018. A
research team assisted at the Agri SA Congress, the Agri 5 Commodities Workshop and Expo,
and at NAMPO. The fieldworkers were briefed on the purpose of the study and the importance
of the research. The different fieldworkers used at each event was trained in the different
sections of the questionnaire and how to explain each question to the respondent to ensure the
process of collecting data is quick and efficient. At other events, including the Potatoes SA
Congress, Agri Northern Cape – Chairmen’s Meeting, Agri Free State – Young Farmers’

111
Congress, and Agri Western Cape – Regional Meetings, the organisers assisted and took
responsibility for the surveys.
Table 4.1: Physical questionnaire distribution
Event Date Completed questionnaires
Potatoes SA Congress 28 September 2017 ± 7
Agri SA Congress 12 October 2017 ± 30
AGRI 5 Commodities Workshop and Expo 20 – 21 October 2017 ± 30
Agri Northern Cape – Chairmen’s Meeting 27 March 2018 ± 36
Agri Free State – Young Farmers’ Congress April 2018 ± 12
Agri Western Cape – Regional Meetings March – April 2018 ± 122
NAMPO Harvest day 15 – 18 May 2018 ± 241
Total number of physical questionnaires received ± 478
The electronic questionnaire (Google Forms) was distributed to farmers through several
agricultural related organisations as listed in Table 4.2 (Method 1). A few of these organisations
send out the electronic questionnaire several times for more effective feedback. This online
electronic questionnaire was active for 12 months (from 1 July 2017 until 31 June 2018). A total
of ± 79 online questionnaires were received.
Table 4.2: Online questionnaire distribution
Organisations
Agri SA TLU Agri Western Cape
Agri Mpumalanga Agri Gauteng VLVK
Agri Limpopo Agri Free State VVLU
Agri-tourism South Africa Grootplaas (KykNET) RSG Radio Station
NWU TREES OVK News Magazine
A total number of 557 completed questionnaires were received (physically and electronically).
The most questionnaires were completed by respondents in the Western Cape, followed by the

112
Free State and the North-West provinces. Table 4.3 also includes 37 questionnaires that
indicate the farmer owns farms in more than one province, or no specific province was
indicated. These 37 questionnaires were analysed as a category on its own as they cannot be
realistically divided amongst the nine provinces. For all statistical purposes, they made a
province of their own. They are also analysed separately in terms of the agri-tourism activities
being hosted.
Table 4.3: Completed questionnaires received per province
Province Total
Western Cape 155
Free State 116
North-West 81
Mixed provinces/No province 37
Northern Cape 36
Limpopo 34
Mpumalanga 29
Gauteng 28
Eastern Cape 27
KwaZulu-Natal 14
Total 557
4.3 DISCUSSION OF RESULTS
The results of each question in the questionnaire are discussed in detail in the section that
follows.
4.3.1 Background of respondents
The section on the background of the respondents explored the demographic profile of the
respondents. A summary at the end of this section provides the demographic profile of an
average farmer in South Africa.
4.3.1.1 Gender
As indicated in Figure 4.1, 92% of the respondents were male. Included in the 8% females were
respondents who indicated that they were the farmers’ wives, indicating that the farmer was
male. These results strongly prove that the respondents were mainly male. This is consistent

113
with information given by Menong et al. (2013:141), who identified the most commercial farmers
in the North-West province as male (85.3%), and by Van Niekerk (2013:30), who identified the
gender ratio in South African agriculture as two thirds male. Fourie (2015:92) identified most of
the respondents who attended the NAMPO Harvest Day in 2014 as male (65%).
Figure 4.1: Gender of respondents
4.3.1.2 Age groups
Figure 4.2 illustrates the different age groups of the respondents. Only 3% of the respondents
were under the age of 20 with the youngest respondent being 16, while 17% were over the age
of 60, 22% fell in the age group 40-49 years, followed by 21% in the age group of 50-59 years,
and 20% in the age group of 30-39 years. This concludes that the majority of the respondents
(63%) were in the age group 30-59 years. According to Menong et al. (2013:114), most of the
commercial farmers in the North-West Province were between the ages of 35 and 55 (82.7%),
and according to Fourie (2015:92), most of the respondents who attended the NAMPO Harvest
Day in 2014 were between the ages of 25 and 49 (72%). This confirms previous research.
92%
8% Gender
Male
Female

114
Figure 4.2: Age groups of respondents
4.3.1.3 Highest level of education
Respondents were asked to indicate their highest level of education. Based on Table 4.4,
almost half of the respondents (48%) indicated that they had obtained diplomas or degrees.
This was followed by 32% who completed Grade 12. Very few (1%) respondents indicated that
they had not completed high school. These results indicate that the respondents had a high
level of education, while more than 50% of the respondents had completed a form of tertiary
education. Menong et al. (2013:141) mention that 47% of commercial farmers in the North-
West Province completed college or university studies.
Table 4.4: Highest level of education
Highest level of education Percentage
No school 1%
Grade 12 32%
Diploma/Degree 48%
Postgraduate 15%
Professional 4%
3%
18%20%
22%21%
17%
0%
5%
10%
15%
20%
25%
Under 20 20 - 29 30 - 39 40 - 49 50 - 59 60 +
Perc
enta
ge
Age group(years)
Age groups of respondents

115
4.3.1.4 Generation farmer
Farmers were classified generally as either an “up-and-coming farmer” or an “established
farmer”. To understand the agri-tourism and agriculture sector in South Africa, respondents
were asked to indicate what generation farmers they were. Table 4.5 displays the results and
indicates that only 18% of the respondents were first-generation farmers. This suggests that
less than a fifth of the country’s farmers were “up-and-coming farmers”. The highest value
indicated was third-generation farmers at 26%, followed by fifth-generation or more at 23%, and
fourth-generation at 19%. These remarkable results state that 68% of the respondent were
third-generation farmers or more. This can imply that most farmers were running family
businesses and farming had been in their families for generations.
Table 4.5: Generation farmer
Generation farmer Percentage
First 18%
Second 15%
Third 26%
Fourth 19%
Fifth or more 23%
4.3.1.5 Age first exposed to farming
Figure 4.3 illustrates the different ages at which respondents were first exposed to farming.
Interestingly, 74% of the respondents were exposed to farming before they started with primary
school (age 0-6). This indicates a positive correlation between Figure 4.3 and Table 4.5, namely
that 74% of the respondents were exposed to farming at a very young age and 68% of the
farmers were third-generation farmers or more. The average age at which respondents were
first exposed to farming was 6 years of age.

116
Figure 4.3: Age at which respondents were first exposed to farming
4.3.1.6 Age at which respondents decided to become farmers
Figure 4.4 relates to Figure 4.3 and illustrates the different ages at which respondents decided
to become farmers. Similar to Figure 4.3, Figure 4.4 indicates that the largest group of
respondents decided to become farmers before they started school (39% between the ages of 0
and 6). This was followed by 16% between the ages of 19 and 29, and 16% in high school
(between ages 14 and 18). These results (Table 4.5, Figure 4.3, and Figure 4.4) prove 74% of
the respondents were first exposed to farming before school, 39% of the respondents decided
to become a farmer before school, and 42% of the respondents are fourth generation farmer or
more. Further analysis of Figure 4.4 indicates that the average age at which respondents
decided to become farmers was 14 years (in high school).
74%
11%5% 7%
3% 1%0%
10%
20%
30%
40%
50%
60%
70%
80%
Age 0 - 6(Before school)
Age 7 - 13(Primary School)
Age 14 - 18(High School)
Age 19 - 29 Age 30 - 39 Age 40+
Perc
enta
ge
Age group
Age first exposed to farming

117
Figure 4.4: Age at which respondents decided to become farmers
4.3.1.7 Number of years actively farming
Respondents were asked to indicate the number of years that they had been farming actively.
Figure 4.5 illustrates that the largest group of the respondents (31%) had been farming for 10
years or less, followed by 20-29 years (23%) and 30-39 years (23%). The average number of
years that respondents had been farming was 19 years. These data support the results from
Figure 4.2, which indicate that the largest group of respondents were in the age group 40-49, as
well as from Table 4.4, which indicates that respondents completed some form of tertiary
education after school (48% of respondents), before they started farming actively.
Figure 4.5 indicates that 9% of the respondents had been farming for 40 years or more. This
result can be compared to Figure 4.2, which indicates that 17% of the respondent were older
than 60 years. According to Menong et al. (2013:142), 41.1% of commercial farmers in the
North-West Province had been farming for 6 to 10 years, while 47.0% of the respondents had
been farming for 11 to 20 years.
39%
12%
16% 18%
8%6%
0%
5%
10%
15%
20%
25%
30%
35%
40%
45%
Age 0 - 6(Before school)
Age 7 - 13(Primary School)
Age 14 - 18(High School)
Age 19 - 29 Age 30 - 39 Age 40+
Perc
enta
ge
Age group
Age at which respondents decided to become farmers

118
Figure 4.5: Number of years actively farming
4.3.1.8 Member of a tourism society
In South Africa, one can be a member of many tourism associations and organisations. For this
study, they are all referred to as a tourism society that South African citizens can join. Table 4.6
includes a few different tourism associations and organisations in South Africa (Business
Partners Limited, 2016; Tsogo Sun, 2018).
Table 4.6: Tourism associations and organisations in South Africa
Tourism Associations and Organisations in South Africa
Eastern Cape Tourism South African Association for the Conference Industry (SAACI)
Fair Trade in Tourism South Africa (FTTSA) South African Tourism (SAT)
Federated Hospitality Association of South Africa (FEDHASA)
Southern Africa Tourism Services Association (SATSA)
Free State Tourism The Association of South African Travel Agents
Joburg Tourism The Restaurant Association of South Africa (RASA)
KZN Tourism Tourism Business Council of South Africa
Limpopo Tourism Tourism Enterprise Programme (TEP)
Mpumalanga Tourism Tourism Grading Council of South Africa (TGCSA)
31%
23% 23%
14%
7%
2%
0%
5%
10%
15%
20%
25%
30%
35%
Less than 10years
10 - 19 years 20 - 29 years 30 - 39 years 40 - 49 years 50 years or more
Perc
enta
ge
Number of years
Number of years farming
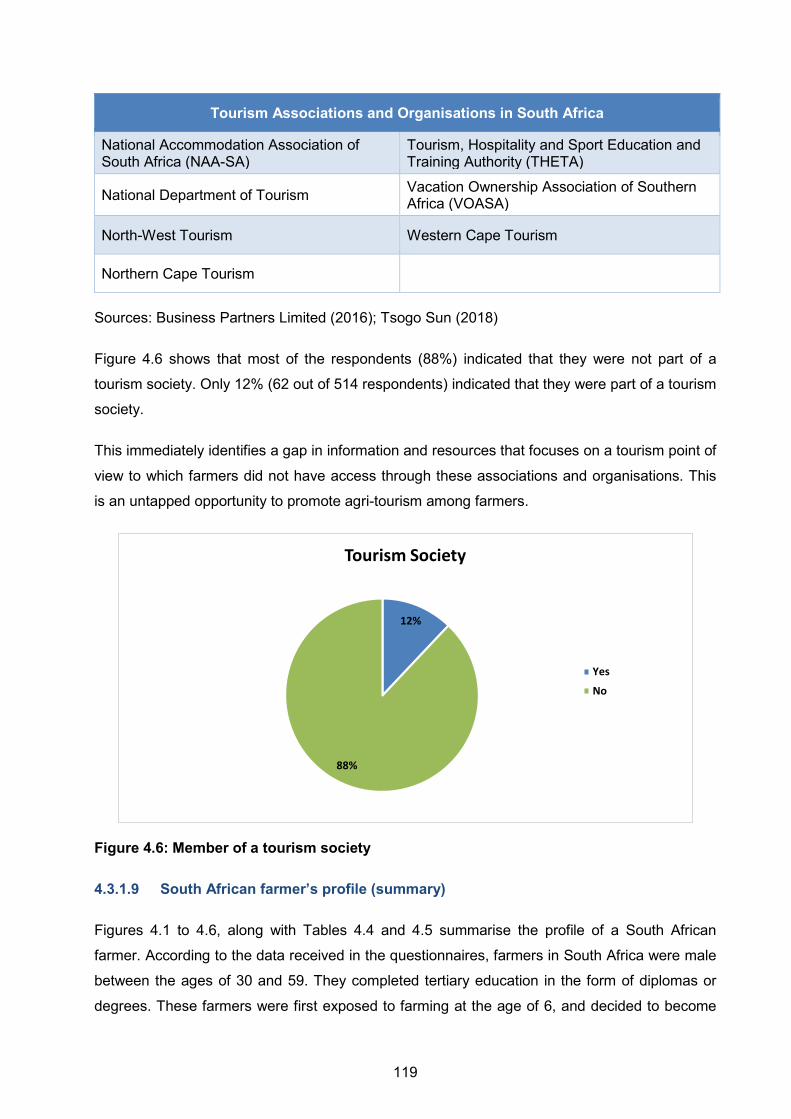
119
Tourism Associations and Organisations in South Africa
National Accommodation Association of South Africa (NAA-SA)
Tourism, Hospitality and Sport Education and Training Authority (THETA)
National Department of Tourism Vacation Ownership Association of Southern Africa (VOASA)
North-West Tourism Western Cape Tourism
Northern Cape Tourism
Sources: Business Partners Limited (2016); Tsogo Sun (2018)
Figure 4.6 shows that most of the respondents (88%) indicated that they were not part of a
tourism society. Only 12% (62 out of 514 respondents) indicated that they were part of a tourism
society.
This immediately identifies a gap in information and resources that focuses on a tourism point of
view to which farmers did not have access through these associations and organisations. This
is an untapped opportunity to promote agri-tourism among farmers.
Figure 4.6: Member of a tourism society
4.3.1.9 South African farmer’s profile (summary)
Figures 4.1 to 4.6, along with Tables 4.4 and 4.5 summarise the profile of a South African
farmer. According to the data received in the questionnaires, farmers in South Africa were male
between the ages of 30 and 59. They completed tertiary education in the form of diplomas or
degrees. These farmers were first exposed to farming at the age of 6, and decided to become
12%
88%
Tourism Society
Yes
No

120
farmers at the age of 14, making most farmers third-generation farmers or more. They had been
farming actively for an average of 19 years on their own and were not members of tourism
societies.
4.3.2 Farm statistics
The following section examines the average farm in South Africa. It summarises farms per
province as well as farms in general. The section is based on data received from an average of
548 respondents.
4.3.2.1 Number of farms owned by farmers in KwaZulu-Natal
Table 4.7 is based on 14 respondents who indicated that they owned farms in KwaZulu-Natal. It
was clear that most of the respondents (86%) owned only one farm in the province.
Table 4.7: Number of farms owned by farmers in KwaZulu-Natal
Number of farms Number of farmers who own the number of farms Percentage
1 12 86 %
2 1 7 %
3 0 0 %
4 1 7 %
Total 14 farmers 100 %
4.3.2.2 Number of farms owned by farmers in Mpumalanga
In Mpumalanga, 40 respondents indicated that they owned farms in the province. Table 4.8
indicates that more than 60% of the respondents owned only one farm. An outlier was one
respondent who owned seven farms in the province.

121
Table 4.8: Number of farms owned by farmers in Mpumalanga
Number of farms Number of farmers who own the number of farms Percentage
1 25 62.5 %
2 6 15 %
3 6 15 %
4 2 5 %
5 0 0 %
6 0 0 %
7 1 2.5 %
Total 40 farmers 100 %
4.3.2.3 Number of farms owned by farmers in Limpopo
Table 4.9 indicates that 44 respondents owned farms in Limpopo, and almost 80% of the
respondents owned only one farm. Once again, there was an outlier of one respondent who
owned seven farms in the province.
Table 4.9: Number of farms owned by farmers in Limpopo
Number of farms Number of farmers who own the number of farms Percentage
1 34 77 %
2 6 14 %
3 3 7 %
4 0 0 %
5 0 0 %
6 0 0 %
7 1 2 %
Total 44 farmers 100 %
4.3.2.4 Number of farms owned by farmers in Gauteng
Table 4.10 Indicates that 32 respondents from Gauteng owned farms in the province. According
to Table 4.10, 84% of the respondents owned only one farm. Four respondents indicated that
they owned two farms in the province, and one respondent indicated that they owned four farms
in the province.

122
Table 4.10: Number of farms owned by farmers in Gauteng
Number of farms Number of farmers who own the number of farms Percentage
1 27 84 %
2 4 13 %
3 0 0 %
4 1 3 %
Total 32 farmers 100 %
4.3.2.5 Number of farms owned by farmers in the North-West
Table 4.11 indicates the number of farms that respondents owned in the North-West Province.
Ninety-five (95) respondents indicated that they owned farms in the province, and more than
77% of these respondents owned only one farm. Twenty percent of the respondents indicated
that they owned between two and seven farms in the province, and two outliers owned twelve
and thirteen farms respectively.
Table 4.11: Number of farms owned by farmers in the North-West Province
Number of farms Number of farmers who own the number of farms Percentage
1 74 80 %
2 7 7.4 %
3 4 4.2 %
4 3 3.2 %
5 3 3.2 %
6 1 1 %
7 1 1 %
8 0 0 %
9 0 0 %
10 0 0 %
11 0 0 %
12 1 1 %
13 1 1 %
Total 95 farmers 100 %

123
4.3.2.6 Number of farms owned by farmers in the Free State
Table 4.12 indicates that 126 respondents from the Free State-owned farms in the province.
More than 68% of the respondents owned only one farm. Thirty percent of the respondents
indicated that they owned between two and eight farms in the province. One respondent owned
eleven farms, and there was an outlier who owned twenty farms in the province.
Table 4.12: Number of farms owned by farmers in the Free State
Number of farms Number of farmers who own the number of farms Percentage
1 86 68.3 %
2 10 7.9 %
3 8 6.3 %
4 4 3.2 %
5 4 3.2 %
6 8 6.3 %
7 3 2.4 %
8 1 0.8 %
11 1 0.8 %
20 1 0.8 %
Total 126 farmers 100 %
4.3.2.7 Number of farms owned by farmers in the Eastern Cape
Table 4.13 shows that 32 respondents indicated that they owned farms in the Eastern Cape.
Most of the respondents owned only one farm in the province.
Table 4.13: Number of farms owned by farmers in the Eastern Cape
Number of farms Number of farmers who own the number of farms Percentage
1 29 91 %
2 1 3 %
3 1 3 %
4 1 3 %
Total 32 farmers 100 %

124
4.3.2.8 Number of farms owned by farmers in the Northern Cape
Table 4.14 indicates the number of farms that respondents owned in the Northern Cape. Forty
respondents indicated that they owned farms in the province, and more than 60% of these
respondents owned only one farm. Thirty-two percent of the respondents indicated that they
owned between two and four farms in the province, and two outliers owned eight and twelve
farms respectively.
Table 4.14: Number of farms owned by farmers in the Northern Cape
Number of farms Number of farmers who own the number of farms Percentage
1 25 62.5 %
2 9 22.5 %
3 2 5 %
4 2 5 %
5 0 0 %
6 0 0 %
7 0 0 %
8 1 2.5 %
9 0 0 %
10 0 0 %
11 0 0 %
12 1 2.5 %
Total 40 farmers 100 %
4.3.2.9 Number of farms owned by farmers in the Western Cape
Table 4.15 Indicates that 161 respondents owned farms in the Western Cape. It is clear that
more than 50% of the respondents only own one farm in the province, 42% owned two to five
farms, and only 3% owned between six and eight farms in the province.
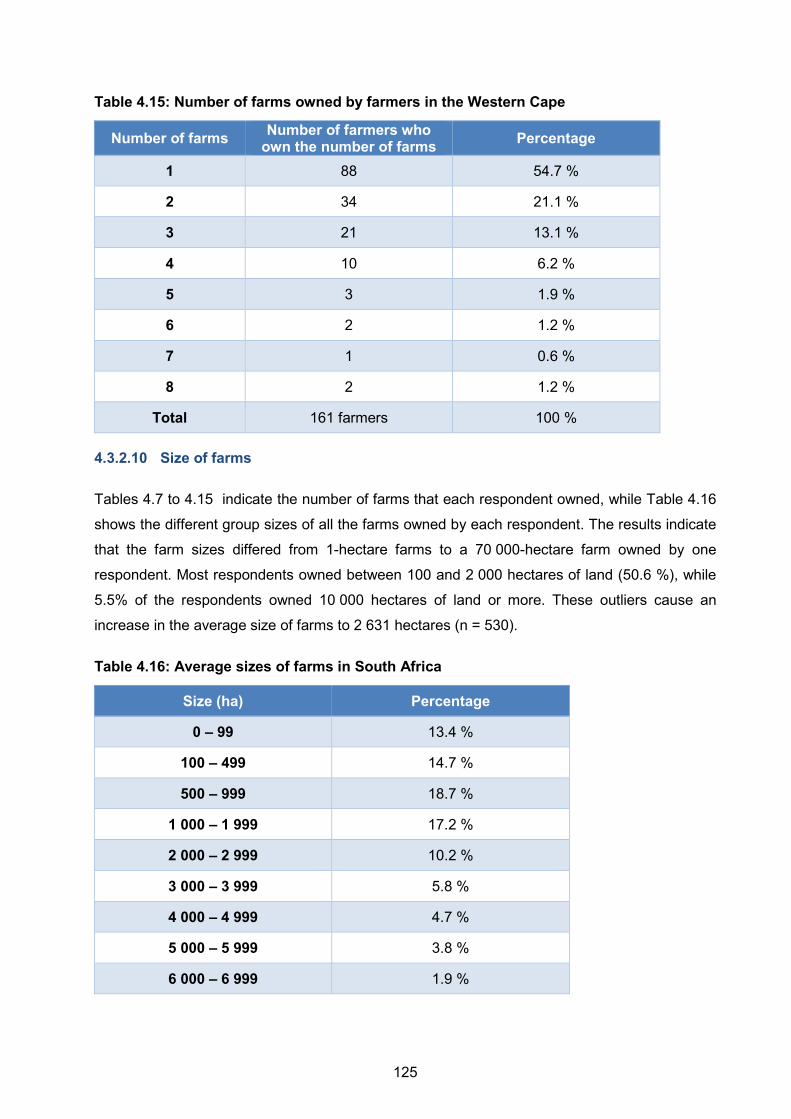
125
Table 4.15: Number of farms owned by farmers in the Western Cape
Number of farms Number of farmers who own the number of farms Percentage
1 88 54.7 %
2 34 21.1 %
3 21 13.1 %
4 10 6.2 %
5 3 1.9 %
6 2 1.2 %
7 1 0.6 %
8 2 1.2 %
Total 161 farmers 100 %
4.3.2.10 Size of farms
Tables 4.7 to 4.15 indicate the number of farms that each respondent owned, while Table 4.16
shows the different group sizes of all the farms owned by each respondent. The results indicate
that the farm sizes differed from 1-hectare farms to a 70 000-hectare farm owned by one
respondent. Most respondents owned between 100 and 2 000 hectares of land (50.6 %), while
5.5% of the respondents owned 10 000 hectares of land or more. These outliers cause an
increase in the average size of farms to 2 631 hectares (n = 530).
Table 4.16: Average sizes of farms in South Africa
Size (ha) Percentage
0 – 99 13.4 %
100 – 499 14.7 %
500 – 999 18.7 %
1 000 – 1 999 17.2 %
2 000 – 2 999 10.2 %
3 000 – 3 999 5.8 %
4 000 – 4 999 4.7 %
5 000 – 5 999 3.8 %
6 000 – 6 999 1.9 %
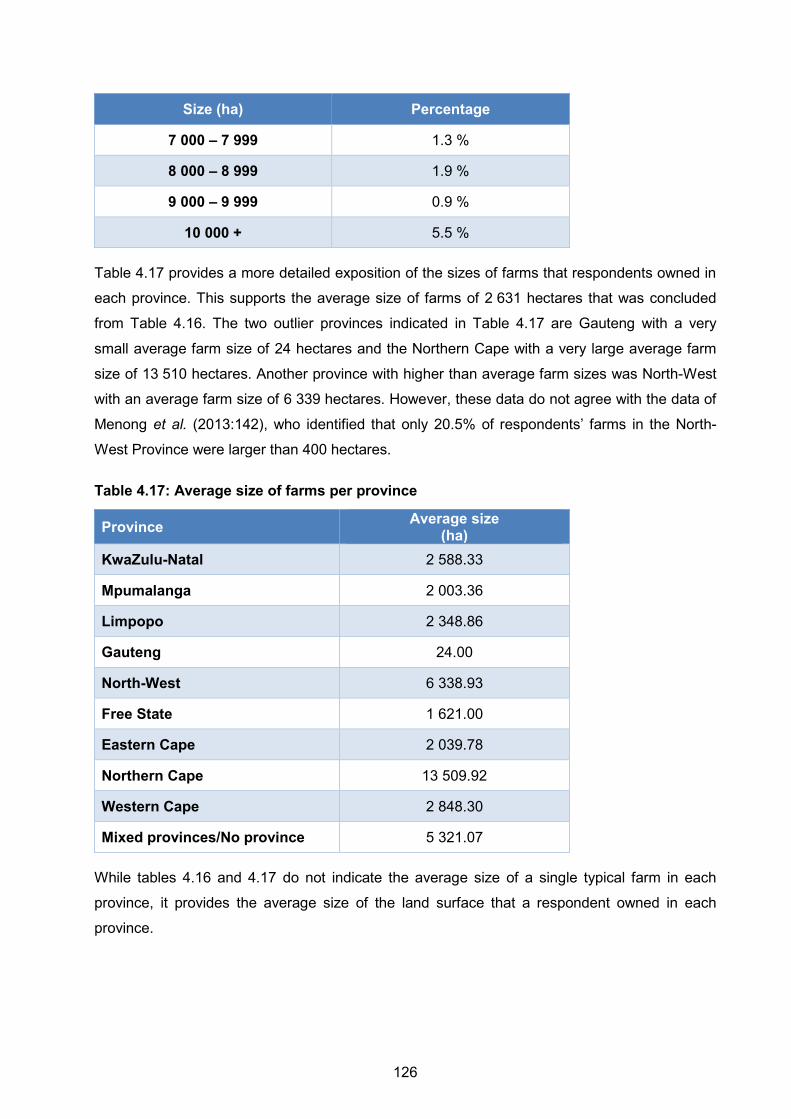
126
Size (ha) Percentage
7 000 – 7 999 1.3 %
8 000 – 8 999 1.9 %
9 000 – 9 999 0.9 %
10 000 + 5.5 %
Table 4.17 provides a more detailed exposition of the sizes of farms that respondents owned in
each province. This supports the average size of farms of 2 631 hectares that was concluded
from Table 4.16. The two outlier provinces indicated in Table 4.17 are Gauteng with a very
small average farm size of 24 hectares and the Northern Cape with a very large average farm
size of 13 510 hectares. Another province with higher than average farm sizes was North-West
with an average farm size of 6 339 hectares. However, these data do not agree with the data of
Menong et al. (2013:142), who identified that only 20.5% of respondents’ farms in the North-
West Province were larger than 400 hectares.
Table 4.17: Average size of farms per province
Province Average size (ha)
KwaZulu-Natal 2 588.33
Mpumalanga 2 003.36
Limpopo 2 348.86
Gauteng 24.00
North-West 6 338.93
Free State 1 621.00
Eastern Cape 2 039.78
Northern Cape 13 509.92
Western Cape 2 848.30
Mixed provinces/No province 5 321.07
While tables 4.16 and 4.17 do not indicate the average size of a single typical farm in each
province, it provides the average size of the land surface that a respondent owned in each
province.

127
4.3.2.11 Type of ownership
From a legal perspective, respondents were asked to indicate the type of ownership applicable
to their farms. While some respondents had different types of ownership for the different farms
they owned, Figure 4.7 indicates the average types of ownership that respondents indicated. By
far, the most popular form of ownership that respondents indicated was that of sole proprietor
with 41%, followed by 28% as a trust and 15% as a private company (Pty Ltd). Partnerships
were indicated as the least used type of ownership for the respondents’ farms (total n = 504).
Figure 4.7: Type of farm ownership
4.3.2.12 Number of full-time employees on the farm
Employment in the agricultural sector is very noteworthy, and respondents were asked to
indicate the number of full-time employees they had on their farms. Although farms can provide
seasonal employment opportunities, the results in Table 4.18 include only full-time employment
per farmer. More than half of the respondents (58.5%) indicated that they had between 0 and 9
full-time employees on their farms. The largest outlier indicated that they had 900 full-time
employees on their farms. These workers can be divided into different provinces and farms,
depending on the size and location of respondents’ land. The 557 respondents indicated that
they have a total number of 13 129 full-time employees.
41%
6%
15%
10%
28%
1%0%
5%
10%
15%
20%
25%
30%
35%
40%
45%
Sole proprietor Partnership Private Company(Pty Ltd)
ClosedCorportation (CC)
Trust Other
Perc
enta
ge
Type of ownership
Type of farm ownership

128
Table 4.18: Average number of full-time employees per farmer
Number of employees Percentage
0 – 9 58.5 %
10 – 19 17.5 %
20 – 29 7.2 %
30 – 39 3.7 %
40 –49 3.8 %
50 – 59 2.0 %
60 – 69 1.7 %
70 –79 0.7 %
80 – 89 0.5 %
90 – 99 0.5 %
100 – 199 2 %
200 – 299 0.7 %
300 + 1.3 %
While Table 4.18 illustrates the average number of full-time employees per farmer, Table 4.19
provides the average number of full-time employees per farm. Out of 540 respondents who
answered the question, 511 respondents owned farmland that was smaller than 10 000
hectares in total. These 511 responses were used to calculate the average number of
employees per farm, per province. According to Table 4.19, the average number of employees
per farm was 14.41. This does not consider the types of farming activities that took place on
farms, as this had a large influence on the total number of employees.
Table 4.19: Average number of full-time employees per farm (smaller than 10 000 hectares)
Province Total
number of farms
Mean value Minimum value
Maximum value
KwaZulu-Natal 18 30.46 4 150
Mpumalanga 45 13.14 1 60
Limpopo 47 39.79 2 500
Gauteng 32 16.48 0 130
North-West 139 10.47 0 250
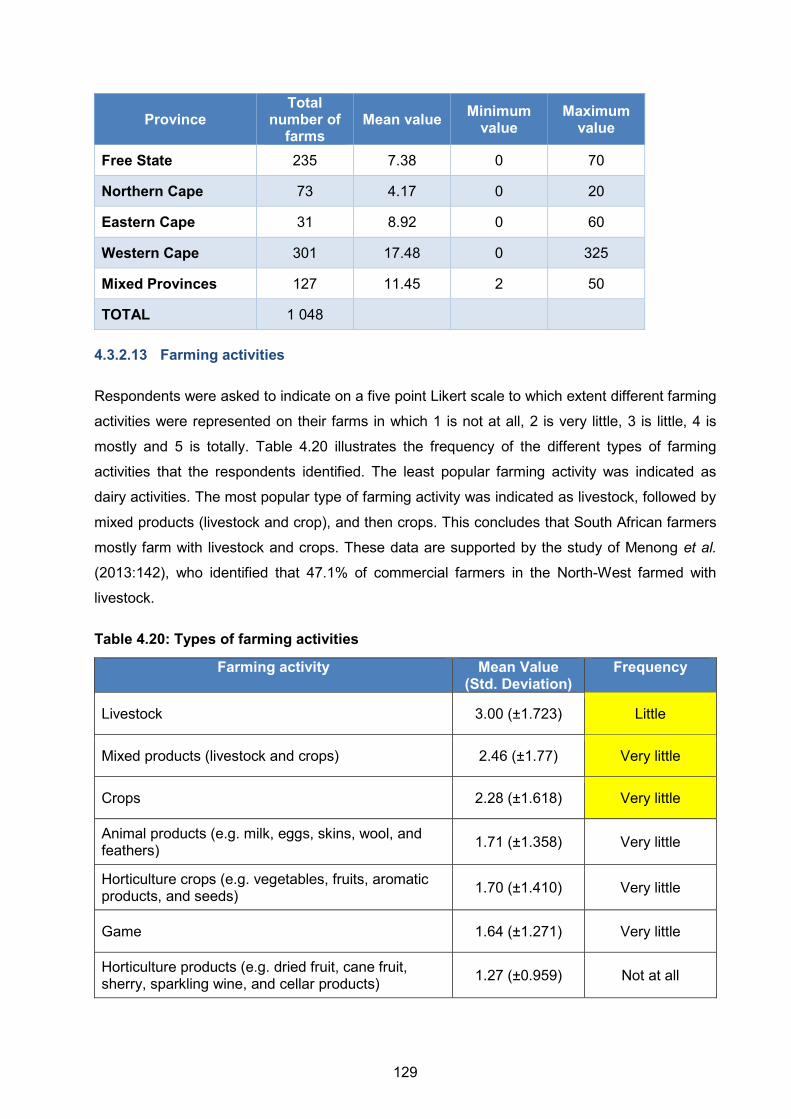
129
Province Total
number of farms
Mean value Minimum value
Maximum value
Free State 235 7.38 0 70
Northern Cape 73 4.17 0 20
Eastern Cape 31 8.92 0 60
Western Cape 301 17.48 0 325
Mixed Provinces 127 11.45 2 50
TOTAL 1 048
4.3.2.13 Farming activities
Respondents were asked to indicate on a five point Likert scale to which extent different farming
activities were represented on their farms in which 1 is not at all, 2 is very little, 3 is little, 4 is
mostly and 5 is totally. Table 4.20 illustrates the frequency of the different types of farming
activities that the respondents identified. The least popular farming activity was indicated as
dairy activities. The most popular type of farming activity was indicated as livestock, followed by
mixed products (livestock and crop), and then crops. This concludes that South African farmers
mostly farm with livestock and crops. These data are supported by the study of Menong et al.
(2013:142), who identified that 47.1% of commercial farmers in the North-West farmed with
livestock.
Table 4.20: Types of farming activities
Farming activity Mean Value (Std. Deviation)
Frequency
Livestock 3.00 (±1.723) Little
Mixed products (livestock and crops) 2.46 (±1.77) Very little
Crops 2.28 (±1.618) Very little
Animal products (e.g. milk, eggs, skins, wool, and feathers) 1.71 (±1.358) Very little
Horticulture crops (e.g. vegetables, fruits, aromatic products, and seeds) 1.70 (±1.410) Very little
Game 1.64 (±1.271) Very little
Horticulture products (e.g. dried fruit, cane fruit, sherry, sparkling wine, and cellar products) 1.27 (±0.959) Not at all

130
Farming activity Mean Value (Std. Deviation)
Frequency
Poultry 1.23 (±0.779) Not at all
Other (e.g. forestry products, organic fertiliser and forage, silage, and aquaculture products) 1.23 (±0.759) Not at all
Dairy 1.21 (±0.798) Not at all
4.3.2.14 Summary of the South African farm profile
Tables 4.7 to 4.15 provide summaries of the average number of farms that respondents owned
in the various provinces in South Africa. While most respondents owned only one farm, some
respondents owned 10 or more farms. The average size of the farms owned by respondents
was 2 631 hectares. This is exceptionally high because 5.5% of the respondents owned 10 000
hectares of farmland or more. The most dominant form of ownership of South African farms was
that of sole proprietor, followed by a trust. The average number of full-time employees that
respondents had on their farms was 24 employees. Finally, the most common types of farming
in South Africa was livestock, mixed products (livestock and crops), crops, horticulture crops
(e.g. vegetables, fruits, aromatic products, and seeds), and game.
4.3.3 Agri-tourism characteristics
This section focuses on the number of workers, number of years involved in hosting agri-
tourism, and the motives behind hosting agri-tourism. It also explores different marketing media
that respondents found important to promote agri-tourism, their target market, and group sizes
and identifies the percentages of annual income that farmers received from agri-tourism
activities or attractions. This section mostly focuses only on farms that were hosting agri-tourism
at the time of the study, but also includes motivational reasons and marketing media of farmers
who were not yet hosting agri-tourism on their farms.
4.3.3.1 Number of employees involved in agri-tourism
Table 4.18 indicates that the average number of full-time employees on farms was 24.
Respondents hosting agri-tourism activities or attractions on their farms were asked to indicate
the total number of employees that were involved in agri-tourism on the farms. Figure 4.8
indicates the average number of full-time employees that were involved in agri-tourism, only on
the farms that indicated that they were hosting agri-tourism on their farms. These averages are
indicated by province. The highest average of full-time agri-tourism employees the respondents
indicated on their farms was the Western Cape with 17 employees, followed by KwaZulu-Natal

131
with 12 employees and Limpopo with 11 employees. Respondents in provinces such as
Mpumalanga, Gauteng, and the Northern Cape had an average of only one full-time agri-
tourism employee on their farms. An average number of 2.49, thus 2, employees was indicated
by the respondents. The respondents indicated that they have a total number of 1 371
employees involved in agri-tourism.
Figure 4.8: Average number of full-time agri-tourism employees
4.3.3.2 Years hosting agri-tourism activities on the farm
All the respondents were asked to indicate the number of years that they had been hosting agri-
tourism on their farms. Only 24% of the respondents (around 134 respondents) indicated that
they were hosting any form of agri-tourism on their farm(s). Figure 4.9 indicates that 15% of the
respondents had been hosting agri-tourism for less than 10 years on their farm(s). This
suggests that agri-tourism was still relatively new without exponential expansion in South Africa
at that stage. Only 1% of the respondents had been hosting agri-tourism for more than 30
years.
12
1
11
1
32 2
1
17
3
0
2
4
6
8
10
12
14
16
18
KwaZulu -Natal
Mpumalanga Limpopo Gauteng North-West Free State Eastern Cape NorthernCape
Western Cape Mixedprovinces /No province
Aver
age
num
ber o
f em
ploy
ees
Province
Average number of full-time agri-tourism employees

132
Figure 4.9: Total number of years hosting agri-tourism
By considering all the respondents, regardless of whether they were hosting agri-tourism or not
on their farms, as indicated in Figure 4.9, it was clear that the average number of years that
respondents had been hosting agri-tourism in South Africa was 3 years.
This statistic differs when considering only respondents who were hosting agri-tourism on their
farms. Figure 4.10 illustrates the average number of years that respondents were hosting agri-
tourism on their farm(s) in each province. Only respondents who indicated that they were
hosting some form of agri-tourism on their farms are included in Figure 4.10. Respondents in
KwaZulu-Natal had a very high average number of years hosting agri-tourism with 21 years,
followed by the Northern Cape with an average of 15 years and the Eastern Cape with an
average of 13 years.
76%
15%
6%3% 1%
0%
10%
20%
30%
40%
50%
60%
70%
80%
0 years 1 - 10 years 11 - 20 years 21 - 30 years More than 30 years
Perc
enta
ge
Number of years
Years hosting agri-tourism

133
Figure 4.10: Number of years hosting agri-tourism per province
To analyse the number of years that respondents had been hosting agri-tourism on their farms
further, Table 4.21 provides the lowest and highest number of years that respondents (who
indicated that they were hosting agri-tourism on their farms) were hosting agri-tourism activities
or attractions on their farms. The average number of years indicated in Table 4.20 is rounded
off in Figure 4.10.
KwaZulu-Natal can be viewed as the outlier in Figure 4.10, but by comparing it to Table 4.20,
the results point to the lowest number of years that a respondent had been hosting agri-tourism,
namely 10 years. This explains the high average number of years in comparison with the rest of
the provinces, which mainly has a lowest value of 1 year hosting agri-tourism on their farms.
Table 4.21: Years hosting agri-tourism per province
Province Lowest number of years
Highest number of
years
Average number of
years KwaZulu-Natal 10 30 20.67
Mpumalanga 1 25 11.22
Limpopo 1 26 10.46
Gauteng 1 8 4.50
North-West 1 30 9.08
Free State 1 27 9.07
21
1110
5
9 9
1315
10
13
0
5
10
15
20
25
KwaZulu -Natal
Mpumalanga Limpopo Gauteng North-West Free State Eastern Cape NorthernCape
Western Cape Mixedprovinces /No province
Aver
age
num
ber o
f yea
rs
Province
Average number of years hosting agri-tourism

134
Province Lowest number of years
Highest number of
years
Average number of
years Eastern Cape 3 24 13.43
Northern Cape 1 40 14.64
Western Cape 1 40 10.36 Mixed provinces/ No province 1 40 12.50
4.3.3.3 Motivation for implementing agri-tourism
Respondents were asked to indicate on a five point Likert scale how important it was for them to
host agri-tourism on farms in which 1 was not important, 2 was slightly important, 3 was neutral,
4 was important and 5 was very important. Table 4.22 combines the responses of 121
respondents. The following top reasons were identified (in order of importance):
To use my farm resources to its fullest potential
To generate an additional income
To preserve natural resources and ecosystems
To provide recreational activities for visitors
The least important reason, as indicated in Table 4.22, was to educate visitors and the public
about agriculture.
Table 4.22: Farmers’ motivation for implementing agri-tourism in South Africa
Reason Mean Value (Std. Deviation)
Frequency
To use my farm resources to their fullest potential 3.55 (±1.623) Important
To generate an additional income 3.26 (±1.525) Neutral
To preserve natural resources and ecosystems 3.08 (±1.605) Neutral
To provide recreational activities for visitors 3.06 (±1.572) Neutral
To preserve the farm and farmland 2.98 (±1.562) Neutral
To provide job opportunities for the local community 2.89 (±1.575) Neutral
To share agricultural heritage and rural lifestyles with visitors 2.82 (±1.544) Neutral
To diversify farming activities 2.79 (±1.607) Neutral

135
Reason Mean Value (Std. Deviation)
Frequency
To preserve the rural heritage and traditions 2.79 (±1.496) Neutral
To provide quality local products 2.70 (±1.641) Neutral
To provide job opportunities for family members/relatives 2.67 (±1.625) Neutral
To educate visitors and the public about agriculture 2.57 (±1.559) Neutral
Table 4.22 identifies a large gap in the industry, namely, to educate visitors. From a supply point
of view, a mind shift is necessary to overcome this gap. It also provides an opportunity for the
agri-tourism industry to fill this gap by focusing more on educational activities or attractions.
4.3.3.4 The importance of different marketing media to promote agri-tourism
For any business to be successful, marketing must be considered. Respondents were asked to
indicate on a five point Likert scale how important a list of marketing media was to them when
promoting agri-tourism in which 1 was not important, 2 was slightly important, 3 was neutral, 4
was important and 5 was very important. A hundred and eighty-nine respondents indicated what
types of marketing media they found important when promoting agri-tourism.
Table 4.23 indicates the following top marketing media (in order of importance):
Internet website
Word of mouth
Email address
Telephone/cell phone
The following least important marketing media are indicated in Table 4.23 (in order of least
importance):
TV advertisements
Radio advertisements

136
Table 4.23: The importance of marketing media to promote agri-tourism
Marketing medium Mean Value (Std. Deviation)
Frequency
Internet website 3.65 (±1.675) Important
Word of mouth 3.58 (±1.767) Important
Facebook 3.27 (±1.699) Neutral
E-mail address 3.14 (±1.722) Neutral
Telephone/Cell phone 3.05 (±1.753) Neutral
Family/friends 2.94 (±1.757) Neutral
Newspaper/magazine advertisements 2.18 (±1.473) Slightly important
Travel agency 2.16 (±1.567) Slightly important
Travel brochures 2.14 (±1.527) Slightly important
Other 2.10 (±1.486) Slightly important
Other social media 2.09 (±1.469) Slightly important
Instagram 2.07 (±1.591) Slightly important
Tourist fares or exhibitions 2.00 (±1.414) Slightly important
Twitter 1.95 (±1.392) Slightly important
Radio advertisements 1.71 (±1.189) Slightly important
TV advertisements 1.63 (±1.153) Slightly important
This concludes that the main form of marketing that the respondents were convinced they
should use to promote their farms and agri-tourism activities was internet websites. However, it
is important that their marketing medium should be in line with their local or international target
markets.
4.3.3.5 Target market
Respondents hosting agri-tourism can focus on either a local target market, an international
target market, or both. The results shown in Figure 4.11 suggest that respondents hosting agri-
tourism on their farms mostly focused on local target markets. Mpumalanga focused 95% on the
local market, followed by the Northern Cape with 85% and the Free State with 83%. Provinces
that also focused on the international market for agri-tourism farms were KwaZulu-Natal with
41%, followed by the Eastern Cape (34%) and the Western Cape (33%).

137
Figure 4.11: Agri-tourism target market per province
4.3.3.6 Sizes of groups that respondents could accommodate on farms
Respondents could accommodate different group sizes for their agri-tourism activities or
attractions at a time. Respondents were given different categories and asked to indicate how
many tourists they could accommodate on their farms from <5 people (1), 5 – 10 people (2), 11
– 30 people (3), 31 – 50 people (4), 51 – 100 people (5), and >100 people (6). Table 4.24
provides the average group sizes that farms could accommodate in each province.
The following provinces could accommodate the highest average number of tourists for agri-
tourism activities or attractions (in order of highest mean value):
Gauteng (31 to 50 people)
Western Cape (11 to 30 people)
KwaZulu-Natal (11 to 30 people)
The following provinces could accommodate the lowest average number of tourists for agri-
tourism activities or attractions (in order of lowest mean value):
Northern Cape (5 to 10 people)
Free State (5 to 10 people)
59%
95%
82%75%
80% 83%
66%
85%
67%
84%
41%
5%
18%25%
20% 18%
34%
15%
33%
16%
0%
10%
20%
30%
40%
50%
60%
70%
80%
90%
100%
KwaZulu -Natal
Mpumalanga Limpopo Gauteng North-West Free State Eastern Cape NorthernCape
Western Cape Mixedprovinces /No province
Perc
enta
ge
Province
Agri-tourism target market per provinceLocal International

138
Table 4.24: Sizes of groups that respondents could accommodate on farms
Group size Mean Value (Std. Deviation)
Frequency
Gauteng 4.50 (±0.707) 31 to 50 people
Western Cape 3.47 (±1.797) 11 to 30 people
KwaZulu-Natal 3.20 (±1.304) 11 to 30 people
Limpopo 2.85 (±1.214) 5 to 10 people
Eastern Cape 2.75 (±1.488) 5 to 10 people
Mpumalanga 2.73 (±1.421) 5 to 10 people
Mixed provinces/No province 2.60 (±0.910) 5 to 10 people
North-West 2.58 (±1.084) 5 to 10 people
Free State 2.33 (±1.029) 5 to 10 people
Northern Cape 2.31 (±1.750) 5 to 10 people
4.3.3.7 Annual income from agri-tourism activities or attractions
From an economic point of view, respondents were asked only one question with regard to their
annual income and the percentage of the income they derived from agri-tourism activities or
attractions. Responds were given various categories and asked to indicate what percentage of
their annual income was generated from agri-tourism-related activities or attractions from <5 %
(1), 5 – 10 % (2), 11 – 30 % (3), 31 – 50 (4), 51 – 70 % (5), 71 – 90 % (6) and >90 % (7). Table
4.25 provides the average annual income generated from agri-tourism activities or attractions in
each province.
The following provinces generated the highest percentage of their annual income from agri-
tourism activities or attractions (in order of highest mean value):
Gauteng (> 90%)
KwaZulu-Natal (10 – 30%)
Limpopo (5 – 10%)
The following provinces generated the lowest percentage of their annual income from agri-
tourism activities or attractions (in order of lowest mean value):
Northern Cape (< 5%)
Mpumalanga (< 5%)
Mixed provinces/No province (< 5%)

139
Table 4.25: Annual income generated from agri-tourism activities or attractions
Group size Mean Value (Std. Deviation)
Frequency
Gauteng 7.00 (±0.000) > 90%
KwaZulu-Natal 3.20 (±2.490) 10 – 30%
Limpopo 2.85 (±1.994) 5 – 10%
North-West 2.73 (±2.054) 5 – 10%
Free State 2.65 (±1.835) 5 – 10%
Western Cape 2.63 (±1.917) 5 – 10%
Eastern Cape 2.00 (±1.826) 5 – 10%
Mixed provinces/No province 1.87 (±1.302) < 5%
Mpumalanga 1.55 (±1.036) < 5%
Northern Cape 1.50 (±0.941) < 5%
4.3.4 Current state of agri-tourism in South Africa
This section explores the agri-tourism activities or attractions that respondents were hosting on
their farms, indicated by province. Little data were collected from Gauteng, mostly because
there were not many farmers in that province; therefore, it is not included separately in the
following section when agri-tourism activities or attractions in each province are discussed.
4.3.4.1 Outdoor recreation
Outdoor recreation is represented in all the provinces. Figure 4.12 illustrates that hiking
trails/nature trials, wildlife viewing and photography, and animal rides were found on farms in all
provinces in the country. Hiking and nature trails were especially popular in KwaZulu-Natal, as
they were present on 83% of the farms in the province, which indicated that respondents were
hosting some form of agri-tourism on their farm. Other popular activities or attractions were
mountain climbing and visits to geological phenomena. Abseiling was indicated only in
KwaZulu-Natal and the Western Cape. Less popular agri-tourism activities or attractions
included rock climbing, abseiling, and cave visits.
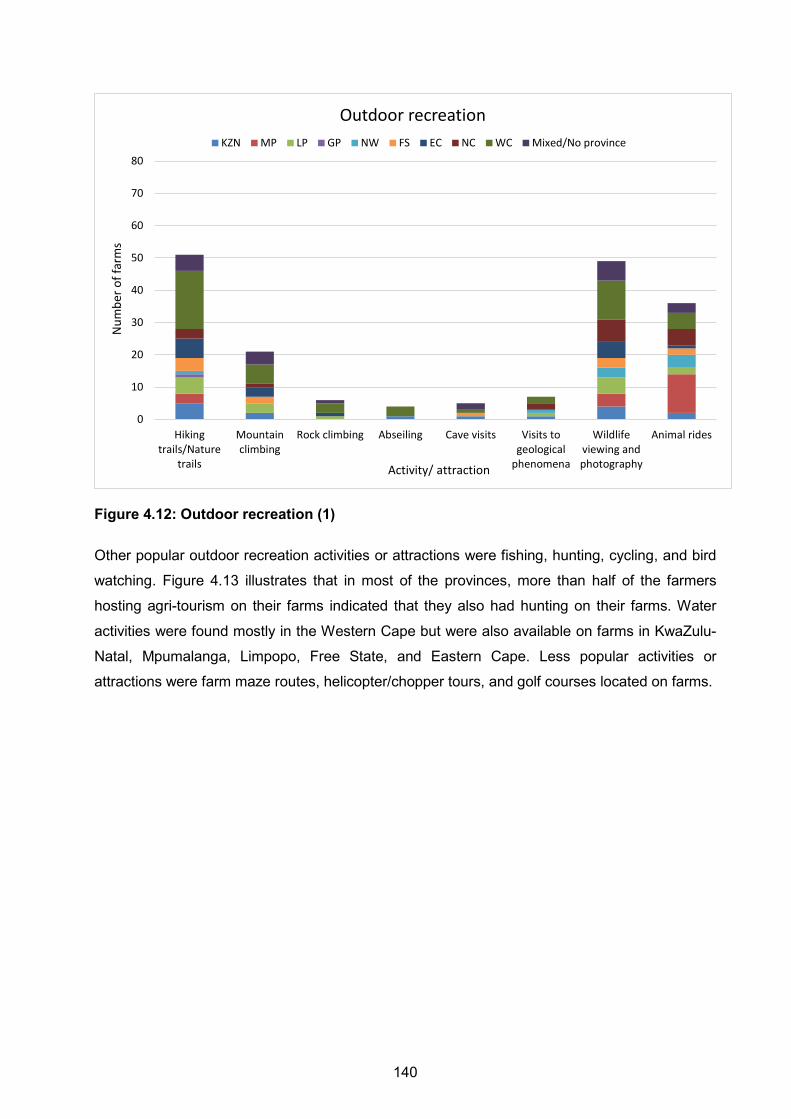
140
Figure 4.12: Outdoor recreation (1)
Other popular outdoor recreation activities or attractions were fishing, hunting, cycling, and bird
watching. Figure 4.13 illustrates that in most of the provinces, more than half of the farmers
hosting agri-tourism on their farms indicated that they also had hunting on their farms. Water
activities were found mostly in the Western Cape but were also available on farms in KwaZulu-
Natal, Mpumalanga, Limpopo, Free State, and Eastern Cape. Less popular activities or
attractions were farm maze routes, helicopter/chopper tours, and golf courses located on farms.
0
10
20
30
40
50
60
70
80
Hikingtrails/Nature
trails
Mountainclimbing
Rock climbing Abseiling Cave visits Visits togeological
phenomena
Wildlifeviewing andphotography
Animal rides
Num
ber o
f far
ms
Activity/ attraction
Outdoor recreationKZN MP LP GP NW FS EC NC WC Mixed/No province

141
Figure 4.13: Outdoor recreation (2)
In Figure 4.14, it is clear that picnicking, and off-road vehicle driving/4x4 routes were popular in
all provinces, followed by camping and a petting zoo. Very few respondents indicated that they
had clay-bird shooting, paintball, or cart rides on their farms for tourists.
Figure 4.14: Outdoor recreation (3)
0
10
20
30
40
50
60
70
80
Wateractivities
Farm mazeroutes
Helicopter /Chopper tours
Golf course Fishing Hunting Cycling Bird watching
Num
ber o
f far
ms
Activity/ attraction
Outdoor recreation
KZN MP LP GP NW FS EC NC WC Mixed/No Province
0
10
20
30
40
50
60
70
80
Camping Picnicking Clay birdshooting
Off-road vehiclesdriving/4x4
routes
Petting zoo Paintball Cart rides
Num
ber o
f far
ms
Activity/ attraction
Outdoor recreationKZN MP LP GP NW FS EC NC WC Mixed/No Province

142
4.3.4.2 Educational experiences
Figure 4.15 focuses on educational experiences. Each of the six educational agri-tourism
experiences illustrated in the figure was available in the Western Cape. Business tours,
cooking/culinary classes, wine tasting, and beer tasting were found in some of the provinces,
while tea tasting was very limited.
Figure 4.15: Educational experiences (1)
0
2
4
6
8
10
12
Cooking/culinaryclasses
Wine tasting Beer tasting Tea tasting Food andbeverage pairing
Business tours
Num
ber o
f far
ms
Activity/attraction
Educational experiences
KZN MP LP GP NW FS EC NC WC Mixed/No Province

143
Figure 4.16 illustrates other educational experiences. The most popular educational agri-tourism
experience indicated in the figure was farm tours, which were found in every province in the
country. In KwaZulu-Natal, battlefield routes and historical memorials were very popular, and
more than half of the respondents indicated these activities or attractions on their farms. Other
well-distributed agri-tourism activities/attractions included historical memorials and museums.
Figure 4.16: Educational experiences (2)
0
5
10
15
20
25
30
35
40
45
50
Battlefield routes Historical memorials Museums Farm tours Rehabilitation centres
Num
ber o
f far
ms
Activity/attraction
Educational experiences
KZN MP LP GP NW FS EC NC WC Mixed/No Province

144
4.3.4.3 Entertainment
According to the respondents, entertainment on farms was not very popular, as indicated in
Figure 4.17. Only farms in Limpopo and the Western Cape were hosting festivals,
expos/exhibitions, barn dances, and concerts. Farm entertainment was not popular in KwaZulu-
Natal, Gauteng, the Free State, and the Northern Cape. Barn dances and concerts were the
most popular forms of entertainment hosted on farms.
Figure 4.17: Entertainment
0
2
4
6
8
10
12
14
Festival Expo/Exhibition Barn dance Concerts
Num
ber o
f far
ms
Activity/attraction
Entertainment
KZN MP LP GP NW FS EC NC WC Mixed/No Province

145
4.3.4.4 Hospitality services
Hospitality services include the agri-tourism activity that currently is represented most in South
Africa, namely farm stay, or in other words, accommodation. Figure 4.18 illustrates that farm
stay/accommodation is represented in all provinces. An average of 70% of the farmers hosting
agri-tourism on their farms in each province indicated that they had farm stay/accommodation
facilities available. Other activities that were represented in all provinces were a wedding and
special events and social events on farms. The least popular activity for hospitality services was
spa facilities.
Figure 4.18: Hospitality service
0
20
40
60
80
100
120
Farm stay/Accommodation
Wedding and specialevents
Social events Restaurant Spa
Num
ber o
f far
ms
Activity/attraction
Hospitality service
KZN MP LP GP NW FS EC NC WC Mixed/No Province
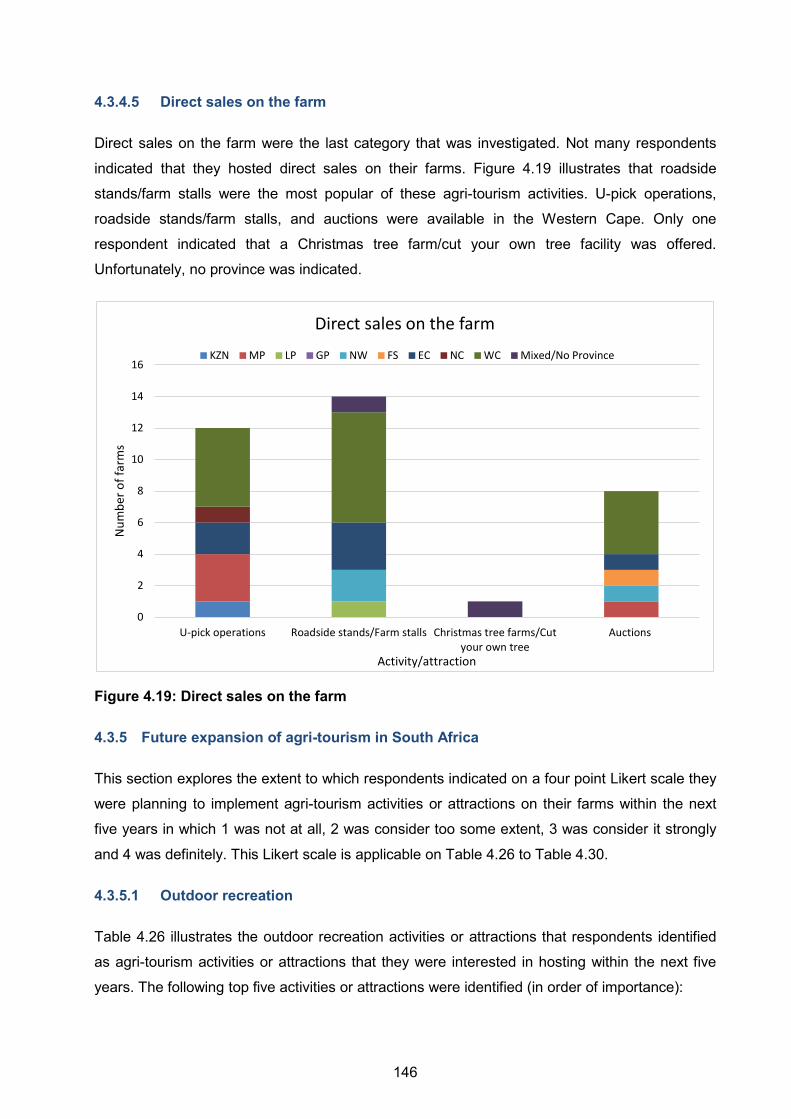
146
4.3.4.5 Direct sales on the farm
Direct sales on the farm were the last category that was investigated. Not many respondents
indicated that they hosted direct sales on their farms. Figure 4.19 illustrates that roadside
stands/farm stalls were the most popular of these agri-tourism activities. U-pick operations,
roadside stands/farm stalls, and auctions were available in the Western Cape. Only one
respondent indicated that a Christmas tree farm/cut your own tree facility was offered.
Unfortunately, no province was indicated.
Figure 4.19: Direct sales on the farm
4.3.5 Future expansion of agri-tourism in South Africa
This section explores the extent to which respondents indicated on a four point Likert scale they
were planning to implement agri-tourism activities or attractions on their farms within the next
five years in which 1 was not at all, 2 was consider too some extent, 3 was consider it strongly
and 4 was definitely. This Likert scale is applicable on Table 4.26 to Table 4.30.
4.3.5.1 Outdoor recreation
Table 4.26 illustrates the outdoor recreation activities or attractions that respondents identified
as agri-tourism activities or attractions that they were interested in hosting within the next five
years. The following top five activities or attractions were identified (in order of importance):
0
2
4
6
8
10
12
14
16
U-pick operations Roadside stands/Farm stalls Christmas tree farms/Cutyour own tree
Auctions
Num
ber o
f far
ms
Activity/attraction
Direct sales on the farm
KZN MP LP GP NW FS EC NC WC Mixed/No Province

147
Wildlife viewing and photography
Hiking trails/nature trails
Cycling
Bird watching
Camping
Other activities that respondents considered to some extent included hunting, picnicking,
fishing, and off-road vehicle driving/4x4 routes. While hunting is indicated in Figure 4.31 as the
second largest agri-tourism activity/attraction in South Africa currently, Table 4.26 shows that it
is not the activity/attraction that respondents were considering most when planning expansion
on their farms for the next five years.
The least likely activities or attractions that respondents planned to implement within the next
five years on their farms included the following (in order of least important):
Golf course
Farm maze routes
Helicopter/chopper tours
Abseiling
Cave visits
Table 4.26: Outdoor recreation
Agri-tourism activity/attraction Mean Value (Std. Deviation)
Frequency
Wildlife viewing and photography 1.97 (±1.169) Consider too some extent
Hiking trails/Nature trails 1.95 (±1.142) Consider too some extent
Cycling 1.91 (±1.212) Consider too some extent
Bird watching 1.87 (±1.221) Consider too some extent
Camping 1.86 (±1.186) Consider too some extent
Hunting 1.79 (±1.221) Consider too some extent
Picnicking 1.61 (±1.036) Consider too some extent
Fishing 1.55 (±1.065) Consider too some extent
Off-road vehicle driving/4x4 routes 1.50 (±0.990) Consider too some extent
Animal rides 1.43 (±0.934) Not at all
Mountain climbing 1.36 (±0.871) Not at all
Petting zoo 1.33 (±0.813) Not at all

148
Agri-tourism activity/attraction Mean Value (Std. Deviation)
Frequency
Water activities 1.31 (±0.845) Not at all
Geological phenomena visit 1.30 (±0.801) Not at all
Cart rides 1.22 (±0.654) Not at all
Clay bird shooting 1.21 (±0.675) Not at all
Paintball 1.19 (±0.845) Not at all
Rock climbing 1.17 (±0.584) Not at all
Abseiling 1.10 (±0.472) Not at all
Cave visits 1.10 (±0.462) Not at all
Helicopter/Chopper tours 1.09 (±0.454) Not at all
Farm maze routes 1.09 (±0.392) Not at all
Golf course 1.08 (±0.389) Not at all
4.3.5.2 Educational experiences
From the list of education experiences, respondents identified that they would implement the
agri-tourism activities or attractions indicated in Table 4.27 within the next five years. The only
activity/attraction that respondents indicated as considering to some extent was farm tours,
followed by interest in business tours and cooking/culinary classes.
The activities or attraction with the lowest mean values are the least likely to implement within
the next five years on their farms included the following (in order of least importance):
Battlefield routes
Beer tasting
Museum
Historical memorials
Tea tasting

149
Table 4.27: Educational experiences
Agri-tourism activity/attraction Mean Value (Std. Deviation)
Frequency
Farm tours 1.61 (±1.061) Consider too some extent
Business tours 1.22 (±0.687) Not at all
Cooking/Culinary classes 1.20 (±0.622) Not at all
Food and beverage pairing 1.19 (±0.680) Not at all
Wine tasting 1.18 (±0.641) Not at all
Tea tasting 1.15 (±0.606) Not at all
Rehabilitation centres 1.15 (±0.550) Not at all
Historical memorials 1.14 (±0.516) Not at all
Museum 1.13 (±0.784) Not at all
Beer tasting 1.11 (±0.464) Not at all
Battlefield routes 1.06 (±0.358) Not at all
4.3.5.3 Entertainment
Agri-tourism entertainment is not very popular in South Africa, as indicated in Figure 4.17. Table
4.28 indicates that respondents were not planning to implement entertainment activities or
attractions within the next five years. The most likely activity/attraction was festivals, and the
least likely activity/attraction was expos/exhibitions.
Table 4.28: Entertainment
Agri-tourism activity/attraction Mean Value (Std. Deviation)
Frequency
Festivals 1.36 (±0.855) Not at all
Barn dance 1.35 (±0.806) Not at all
Concerts 1.31 (±0.631) Not at all
Expo/Exhibition 1.22 (±0.668) Not at all

150
4.3.5.4 Hospitality services
Respondents’ responses to hospitality services were more positive. Table 4.29 indicates the
likelihood that respondents were considering hosting hospitality services within the next five
years. Farm stay/accommodation was the dominant facility that respondents considered to
some extent. It was also the activity/attraction with the highest mean value. Figure 4.18 shows
that farm stay/accommodation was the agri-tourism activity/attraction that occurred the most in
South Africa at the time of the study, and Table 4.29 confirms that it will also be the fastest
growing agri-tourism activity/attraction in South Africa within the next few years. Respondents
were not considering spas on their farms at all.
Table 4.29: Hospitality service
Agri-tourism activity/attraction
Mean Value (Std. Deviation)
Frequency
Farm stay/Accommodation 2.29 (±1.336) Consider too some extent
Social events 1.66 (±1.139) Consider too some extent Wedding and special event on farms 1.61 (±1.057) Consider too some extent
Restaurant 1.45 (±0.975) Consider too some extent
Spas 1.22 (±0.700) Not at all
4.3.5.5 Direct sales on the farm
Direct sales on the farm were not considered to a large extent for future expansions, as
indicated in Table 4.30. The highest-rated activity/attraction was roadside stands/farm stalls
followed by u-pick operations. Respondents did not consider Christmas tree farms/cut your own
tree activities or auctions.
Table 4.30: Direct sales on the farm
Agri-tourism activity/attraction Mean Value (Std. Deviation)
Frequency
Roadside stands/Farm stalls 1.40 (±0.891) Not at all
U-pick operations 1.34 (±0.831) Not at all
Auctions 1.18 (±0.576) Not at all Christmas tree farms/cut your own tree 1.05 (±0.285) Not at all

151
4.3.6 Farmers’ feedback
This final section sums up the future expansion that farmers were planning, as well as their
suggestions and comments with regard to agri-tourism in South Africa.
4.3.6.1 Planning expansions in the future
Future expansions that respondents were planning in terms of agri-tourism are listed below.
Table 4.31: Planning future expansions in agri-tourism
Future expansions planned in agri-tourism, per province
KwaZulu-Natal Boardwalk Build a bigger hunting lodge Downhill scooters More accommodation
Mountain bike trails Restaurant Spa Wine tasting
Mpumalanga Accommodation Aquaculture Build a venue Cart riding routes
Hunting hut Putt-putt Quad bike trails Restaurant
Limpopo Accommodation Campsite
Fisting Hunting
Gauteng Wedding venue
North-West Accommodation Chapel for weddings Family picnics
Fishing Lodge Walking trails
Free State
4x4 routes Accommodation Camping Flight routes Guesthouse
Hunting Lodge Venue and conference Walking trails
Eastern Cape Accommodation Camping Farm stall Guesthouse
Heritage sites Hunting Picnic spots Wedding venue
Northern Cape Accommodation Bird watching
Camping Walking trails
Western Cape
4x4 routes Accommodation Auction Backpackers Bird watching Camping Children education Cider tasting house Coffee shop Cycling
Hunting Mountain climbing Music concerts Nature trails Peppadew festival Quad bike trails Restaurant Rock climbing Rock drawings Tea garden Tours of Rooibos tee

152
Farm stall Fishing Fun rides, business rides Golf Guesthouse Horseback riding
production Walking trails Wedding venue Zipline
Mixed provinces Accommodation
4.3.6.2 Suggestions on how to promote agri-tourism in South Africa
Respondents were asked for suggestions on how to promote agri-tourism in South Africa. The
top suggestions that farmers from different provinces identified are listed below:
How to promote agri-tourism:
Implement good marketing strategies for local and international markets.
Social media are a way of marketing and promoting agri-tourism in South Africa.
Ensure safety on farms for the tourists and the farmer.
Deliver a high-quality service to tourists who visit the farm.
Create a better understanding of what agri-tourism is and create awareness among
tourists to utilise this opportunity.
Invest in South African people, both farmers and the local communities.
Focus on partnerships with foreign partners to assist with financial and management
support.
Promote agri-tourism around the country by educating people about farm tourism.
Offer assistance and consultation to farmers who wish to implement agri-tourism on
their farms.
Communication is important between all stakeholders and entities involved.
Educate young people on what a farm has to offer through agri-tourism.
Implement and maintain infrastructure and facilities, especially for tourists’
convenience.
Focus more on nature conservation.
Affordability is important for the tourist when visiting the farm.
Explain financial aspects to farmers and assist in planning and strategising to
implement agri-tourism.
Develop South African farms, as agricultural and tourism entities.
Utilise the resources that are already found on the farm through agri-tourism.
Think outside the box and be innovative when implementing, managing and
marketing agri-tourism.

153
Suggestions for the government – support:
Labour laws sometimes prohibit farmers from employing people, as there are too
many regulations to adhere to.
Assist with approval of tourism elements through guidelines and easy access to
information.
Provide better infrastructure for the areas hosting agri-tourism to make the areas
more accessible to tourists.
Create a stable political environment that contributes to a better economy and
improves safety in the country.
Generate international foreign capital to invest in promoting agri-tourism.
Improve health services offered by the government to ensure tourists will be
assisted in case of medical emergency.
Improve heritage sites by preserving the environments in which they are located.
Improve roads for better accessibility to farms in the country.
Promote agri-tourism in the country by educating farmers on the possibility of
hosting agri-tourism as well as tourists on the opportunity to visit farms.
Provide financial support to growing farmers to implement agri-tourism sustainably.
Provide grants to the industry to assist farms financially for the contribution that they
are making to the local economy, employment, etc.
Reconsider certain laws, rules, and regulations that are making it difficult for farmers
to implement agri-tourism on their farms.
Provide tax relief for farmers who are hosting agri-tourism in the country, as they are
contributing to the local economy and employment.
4.4 CONCLUSION
This chapter provided a clear profile of farmers in South Africa and of South African farms. The
agri-tourism characteristics illustrate how relatively new agri-tourism still was in South Africa by
the number of years that South African farmers had been hosting agri-tourism. The
questionnaire also provided insight into farmers’ motivation for implementing agri-tourism on
their farms. it is clear that farmers who were hosting agri-tourism at the time were aware of the
advantages and saw the potential in this market. However, most farmers indicated that they
were not offering any form of agri-tourism, and many indicated that they were not interested in
hosting agri-tourism.

154
CHAPTER 5: CONCLUSIONS AND RECOMMENDATIONS
5.1 INTRODUCTION
The purpose of this chapter is to draw conclusions and make recommendations about agri-
tourism in South Africa. This study aimed to determine the size and scope of agri-tourism in
South Africa. This aim was achieved through the following four objectives:
1. To analyse theories and relevant literature concerning tourism and agri-tourism, both in South Africa and in other parts of the world.
This objective was approached by analysing different definitions, typologies, and models in agri-
tourism. Chapter 2 focused on this objective. For an in-depth understanding of agri-tourism, the
different agri-tourism activities were identified and discussed. A brief history of agri-tourism in
South Africa was provided. Another element that the literature revealed was the advantages
and disadvantages of tourism and agri-tourism. Previous studies were identified in order to
understand where the literature came from and what had been researched. Finally, a brief
overview was given regarding agri-tourism around the world, including the United States and
Canada, Australia, New Zealand, Europe, and Asia.
2. To analyse the agriculture sector of South Africa to determine the status of agri-tourism and what it included, as well as what the different provinces had to offer tourists. This analysis would also determine the size of the contribution that agri-tourism made to a farm in South Africa.
The second objective focused on literature and statistics regarding the agriculture and tourism
sectors in South Africa. This objective was reached in Chapter 3 and aimed to understand the
agriculture and tourism sectors as well as their contribution to South Africa. First a background
to South Africa was provided to understand employment, including agricultural and tourism
employment in South Africa. Next, agriculture in South Africa was analysed in depth, including a
statistical background, economic aspects, and role players. Different sectors of commercial
farming were identified and discussed briefly. Next, an overview of tourism in South Africa
included competitiveness and tourism spending. Finally, each province was examined
individually with regard to agriculture, tourism, and economic aspects.

155
3. To conduct a survey to achieve the objectives of this research and to compare different agri-tourism activities in different provinces.
The third objective was reached through the results of the questionnaire that was discussed in
Chapter 4. A total of 557 questionnaires were completed throughout the nine provinces within a
period of 12 months. These results were interpreted to identify the different agri-tourism
activities that were popular in each province as well as the activities that farmers planned to
implement within the next few years. While some of the statistics with regard to South Africa as
a whole were explained, many elements were interpreted per province for a better
understanding of the size and status of agri-tourism in each province.
4. To draw conclusions concerning the size and scope of agri-tourism in South Africa and to make recommendations for farmers and other stakeholders in the industry in order to optimise the opportunities that this sector has to offer.
Finally, the fourth objective was reached through this chapter with the focus on drawing
conclusions based on the literature and results from the questionnaire, as well as making
recommendations to stakeholders. This chapter concludes the research aim to determine the
size and scope of agri-tourism in South Africa.
5.2 CONCLUSIONS
The conclusions focus on key findings in the literature as well as key conclusions from the
survey results.
5.2.1 Key findings in the literature
Several different definitions have been identified in the literature over the years for agri-tourism,
but no universal definition has been defined. By combining different elements of agri-tourism
from different definitions, the following definition of agri-tourism is suggested: Agri-tourism includes any activity/attraction that allows a tourist to visit a working/commercial farm for the purpose of education, enjoyment or to be actively involved in the day-to-day activities of the farm.
Agri-tourism is the combination of the agricultural and tourism sectors and overlaps with
different tourism industries, including wildlife/hunting tourism, rural tourism, wine tourism,
ecotourism, nature-based tourism, cultural heritage tourism, cultural tourism, heritage tourism,
geotourism, and adventure tourism. Elements from these tourism aspects can be seen in agri-
tourism; therefore they can be managed similarly.

156
Bernardo et al. (2004:01) divide agri-tourism into five main categories, namely outdoor
recreation, educational experiences, entertainment, hospitality services, and on-farm direct
sales. All agri-tourism activities and attractions can be divided into these five categories. These
categories can be used to design a model that illustrates how the different agri-tourism activities
and attractions fit into the overall tourism industry (see Figure 1.1: The distribution of agri-
tourism between a demand and supply side). Figure 1.1 provides a comprehensive look at the
agri-tourism supply side. While it provides several examples of agri-tourism activities/attractions
in the different categories, the full list is not included. The 84 agri-tourism activities/attractions
that were identified by several sources around the world were listed and discussed briefly.
Several advantages and disadvantages were identified in the literature. Some of the most
important advantages that agri-tourism offers South Africa are creating job opportunities,
generating an additional income for farmers, diversifying farming activities, and utilising farm
resources to their fullest potential. It also promotes tourism in South Africa and develops rural
areas. However, there are disadvantages of offering agri-tourism on a farm as well and farmers
need to manage these elements, including the potential of seasonal jobs and tourists, the risk of
damages to crops and other farm elements, disruption of the day-to-day activities needed to
keep a farm sustainable, and the safety of the farmer and the animals.
Fourteen national and international research studies between 2008 and 2017 that focused on
agri-tourism were identified, with a significant increase in publications in 2013. Half of these
studies (7) focused on a South African context specifically. Two of these studies were
conducted in the Western Cape in 2013. This concludes that research regarding agri-tourism in
South Africa is very limited and mostly focuses on specific geographical areas in South Africa.
Researchers in the United States identified seven aspects farmers should investigate while
planning to implement agri-tourism, namely zoning and land use regulations; licensing
requirements; liability insurance and risk management; developing a business plan; financing
your enterprise; marketing your product; and networking and identifying resources. Other
researchers listed critical factors for success, such as the ability to manage the visitor
experience; a passion for learning; creativity; the ability to match core assets with customer
requirements; strong social stills; financial/enterprise analysis; location proximity to other
attractions; and marketing/understanding customer needs and expectations. Each of these
aspects and factors is also applicable in a South African context, and farmers should consider
and understand them when implementing agri-tourism on their farms.

157
Researchers identified key marketing media for agri-tourism businesses in Australia and New
Zealand, namely word of mouth, internet, tourism visitors’ centres, local tourism organisations,
roadside signs, flyers and brochures, and printed media. Other key areas for supporting and
enhancing involvement in agri-tourism (in Australia and New Zealand) include defining agri-
tourism; understanding the market and how to respond; developing strategic approaches;
developing models and methods of training; enhancing all elements, from products to
distribution; and integrating resources. All of the media mentioned above and areas are also
applicable in a South African context and can be implemented and used by South African
farmers.
Characteristics that some of the European countries offering agri-tourism have in common,
include the following:
Agri-tourism contributions were rather moderate in terms of general tourist markets.
There is no common understanding of agri-tourism.
A common challenge is balancing the new agri-tourism activities with the main farm
activities (agriculture).
There is a continuous change in the demands of tourists, which creates the need to
examine and follow trends.
The experiences are authentic, attractive and unique.
All of these elements can also be observed in a South African context. This concludes that,
similar to European countries offering agri-tourism, South Africa also faces some of the same
challenges. Therefore, it is important for countries to learn from one another.
A study in Asia identified the following opportunities in terms of developing agri-tourism
(Malkanthi and Routry, 2011:53):
Several attractive tourist locations are available.
There is an opportunity for mutual co-operation between farmers and local
organisations.
High unemployment rates can be relieved by utilising unemployed people for
employment in the agri-tourism sector.
The government should focus more on sustainable rural tourism development.
There is an increase in the demand for agri-tourism among visitors.
These opportunities are part of a SWOT analysis done on the area. All of the above-mentioned
opportunities also exist in South Africa.

158
Research done in the United States, Australia, New Zealand, Europe, and Asia concludes that
research is a necessity to identify problems and design ways to focus on the positive elements
needed to implement agri-tourism successfully. Thus, although these types of research do not
yet exist in South Africa, the information gathered from other countries is very useful in
understanding agri-tourism and is a guideline that shows how to implement it successfully.
There is not a direct correlation between the size of a province and the population living in the
province. For example, Gauteng is the smallest province in size but is home to 25% of the
population of the country. On the other hand, the Northern Cape is the largest province in size
and home to less than 5% of the population of the country. Large areas in the Northern Cape
are still underdeveloped and introduce new tourism opportunities for the area.
In 2016, the agriculture sector was responsible for about 874 000 employment opportunities
(5.54% of the total employment), and the tourism industry (directly involved in producing goods
and services purchased by visitors) was responsible for about 686 596 employment
opportunities (4.35% of the total employment). This concludes that these two sectors combined
produce about 10% of the employment opportunities in South Africa. Thus agri-tourism, which is
the amalgamation of these two sectors, provides thousands of job opportunities in South Africa
each year.
In terms of agriculture, South Africa exports millions of Rands’ worth of citrus fruit, wine, grapes,
apples, pears, and quinces each year. This concludes that South Africa has a large production
of high-quality products. Agri-tourism elements can teach South Africans about these products
before they are exported through farm tours, factory visits, and information sessions. Farmers
have the opportunity to show locals the production process before exporting products.
Spending on tourism differs from province to province. For example, international tourists spend
most of their money in Gauteng. This concludes that a large number of international tourists are
already visiting Gauteng, and marketing of agri-tourism activities/attractions in the province
should be relatively easy, since the tourists are already there. The same principle can be
applied to domestic tourists, who spend most of their money in KwaZulu-Natal and Limpopo.
Marketing this market should be relatively easy if they are already visiting the area. Other
provinces such as the North-West, Free State, and Northern Cape contribute very little to the
annual tourist spending. Thus, there is a large gap in marketing/attractions/infrastructure in the
provinces. It also creates the opportunity for expansion in these provinces.
Agricultural production and tourism attractions differ from province to province. This study
identified several agricultural products and tourist attractions in each province. These two
elements should be combined. For example, the Eastern Cape is home to almost 40% of the

159
country’s goats and has a long and beautiful coastal line (Wild Coast). These two elements can
be combined using farm tours/visits with farm stay/accommodation to learn more about farming
with goats and the farm life in general, while also having the opportunity to visit the sea. There
are already many infrastructures in the province that can be used to accommodate tourists.
5.2.2 Key findings in the survey results
They study has the following key findings:
South African farmers are well-educated males between the ages of 30 and 60. This
concludes that there is a large gap in females to be trained in either agriculture and
farming, or agri-tourism aspects to manage and market tourism elements of farms.
The average farmer was first exposed to farming before going to school, is at least a
third-generation farmer or more, and has been farming actively for an average of
nineteen years. This creates the opportunity to start training farmers at a very young
age, including training and information sessions with regard to what agri-tourism is and
how to implement it. On the other hand, to develop the agriculture sector, there needs to
be training for new and “up-and-coming” farmers as well. Without prior knowledge of
farming and agri-tourism, they need training on how to farm sustainably and how to
include an agri-tourism element.
Very few farmers in South Africa are members of a tourism society (e.g. the South
African Tourism Service Association and the National Accommodation Association of
South Africa). These organisations/societies have resources that farmers can use to
implement and manage agri-tourism on their farms, including access to information,
training, strategies, and financial support. This is a large resource that farmers have to
their disposal, which can also assist in the transition to hosting agri-tourism. These
organisations also offer assistance in terms of marketing on behalf of their members.
Most farmers own one farm, while outliers own about 20 farms in the Free State and 13
farms in the North-West Province. This raises the average size of farmland (land
surface) owned per person to 2 631 hectares in South Africa. The average size of
farmland owned per person differs from province to province; for example, in the
Northern Cape, farmers own an average of 13 510 hectares of farmland. This concludes
that farmers need different land sizes to be able to farm sustainably, depending on the
location of their farms. Therefore, the guidelines and strategies for farmers will differ
from area to area, which may also be true for agri-tourism guidelines and strategies, as
each area has its own strengths and weaknesses.

160
Different forms of ownership were indicated for farms. The most popular was sole
proprietor followed by a trust. Some farms even indicated that they more than one type
of ownership was applicable to different farms. Farmers need to consider legal
implications, since most farmers pass their farms on from generation to generation.
While it is clear that ownership as a sole proprietor or a trust is meaningful, information
with regard to registration etc. should be widely available.
The number of full-time employees differs from farmer to farmer. The 557 respondents
indicated that they have a total number of 13 129 full-time employees. While more than
half of all the respondents (50.3%) indicated that they had seven full-time employees or
fewer working on their farms, the average number of full-time employees per farm
(smaller than 10 000 hectares) was 12. Based only on farmers who were hosting agri-
tourism activities/attractions on their farm(s), an average of 2 full-time employees was
involved in agri-tourism activities/attractions on farms. The respondents indicated that
they have a total number of 1 371 employees involved in agri-tourism. This number
differs from province to province, as farmers hosting agri-tourism in the Western Cape
had an average of 17 employees, while provinces such as Mpumalanga, Gauteng and
the Northern Cape had an average of only one employee in agri-tourism per farmer
hosting agri-tourism. It is clear that farmers in a province such as the Western Cape are
already utilising the opportunities of agri-tourism on their farms successfully. With the
Western Cape as an example, other provinces can also invest in agri-tourism employees
to manage and promote the additional elements.
The most popular farming activities by far in South Africa are livestock, mixed products
(livestock and crops), and crops, while the least popular farming activity is dairy
products. Farmers that focus on livestock and crops can include the day-to-day activities
in a farm tour or similar agri-tourism activity.
Only 24% (around 133) of the respondents indicated that they were hosting agri-tourism
on their farms. This brought the average number of years hosting agri-tourism on all
farms included in the survey down to 3 years. When considering only farms that were
hosting agri-tourism, KwaZulu-Natal had been hosting agri-tourism for an average of 21
years, followed by the Northern Cape (15 years) and the Eastern Cape (13 years). Thus,
agri-tourism is not a new phenomenon in South Africa, with many provinces hosting agri-
tourism over the past fifteen to twenty years. However, There is still a large gap in the
sector, with 76% of farmers not hosting any form of agri-tourism on their farm(s).

161
The key reasons for hosting agri-tourism on a farm are to use farm resources to their
fullest potential, generate an additional income, preserve natural resources and
ecosystems, and provide recreational activities for visitors. The least important reason
indicated by respondents is to educate visitors and the public about agriculture.
Therefore, it is clear that farmers see the advantages and potential that agri-tourism has
on their farms. However, it is a matter of concern that they have no interest in educating
visitors and the public about agriculture. This identifies a gap in education with regard to
information and practical experience from a farmer’s (supplier’s) side. One of the five
categories of agri-tourism is educational experiences, which remains unutilised.
The most important marketing media that respondents indicated should be used to
promote agri-tourism in South Africa were internet websites, word of mouth, Facebook, e-mail address, and telephones/cell phones. The least important
marketing media include TV advertisements, radio advertisements, and Twitter. This
creates a clear image of which media farmers will use when promoting their farms
(internet websites, word of mouth, and Facebook). While these media can be used, a
marketing plan is still necessary for farmers. These plans will differ from province to
province and from market to market (international or local).
Local tourists are the main target market for farms hosting agri-tourism in South Africa.
The only provinces with significantly high international target markets are KwaZulu-Natal
(41% international), the Eastern Cape (34% international), and the Western Cape (33%
international). These two diverse markets have different wants and needs, and it is
important for the farmers (suppliers) to know their market and exactly what the market is
looking for. This includes desired amenities, level of service, and price structures.
On average, agri-tourism farms in Gauteng can host between 31 and 50 tourists at a
time, followed by the Western Cape and KwaZulu-Natal with an average of 11 to 30
tourists. In all other provinces, agri-tourism farms can host only an average of between 5
and 10 tourists at a time. This is based on the results of farmers currently hosting agri-
tourism on their farms.
Farms hosting agri-tourism in KwaZulu-Natal generate between 10% and 30% of the
annual income of their farms through agri-tourism, followed by Limpopo, North-West,
Free State, Western Cape, and Eastern Cape – all generating between 5% and 10% of
the annual income of their farms from agri-tourism. This proves that agri-tourism can be
a source of additional income to a farm in South Africa. Although the amount it
contributes is still low, there is potential.

162
The most popular outdoor recreation activities/attractions were identified as hunting
(most popular in Limpopo, the Free State, the Western Cape, and the Northern Cape),
hiking trails/nature trails (most popular in the Western Cape), wildlife viewing and
photography (most popular in the Western Cape and the Northern Cape), and cycling
(most popular in the Western Cape). Farm maze routes, golf courses, and paintball were
not very popular in South Africa. Thus, the Western Cape is the trendsetter for outdoor
recreation activities/attractions, followed by the Northern Cape. While they have
successfully implemented these activities/attractions, there is a large potential for other
provinces to implement these elements as well. This concludes that agri-tourism
activities/attractions differ from province to province; there is a distinct difference.
The most popular educational experiences were identified as farm tours, historical
memorials, food and beverage pairing, and business tours. These activities/attractions
are not offered in every province, however, and identify an opportunity to invest in new
initiatives.
Farm entertainment is not very popular in South Africa with limited farm activities,
including barn dances, concerts, and festivals. While most of these activities have large
potential on South African farms, they need to be implemented sustainably.
The most popular hospitality service and agri-tourism activity/attraction in the study was
farm stay/accommodation. Other services include weddings and special events on
farms, social events, and a restaurant.
Roadside stands/farm stalls were the most popular direct sales on the farm, followed by
u-picking. While the most popular farming activities in South Africa include crops, there
is great potential for farmers (suppliers) to offer direct sales on farms.
The top agri-tourism activities/attractions that farmers plan to implement within the next
five years (in order of importance) include farm stay/accommodation, wildlife viewing and
photography, hiking/nature trails, cycling, bird watching, camping, and hunting. These
activities/attractions are in line with the current agri-tourism status of agri-tourism in
South Africa and can be classified as the current trending activities/attractions. Since
some farmers have implemented agri-tourism successfully, they can build on this
groundwork for future implementation.
The results received from the survey conclude that some South Africa farmers have
implemented agri-tourism activities/attractions successfully on their farms and confirm

163
that there is a great potential for implementing more agri-tourism elements on farms.
This opportunity offers untapped potential that farms in South Africa can utilise.
5.3 RECOMMENDATIONS
Based on the results and conclusions, the following recommendations can be made with regard
to this study, as well as suggestions for future studies.
5.3.1 Recommendations from the study
Recommendations with regard to this study can be categorised for specific stakeholders
including the South African Government, Agri SA and similar organisations, and South African
farmers.
5.3.1.1 Recommendations for the South African Government
The following recommendations are made for the South African Government, based on the
research:
Farmers have to follow and abide by several rules, regulations, and laws to host certain
activities/attractions on their farms and to ensure the safety and security of farmers and
tourists. These rules and regulations also apply with regard to obtaining financial
support. Although these rules, regulations, and laws are in place, they are not always
clear, and information on the topics are not always widely available. Especially first-time
agri-tourism-hosting farmers need guidance and assistance that only the Government
can offer them. Thus, more and better access to information regarding hosting tourism
activities on a farm and opportunities for funding should be available. An easy way to
distribute information is through a website that allows easy and free access to farmers.
Agri-tourism provides an additional income not only for the farmers, but also for the local
community and the South African economy. Therefore, subsidies should be offered to
farmers by the government to ensure that they can offer agri-tourism activities/attractions
successfully and sustainably on their farm.
Although agri-tourism is already popular in South Africa, there is still a large cap in the
knowledge of farmers on how to implement and manage agri-tourism successfully. The
Department of Agriculture, Forestry and Fisheries, together with the Department of
Tourism, should develop agri-tourism programmes and offer training and better
education to South African farmers and farm workers to ensure informed decisions. This
can be presented at agricultural events and shows such as NAMPO Harvet Day. These

164
programmes and training are the responsibility of not only the Government, but also all
stakeholders in the agriculture and tourism industries, as it is essential for the progress
and success of the agri-tourism sector.
The agriculture and tourism sectors combined are responsible for about 1.5 million
(10%) job opportunities each year. Thus, the government should assign a larger portion
of the national budget towards these two sectors to assist the suppliers (the farmers and
owners of tourism businesses). This assistance should include financial support,
especially in terms of aspects over which the suppliers do not have control, such as the
current droughts in South Africa. Both the agriculture and the tourism sectors were
severely affected by these natural phenomena. Agri-tourism can create even more job
opportunities, but without any assistance, employment in these sectors will not continue
to grow.
5.3.1.2 Recommendations for Agri SA and similar organisations
The following recommendations are made for agricultural organisations such as Agri SA and
similar, based on the research:
Farmers need more information and training regarding agri-tourism and how to
implement it sustainably. Organisations can offer support in terms of information and
other resources to assist farmers in their development phase. This can include training
sessions and information guides.
Farmers need practical assistance on their farms. Organisations should develop a
department within their organisation that can assist and guide farmers with regard to
their specific farm and how to implement and manage agri-tourism successfully on their
farms. This department can develop workshops, presentations and
Marketing is an important element of agri-tourism. Organisations can assist with models
and step-by-step guideline regarding the marketing of tourism products. Additionally,
they can create a platform on which South African agri-tourism can be marketed on.
Different provinces have different agricultural and tourism elements. Each province
should include tailor-made guidelines for the farmers in the particular province. This can
be a step-by-step guideline, a presentation or even a short video that shows farmers
what is possible in the area. Organisations have more resources to identify the
opportunities in a province/area than a single farmer has, therefor the support of the
organisations is essential.

165
Farmers can host a long list of agri-tourism activities/attractions, but not all
activities/attractions are popular or available in South Africa. Farmers should be aware of
the different activities/attractions and what they entail in order to make informed
decisions on what to host on their farms. Larger organisations have the resources to
investigate different agri-tourism activities/attractions and to provide a complete list of
agri-tourism activities/attractions, as no list existed prior to this study.
5.3.1.3 Recommendations for farmers
The following recommendations are made for South African farmers, based on the research:
Agri-tourism is a very wide field, and it is important for farmers to educate themselves on
exactly what it entails so that they can make an informed decision on whether they want
to implement it on their farms or not.
Organisations such as Agri-tourism Africa and Agri SA assist farmers with regard to
implementing and marketing agri-tourism on their farms. These resources are at the
farmers’ disposal and they need to utilise them.
5.3.2 Recommendations for future studies
The following recommendations are made for future studies and research:
No marketing model/plan on how to market a farm for a local (South African) or
international target market has existed to date.
A model on how to implement agri-tourism sustainably can be developed with clear
guidelines to how farmers should approach this opportunity.
This study included an economic element that identified the percentage of the annual
income of a farm that is generated from agri-tourism activities/attractions. However,
there is no information regarding the economic contribution that agri-tourism makes to a
farm and to the local economy.
Finally, it is essential for farmers to have training in tourism in order to successfully
implement agri-tourism on their farms. Different training models can be examined and
perfected before presenting it to farmers.

166
5.4 LIMITATIONS OF THE STUDY
The results in this study were affected by a number of limitations, including the following:
Access to farmers was a challenge, as there is no single organisation or institution
of which all farmers are members.
Geographically, the study took place over a large area, covering all nine provinces in
South Africa, and resources including time and transport to reach various farmers in
all nine provinces equally successfully were limited.
5.5 CONCLUSION
The main goal of this study was to determine the size and scope of agri-tourism in South Africa.
Through thorough research, it was established that agri-tourism is still a relatively new concept
and South Africa. Almost fifty different agri-tourism activities and attractions were identified that
are currently begin hosted on farms in South Africa. The most popular form of agri-tourism in
South Africa is farm stay (accommodation on a farm). Other popular activities include hunting
and fishing. It is clear that outdoor recreation is the most popular form of agri-tourism in South
Africa. Provincially, farm located in the Western Cape are the most likely to host agri-tourism as
they have indicated a wide variety of activities and attractions currently.
There is still a large gap in knowledge and skills to successfully implement agri-tourism.
however, agri-tourism is a growing sector in South Africa with tremendous economic, social and
environmental advantages.

167
REFERENCE LIST
Adams, S. 2010. Bird-watching. Forbes: 50, 7 June.
Agbeh, A. & Jurkowski, E.T. 2016. Preparing for Baby Boomers as an agri-tourism market.
Journal of tourism & hospitality, 5(3):1-6.
Agri Africa. 2016. What is a commercial farmer? http://www.farmingportal.co.za/index.php/
important-facts/item/6648-what-is-a-commercial-farmer Date of access: 22 June 2017.
Agri SA. 2017. Agri SA. http://www.agrisa.co.za/ Date of access: 11 March 2017.
Agritour. 2008. Welcome to AGRITOUR. http://agritour.co.nz/ Date of access: 24 Dec. 2018.
Ainley, S. & Kline, C. 2014. Current issues in method and practice. Moving beyond positivism:
reflexive collaboration in understanding agri-tourism across North American boundaries.
Current issues in tourism, 17(5):404-413.
Akinboade, O.A. & Braimoh, L.A. 2010. International tourism and economic development in
South Africa: A Granger causality test. International journal of tourism research, 12(2):149-163.
Arroyo, C.G., Barbieri, C. & Rich, S.R. 2013. Defining agri-tourism: a comparative study of
stakeholders’ perception in Missouri and North Caroline. Tourism management, 37(1):39-47.
Asiedu, A.B. & Gbedema, T.K. 2011. The nexus between agriculture and tourism in Ghana: a
case of underexploited development potential. (In Torres, R.M. & Momsen, J.H., eds. Tourism
and Agriculture: new geographies of consumption and rural restructuring. London: Routledge.
p. 28-46).
Ateljevic, I., Morgan, N. & Pritchard, A., eds. 2013. The critical turn in tourism studies: creating
an academy of hope. Oxon: Routledge.
Baker, J.E. 1997. Trophy hunting as a sustainable use of wildlife resources in southern and
eastern Africa. Journal of sustainable tourism, 5(4):306-321.
Balan, D., Balaure, V. & Veghes, C. 2009. Travel and tourism competitiveness of the world's
top tourism destinations: An exploratory Assessment. Annales Universitatis Apulensis: Series
Oeconomica, 11(2):979-987.
Balmurugan, A., Kannan, R. & Nagarajan, S.K., eds. 2012. Rural tourism development
constraints and potential with special reference to agri-tourism: a case study on Cashew agri-

168
tourism destination – Rajendrapattinam Village in Vriddachalam Taluk of Cuddalore District,
Tamil Nadu (In Manhas, P.S., ed. 2012. Sustainable and responsible tourism: trends,
practices and cases. New Delhi: PHI Learning Private Limited).
Barbieri, C. & Mshenga, P.M. 2008. The role of the firm and owner characteristics on the
performance of agri-tourism farms. Sociologia ruralis, 48(2):166-183.
Bernardo, D., Valentin, L. & Leatherman, J. 2004. Agri-tourism: if we build it, will they come?
http://www.uvm.edu/tourismresearch/agtour/publications/Kansas%20State%20Study.pdf Date
of access: 2 Feb. 2017.
Booyens, I. 2012. Innovation in Tourism: a new focus for research and policy development in
South Africa. Africa insight, 42(2):112-126.
Brandth, B. & Haugen, M.S. 2011. Farm diversification into tourism – implications for social
identity? Journal of rural studies, 27(1):35-44.
Broccardo, L., Culasso, F. & Truant, E. 2017. Unlocking value creation using an agri-tourism
business model. Sustainability, 9(9):1-26.
Brookover, R. & Jodice, L. 2010. Pee Dee Agri-tourism. Product development plan. USA:
Clemson University – International Institute for Tourism Research and Development.
Buckley, R. 2006. Adventure Tourism. Wallingford, CABI.
Buhalis, D. & Carlos, C., eds. 2006. Tourism management dynamics: trends, management and
tools. Oxford: Elsevier Butterworth-Heinemann.
Burns, A. C. & Bush, R. F. 2014. Marketing Research. 7th ed. England: Pearson Education
Limited.
Business Partners Limited. 2016. Tourism associations and organisations.
https://www.businesspartners.co.za/en-za/entrepreneurs-growth-centre/useful-articles/top-tips-
and-blogs/tourism-associations-and-organisations Date of access: 24 Des. 2018.
Bwana, M.A., Olima, W.H.A., Andika, D., Agong, S.G. & Hayombe, P. 2015. Agri-tourism:
potential socio-economic impacts in Kisumu County. Journal of humanities and social science,
20(3):78-88.

169
Călina, A., Călina, J. & Stan, I. 2017. Research regarding the sustainable development of
agritourism in the neighbouring area of Cozia National Park, Romania. AgroLife scientific
journal, 6(2):33-42).
Cambridge University Press. 2019. Cambridge Dictionary.
https://dictionary.cambridge.org/dictionary/english/ Date of access: 27 May. 2019.
Carpio, C.E., Wohlgenant, M.K. & Boonsaeng, T. 2008. The demand for agri-tourism in the
United States. Journal of agricultural and resource economics, 33(2):254-269.
Carruthers, J. 2008. Wilding the farm or farming the wild? The evolution of scientific game
ranching in South Africa from the 1960s to the present. Transactions of the royal society of
South Africa, 63(2):160-181.
Che, D., Veeck, A. & Veeck, G. 2005. Sustaining production and strengthening the agri-
tourism product: linkages among Michigan agri-tourism destinations. Agriculture and human
values, 22(2):225-234.
Cheng, C.K., Li, X.R., Petrick, J.F. & O'Leary, J.T. 2011. An examination of tourism journal
development. Tourism management, 32(1):53-61.
Chikuta, O. & Makacha, C. 2016. Agri-tourism: A possible alternative to Zimbabwe’s tourism
product? Journal of tourism and hospitality management, 4(3):103-113.
Clanwilliam. 2019. Buchu and Rooibos Tour – Skimmelberg, Clanwilliam.
https://www.clanwilliam.info/clanwilliam-member-161.php Date of access: 25 Jan. 2019.
Cohen, E. 2009. The wild and the humanized: animals in Thai tourism. Anatolia: an
international journal of tourism and hospitality research, 20(1):100-118.
Cohen, E. & Cohen, S.A. 2012. Authentication: hot and cool. Annals of tourism research,
39(3):1295-1314.
Comen, T. & Foster, D. 2006. Agricultural diversification and agri-tourism: critical success
factors. Interim report presented to the Vermont Department of Agriculture, Food and Markets
http://www.uvm.edu/tourismresearch/agtour/publications/ Date of access: 20 Jun. 2017.
Creswell, J.W. & Plano Clark, V.L. 2011. Designing and conducting mixed methods research.
2nd ed. Thousand Oaks: Sage Publications.

170
Cusmano, L., Morrison, A. & Rabellotti, R. 2010. Catching up trajectories in the wine sector: A
comparative study of Chile, Italy, and South Africa. World development, 38(11):1588-1602.
Darnhofer, I., Gibbon, D.P. & Dedieu, B., eds. 2012. Farming systems research into the 21st
century. Dordrecht: Springer.
Dastrup, R.A. 2016. Introduction to Human Geography. http://www.opengeography.org/ch-6-
food-water-and-agriculture.html Date of access: 20 Jun. 2017.
Daugstad, K. & Kirchengast, C. 2013. Authenticity and the pseudo-backstage of agri-tourism.
Annals of tourism research, 43(1):170-191.
Davidson, N., Ouane, F., Phillpotts, C., Thelwell, A. & Tung, E. 2009. The South African Wine
Cluster. Institute for Strategy and Competitiveness.
Department of Agriculture, Forestry and Fisheries. see South Africa. Department of
Agriculture, Forestry and Fisheries.
Department of Environmental Affairs and Tourism. see South Africa. Department of
Environmental Affairs and Tourism.
Department of Tourism. see South Africa. Department of Tourism.
Du P Bothma, J., Sartorius von Back, H.J. & Cloete, P.C. 2016. Economics of the wildlife
industry in Southern Africa. (In Du P Bothma, J. & Du Toit, J.G., eds. 2016. Game ranch
management. 6th ed. Pretoria: Van Schaik Publishers. p. 85-94).
Ecker, S., Clarke, R., Cartwright, S., Kancans, R., Please, P. & Binks, B. 2010. Drivers of
regional agri-tourism and food tourism in Australia. Canberra: Australian Bureau of Agricultural
and Resource Economics – Bureau of Rural Sciences.Elias, M., ed. 2012. Wine tourism
handbook: South Africa. Enjoying wine at the source. 12th ed. Cape Town: World Focus
Media.
Federico, G. 2005. Feeding the World: an economic history of agriculture, 1800-2000.
Princeton: Princeton University Press.
Ferreira, S.L. & Müller, R. 2013. Innovating the wine tourism product: food-and-wine pairing in
Stellenbosch wine routes. African journal for ohysical, health dducation, recreation and dance,
19(3):72-85.

171
Flanders, F.B. & Gillespie, J. 2015. Modern livestock and poultry production. 9th ed. Boston:
Cengage Learning.
Flanigan, S., Blackstock, K. & Hunter, C. 2015. Generating public and private benefits through
understanding what drives different types of agri-tourism. Journal of rural studies, 41(1):129-
141.
Fluri, T.P. 2009. The potential of concentrating solar power in South Africa. Energy policy,
37(1):5075-5080.
Food and Agriculture Organization of the United Nations. 2018. Commodities by country.
http://www.fao.org/faostat/en/#rankings/commodities_by_country Date of access: 22 Jan. 2019.
Fourie, M. 2015. Factors influencing visitor loyalty at an agri-festival in South Africa.
Potchefstroom: NWU. (Thesis – PhD).
Frechtling, D.C. 2001. Forecasting tourism demand: methods and strategies. Woburn:
Butterworth-Heinemann.
Geldenhuys, S. 2009. Ecotourism criteria and context. (In Saayman, M., eds. Ecotourism:
getting back to basics. Potchefstroom: Institute for Tourism and Leisure Studies. p. 2-24).
George, R., ed. 2007. Managing tourism in South Africa. Cape Town: Oxford University Press
Southern Africa.
Goldblatt, A. 2010. Agriculture: facts & trends, South Africa. WWF South Africa.
Govindasamy, R. & Kelley, K. 2014. Agri-tourism consumers’ participation in wine tasting
events: an econometric analysis. International journal of wine business research, 26(2):120-
138.
Grigg, D.B. 1974. The agricultural systems of the world: an evolutionary approach. London:
Cambridge University Press.
Hall, C.M., Johnson, G., Cambourne, J.B., Macionis, N., Mitchell, R. & Sharples, L. 2000. Wine
tourism: an introduction. (In Hall, C.M., Sharples, L., Cambourne, B. & Macionis, N., eds. Wine
tourism around the world: development, management and markets. Oxford: Butterworth-
Heinemann. p. 1-23).

172
Hall, R., ed. 2009. Another countryside: policy options for land and agrarian reform in South
Africa. Bellville: Institute for Poverty, Land and Agrarian Studies, School of Government,
University of the Western Cape.
Hatley, L. 2009. The nature of agri-tourism in the Buffalo City Municipality. Cape Town: Cape
Peninsula University of Technology. (Dissertation – MTech).
Haugen, M.S. & Vik, J. 2008. Farmers as entrepreneurs: the case of farm-based tourism.
International journal of entrepreneurship and small business, 6(3):321-336.
Holland, R. 2015. Old laws and modern agriculture: agritourism, CSAs and direct-to-consumer
sales. Tennessee: University of Tennessee (Centre for profitable agriculture).
Holland, R. & Wolfe, K. 2001. Targeting school groups for agritainment enterprises: summary
of a schoolteacher survey in Tennessee. Tennessee Agricultural Extension Service PB-1669.
University of Tennessee, Knoxville
Irshad, H. 2010. Rural tourism – an overview. Canada: Rural Development Division,
Government of Alberta.
Ivankova, N.V., Creswell, J.W. & Plano Clark, V.L. 2016. Foundations and approaches to
mixed methods research. (In Maree, K., ed. First steps in research. 2nd ed. Pretoria: Van
Schaik Publishers. p. 305-336).
Ivanovic, M. 2008. Cultural tourism. Cape Town: Juta & Company, Ltd.
Jamal, T. & Robinson, M., eds. 2009. The SAGE handbook of tourism studies. London: SAGE
Publication Ltd.
Jennings, G. 2001. Tourism research. Brisbane: John Wiley & Sons.
Jensen, K.L., Leffew, M.B., Menard, R.J. & English, B.C. 2014. analysis of factors influencing
agri-tourism businesses perceptions about expansion. Journal of food distribution research,
45(2):118-134.
Karampela, S., Kizos, T. & Spilants, I. 2016. Evaluating the impact of agri-tourism on local
development in small islands. Island studies journal, 11(1):161-176.
Karthik, D. & Gajanand, P. 2017. Agri-tourism – an overview.
https://www.biotecharticles.com/PDF_Articles/Agri_toutism_BA_4135.pdf Date of access: 12
Feb. 2019.

173
Kelly, L. 1989. How managers manage. Englewood Cliffs: Prentice-Hall Inc.
Khanal, A.R. & Mishra, A.K. 2014. Agri-tourism and off‐farm work: survival strategies for small
farms. Agricultural economics, 45(1):65-76.
Kiper, T. 2011. Land use planning regarding sustainable development through agri-tourism:
Şarkőy example. Journal of agricultural biotechnology and sustainable development, 3(8):171-
181.
Kruger, S., Barrat, E. & Van der Merwe, P. 2015. Determining the impact of hunting trips on
the hunters’ quality of life. African journal of hospitality, tourism andlLeisure, 4(2):1-17.
Kukorelli, I.S. 2011. Tourism and agriculture in Hungary: post-productivist transition or new
functions in rural space? (In Torres, R.M. & Momsen, J.H., eds. Tourism and agriculture: new
geographies of consumption and rural restructuring. New York: Routledge. p. 14-27).
Leiper, N. 2004. Tourism management. 3rd ed. Frenchs Forest: Pearson Education.
Lew, J. 2012. Top 8 agritourism destinations in the world. https://www.mnn.com/lifestyle/eco-
tourism/photos/top-8-agritourism-destinations-in-the-world/philippines Date of access: 25 Jan.
2019.
Lindsey, P.A., Alexander, R., Frank, L.G., Mathieson, A. & Romanach, S.S. 2006. Potential of
trophy hunting to create incentives for wildlife conservation in Africa where alternative
wildlife‐based land uses may not be viable. Animal conservation, 9(3):283-291.
Lindsey, P.A., Roulet, P.A. & Romanach, S.S. 2006. Economic and conservation significance
of the trophy hunting industry in sub-Saharan Africa. Biological conservation, 34(1):455-469.
Macaskill, C. 2013. The Agri Handbook 2013-14. https://agribook.co.za/marketing-
finance/providers-of-financial-services/ Date of access: 22 Dec. 2018.
Mace, D. 2005. Factors motivating agri-tourism entrepreneurs. (In Risk and profit conference,
Manhattan, Kansas, USA.)
Maksymov, D. 2017. Descriptive analysis of agri-tourism in Louisiana: motivation. Marketing.
Limitations. Baton Rouge: Louisiana. (Thesis – M).
Malkanthi, S.H.P. & Routry, J.K. 2011. Potential for agri-tourism development: evidence from
Sri Lanka. The journal of agricultural sciences, 6(1):45-57.

174
Markwell, K. 2015. Birds, beasts and tourists: human-animal relationships in tourism. (In
Markwell, K., ed. Animals and tourism: understanding diverse relationships. Bristol: Channel
View Publications. p. 1-23).
Marques, H. 2006. Searching for complementarities between agriculture and tourism – the
demarcated wine-producing regions of north Portugal. Tourism economics, 12(1):147-155.
Marsh, L., Zoumenou, V., Cotton, C. & Hashem, F. 2017. Organic farming: knowledge,
practices, and views of limited resource farmers and non-farmers on the Delmarva Peninsula.
Organic agriculture, 7(2):125-132.
Mason, P. 2008. Tourism impacts, planning and management. 2nd ed. Burlington:
Butterworth-Heinemann.
McGhee, N.G. 2007. An agri-tourism systems model: a Weberian perspective. Journal of
sustainable tourism, 15(2):111-124.
McGhee, N.G. & Kim, K. 2004. Motivation of agri-tourism entrepreneurship. Journal of travel
research, 43(1):161-170.
McGhee, N.G., Kim, K. & Jennings, G.R. 2007. Gender and motivation for agri-tourism
entrepreneurship. Tourism management, 28(1):280-289.
Menong, J.M., Mabe, L.K. & Oladele, O.I. 2013. Analysis of extension needs of commercial
farmers in North-West Province, South Africa. J Hum Ecol, 44(2):139-147.
Meyer, D.F. & Meyer, N. 2015. The role and impact of tourism on local economic development:
a comparative study. African journal for physical, health education, recreation and dance,
21(1):197-214.
Middleton, V.T.C., Fyall, A., Morgan, M., Morgan, M. & Ranchhod, A. 2009. Marketing in travel
and tourism. 4th ed. Burlington: Butterworth-Heinemann.
Moerat, R. 2016. Top 10 fun wine and food pairings for travellers in Stellenbosch.
https://www.traveller24.com/Explore/SAHolidayGuide/top-10-fun-wine-and-food-pairings-for-
travellers-in-stellenbosch-20160714 Date of access: 25 Jan. 2019.
Mond, O. 2017. Petting zoos, farms & wildlife parks in Cape Town. (Cape Town Magazine)
http://www.capetownmagazine.com/animals Date of access: 22 Apr. 2017.

175
Monteiro, A. 2018. South Africa prices drop 32% on land-reform change, drought.
https://www.bloomberg.com/news/articles/2018-09-10/south-africa-land-prices-drop-32-on-land-
reform-change-drought Date of access: 4 Feb. 2019.
Moraru, R.A., Ungureanu, G., Bodescu, D. & Donosă, D. 2016. Motivations and challenges for
entrepreneurs in agri-tourism. Agronomy series of scientific research/Lucraru stiintifice seria
agronomie, 59(1):267-272.
Moutinho, L., ed. 2011. Strategic Management in Tourism. 2nd ed. Wallingford: CAB
International.
Muchapondwa, E. & Stage, J. 2013. The economic impacts of tourism in Botswana, Namibia
and South Africa: Is poverty subsiding? Natural resources forum, 37(2):80-89.
Myer, S.L. & De Crom, E.P. 2013. Agri-tourism activities in the Mopani District Municipality,
Limpopo Province, South Africa: perceptions and opportunities. TD: the journal of
transdisciplinary research in Southern Africa, 9(2):295-308.
National Treasury see South Africa. National Treasury.
Nell, W.T., Maine, N. & Basson, P.M. 2006. Precision agriculture: an overview. (In Srinivasan,
A., ed. Handbook of precision agriculture: principles and applications. New York: Haworth
Press. p. 465-500).
Newsome, D. & Dowling, R.K., eds. 2010. Geotourism: the tourism of geology and landscape.
Woodeaton: Goodfellow Publishers.
Newsome, D., Moore, S.A. & Dowling, R.K. 2002. Natural area tourism: ecology, impacts and
management. Clevedon, UK: Channel View Publications.
Nickerson, N.P., Black, R.J. & McCool, S.F. 2001. Agri-tourism: motivations behind farm/ranch
business diversification. Journal of travel research, 40(1):19-26.
Niedziolka, A. & Brzozowska, A. 2009. Aspects of agri-tourism management in Malopolska
Voivodeship. Annals of the University of Petrosani, economics, 9(4):105-112.
Oredegbe, A. & Fadeyibi, I. 2009. Diversification into farm tourism. (In International
Conference on Regional and Urban Modelling, June, University of Ottawa, Ontario).
http://ecomod. net/sites/default/files/document-conference/ecomod2009/859. pdf Date of
access: 10 Feb. 2019.

176
Oxford University Press. 2019. English Oxford Living Dictionaries.
https://en.oxforddictionaries.com/definition/ Date of access: 27 May 2019.
Petroman, I. & Cornelia, P. 2010. Agri-tourism and its forms. Lucrări stiinţifice seria
agronomie, ISSN, 53(1):367-369.
Petroman, I., Varga, M., Constantin, E.C., Petroman, C., Momir, B., Turc, B. & Merce, I. 2016.
Agri-tourism: An educational tool for the students with agro-food profile. Procedia economics
and finance, 39(1):83-87.
Phelan, C. & Sharpley, R. 2011. Exploring agri-tourism entrepreneurship in the UK. Tourism
planning & development, 8(2):121-136.
Phillip, S., Hunter, C. & Blackstock, K. 2010. A typology for defining agri-tourism. Tourism
management, 10(1):754-758.
Pilař, L., Pokorná, J., Balcarová, T. & Hron, J. 2012. Factors determining the entry of
agricultural farms into agri-tourism. Journal agris on-line papers in economics and Informatics,
4(4):59-65.
Pittman, G.M. 2006. Planting the seeds of a new industry in Arkansas: agri-tourism. A national
AgLaw center research publication. http://nationalaglawcenter.org/wp-
content/uploads/assets/articles/pittman_agri-tourismseeds.pdf Date of access: 16 Feb. 2017.
Potočnik-Slavič, I. & Schmitz, S. 2013. Farm tourism across Europe. European countryside,
5(4):265-274.
Power, A.G. 2010. Ecosystem services and agriculture: tradeoffs and synergies. Philosophical
transactions of the royal society B: biological sciences, 365(1):2959-2971.
Preston-Whyte, R. 2002. Wine routes in South Africa. (In Hall, C.M., Sharples, L.,
Cambourne, B. & Macionis, N., eds. Wine tourism around the world: development,
management and markets. Oxford: Butterworth-Heinemann. p. 102-114).
Privitera, D. 2009. Factors of development of competitiveness: the case of organic-agri-
tourism. (In EAAE Seminar ‘The role of knowledge, innovation and human capital in
multifunctional agriculture and territorial rural development’, Belgrade, Republic of Serbia. p. 1-
12).
Rich, S.R., Xu, S., Barbieri, C. & Arroyo, C.G. 2012. Agri-tourism, farm visits, agro-tourism –
oh my!: Do farmers, residents and extension faculty speak the same language? North Carolina:

177
North Carolina Cooperative Extension Service. https://content.ces.ncsu.edu/agri-tourism-farm-
visits-agro-tourism-oh-my-do-farmers-residents-and-extension-faculty-speak-the-same-
language Date of access: 20 Feb. 2017.
Roberts, L. & Hall, D. 2001. Rural tourism and recreation: principles to practice. Wallingford:
CABI Publishing.
Rogerson, C.M. 2002. Tourism and local economic development: the case of the Highlands
Meander. Development southern africa, 19(1):143-167.
Rogerson, C.M. 2012. Tourism-agriculture linkages in rural South Africa: Evidence from the
accommodation sector. Journal of sustainable tourism, 20(3):477-495.
Rogerson, C.M. & Rogerson, J.M. 2014. Agri-tourism and local economic development in
South Africa. Bulletin of geography. social-economic series, 26(26):93-106.
Rogerson, C.M. & Van der Merwe, C.D. 2016. Heritage tourism in the global South:
development impacts of the cradle of humankind world heritage site, South Africa. Local
economy, 31(1-2):234-248.
Saayman, M. 2001. Tourism marketing in South Africa. Potchefstroom: Institute of Tourism
and Leisure Studies.
Saayman, M. 2002. Hospitality, Leisure & Tourism Management. Potchefstroom: Institute for
Tourism and Leisure Studies.
Saayman, M. & Snyman, J.A. 2005. Entrepreneurship: tourism style. Potchefstroom: Leisure
C Publications.
Saayman, M., ed. 2006. Marketing tourism products and destinations: getting back to basics.
2nd ed. Potchefstroom: Institute for Tourism and Leisure Studies.
Saayman, M., eds. 2013. En route with Tourism: an introductory text. 4th ed. Cape Town:
Juta & Company Ltd.
Saayman, M., Saayman, A. & Rhodes, J. A. 2001. Domestic tourist spending and economic
development: the case of the North-West Province. Development Southern Africa, 18(4):443-
455.
Saayman, M., van der Merwe, R. & Rossouw, R. 2011. The impact of hunting for biltong
purposes on the SA economy. Acta commercii, 11(1):1-12.

178
Saini, S.K. & Chandra, S., eds. 2011. Commercial farming. Delhi: Satish Serial Publishing
House.
Schilling, B.J., Attavanich, W. & Jin, Y. 2014. Does agri-tourism enhance farm profitability?
Journal of agricultural and resource economics, 39(1):69-87.
Sharma, A.K. 2012. The Handbook of Organic Farming. Agrobios: Jodhpur.
Sharpley, R. & Sharpley, J. 1997. Rural tourism: an introduction. London:Thomson Business
Press.
Sidali, K.L. 2011. A sideways look at farm tourism in Germany and in Italy. (In Sidali, K.,
Spiller, A. & Schulze, B., eds. Food, agri-culture and tourism: linked local gastronomy and rural
tourism: interdisciplinary perspectives. Berlin: Springer. p. 2-24).
Sigala, M. & Leslie, D. 2005. International cultural tourism: management, implications and
cases. Burlington: Elsevier Butterworth-Heinemann.
Singh, T.V., ed. 2012. Critical debates in tourism. Bristol: Channel View Publications.
Slabbert, E. & Saayman, M. 2003. Guesthouse management in South Africa. 2nd ed.
Potchefstroom: Institute for Tourism and Leisure Studies.
Sonnino, R. 2004. For a ‘piece of bread’? Interpreting sustainable development through agri-
tourism in Southern Tuscany. Sociologia ruralis, 44(1):285-300.
South Africa. 2017. Karoo farm museums.
http://www.southafrica.net/za/en/articles/entry/article Date of access: 25 Jan. 2019.
South Africa. Department of Agriculture, Forestry and Fisheries. 2016. Abstract of Agricultural
Statistics 2016. Pretoria: Department of Agriculture, Forestry and Fisheries.
South Africa. Department of Agriculture, Forestry and Fisheries. 2017. Economic Review of
the South African Agriculture, 2016. Pretoria: Department of Agriculture, Forestry and
Fisheries.
South Africa. Department of Agriculture, Forestry and Fisheries. 2018. Trends in the
Agricultural Sector, 2017. Pretoria: Department of Agriculture, Forestry and Fisheries.
South Africa. Department of Environmental Affairs and Tourism. 1996. White paper on the
development and promotion of tourism in South Africa. Pretoria.

179
South Africa. Department of Tourism. 2018. State of Tourism Report 2015/16. Pretoria.
South Africa. National Treasury. 2017. Budget Review 2017. Pretoria.
South Africa. National Treasury. 2018. Budget Review 2018. Pretoria.
Srinivasan, A. 2006. Precision agriculture: an overview. (In Srinivasan, A., ed. Handbook of
precision agriculture: principles and applications. New York: Haworth Press. p. 3-18).
Statistics South Africa. 2007. Census of commercial agriculture, 2007: Financial and
production statistics. Pretoria.
Statistics South Africa. 2010. Census of commercial agriculture, 2007. Pretoria: Statistics
South Africa.
Statistics South Africa. 2015a. Statistical release P1101. Agricultural survey (Preliminary)
2015. http://www.statssa.gov.za/publications/P1101/P11012015.pdf Date of access: 12 July
2017.
Statistics South Africa. 2015b. Statistical release P0318. General Household Survey 2015.
https://www.statssa.gov.za/publications/P0318/P03182015.pdf Date of access: 21 Aug. 2017.
Statistics South Africa. 2016. Community Survey 2016, Agricultural households.
https://www.statssa.gov.za/publications/03-01-05/03-01-052016.pdf Date of access: 22 Dec.
2018.
Statistics South Africa. 2017a. Statistical release P0302. Mid-year population estimates 2017.
http://www.statssa.gov.za/publications/P0302/P03022017.pdf Date of access: 26 Aug. 2017.
Statistics South Africa. 2017b. Labour market dynamics in South Africa, 2017??5
https://www.statssa.gov.za/publications/Report-02-11-02/Report-02-11-022015.pdf Date of
access: 22 Dec. 2018.
Statistics South Africa. 2018a. Domestic Tourism Survey, 2017 (Statistical Release P0352.1).
Pretoria: Statistics South Africa.
Statistics South Africa. 2018b. Quarterly Labour Force Survey, Quarter 3: 2018.
http://www.statssa.gov.za/publications/P0211/P02113rdQuarter2018.pdf Date of access: 22
Dec. 2018.
Swarbrooke, J. 1999. Sustainable tourism management. Wallingford: CAB International.

180
Swartbrooke, J., Beard, C., Leckie, S. & Pomfret, G. 2003. Adventure tourism the new frontier.
Oxford: Elsevier.
Sznajder, M., Przezborska, L. & Scrimgeour, F. 2009. Agri-tourism. Oxfordshire: CAB
International.
Tew, C & Barbieri, C. 2012. The perceived benefits of agri-tourism: the provider’s perspective.
Tourism management, 33(1):215-224.
Theron, D. & Muller, K. 2016. The grain and oilseed industry of South Africa: A journey through
time. Klerksdorp: Infoworks Media Publishing.
Tibane, E., ed. 2016. Pocket Guide to South Africa 2015/16. 13th ed. Pretoria: Government
Communications and Information System (GCIS).
Tibane, E., ed. 2018. Official Guide to South Africa 2017/18. 15th ed. Pretoria: Government
Communication and Information System (GCIS).
Tifflin, W. 2005. Agri-tourism in KwaZulu-Natal. Durban: Tourism Kwazulu-Natal Occasional
Paper No. 35.
Timothy, D.J. 2011. Cultural heritage and tourism. Bristol: Channel View Publications.
Timothy, D.J. & Boyd, S.W. 2003. Heritage tourism. England: Pearson Education.
Torres, R.M. & Momsen, J.H., eds. 2011. Introduction. (In Torres, R.M. & Momsen, J.H., eds.
Tourism and agriculture: new geographies of consumption and rural restructuring. New York:
Routledge. p. 1-9).
Trading economics. 2018. South Africa Employment Rate. https://tradingeconomics.com/
south-africa/employment-rate Date of access: 22 Jan. 2019.
Tsogo Sun. 2018. Tourism in South Africa. https://www.tsogosun.com/about-
us/associations/industry Date of access: 24 Dec. 2018.
Upton, M. 1987. African farm management. Cambridge: Cambridge University Press.
Van der Merwe, C. & Rogerson, C. 2018. The local development challenges of industrial
heritage in the developing world: Evidence from Cullinan, South Africa. GeoJournal of tourism
and geosites, 21(1):186-199.

181
Van der Merwe, J.H., Ferreira, S.L.A. & Van Niekerk, A. 2013. Resource-direct spatial
planning of agri-tourism with GIS. South African geographical journal, 95(1):16-37.
Van der Merwe, P. 2014. Introduction to game farm tourism. (In Van der Merwe, P. & du
Plessis, L., eds. Game farm and hunting tourism. Stellenbosch: Sun Press. p. 1-23).
Van der Merwe, P., Saayman, M. & Rossouw, R. 2014. The economic impact of hunting: A
regional approach. South African journal of economic and management sciences, 17(4):379-
395.
Van der Merwe, P., Saayman, M. & Rossouw, R. 2015. The economic impact of hunting in the
Limpopo Province. Journal of economic and financial sciences, 8(1):223-242.
Van Der Merwe, P., Saayman, M., Els, J. & Saayman, A. 2017. The economic significance of
lion breeding operations in the South African wildlife industry. International journal of
biodiversity and conservation, 9(11):314-322.
Van der Waal, C & Dekker, B. 2000. Game ranching in the Northern Province of South Africa.
South African journal of wildlife research, 30(4):151-156.
Van Huylenbroeck, G., Vandermeulen, V., Mettepenningen, E. & Verspecht, A. 2007.
Multifunctionality of agriculture: a review of definitions, evidence and instruments. Living
reviews in landscape research, 1(3):1-43.
Van Lill, D. 2006. Wonders of Africa. Pretoria: LAPA Publishers (Pty) Ltd.
Van Niekerk, C. 2013. The benefits of agri-tourism: two case studies in the Western Cape.
Stellenbosch: Stellenbosch University. (Thesis – PhD).
Vanhove, N. 2005. The economics of tourism destinations. Burlington: Elsevier Butterworth-
Heinemann.
Veeck, G., Che, D. & Veeck, A. 2006. America’s changing farmscape: a study of agricultural
tourism in Michigan. Professional geographer, 58(3):235-248.
Viljoen, J. & Tlabela, K. 2007. Rural tourism development in South Africa: trends and
challenges. Cape Town: HSRC Press.
Weaver, D.B. 2004. Tourism and the elusive paradigm of sustainable development. (In Lew,
A.A., Hall, C.M. & Williams, A.M. eds. A companion to tourism. Oxford: Blackwell Publishing
Ltd. p. 510-521).

182
Weaver, D.B. & Lawton, L. 2010. Tourism management. 4th ed. Milton: John Wiley & Sons
Australia, Ltd.
William, C. 2007. Research methods. Journal of business & economic research, 5(3):65-72.
World Travel and Tourism Council. 2017. Travel & Tourism Economic Impact 2017, South
Africa. London: World Travel and Tourism.
Yilmaz, K. 2013. Comparison of quantitative and qualitative research traditions:
epistemological, theoretical, and methodological differences. European journal of education,
48(2):311-325.
Zhu, X. & Lansink, A.O. 2010. Impact of CAP subsidies on technical efficiency of crop farms in
Germany, the Netherlands and Sweden. Journal of agricultural economics, 61(3):545-564.

183
APPENDIX A: STATEMENT BY LANGUAGE EDITOR
P.O. Box 955 Oudtshoorn 6620 Cell: 0784693727 E-mail: [email protected] 11 March 2019 TO WHOM IT MAY CONCERN STATEMENT REGARDING LANGUAGE EDITING OF MASTER’S THESIS Hereby I, Jacob Daniël Theunis De Bruyn STEYL (I.D. 5702225041082), a language practitioner accredited to the South African Translators' Institute (SATI), confirm that I edited the language of the following master’s thesis and submitted the edited version to the author electronically on 11 March 2019: Title: The size and scope of agri-tourism in South Africa Author: Me Christelle van Zyl Yours faithfully
J.D.T.D. STEYL PATran (SATI) SATI REGISTRATION NUMBER: 1000219

184
APPENDIX B: QUESTIONNAIRE

185

186

187

188

189