THE SITE OF AMMONIA FORMATION AND THE PROM- INENT ...
33
THE SITE OF AMMONIA FORMATION AND THE PROM- INENT R6LE OF VOMITING IN AMMONIA ELIMINATION. BY SIDNEY BLISS. (From the Biochemical Laboratory, Harvard Medical School, Boston.) (Received for publication, October 1, 1925.) INTRODUCTION. The literature dealing with ammonia as related to metabolic processes contains an immense amount of data. Such aspects of the subject as pertain to the site of ammonia formation are ade- quately reviewed up to 1921by Nash and Benedict (1). While the contributions published prior to the work of Folin and Denis (2,3) in 1912 serve as the groundwork for later and more exact ammonia determinations (particularly in blood), it is unquestionably true that present day conceptions must be based chiefly upon the work that has been done since that date. The conclusion of Nash and Benedict (1) relative to ammonia formation, namely that it has an exclusively renal origin, has found rather general confirmation and acceptance in the con- tributions that have appeared upon the subject since their pub- lication in 1921 (4, 5, 6, 7, 8, 9). It has seemed to us that their unique hypothesis of t,he renal origin of ammonia rests upon experimental data that does not include the st.udy of any other individual organs than the kidneys, and merits a more extensive investigation of the subject from t.his standpoint before one can be fully convinced t,hat so unusual and specialized a function is indeed that of the kidney alone. In brief, they found the renal vein to contain blood with two to three times the concentration of ammonia found in arterial blood. They assumedthat t,he blood of the inferior vena cava below the entrance of the renals would reflect in its ammonia content the production of this substance elsewhere in the body, and on finding 109 by guest on January 29, 2018 http://www.jbc.org/ Downloaded from
Transcript of THE SITE OF AMMONIA FORMATION AND THE PROM- INENT ...

THE SITE OF AMMONIA FORMATION AND THE PROM- INENT R6LE OF VOMITING IN AMMONIA
ELIMINATION.
BY SIDNEY BLISS.
(From the Biochemical Laboratory, Harvard Medical School, Boston.)
(Received for publication, October 1, 1925.)
INTRODUCTION.
The literature dealing with ammonia as related to metabolic processes contains an immense amount of data. Such aspects of the subject as pertain to the site of ammonia formation are ade- quately reviewed up to 1921 by Nash and Benedict (1). While the contributions published prior to the work of Folin and Denis (2,3) in 1912 serve as the groundwork for later and more exact ammonia determinations (particularly in blood), it is unquestionably true that present day conceptions must be based chiefly upon the work that has been done since that date.
The conclusion of Nash and Benedict (1) relative to ammonia formation, namely that it has an exclusively renal origin, has found rather general confirmation and acceptance in the con- tributions that have appeared upon the subject since their pub- lication in 1921 (4, 5, 6, 7, 8, 9). It has seemed to us that their unique hypothesis of t,he renal origin of ammonia rests upon experimental data that does not include the st.udy of any other individual organs than the kidneys, and merits a more extensive investigation of the subject from t.his standpoint before one can be fully convinced t,hat so unusual and specialized a function is indeed that of the kidney alone.
In brief, they found the renal vein to contain blood with two to three times the concentration of ammonia found in arterial blood. They assumed that t,he blood of the inferior vena cava below the entrance of the renals would reflect in its ammonia content the production of this substance elsewhere in the body, and on finding
109
by guest on January 29, 2018http://w
ww
.jbc.org/D
ownloaded from
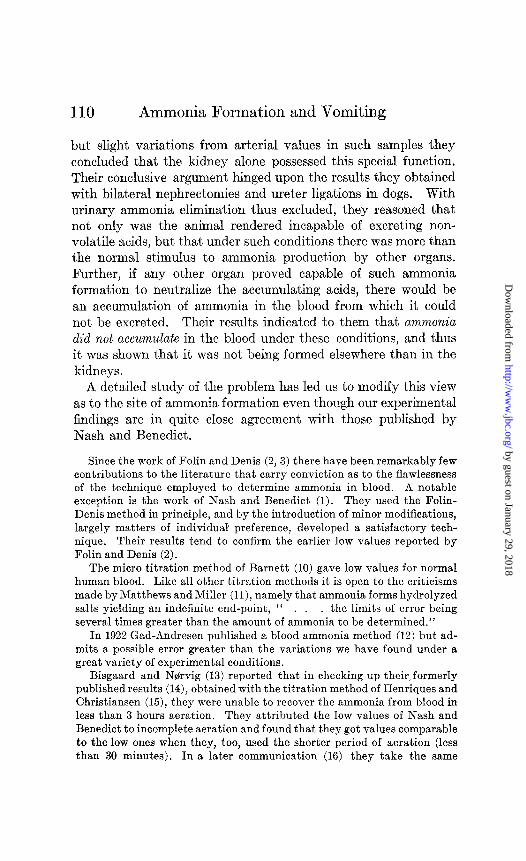
110 Ammonia Formation and Vomiting
but slight variations from arterial values in such samples they concluded that the kidney alone possessed this special function. Their conclusive argument hinged upon t.he results they obtained with bilateral nephrectomies and ureter ligations in dogs. With urinary ammonia elimination thus excluded, they reasoned that not only was the animal rendered incapable of excreting non- volatile acids, but that under such conditions there was more than the normal stimulus to ammonia production by ot’her organs. Further, if any other organ proved capable of such ammonia formation t,o neutralize the accumulating a.cids, there would be an accumulation of ammonia in the blood from which it could not be excreted. Their results indicated to them that ammonia did not accumulate in the blood under these conditions, and thus it was shown that it was not being formed elsewhere than in the kidneys.
A detailed study of the problem has led us to modify this view as to the site of ammonia formation even though our experimental findings are in quite close agreement with those published by Nash and Benedict.
Since the work of Folin and Denis (2,3) there have been remarkably few contributions to the literature that carry conviction as to the flawlessness of the technique employed to determine ammonia in blood. A notable exception is the work of Nash and Benedict (1). They used the Folin- Denis method in principle, and by the introduction of minor modifications, largely matters of individual preference, developed a satisfactory tech- nique. Their results tend to confirm the earlier low values reported by Folin and Denis (2).
The micro titration method of Barnett (10) gave low values for normal human blood. Like all other titration methods it is open to the criticisms made by Matthews and Miller (II), namely that ammonia forms hydrolyzed salts yielding an indefinite end-point, “ . . the limits of error being several times greater than the amount of ammonia to be determined.”
In 1922 Gad-Andresen published a blood ammonia method (12) but ad- mits a possible error greater than the variations we have found under a great variety of experimental conditions.
Bisgaard and Nervig (13) reported that in checking up their,formerly published results (14), obtained with the titration method of Henriques and Christiansen (15), they were unable to recover the ammonia from blood in less than 3 hours aeration. They attributed the low values of Nash and Benedict to incomplete aeration and found that they got values comparable to the low ones when they, too, used the shorter period of aeration (less than 30 minutes). In a later communication (16) they take the same
by guest on January 29, 2018http://w
ww
.jbc.org/D
ownloaded from

Sidney Bliss 111
stand. Bath the published results of Nash and Benedict (Table V) and those to be presented here show that such suspicions are without foundation.
The results reported by Russell (7) are of the same order as the low ones obtained by Folin and by Nash and Benedict. Matthews and Miller (11) call attention to the fact that their high values of 0.42 mg. were obtained with dogs, while Folin worked with cats. That the differences are not wholly ones of species is amply demonstrated by the later work of Nash and Benedict and the present one.
Henriques and his coworkers have made numerous contributions to the subject. In 1917 Henriques and Christiansen (15) published a titration method, and using it in a later communication (17) they were unable to confirm the results of Folin and Deniswho had previously shown that portal blood was much richer in ammonia than systemic blood. So far as the writer is aware, this finding is without a parallel in the literature. In 1923, by the use of the same method, Henriques (18) contradicted the findings of Nash and Benedict, being unable to detect any differences in ammonia content between arterial and venous blood of the kidney. This seems to be the only finding of this sort on a carnivorous animal. The latest article that we have seen, Henriques and Gottlieb (19), 1924, states that, after all, there is no ammonia in blood, and for that reason Nash and Benedict must be right about the renal origin of ammonia, for under these circumstances any other site is automatically eliminated. These final and revolutionary results are now obtained with a newly devised method that is again a titration method.
EXPERIMENTAL.
Technique.
The method used was essentially the same as the one devised by Folin and Denis and modified slightly by Nash andBenedict. It is the opinion of the author that this method should not be attempted in any other connection than under rigid research conditions where a great amount of time and effort may be devoted to obtaining a single result. Only by the utmost precaution at all points in the procedure can one expect to get absolute and relative values that have any significance. Ammonia-free potassium oxalate was prepared according to the directions of Folin (20) by boiling a 5 per cent solution of the salt with potassium hy- droxide, and neutralizing with oxalic acid. The salt was then recrystallized from ammonia-free water. Sodium carbonate was ignited to remove any organic impurities and our blanks showed it to be ammonia-free. Distillation from dilute sulfuric acid (an all glass apparatus was made for this) yielded water that was
by guest on January 29, 2018http://w
ww
.jbc.org/D
ownloaded from

112 Ammonia Formation and Vomiting
ammoniai-free. Hydrochloric acid for use in the acid collection tube during aeration was prepared ammonia-free by dilution of the concentrated acid from a freshly opened bottle. Caprylic alcohol was used to prevent frothing. Because we aerated for from 20 to 30 minutes instead of the 10 minute period of Nash and Benedict1 correspondingly more caprylic alcohol was neces- sary. In order to prevent the formation of a precipitate with the caprylic alcohol on Nesslerizing, the acid collection tube was aerated separately before adding Nessler solution, The contents of the acid collection tube (3 cc. of water and 3 drops of acid) were washed into a glass-stoppered 10 cc. volumetric flask, and the flask filled nearly to the mark. 0.1 cc. of undiluted Nessler solution was added to the flask, and it was then filled to the mark. Calorimetric comparison was made with the calorimeter modified
TABLE I.
Recovery of Ammonia Added to Water.
NHrN per 100 cc.
Added. Recovered. Added. Recovered.
mo. mo. nzg. mo.
0.05 0.06 0.20 0.20 0.05 0.05 0.20 0.20 0.10 0.10 0.40 0.39 0.20 0.18 0.40 0.38 0.20 0.17 0.41 0.40
as described by Folin and Denis-the unknown on one side in a calibrated 100 mm. polariscope tube, and the standard in the regular calorimeter cup, but provided with an iris diaphragm for the adjustment of the intensity of light equally on t.he two sides.
Our reagents were controlled by running complete determina- tions with water in place of the sample, and when these controls were absolutely negative or gave values less than 0.005 mg. NHa-N per 100 cc., known amounts of ammonia, as the sulfate, were next added t.o water-and quantitatively recovered. Table I gives a representative portion of the results.
Criterim of Accuracy of the Technique.-Working with a uniform
1 We place no particular emphasis on this difference in aeration time.
by guest on January 29, 2018http://w
ww
.jbc.org/D
ownloaded from

Sidney Bliss 113
technique as described, when 0.20 mg. of ammonia-nitrogen as ammonium sulfate was added to water, 0.196 mg. was recovered with a standard deviation of f 0.019. The coefficient of variation is, then, approximately 10 per cent.. Therefore, variations noted in the experiments recorded beyond this limit of accuracy must be regarded as significant.
Table II shows the quantitative recovery of ammonia added to blood.
Technique of Taking Samples of Venous Blood.
The often mentioned precaution of pointing a needle toward the organ from which a sample of venous blood is to be taken is not a certain means of getting the desired sample. With the bevel of the needle turned toward the pancreas the desired sample is probable. With the needle rotated 180 degrees we encounter the
TABLE II.
Recovery of Ammonia Added to Blood.
N&-N per 100 cc. of blood.
Original. Added. Recovered. EWX.
ml. m7. mo. mn.
0.10 0.20 0.29 0.01 0.19 0.10 0.29 0.00 0.22 0.40 0.61 0.01 0.05 0.20 0.24 0.01
possibility of getting blood from the port,al vein as well as the pancreas. The ratio of the caliber of the needle to the size of the vein is, of course, a factor here. In cases where the two are of nearly the same size this distinction becomes relatively more important. The most important precaution, and one that admits of direct control by observation, is that of making sure that the vein in question does not decrease in diameter during the time that the sample is being withdrawn. With no perceptible change in diameter of the vein and no interference with blood flow through the organ, blood is being drawn from a constant stream leaving the organ. No stasis comes in as a possible complication.
by guest on January 29, 2018http://w
ww
.jbc.org/D
ownloaded from
114 Ammonia Formation and Vomiting
Examination of the Various Organs.
A. Carnivorous Animal (Dog).2
A large series of ammonia determinations was performed on arterial and venous blood from the kidney, pancreas, spleen,
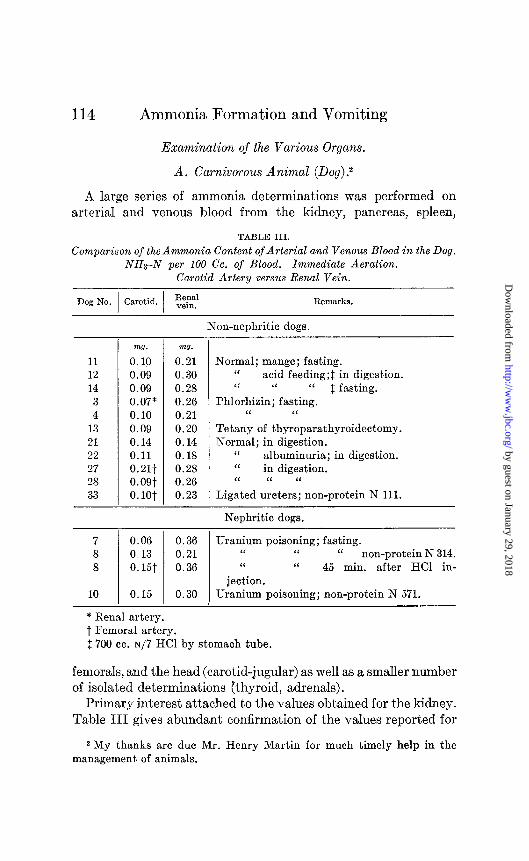
TABLE III.
Comparison of the Ammonia Content of Arterial and Venous Blood in the Dog. NHs-N per 100 Cc. of Blood. Immediate Aeration.
Carotid Artery versus Renal Vein.
Dog No. Carotid. Remarks.
11 12 14
3 4
13 21 22 27 28 33
-
-
m?. mo.
0.10 0.21 0.09 0.30 0.09 0.28 0.07* 0.26 0.10 0.21 0.09 0.20 0.14 0.14 0.11 0.18 0.21t 0.28 O.OQt 0.26 0. lot 0.23
Non-nephritic dogs.
Normal; mange; fasting. ‘I acid feeding;$ in digestion. ‘< “ “ $ fasting.
Phlorhizin; fasting. “ “
Tetany of thyroparathyroidectomy. Normal; in digestion.
“ albuminuria; in digestion. ‘I in digestion. ‘I “ “
Ligated ureters; non-protein N 111.
Nephritic dogs.
7 8 8
10
0.06 0.36 Uranium poisoning; fasting. 0.13 0.21 “ “ “ non-protein N 314. 0.15t 0.36 “ I‘ 45 min. after HCI in-
jection. 0.15 0.30 Uranium poisoning; non-protein N 571.
* Renal artery. t Femoral artery. 2 700 cc. ~/7 HCI by stomach tube.
fernorals, and the head (carotid-jugular) as well as a smaller number of isolated determinations (thyroid, adrenals).
Primary interest attached to the values obtained for the kidney. Table III gives abundant confirmation of the values reported for
2 My thanks are due Mr. Henry Martin for much timely help in the management. of animals.
by guest on January 29, 2018http://w
ww
.jbc.org/D
ownloaded from

Sidney Bliss 115
the first time by Nash and Benedict; namely, two to three times the quantity of ammonia in venous blood as compared with arterial.
Our arterial and renal vein values compare closely with those reported by Nash and Benedict. Table III gives a comparison
TABLE IV.
Comparison of the Ammonia Content of Arterial and Venous Blood in the Dog. NH@N per 100 Cc. of Blood. Immediate Aerations.
Carotid Artery versus Pancreaticoduodenal Vein.
Dog No. Carotid.
9 11 12 14 4
13 21 22 25
27 28 33
Pall- creatico- duodenal
vein.
Remarks.
VW.
0.06
0.10 0.09 0.09 0.10 0.09 0.14 0.11 0.05
0.21* 0.09* 0.10*
mg.
0.20 0.31 0.29 0.28 0.12 0.17 0.18 0.15 0.26
0.36 0.24 0.17
Non-nephritic dogs.
Normal; in digestion. “ mange; fasting. “ acid feeding; in digestion. “ “ ‘I fasting.
Phlorhizin; fasting. Tetany of thyroparathyroidectomy. Normal; in digestion.
I‘ “ “ albuminuria. “ double kidney ligation and 30 cc. N
HCI injected. One kidney ligated; in digestion. Normal; in digestion.
‘I ligated ureters; non-protein N 111.
Nephritic dogs.
7 0.06 0.31 Uranium poisoning; fasting. 8 0.13 0.21 ‘I “ “ non-protein N 314. 8 0.15 0.36 Same 35 min. after HCl injection.
10 0.15 0.29 Uranium poisoning; fasting; non-protein N 571.
*Femoral artery.
of these values. It is seen that in the normal, non-nephritic dog, the renal vein contains from two to three times the ammonia of the arterial circulation. The values here, as well as through all the other experiments, are higher for the nephritic dogs than the others.
That another organ shares equally with the kidney in ammonia-
by guest on January 29, 2018http://w
ww
.jbc.org/D
ownloaded from

116 Ammonia Formation and Vomiting
yielding capacity is shown by Table IV which compares arterial values with venous blood from the pancreaticoduodenal vein. The average values for the non-nephritics (excluding kidney ligations and ureter ligat’ions) are 0.10 mg. and 0.21 mg. for the pancreaticoduodenal vein as compared with 0.11 mg. and 0.23 mg. for the renal vein. Again, both arterial and venous values are higher in the nephritic dogs.
Because of its anatomical relationships to the pancreas and the duodenum, the pancreaticoduodenal vein is of special interest. To be sure that we were not getting portal blood, when drawing from the pancreaticoduodenal vein the expedient was tried of clamping it at its entrance into the portal. This did not prevent our getting the high values for this vein (Dog 12). In several experiments (Dogs 7, 9, and 10) the values for the pancreatico- duodenal vein were higher than the portal blood value-and this would obviously have been impossible had the taking of the sample been at fault. Values for portal blood were usually obtained, but they add nothing to what is already known of portal ammonia. A few of thevalues were remarkable for their low ammonia content, and tend to substantiate t.he view expressed by Folin and Denis (2) that high portal values are connected with decomposition in the intestine rather than a production of ammonia by the walls of the gut. Verification at autopsy of the fact that the duodenum was clean, as well as the occasional low values for portal blood when decomposition in the intestine was decreased, together with the fact that the gastric branch of the gastrosplenic vein did not alter the ammonia value of the venous ret,urn from the spleen itself-all of these facts assured us that the high values for the pancreaticoduodenal vein were due to the ammonia produced by the pancreas and not ammonia absorbed from, or produced by, the walls of the gut.
A survey of Table V indicat,es that the differences found for the other organs are reflected in those for the spleen. The average non-nephritic values here are 0.10 mg. and 0.13 mg. and the nephrit’ics show values of 0.11 and 0.18 mg. The same regularity is seen among the nephritics themselves.
It would not be expected that a small gland like the adrenal, with a central portion of nerve-like tissue, would form appreciable amounts of ammonia, and this has been found to accord with the
by guest on January 29, 2018http://w
ww
.jbc.org/D
ownloaded from

Sidney Bliss 117
facts. It seemed worth while to make a few analyses of blood entering and leaving the liver, and according to expectations the blood of the hepatic vein had an ammonia content comparable to the systemic values. In Dog 22 we found the blood of the portal vein to contain 0.20 mg. of ammonia nitrogen and of the hepatic
TABLE V.
Comparison of the Ammonia Content of Arterial and Venous Blood in the Dog. NHrN per 100 Cc. of Blood. Immediate Aerations.
Carotid Artery versus Splenic Vein.
Dog No. Carotid. 1 1 Spleniy. 1 Remarks.
Non-nephritic dogs.
9 11 12 14 3 4 4
13 19 21 22 25 28
T m0. mJ.
0.06 0.10 0.10 0.15 0.09 0.25 0.07* 0.09 0. lli 0.15 0.10 0.08 0.11 0.11 0.09 0.12 0.08 0.09 0.14 0.14 0.11 0.11 0.05 0.12 0.09* 0.24
Normal; in digestion. I‘ mange; fasting. “ acid feeding; in digestion. ‘I ‘I ‘I fasting.
Phlorhizin; fasting. “ ‘I
Same; both kidneys clamped 69 min. Tetany of thyroparathyroidectomy. Normal; fasting.
‘I in digestion. “ “ “ albuminuria.
Both kidneys ligated; 30 cc. N HCI injected. “ ‘I “ in digestion.
Nephritic dogs.
7 0.06 0.11 Uranium poisoning; fasting. 8 0.13 0.11 “ “ I‘ non-protein N
314. 10 0.15 0.31 Uranium poisoning; fasting; non-protein N
571.
* Femoral artery. t Splenic artery.
vein 0.07 mg. In Dog 13 the respective values were 0.17 mg. and 0.10 mg. The thyroid vein we found to be low in ammonia. Two analyses of gall bladder bile gave values of 0.17 mg. and 0.46 mg. per 100 cc. of bile.
Table VI is a comparison of carotid with jugular blood. Normal dogs show no difference between the ammonia content of carotid
by guest on January 29, 2018http://w
ww
.jbc.org/D
ownloaded from

118 Ammonia Formation and Vomiting
and jugular blood. Our averages are 0.10 mg. for each. Nephritic dogs present a different picture. All our averages for arterial and venous blood of nephritic dogs are higher than our averages
TABLE VI.
Comparison of the Ammonia Content of Arterial and Venous Blood in the Dog. NHs-N per 100 Cc. of Blood. Immediate Aerations.
Carotid Artery versus Jugular Vein.
Dog No. Carotid. Jugular. I I
Remarka.
Non-nephritic dogs.
5 9
11 12 14
4 4
13 19 21 22 25 26
33
mo. mo.
0.10 0.11 0.06 0.06 0.10 0.10 0.09 0.10 0.09 0.10 0.10 0.08 0.11 0.10 0.09 0.11 0.08 0.10 0.14 0.12 0.11 0.09 0.05 0.06 0.08 0.10
-
- 0.10
Normal; chloralose; fasting. “ in digestion. ‘i mange; fasting. ‘I acid feeding;* in digestion. “ “ “ * fasting.
Phlorhizin; fasting. Same 45 min. after clamping two kidneys. Tetany after thyroparathyroidectomy. Normal; fasting.
“ in digestion. ‘I “ “ albuminuria.
Double kidney ligation; 30 cc. N HCl injected. Two kidneys and pancreaticoduodenal vein
ligated. Ligated ureters; non-protein N 111.
Nephritic dogs.
7 0.06t 0.11 Uranium poisoning; fasting. 8 0.13 0.16 “ “ “ non-protein N
314.
8 0.151 0.16 Same 24 min. after HCl injection; non-protein N 314.
10 0.15 0.37 Uranium poisoning; fasting; non-protein N 571.
* 700 cc. ~/7 HCI by stomach tube. t No non-protein on this dog; doubtful if this case is comparable with
later severe cases. 1 Femoral artery.
for arterial and venous blood of non-nephritics. Looking at the individual figures we find that not only are they higher than the non-nephritic figures, but among themselves they grade up as the
by guest on January 29, 2018http://w
ww
.jbc.org/D
ownloaded from

Sidney Bliss 119
non-protein nitrogen values do-a suggestive correlation in the light of the rest of the data to be presented.
In Table VII we see that the normal values for arterial and ve- nous blood from a purely muscular region average about what was found for carotid and jugular value (excluding Dog 27 which for unaccountable reasons showed very high values; the method was believed to be adequately checked before and after the experi- ment); namely, 0.11 mg. for the femoral artery and 0.10 mg. for the femoral vein.
TABLE VII.
Comparison of the Ammonia Content of Arterial and Venous Blood in the Dog. NHrN per 100 Cc. of Blood. Immediale Aerations.
Femoral Artery versus Femoral Vein.
Dog No. Remarks.
Non-nephritic dogs.
mo. m7.
19 0.15 0.12 21 0.16 0.13 22 0.05 0.08 23 0.09 0.07 26 0.13 0.14
26 0.09 0.10 27 0.21 0.23 27 0.35 0.18 28 0.09 0.08 28 0.14 33 0.10
Normal; fasting. “ in digestion. “ albuminuria; in digestion. ‘I atrophic pancreas; in digestion. I‘ ligation of kidneys and pancreatico-
duodenal vein; mange. Same 2 hrs. later. Normal; in digestion. Same, kidneys tied 1 hr. Normal; in digestion. Same, kidneys tied 90 min. Ligated ureters; non-protein N 111.
While the increase for the arterial value appears to be small, it should be noted that bot.h Dogs 27 and 28 showed 60 per cent increases in arterial values after kidney ligation, without increases in venous values. It will be noticed that Dog 26, after kidney ligation showed a decrease in both arterial and venous values, but the pancreaticoduodenal vein was also ligated.
Nash and Benedict (p. 482) say, “The blood from the renal vein averages twice as much ammonia as does the blood from other sources. These differences are so marked as t.o admit of only one interpretation; viz., that the kidney, instead of excreting ammonia from the blood, forms the ammonia which it excretes,
by guest on January 29, 2018http://w
ww
.jbc.org/D
ownloaded from

120 Ammonia Formation and Vomiting
while at the same time it contributes a small amount of ammonia to the blood.”
Accepting this view, our results from the other organs particu- larly the pancreas, compel us to believe that the kidney is not “the center of ammonia production in the body” in the sense intended by Nash and Benedict.
There is no justification in disregarding organs such as the pancreas and spleen. Even though their venous blood eventually joins the blood of the portal vein, rich in ammonia formed during intestinal putrefaction, the ammonia formed by the pancreas, if it is ammonia formed to neutralize mineral acids in the sense that the ammonia of the renal vein’is ammonia formed to neu- tralize acids, cannot be considered as available for transformation into urea by the liver, but must be thought of as continuing on into the systemic blood stream paired with non-volatile acid. If the higher ammonia content of venous blood from the kidney admits of only one interpretation, namely ammonia formation by the kidney, the same must be said of the pancreas which gives identical values, and in varying degrees of other organs as well. Analyses of the blood from the inferior vena cava could not, of course, have revealed this situation.
It is also to be remembered that due to variations in blood flow through the organs, neither the results of Nash and Benedict nor the present ones can show the relative quantitative importance of the kidney and pancreas in terms of ammonia formation either gram for gram or organ for organ.
In their otherwise complete review of the literature, Nash and Benedict did not mention the part of the work of Horodyiiski, Salaskin, and Zaleski that most concerns the problem. These investigators not only report generally higher venous (21) than arterial values, but state, “Das Blut peripherischer Venen enhalt mehr Ammoniak, als das Arterienblut, jedoch weniger als die das Pfortaderblut. Das Verhahniss des NH3-Gehaltes in Arterien- blut zu demjenigen des Blutes peripherischer Venen betrdgt in Mittel 1:s.”
Nash and Benedict found exactly this same relation between the ammonia content of arterial and venous blood in the kidney (a point entirely missed by Horodyiiski and his coworkers) and built around it their hypothesis of the exclusively renal origin of ammonia.
by guest on January 29, 2018http://w
ww
.jbc.org/D
ownloaded from

Sidney Bliss 121
These results bring us face to face with the problem of explain- ing the failure of Nash and Benedict to observe any increases in the ammonia content of the systemic blood of doubly nephrec- tomized dogs. It would seem that they had produced the condi- tions which would demonstrate the ammonia-forming ability of the spleen and pancreas particularly. With entire con~dence in their analytical results, which opinion we have never had to alter, we sought to duplicate their experiments and results.
Repetition of the experiments of Nash and Benedict upon doubly nephrectomized dogs and dogs with double ligation of the ureters yielded the same results as reported by them, if certain conditions were fulfilled. Ether anesthesia was used throughout.
TABLE VIII.
Double nephrec tomy; bitch, weight 10.1 kilos, age 2.5 yrs.
Hrs. after operation.
Preliminary. 0.5 1.0 5.0 6.0 6.25 6.5 7.5
10.5
Per 100 cc. blood.’
NHa-N NOP
protein N.
mG7. ml.
0.13 0.22 0.18 74 0.22 88
0.18 I I
95
0.18 97 0.23 I I 114
VW.
18.2
44.4
Remarks.
Vomited meat. “ “
“ (clear).
I‘ ‘I
* All samples from the jugular vein.
Examination of Table VIII shows that after the first half hour value, there was no increase in the blood ammonia for the 10 hours that the experiment was conducted. It is significant that not only were there no increases during this 10 hour period, but that the blood ammonia values actually fell below the general level in samples taken after the dog had vomited.
Previous experience with doubly nephrectomized dogs led us to suspect that the invariable alternations of drinking and vomit- ing of such animals might furnish an explanation of the results of Nash and Benedict wherein they observed that blood ammonia values were not markedly increased.
by guest on January 29, 2018http://w
ww
.jbc.org/D
ownloaded from

122 Ammonia Formation and Vomiting
In Table IX we see in more striking fashion the validity of this relationship between the level of ammonia in the blood and its
TABLE IX.
Dog 30, male; wei;
Time.
IQ83
Oct. 20.. . . . .
Oct. 21 11.30 a.m ......... 12 m ..............
6.15 p.m.. .......
act. 22 9.00 a.m.. ....... 9.15 “ ........ 9.30 “ ........
11.30 “ ........ 3.30 p.m.. ....... 3.30-5.30 p.m.
3.58 p.m.. ....... 4.15 p.m .........
Oct. 23, night specimen .........
12.17 p.m.. . . . . . . 12.40 “ . . . . . . .
ght - IC
I
I
1
1
. 1
.
,5.75 kilt
Values per 10 cc. blood.
!2 .“, z
5 *a b
2 iz
mg. m?.
D.09
D.11 250 D.21 357
0.22 391 0.25
0.14
0.24 655
x3; age 18 months; 13 kidneys extirpated.
Totals.. . . . . . . . . . . . . . . . . . . .
Vomitus.
2
E
mg.
Lost. 6 Urine bloody.
50 122
I lost 33.1
360 63.; 8
380
110
022
56.
36.
7
6 17
_
: -
!40.
-_
1 -
* All samples from the jugular vein.
- I .-
Urine.
d E 9
F
cc.
22 4.4
17 2.6
-
62
1.1
8.1 -
Remarks.
Preliminary sample.
Operation.
Hematocrit 30. 464 cc. water
taken. Hematocrit 31.
665 cc. water taken.
Hematocrit 25.
excretion by way of the vomitus when its urinary elimination is prevented. In this experiment enough kidney tissue was removed
by guest on January 29, 2018http://w
ww
.jbc.org/D
ownloaded from

Sidney Bliss 123
to insure an acute renal death, yet prolonging the period suffi- ciently for extended observations on the relationships between blood ammonia levels and the elimination of ammonia by way of the vomitus.
Inspection of Table IX shows that Dog 30, in the 3 days follow- ing sub-total nephrectomy, voided but 62 cc. of urine containing, in all, only 8.1 mg. of ammonia nitrogen. In the same interval, 1022 cc. of vomitus carried with it an elimination of 240 mg. of ammonia nitrogen and not all the vomitus could be collected. That blood ammonia values are affected by the elimination of ammonia by way of the vomitus is again demonstrated in this experiment, when the striking reduction from 0.25 mg. to 0.14 mg. was made within a period of 20 minutes, coincident with the elimination of 63.8 mg. of ammonia nitrogen in the vomitus, vomiting being induced by forcing fluids by stomach tube.
The possibility was recognized that some of the ammonia of the vomitus might be formed secondarily from urea, and this might be particularly true of a dog having such high nitrogen retention. This point was controlled by introducing into the stomach of Dog 31 at different times, water and a 1 per cent urea solution in 5 per cent saline (NaCl as an emetic).
Dog 31; female; weight 3.6 kilos. This dog was fasted and given 865 cc. of water by stomach tube over a period of 33 minutes. 150 cc. of vomitus contained but 1.0 mg. of ammonia nitrogen. The same dog was given 300 cc. of a 1 per cent urea in 5 per cent sodium chloride solution, and 330 cc. were vomited and contained 0.55 mg. of ammonia nitrogen. On the fol- lowing day the same dog was given 1530 cc. of the same strength urea and sodium chloride solution over a period of 110 minutes. 1270 cc. were vomited and again no ammonia was produced. These results are but a few of very many at widely varying time intervals t.hat were necessary to overcome our own skepticism on the subject.
Double ureter ligation yielded results that were equally con- vincing. While Nash and Benedict state that under such condi- tions “ammonia cannot leave the organism,” we are forced to the conclusion that results from such an experimental procedure can- not be correctly interpreted without an appreciation of the fact that the dog does possess in vomit.ing a means of eliminating ammonia.
by guest on January 29, 2018http://w
ww
.jbc.org/D
ownloaded from

124 Ammonia Formation and Vomiting
Dog 33; white female poodle; age 1 year; weight 3.7 kilos. This dog was fasted 2 days before operation. On November 12, the dog was given ether
TABLE X.
Dog. 33. Ureter Ligation. The Rdle of Vomiting.
Time.
Preliminary.. . Half hr. . . . . .
1 hr.. . . . . . .
2 hrs.. . . .
3 ‘I . . . . . . . .
4 “ . . . . . . . .
5 ‘I . . . . . .
6 “ . . . . . . . .
Night. 6 to 23 hrs.. .
23 hrs.. . . . . . . 29 “ . . . . . 30 to 31 hrs..
31 hrs.. . . . . . . . 35 “ . . . . . . . . . . 36 “. . . . . . . . .
-
P
_ _
-
Values per 100 cc. blood.
gHa-N
-
\
1
P
- cc.
Non- roteir
N.
mg.
32
vater in-
take.
mg.
0.10 0.12
0.12
0.12
0.11
0.09
0.09
0.09
0.19
0.08
120
50
120
50
60
30
210
94
98
60 200 100 100 100 100
550 Ether anesthesia.
Vomitus.
cc.
36
30
20
44
(Ha-ii
mg.
2.3
3.1
1.3
5.0
Lost while taking blood.
27 4.9
No more vom LS for 17 hrs. Tem- itu perature 101’.
None.
“
270 14.6
Not collected
Remarks.
Measured water kept before the dog.
Temperature 102”.
0.10 femoral artery. 0.11 renal “ 0.23 “ vein. 0.17 Pancreaticoduodenal vein. Non-protein N 111.
at 9.00 a.m.; at 9.10 the left ureter was ligated retroperitoneally; at 9.20 the right ureter was tied and a skin flap was made exposing the jugular; at
by guest on January 29, 2018http://w
ww
.jbc.org/D
ownloaded from

Sidney Bliss 125
9.30 ether was discontinued; by 9.40 the dog was walking about the room. The peritoneal cavity was not entered, the dog suffered the very minimum of shock. This experiment was designed to determine the conditions under which double ureter ligation yielded no increases in ammonia of the blood, and also to find what relationship might exist between water intake, the vomitus, and the level of ammonia in the blood.
Table X shows very clearly why dogs with kidney function eliminated may furnish results that might, on first examination, tend to indicate that ammonia does not accumulate in blood. Samples taken 3, 4, 5, 6, 31, and 36 hours after operation are indeed normal. On careful analysis, however, it is unmistakable that only when the vomitus route of ammonia elimination is ruled out does accumulation occur. Blood ammonia values do increase with functionless kidneys, and they increase markedly as seen by reference to Table X. 23 hours after operation, when the fairly regular hourly elimination of 5 mg. of vomitus ammonia was stopped, the blood ammonia had doubled in value. Just follow- ing this accumulation, vomiting was induced by giving water by stomach tube, and after the elimination of 14.6 mg. of ammonia nitrogen the blood ammonia value was less than the preliminary sample taken before operation. These results confirm the analyses of Nash and Benedict on t.heir dogs with renal impairment-and furnish, we believe, the correct interpretation of them. That ammonia formation was indeed going on is shown by the analyses made, for which the animal was sacrificed at the end of 36 hours.
R81e of Vomiting in Ammonia Elimination.
Continued observations upon dogs with acute renal insuEiciency led us to suspect that vomiting might play an important r81e in ammonia elimination. (Vomiting is very common in uremic patients.) Definite experiments, planned to cover the point, convinced us that herein lies the explanation of the results ob- tained by Nash and Benedict and ourselves.
To see if the vomiting reflex might have its origin in the stimula- tion of the gastric mucosa by the ammonium ion, we gave a normal dog 900 mg. of ammonia nitrogen as the carbonate by stomach tube-an amount many times the values we had encountered in our experiments, and it was entirely without effect.
On the other hand, our results show that changes which closely
by guest on January 29, 2018http://w
ww
.jbc.org/D
ownloaded from

126 Ammonia Formation and Vomiting
parallel increases in the concentration of ammonia in circulating blood are accompanied by vomiting. These points were tested by the intravenous injection of ammonium carbonate, as well as by jack bean urease extracts. One experiment of each type is sufficient to illustrate the results we got in several experiments.
Dog 36; male; age 9 months; weight 6.55 kilos. With a preliminary blood ammonia value of 0.12 mg. the dog was given 2 cc. of an alcoholic extract of jack bean meal via the jugular vein; 7 and again 17 minutes later the dog vomited spontaneously. The blood ammonia value was found to be 1.04 mg., nearly nine times the preliminary value. At 35,45, and 60 minute intervals after the injection the dog vomited spontaneously-and in all 15.8 mg. were eliminated.
In another experiment, an alcoholic urease solution was tried with a dog in moderately advanced uranium nephritis. This dog’s blood ammonia value increased from 0.12 mg. to 0.75 mg., and 129.0 mg. of ammonia nitrogen were vomited.
Injection of Ammonium Carbonate Solutions.
Dog 31; female; age 9 months; weight 3.3 kilos. After preliminary trials on the previous day to determine dosage, the dog received 52.5 mg. of am- monia nitrogen as the carbonate. No change was noticed, and 15 minutes later 87.5 mg. were given. The dog appeared quiet and slightly uneasy. There was a bloody diarrhea. In 30 minutes after the first injection, 175 mg. additional were injected (all injections were into the jugular). The dog showed a partial loss of function of the hind limbs. At the end of 45 minutes 262.5 mg. were given and at once the typical convulfiions ensued.
The blood ammonia value at the height of convulsions was 0.92 mg. By giving an emetic of 5 per cent, NaCl we obtained 59 mg. of ammonia nitrogen in the vomitus. The dog made a complete recovery. This was the only dog that received these injections and failed to vomit spontaneously.
Dog 33; female; age 1 year; weight 3.8 kilos. Vomited sponOaneously and repeatedly after two injections of 175 mg. each, and 43.2 mg. of am- monia nitrogen were so recovered. This dog also made a good recovery.
Vomiting in Nephritis.
The regular drinking and vomiting of our dogs poisoned with uranium (and also those with bot.h kidneys removed) was a com-
by guest on January 29, 2018http://w
ww
.jbc.org/D
ownloaded from

Sidney Bliss 127
mon observation. The data on one of them are sufficient to
illustrate the amounts of ammonia so eliminated.
Dog 35; male; age 2.5 years; weight 20.7 kilos. On the 3rd day after the subcutaneous injection of 4 mg. of uranium nitrate per kilo, the dog had a blood non-protein nitrogen value of 272 mg. Anuria was nearly complete; the overnight specimen was but 5 cc. The dog was given 230 cc. of a 5 per cent NaCl solution, and in 4 minutes vomited 390 cc. of greenish-yellow, turbid material, very strongly acid, containing 82.1 mg. of ammonia nitro- gen. Additional vomitus was not collected. Occasionally samples of vomitus were thus colored as if with bile, but more often they were entirely colorless. Our analyses of gall bladder bile show that the very low ammonia content of that fluid cannot explain such a result as this, even when bile is regurgitated into the stomach. The extremely clean character of ‘the sur- face of the duodenum in these dogs which by this time have voluntarily fasted for days precludes all possibility of ammonia coming from this source even if it were not for the experiments on blood ammonia levels after vomiting, which demonstrate clearly the role of vomiting in these cases.
On the 4th day, with no urine, vomitus, or feces during the night, the dog passed only a few drops of urine. It was weak but walked about when encouraged to do so. The non-protein nitrogen value was 349. From 9 a.m. until 1.35 p.m. it was given 2200 cc. of water by stomach tube, and 1500 cc. of vomitus, acid in reaction, were collected, containing 300 mg. of ammonia nitrogen. At 1.40 p.m. the non-protein nitrogen value was again 349.
At 3.30 p.m. the dog suffered violent clonic spasms, the teeth chattered, limbs became rigid, pupils dilated, and respiration was labored. The symptoms died away, and the animal lapsed into a semiconscious stupor.
On the 5th day the dog could only stand when propped on his feet. The non-protein nitrogen value was 427 mg. Between 10.31 and 11.04 a.m. the dog was given 3000 cc. of water and 2900 cc. of vomitus were collected. The ammonia nitrogen content of the vomitus was 263 mg. At 11.10 a.m. the non-protein nitrogen value of the blood was again 427. The dog was found dead on the morning of the 6th day.
We believe that the evidence presented is sufficient to indicate that in vomiting the dog possesses a hitherto unsuspected means of elimination of considerable theoretical importance in the inter- pretation of results obtained especially with dogs with impaired kidney funct,ion.
XigniJicance of Arterial Values.
It seems highly probable that most importance must, after all, be attached to arterial rather than venous levels of blood ammonia. Table VI gives the carotid values for a representative
by guest on January 29, 2018http://w
ww
.jbc.org/D
ownloaded from

Ammonia Formation and Vomiting
portion of our dogs. In non-nephritics the values are generally lower, and in the nephritics (due to acidosis) higher. This would necessarily be the case if the ammonia of arterial blood is there on its way to the kidneys for excret,ion.
Starting with another purpose in view, wea gave Dog 66 (weight 11.1 kilos) small quantities of sodium bicarbonate by stomach tube at frequent intervals during the day and gave it a bone to eat during the night. In this manner we were able to insure a nearly constant plethora of inorganic fixed base together with a very high protein intake (meat). The day before operation the record was:
?a?. Total urinary nitrogen....................................27,215 Ammonia nitrogen........................................ 89
NH,-N 1 ~ * -- Total N rat1o - 306
Operating under amytal anesthesia we obtained the following values for the ammonia content of the blood:
Renal artery.. . . . . . . . . . . . . . . . . . . . . . . . . . .0.02 mg. per 100 cc. “ vein.. . . . . . . . . . . . . . . . . . . . . . . . . . . . . . . . . . 0.08 “ ‘[ 100 “
The urine was constantly alkaline for days previous to the operation, and complete ammonia analyses showed the dog to have consistent low ratios of ammonia nitrogen to total nitrogen. The urine secreted during the opera- tive procedures was still alkaline, and we controlled the conditions under which we operated by the following analyses of the urine secreted during that time:
Total urinary nitrogen.. . . . . . . . . . . . . . . . . . . . . . . . . . . . . . 13;; Ammonia nitrogen....................................... 1.3
NH,N 1 Total N ratio = -
1017
There is no question but that here we have a complete picture of what happens to the concentrations of circulating ammonia when there is no chemical metabolic stimulus for its formation in the tissues. The arterial value found was the lowest one that we had then encountered in any carnivorous (or herbivorous) animal. If it is true that the kidney forms nearly all the ammonia for direct excretion, arterial levels could not thus reflect the effects of alkali administration. If, however, the various organs form
8 My thanks are tendered Mr. Gustav Lindskog for his careful work in helping with this set of experiments.
by guest on January 29, 2018http://w
ww
.jbc.org/D
ownloaded from

Sidney Bliss 129
ammonia which is later excreted from arterial blood, alkali adminis- tration should be reflected in a lowering of the level of ammonia in arterial and in renal venous blood. The above results show this to be the case, as do the following additional ones.
Dog 68 was kept on a low protein diet and no alkali was given. The daily values in the foreperiod were entirely consistent and regular, and on the day preceding the operation were:
Total urinary nitrogen.. . . . . . . . . . . . . . . . . . . . . . . . . . l%I Ammonia nitrogen.......................................... 184
NHrN . 1 Total N ratio = 915
At operation the blood showed the following ammonia values: Renal artery.. . . . . . . . . . . . . . . . . . . . . . .0.08 mg. per 100 cc.
“ vein.. . . . . . . . . . . . . . . . . . . . . . . . . . ..t.... 0.19 “ “ 100 “
Though no attempt was made to lower the ammonia exeretion- and the ratio of 9.5 is indeed very high-the actual amount (184 mg.) was relatively small for a 17 kilo dog, and was but the natural consequence of a diet low in protein. Here we see a moderately decreased call for ammonia to handle acids-and a slight decrease in the value for renal venous blood.
Dog 71. Kept on a ZOUJ protein diet with alkali administration. Pre- operative day showed:
Total urinary nitrogen.. . . . . . . . . . . . . . . . . . . 3%8 Ammonianitrogen......................................... 14
NH&N ~. 1 Total N ratio = 276
And, at operation the blood ammonia values were: Renal artery.. . . . . . . . . . . . . . . . . . . .0.026 mg. per 100 cc.
“ vein.. . . . . . . . . . . . . . . . . . . . . . . . . . . . 0.129 “ “ 100 “
Here again we see the effects of alkali administration and very low ammonia excretion in (1) a very low level of arterial ammonia and (2) a greatly reduced level of ammonia in venous blood.
Further evidence may be adduced from the experiments of Nash and Benedict on alkali injection. They reported that dogs thus treated and showing an alkaline urine had lower levels of ammonia in renal venous blood than did their normals, and their values of 0.13, 0.16, and 0.18 mg. compare exceptionally well with ours of 0.08, 0.13, and 0.19 mg. per 100 cc. of blood. Their own
by guest on January 29, 2018http://w
ww
.jbc.org/D
ownloaded from

130 Ammonia Formation and Vomiting
conclusion is that, “There is some evidence of an effect on the ammonia content of the blood of the renal vein, but further experi- ments would be required to warrant any definite conclusion here.” It is perhaps almost needless to add that the low arterial and venous blood ammonia values in herbivorous animals are further confirmation of this view.
B. Herbivorous Animals (Rabbit, Goat).
The goat and t,he rabbit offer us the chance of comparing herbivorous animals with the dog with reference to ammonia formation. These animals, living on diets of green grass, carrots, and cabbage have an alkaline urine of very low ammonia content. Three successive 24 hour collections from Goat 1 gave ammonia nitrogen values of 10.2, 11.2, and 12.8 mg. respectively (Table XI).
Each voiding of urine was collected from the animal directly while being led outside, or else the sample was collected from the cage as soon as voided. Fractional analyses were made imme- diately, so that the question of gain or loss of ammonia did not arise.
In two rabbits and one goat we were able to compare the ammonia content of the blood of the renal vein with t.hat of arterial blood. Without exception we found the two values to be essen- tially identical, as contrasted with the marked differences obtained in the carnivora. One rabbit showed:
Renal artery.. . . . . . . . . . . . . . . . . . . . . . . . O.lOmg.NHI-NperlOOcc. “ vein.. . . . . . . . . . . . . . . . . . . . . . . . . 0.08 “ NHrN “ 100 “
and 40 minutes later, from the other kidney: Aorta. . . . . . . . . . . . . . . . . . . . . . . . . . . . .0.09 mg. NHa-N per 100 cc. Renal vein.. . . . . . . . . . . . . . . . . . . . . . . .0.09 “ “ “ 100 “
These particular absolute values are not offered as correct for the normal rabbit as this one gave birth to one young rabbit during the anesthesia and seven more were removed from the uterus. She was evidently just at term.
From another non-pregnant, female rabbit we got the following results:
Aorta.. . . . . . . . . . . . . . . . . . . . . . . . . . . . . .0.06 mg. NH3-N per 100 cc. Renal vein.. . . . . . . . . . . . . . . . . . . . . . .0.07 “ “ “ 100 “
by guest on January 29, 2018http://w
ww
.jbc.org/D
ownloaded from

Sidney Bliss
From the goat we obtained the following results:
Left kidney (with asepsis) : Arterial (carotid). . . . . . . . . . . . . . .0.05 mg. NHbN per 100 cc. Renalvein... . . . . . . . . . . . . . . . . . . . 0.05 “ “ “ 100 “
TABLE XI.
Urine of Goat 1.
VOlUUlC3. Reaction (litmus).
cc.
80 40 15 95 35
270 80 40 25 37
168 135 148
75 70
250 75 60 60
210 250 890
56 120
80 125 85
127 137 122 138 202
50 240
47
Acid. “ “ ‘I
Neutral. Alkaline.
“ “
Neutral. Alkaline.
“ “ “ “
Acid. Alkaline.
“
Neutral. “ “ “
Alkaline. “ ‘I “
Neutral. ‘I
Acid. “ “ “ “ “
Neutral. “
131
AUlIllOIlia nitrogen.
mo.
72.7 15.0 47.0
1.61 6.4
m0.
134.7
1.3 10.18
2.48 1.51 1.89 0.38 1.90 4.20
11.22
0.98 0.36
3.45 8.01 0.43 0.49 0.42 1.00 1.17
72.97 86.7 19.0 89.6
136.9 13.1 33.6
4.3
12.80
72.97 86.7
108.6 Incomplete.
“ “
Postmortem (bladder).
4mmonia nitrogen, 24 hr. amounts.
by guest on January 29, 2018http://w
ww
.jbc.org/D
ownloaded from
132 Ammonia Formation and Vomiting
and 3 days later we found: Renal artery.. . . . . . . . .0.046 mg. NHa-N per 100 cc.
“ vein . . . . . . . . . . . . . . . . . . . .0.068 “ “ “ 100 “
At the same time we obtained from the goat:
Femoral artery.. . . . . . . . . . .0.048 mg. NHTN per 100 cc. ‘I vein................ . . . .0:049 “ “ “ 100 “
Jugular “ . . . . . . . . . . . . . . . . . . . . .0.053 “ “ “ 100 “
While this work was in progress, Loeb, Atchley, and E. M. Benedict (6) published an article showing the arterial and venous blood of the kidney of the rabbit to have substantially the same concentrations of ammonia.
Evidence That Increases in Blood Ammonia Values Do Occur in Nephritis.
It is not surprising that the literature is in utter confusion with respect to blood ammonia values in pathological states. It is doubtful if t’he method should ever be applied in the average clinical investigation. One finds such absolutely unreasonable values reported for normal blood (Hara (22)) that the variations in pathological conditions are not convincing.
Gherardini (23) states that the ammonia content of blood is not increased in many forms of nephritis. Rabinowitch, in investigating a considerable number of cases of nephritis and diabetes in a study of the origin of urinary ammonia (8) found no increases in blood ammonia in any of his cases. Others have reported increases of a bizarre nature.
Our animal experiments, after months and years of painstaking repetition, carried the conviction that blood ammonia increases in human nephritis might well be missed through the failure to consider the role of vomiting in ammonia elimination in the way that it had been ignored experimentally. Through the courtesy of Dr. E. P. Richardson and the residents and house officers of the Massachusetts General Hospital this point was studied in detail.
The method of making the clinical observations is of the greatest im- portance and justifies detailed description. When a blood ammonia deter- mination was to be made on a patient, a special nurse was kept with the patient to record the time of vomiting, if any, and the separate collections of the vomited material was thus insured. The author prepared fresh re-
by guest on January 29, 2018http://w
ww
.jbc.org/D
ownloaded from

Sidney Bliss
agents and ran a control on the reagents immediately before the blood was drawn from the patient. It was so arranged that the author’s blood was drawn as a normal control a few minutes before he took the blood from the patient and in all cases his own ammonia-free potassium oxalate was used
TABLE XII.
Vomitus and Blood Ammonia Values in Nephritis.
uric , acid.
- nw.
16.6 26.6
4.3
8.0
.- Sub- ject.
Non- R.3mZ3rkS. Vol- ume. I VHFN P ~roteir
I nitro- Fny,$: NH.4 I gen. .- -- . -
cc. w?. mg. mg. mg.
A 126 A .cid. 80 I let. 18 86 35 158 0.29 ‘( 19
227 “ 23 Died. “ 28
B 208 14.5 0.10 Just after vomiting, Jan. 26.
120 “ 70 Jan. 29, taken home to die.
C 470 “ 145 149 4.2 0.16 Oct. 21, 2-7 p.m., 720 200 overnight up to
1370 7 p.m., Oct. 22. 520 “ 226 Oct. 24, 18 hrs. end-
ing 7 a.m. 850 ‘I 238 6 hrs. ending 1 p.m. 240 “ 125 5 “ “ 6 p.m.
143 4.2 0.17 Oct. 25 Period of convalescence.
1 105 1 4.6 1 3.3 0.10 Nov. 10 No vomiting-improvement. 6 mos. interval-then readmissj ior 1.
67 “ 971 I I I Apr. 6 Fatal termination.
- -
Subject A.-Mrs. B. K. B. (252772), age 33, chronic nephritis, edema. Food had been refused for over a week preceding the data.
Subject B.-Mr. C. H. (267535), age 31, chronic nephritis. Jan. 29, patient had been vomiting repeatedly. Sample of 120 cc. represented but a short period of accumulation.
Subject C.-Mr. G. DeM. (251074). This was a very interesting case and one that afforded a long period of careful study. He was intelligent and cooperative. One tuberculous kidney had been removed at least a year
8.8
-
previous-the remaining kidney was tuberculous (autopsy) and its failure to function precipitated uremia on various occasions. There is only space for a small amount of the data that were obtained on this case.
by guest on January 29, 2018http://w
ww
.jbc.org/D
ownloaded from

134 Ammonia Formation and Vomiting
to prevent clotting, and the blood was taken in his own syringes. Along- side of the normal control, the patient’s blood was introduced into the aeration apparatus, previously arranged so as to be ready for instant aeration. It is almost impossible to overemphasize the need for absolutely convincing control work in these determinations. A single determination invariably used up half a day’s time.
A study of cases in the hospital other than nephritics showed that vomitus obtained spontaneously as well as material from gastric lavage contained but negligible quantities of ammonia. (It is specifically emphasized that very minute amounts of ammonia nitrogen in vomitus of controls have no significance, for our vomiting nephritics put out as much as several hundred mg. in a few hours.) This was in accord with the large number of observations we had made on experimental animals. Our results withvomiting nephritics gave a very clear-cut picture (Table XII).
Thus, our human cases show a picture identical with that found in experimental animals-increases in blood ammonia values when taken before vomiting; the vomiting of quantities of ammonia that are comparable to what might be eliminated in the urine for the same period; and a return to normal ranges of values with convalescence. (It did not seem to be in the interest of t.he patient to stop alkali administrations, and for that reason ammonia determinations on the urine would have been valueless, quite aside from the difficulties encountered in incontinence.)
It seems impossible to escape the conviction that our animal experimentation ran a course of events very similar to what we saw in the carefully studied patient.
It must be admitted that the problem of ammonia formation admits of clearer, more direct, and hence more convincing proof in experiments dealing with concentrations found in circulating blood than in any other type of data. Clinical material by virtue of its very abundance lends itself to much speculation. It can be little more than that as long as there are the vast array of factors that may and must come into play between ammonia formation and its final excretion, to say nothing of the difficulties that are inherent in the hospital management of routine deter- minations that are done on a large scale. Fiske (24) has reviewed a number of factors involved in interpreting the excretion of ammonia, some of which cannot possibly be controlled in hospitals, if indeed in any but the most heroic humans.
by guest on January 29, 2018http://w
ww
.jbc.org/D
ownloaded from

Sidney Bliss 135
DISCUSSION.
The formation of ammonia for the neutralization of acids is not the function of any particular tissue-either in t,he normal or the nephritic dog. Our findings convince us that just as acid production goes on throughout the body, so does ammonia forma- tion accompany it.
The important conclusion of Nash and Benedict is “that the kidneys themselves must produce the urinary ammonia.” They reached this conclusion as the result of finding more ammonia in the renal vein than in the systemic circulation, and found con- clusive evidence for this view in their experiments with phlorhizin- poisoned dogs, and dogs that survived double nephrectomy, and in some cases double ureter ligation, for from 44 to 71 hours.
While, at. first glance, this might seem to furnish the necessary proof for their contention, we believe that their results, as well as ours, may be interpreted in such a way as to throw considerable doubt upon the conclusions they have drawn from them. Both their results and ours agree in that the renal vein contains more ammonia than the renal artery, and this certainly means that the kidney forms some ammonia. But, a study of their experiments with double nephrectomy fails to disclose in them conclusive proof that this ammonia-forming function is necessarily limited to the kidneys.4
Whoever has worked with doubly nephrectomized dogs must have been impressed with the fact that they continually drink and vomit, and, in experiments lasting from 2 to 3 days it is entirely possible, and indeed now proven, that ammonia excretion by way of the vomitus keeps pace with ammonia formation and may result in an equilibrium whereby the level of ammonia in the blood remains at its normal figure. That this interpretation of the results is the correct one is further borne out by the fact that in acute experiments where vomiting does not occur and ammonia elimination is really excluded, double nephrectomy is accompanied by the significant increases in blood ammonia seen in Table VIII, where the preliminary value of 0.13 mg. increased
4 At the present time experiments are under way which have been de- signed to yield information as to the relative quantitative importance of the kidney and other ammonia-forming organs.
by guest on January 29, 2018http://w
ww
.jbc.org/D
ownloaded from

136 Ammonia Formation and Vomiting
to 0.23 mg. when vomiting stopped. In Table IX the preliminary value of 0.09 mg. was nearly trebled, reaching the value of 0.25 mg. 6 hours after the last previous vomiting. That vomiting is able to keep the level of ammonia in the blood at the normal figure is shown in Table X where the twice normal value of 0.19 mg. was reduced by vomiting to 0.08 mg.
Our results with phlorhizin-poisoned dogs are in agreement with those obtained by Nash and Benedict, but we see no argu- ment here for localizing ammonia formation in the kidney. The plasma CC?2 values of 38.1 to 54.1 reported by them, in spite of high urinary ammonia values, cannot be interpreted as indicating a severe phlorhizin acidosis, and the normal values obtained by them and us are quite to be expected in the absence of a marked acidosis.
The extra-renal formation of ammonia is not difficult to demon- strate. Dog 27, after ligation of both kidneys, increased the arterial value from 0.21 to 0.35 mg. aft,er 1 hour of ligation, while Dog 28 showed t’he same proportional increase from 0.09 mg. to 0.14 mg. after 90 minutes of ligation. It is interesting in this experiment to note that the only time that the spleen appears to to be as important a contributor of ammonia as the ot.her organs in question is after the ligation of the left and right renals and the pancreaticoduodenal vein.
Surveying the results obtained with blood from various types of tissue we notice that the net effect of having blood enter and leave muscular tissue is for it to decrease, even if but slightly, in ammonia content. These effects are more pronounced when there is arterial accumulation of ammonia. Glandular tissue produces more ammonia than other tissues. The spleen functions but weakly as compared with the pancreas and kidney, though there is the suggestion that it may assist in ammonia formation when the stress of circumstances warrants it.
The carotid and jugular values, measuring the net effect of having blood enter and leave both muscular and glandular tissue, reveals an even balance until acidosis calls forth more ammonia from venous blood.
Nash and Benedict say that, “If ammonia were formed in the organism in appreciable amount,8 elsewhere than in the kidney, we should expect the injection of acid into the circulation to be
by guest on January 29, 2018http://w
ww
.jbc.org/D
ownloaded from

Sidney Bliss 137
followed by a definite increase in the ammonia of the general systemic blood.” We have shown that a physiological influx of acids does increase the concentration of ammonia in the blood when means are devised for showing it. Nash and Benedict were unable to demonstrate this, and the violent dyspnea reported in their animals when acids were injected reminds us that such violent breathing causes such a great removal of acid from the blood that it is possible by this means to change the reaction of the urine from acid to alkaline, and t,his condition would not be reflected in their measurement of the CC&-combining power of the blood which they used as a measure of their acidosis.
The experiments with ammonium salts indeed raise the question as to whether further increases in acids produce further increases in the level of ammonia in the blood after it reaches a certain value, somewhere below the concentration at which its toxic effect becomes pronounced. Certainly acidosis is more readily tolerated than are excessive concentrations of ammonia. Were there no chemical reason for supposing that ammonia accumulation in the blood must find a low maximum limit, the pharmacological action of the ammonium ion is such as to prohibit its undue accumulation in the blood. Ammonium salts are well known to be toxic. How- ever excessive the formation of acids or however urgent the call for alkalies to neutralize them, the competition of bases for the acid radicles will be determined by the relative concentrations and strengths of the bases present. Any protective device that operates to keep down excessive accumulations of the toxic ammonium ions will, in just that measure, call more and more upon the fixed bases of the body-with a consequent diminution of the alkaline reserve. If ammonia formation, in itself, were an adequate means of neutralizing acids in severe acidosis there would be no reduction of the alkaline reserve of the blood and tissues.
Our experiments with dogs in the acidosis of an extreme nephritis give a more rational picture of the changes that occur in this condition.
Relative to ammonia formation it may be maintained that the ammonia content of the renal vein merely represents the escape of ammonia from the kidney and that this portion may be only an insignificant part of the whole amount formed, the major portion
by guest on January 29, 2018http://w
ww
.jbc.org/D
ownloaded from

138 Ammonia Formation and Vomiting
of it going directly into the urine. This assumption, however, would be difficult to prove. In fact our evidence of accumulation of ammonia in the blood seems to admit of the interpretation that ammonia, like other nitrogenous constituents of the blood, finds its way int.0 the urine in a manner similar to that of other metabolic wastes. Dog 30 furnishes evidence in support of this idea. This dog, with an acute renal insufficiency, eliminated only 62 cc. of urine in 3 days, but kidney function, as shown by the minimal urine output and the high non-protein nitrogen values of 250,357, 391, and 655 mg., was so deficient that in 3 days but 8.1 mg. of ammonia nitrogen were eliminated in the urine as compared with 240.1 mg. eliminated in the vomitus.
By calculations based on the probable rate of blood flow through the kidneys, Nash and Benedict have attempted to show that pathological increases in urinary ammonia are not explainable in the light of such data. Since 1921 the met,hods for determining the rate of blood flow have shown (25) that under various condi- tions the rate of blood flow is increased many more times than is necessary to account for the elimination of ammonia from arterial blood values. Even if the subject of the rate of blood flow differs in no respect from what it was in 1921, there is no doubt but that the clear-cut results obtainable from blood and vomitus analyses are more convincing in nature than such uncertain calculations from data that were not intended to be capable of serving as the basis for the drawing of such fine distinctions.
In comparing the dog and the goat, the most striking difference is in the absolute values for blood ammonia. The dog with a strongly acid urine carries just double the concentration of ammonia in his systemic circulation that we find for the goat. The goat normally secretes an alkaline urine with but traces of ammonia.
With a blood ammonia method that is continually controlled, and where blanks continually show less than 0.005 mg. of ammonia nitrogen per 100 cc., we believe that the difference between 0.05 mg. in the goat and 0.10 mg. in the dog is a real one. Our results suggest that under conditions of normal kidney function, ammonia excretion from the blood is accomplished with an extraordinary degree of completeness and facility, and that the ammonia in systemic blood represents what is formed throughout the body for
by guest on January 29, 2018http://w
ww
.jbc.org/D
ownloaded from

Sidney Bliss 139
acid neutralization, and is there on its way to the kidney for excretion. Benedict first called attention to the urinary elimina- tion of uric acid by the Dalmatian dog. This excretion of large quantities of uric acid from but traces in the blood has a striking resemblance to the conditions obtaining with ammonia.
SUMMARY.
1. Low absolute values for blood ammonia confirm Folin and Denis and Nash and Benedict.
2. Nash and Benedict’s values for the ammonia content of renal venous blood are confirmed.
3. The author disagrees with Nash and Benedict’s interpretation of the kidney as the “center of ammonia production in the body.”
4. Evidence is reported to show that ammonia formation is a generalized tissue phenomenon.
5. Attention is directed to the important r81e of vomiting in the elimination of ammonia.
6. The parallelism of human pathology with the results of animal experimentation has been demonstrated.
7. Conclusions are drawn relative to the mode of excreting ammonia.
8. There is suggested a shift of emphasis from the ammonia content of venous blood to that of arterial.
9. It is shown that blood ammonia values do increase in nephritis.
This investigation was carried out under the closest cooperation with Professor Folin. His share in whatever may be of value is very large. The author claims responsibility for whatever mis- takes there may be. I want to thank Professor Folin for his generous help and criticism and advice throughout the investi- gation.
BIBLIOGRAPHY.
1. Nash, T. P., Jr., and Benedict, S. R., J. Biol. Chem., 1921, xlviii, 463. 2. Folin, O., and Denis, W., J. Biol. Chem., 1912, xi, 161. 3. Folin, O., and Denis, W., J. Biol. Chem., 1912, xi, 527. 4. Myers, V. C., Physiol. Rev,, 1924, iv, 274. 5. Hendrix, B. M., and Bodansky, M., J. Biol. Chem., 1924, lx, 657.
by guest on January 29, 2018http://w
ww
.jbc.org/D
ownloaded from

140 Ammonia Formation and Vomiting
6. Loeb, R. F., Atchley, D. W., and Benedict, E. M., J. Biol. Chem., 1924, lx, 491.
7. Russell, D. S., Biochem. J., 1923, xvii, 72. 8. Rabinowitch, I. M., Canad. &led. Assn. J., 1923, xiii, 742. 9. Rabinowitch, I. M., Arch. Int. Med., 1924, xxxiii, 394.
10. Bnmett. G. D., J. Biol. Chem., 1917, xxix, 459. 11. Matthews, S. A., andMiller, E. M., J. Biol. Chem., 1913, xv, 87. 12. Gad-Andresen, K. L., J. Biol. Chem., 1922, li, 367. 13. Bisgaard, A., and N$rvig, J., Comp. rend. Xoc. biol., 1923, Ixxxviii, 813. 14. Bisgaard, A., and Nervig, J., Comp. rend. Sot. biol., 1921, Ixxxiv, 159. 15. Henriques, V., and Christiansen, E., Biochem. Z., 1917, lxxviii, 165. 16. Bisgaard, -4., and Norvig, J., Hospital&., 1923, Ixvi, 297; abstracted in
J. Am. Med. Assn., 1923, lxxxi, 791. 17. Henriques, V., and Christiansen, E., Biochem. Z., 1917, lxxx, 297. 1s. Henriques, V., 2. physiol. Chem., 1923, 39. cxxx, 19. Henriques, V., and Gottlieb, E., 2. physiol. Chem., 1924, cxxxviii, 254. 20. Folin, O., J. Biol. Chem., 1919, xxxix, 259. 21. Horodyiiski, W., Salaskin, S., and Zaleski, J., 2. physiol. Chem., 1902,
xxxv, 246. 22. Hara, M., J. Biochem. (Jap.), 1923, ii, 473. 23. Gherardini, G., Arch. SC. biol., 1923, iv, 213. 24. Fiske, C. H., J. BioZ. Chem., 1925, Ixiii, 309. 25. Field, H., Bock, A. V., Gildea, E., and Lathrop, F. L., J. Clin. Inu.,
1924, i, 65. by guest on January 29, 2018http://w
ww
.jbc.org/D
ownloaded from

Sidney BlissELIMINATION
VOMITING IN AMMONIAAND THE PROMINENT RÔLE OF
THE SITE OF AMMONIA FORMATION
1926, 67:109-140.J. Biol. Chem.
http://www.jbc.org/content/67/1/109.citation
Access the most updated version of this article at
Alerts:
When a correction for this article is posted•
When this article is cited•
alerts to choose from all of JBC's e-mailClick here
ml#ref-list-1
http://www.jbc.org/content/67/1/109.citation.full.htaccessed free atThis article cites 0 references, 0 of which can be by guest on January 29, 2018
http://ww
w.jbc.org/
Dow
nloaded from