The Simons Observatory: Overview of data acquisition ...
19
The Simons Observatory: Overview of data acquisition, control, monitoring, and computer infrastructure Brian J. Koopman a , Jack Lashner b , Lauren J. Saunders a , Matthew Hasselfield c , Tanay Bhandarkar d , Sanah Bhimani a , Steve K. Choi e,f , Cody J. Duell f , Nicholas Galitzki g , Kathleen Harrington h , Adam D. Hincks i , Shuay-Pwu Patty Ho j , Laura Newburgh a , Christian L. Reichardt k , Joseph Seibert g , Jacob Spisak g , Benjamin Westbrook l , Zhilei Xu d,m , and Ningfeng Zhu d a Department of Physics, Yale University, New Haven, CT 06520, USA b University of Southern California, Los Angeles, CA 90007, USA c Center for Computational Astrophysics, Flatiron Institute, New York, NY 10010, USA d Department of Physics and Astronomy, University of Pennsylvania, Philadelphia, PA 19104, USA e Department of Astronomy, Cornell University, Ithaca, NY 14853, USA f Department of Physics, Cornell University, Ithaca, NY 14853, USA g Department of Physics, University of California, San Diego, CA 92093-0424, USA h Department of Astronomy and Astrophysics, University of Chicago, 5640 South Ellis Avenue, Chicago, IL 60637, USA i Department of Astronomy & Astrophysics, University of Toronto, 50 St. George St., Toronto ON M5S 3H4, Canada j Department of Physics, Stanford University, CA 94305, USA k School of Physics, University of Melbourne, Parkville, VIC 3010, Australia l Department of Physics, University of California, Berkeley, CA 94720, USA m MIT Kavli Institute, Massachusetts Institute of Technology, Cambridge, MA 02139, USA ABSTRACT The Simons Observatory (SO) is an upcoming polarized cosmic microwave background (CMB) survey experi- ment with three small-aperture telescopes and one large-aperture telescope that will observe from the Atacama Desert in Chile. In total, SO will field over 60,000 transition-edge sensor (TES) bolometers in six spectral bands centered between 27 and 280 GHz to achieve the sensitivity necessary to measure or constrain numerous cosmo- logical parameters, including the tensor-to-scalar ratio, effective number of relativistic species, and sum of the neutrino masses. The SO scientific goals require coordination and control of the hardware distributed among the four telescopes on site. To meet this need, we have designed and built an open-sourced platform for dis- tributed system management, called the Observatory Control System (ocs). This control system interfaces with all subsystems including the telescope control units, the microwave multiplexing readout electronics, and the cryogenic thermometry. We have also developed a system for live monitoring of housekeeping data and alerting, both of which are critical for remote observation. We take advantage of existing open source projects, such as crossbar.io for RPC and PubSub, twisted for asynchronous events, Grafana for online remote monitoring, and docker for containerization. We provide an overview of the SO software and computer infrastructure, in- cluding the integration of SO-developed code with open source resources and lessons learned while testing at SO labs developing hardware systems as we prepare for deployment. Keywords: Cosmic Microwave Background, Observatory Control System, Simons Observatory, control software, monitoring, data acquisition Corresponding author: [email protected] arXiv:2012.10345v1 [astro-ph.IM] 18 Dec 2020
Transcript of The Simons Observatory: Overview of data acquisition ...

The Simons Observatory: Overview of data acquisition,control, monitoring, and computer infrastructure
Brian J. Koopmana, Jack Lashnerb, Lauren J. Saundersa, Matthew Hasselfieldc,Tanay Bhandarkard, Sanah Bhimania, Steve K. Choie,f, Cody J. Duellf, Nicholas Galitzkig,
Kathleen Harringtonh, Adam D. Hincksi, Shuay-Pwu Patty Hoj, Laura Newburgha,Christian L. Reichardtk, Joseph Seibertg, Jacob Spisakg, Benjamin Westbrookl, Zhilei Xud,m,
and Ningfeng Zhud
aDepartment of Physics, Yale University, New Haven, CT 06520, USAbUniversity of Southern California, Los Angeles, CA 90007, USA
cCenter for Computational Astrophysics, Flatiron Institute, New York, NY 10010, USAdDepartment of Physics and Astronomy, University of Pennsylvania, Philadelphia, PA 19104,
USAeDepartment of Astronomy, Cornell University, Ithaca, NY 14853, USA
fDepartment of Physics, Cornell University, Ithaca, NY 14853, USAgDepartment of Physics, University of California, San Diego, CA 92093-0424, USA
hDepartment of Astronomy and Astrophysics, University of Chicago, 5640 South Ellis Avenue,Chicago, IL 60637, USA
iDepartment of Astronomy & Astrophysics, University of Toronto, 50 St. George St., TorontoON M5S 3H4, Canada
jDepartment of Physics, Stanford University, CA 94305, USAkSchool of Physics, University of Melbourne, Parkville, VIC 3010, AustralialDepartment of Physics, University of California, Berkeley, CA 94720, USA
mMIT Kavli Institute, Massachusetts Institute of Technology, Cambridge, MA 02139, USA
ABSTRACT
The Simons Observatory (SO) is an upcoming polarized cosmic microwave background (CMB) survey experi-ment with three small-aperture telescopes and one large-aperture telescope that will observe from the AtacamaDesert in Chile. In total, SO will field over 60,000 transition-edge sensor (TES) bolometers in six spectral bandscentered between 27 and 280 GHz to achieve the sensitivity necessary to measure or constrain numerous cosmo-logical parameters, including the tensor-to-scalar ratio, effective number of relativistic species, and sum of theneutrino masses. The SO scientific goals require coordination and control of the hardware distributed amongthe four telescopes on site. To meet this need, we have designed and built an open-sourced platform for dis-tributed system management, called the Observatory Control System (ocs). This control system interfaces withall subsystems including the telescope control units, the microwave multiplexing readout electronics, and thecryogenic thermometry. We have also developed a system for live monitoring of housekeeping data and alerting,both of which are critical for remote observation. We take advantage of existing open source projects, such ascrossbar.io for RPC and PubSub, twisted for asynchronous events, Grafana for online remote monitoring,and docker for containerization. We provide an overview of the SO software and computer infrastructure, in-cluding the integration of SO-developed code with open source resources and lessons learned while testing at SOlabs developing hardware systems as we prepare for deployment.
Keywords: Cosmic Microwave Background, Observatory Control System, Simons Observatory, control software,monitoring, data acquisition
Corresponding author: [email protected]
arX
iv:2
012.
1034
5v1
[as
tro-
ph.I
M]
18
Dec
202
0

1. INTRODUCTION
The Simons Observatory (SO) is a new cosmic microwave background (CMB) experiment being constructed inthe Atacama Desert in northern Chile. The observatory will consist of three small aperture telescopes (SATs)and one large aperture telescope (LAT). Spread among these telescopes will be over 60,000 cryogenic bolometers,measuring the temperature and polarization of the CMB from 27 to 280 GHz in six frequency bands. Thesedetectors will be read out using a microwave multiplexing (µMUX) architecture.1 The combination of small andlarge aperture telescopes was chosen to cover a wide range of science goals, which include measuring primordialtensor perturbations, further characterizing primordial scalar perturbations, constraining the sum of the neutrinomasses and effective number of relativistic species, measuring the thermal and kinematic Sunyaev-Zel’dovicheffects for a large sample of galaxy clusters, and measuring the duration of reionization.2,3
Orchestrating the control, data collection, and monitoring across all telescopes, their associated readoutelectronics, and the ancillary housekeeping (HK) electronics is a critical task for any observatory. Past CMBexperiments have developed their own control codes or used those of similar experiments, for instance the GeneralControl Program (GCP) developed initially on the Sunyaev-Zel’dovich Array and used across several otherexperiments including SPT, the Keck-array, BICEP2, and PolarBear.4,5 The Atacama Cosmology Telescope(ACT) developed its own remote control and monitoring infrastructure, which evolved over the years since theinitial deployment in 2007.6–9 Generally, these control softwares have been closed source, and insufficient for thescale of hardware deployed on SO.
For the Simons Observatory we have designed and written a distributed control system we call the ObservatoryControl System (ocs). ocs is a modular system, designed to make it easy for any user to add additional hardwareto the system. This design structure enables straightforward adaptation of existing code where similar hardwareis used, and to extend the list of supported hardware for use on existing and new deployments of ocs.
In these proceedings we present an overview of ocs in Section 2, describing its components, how it is deployed,and its development process. Then, in Sections 3 and 4 we describe “Agents” and “Clients”, the core componentsof ocs, and describe various ocs “Agents” and “Clients” that are written or planned. Next, in Section 5 wedescribe the live monitoring capabilities of ocs. In Section 6 we describe three different deployments; namely, asimple deployment, a deployment in one of the SO collaboration labs, and the planned deployment at the sitein Chile, before concluding in Section 7. Appendix A contains Table 2 which lists all acronyms used throughoutthe text for reference.
2. OCS OVERVIEW
The ocs∗ is a distributed control system designed to coordinate data acquisition in astronomical observatories.A design goal has been ease of use in managing hardware operations and I/O tasks in distributed systems likethose found at an observatory, where multiple processes must come together to record an observation. For asystem to be easy to use, it should have a shallow learning curve, allow for users to add or modify componentsfor their use cases, and have a simple installation procedure. The size of an ocs installation can be small, suchas a single computer in a test lab, or complex such as a multi-computer system at the observatory. Throughoutthe rest of the paper, we refer to a single computer or CPU as a “node.”
2.1 Architecture
The ocs has two primary components: ocs Agents and ocs Clients. ocs Agents are long-running software serverswhich interface with a hardware or software component to coordinate data acquisition. Each Agent containsa set of operations, referred to as “Tasks” and “Processes” that run for predefined or open-ended amounts oftime, respectively. Tasks and Processes may be configured to run at Agent startup or may be initiated by aremote procedure call (RPC) over the network by an ocs Client. Information is passed among Agents on thenetwork via a Publish/Subscribe (PubSub) pattern. Both RPC and PubSub are performed through a centralWeb Application Messaging Protocol (WAMP) router. The specific WAMP router implementation we have

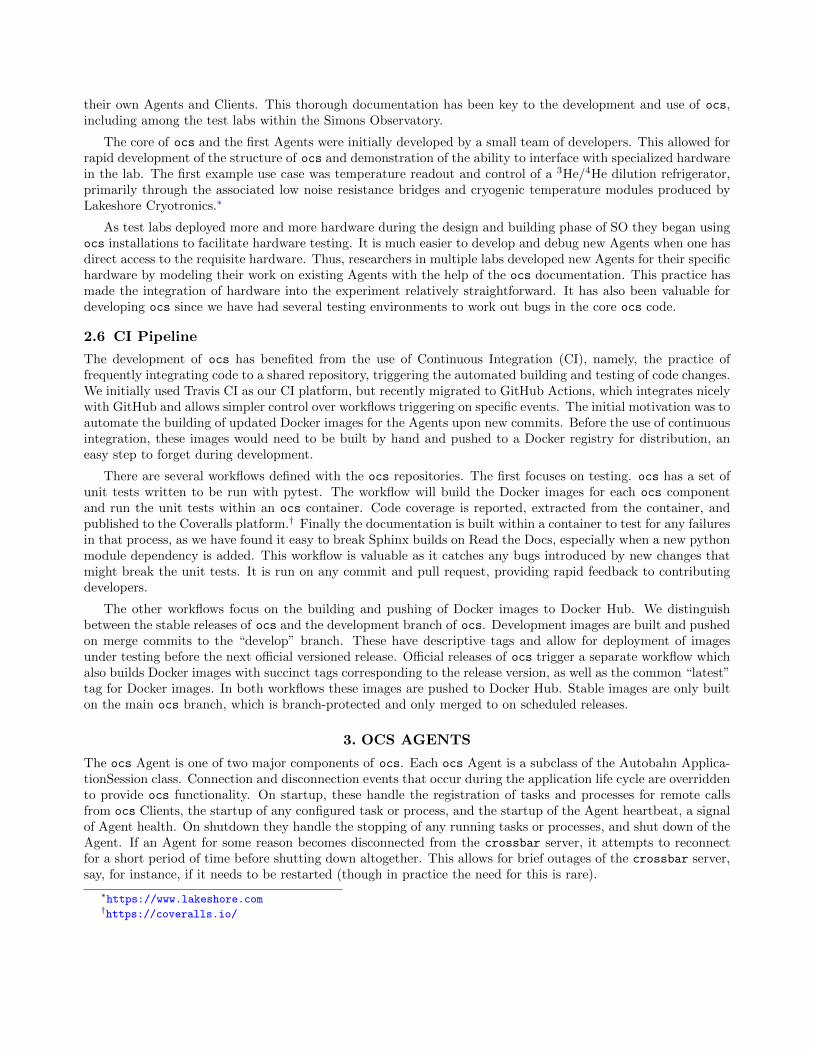
Figure 1. The interaction of two ocs Agents (a generic Agent, and the HK Aggregator Agent that writes data to disk), anocs Client, and the crossbar server. Upon startup (1) the Agents both register their tasks and processes for remote callsand the ocs Aggregator Agent subscribes to all data Feeds, (2) an ocs Client makes a call to an agent task or process, (3)the crossbar server forwards this call to the Agent, (4) the Agent publishes data to an ocs Feed, (5) the HK Aggregator,a subscribed Agent, receives a copy of the data, and (6) writes the data to disk.
chosen is crossbar.io† (referred to in this paper as just crossbar). A diagram showing the interaction betweenAgents, Clients, and the crossbar server is shown in Figure 1.
ocs Clients are scripts that orchestrate the actions of one or more ocs Agents on the network. Clients can takemany forms, as crossbar supports several different programming languages. Most commonly, they are Pythonscripts run by the user on the command-line or JavaScript routines running in a web browser. Clients can alsobe a part of an Agent, commanding other Agents when needed. A good example of this is the ObservationSequencer described in Section 3.3.
Clients can be run anywhere on the network that has access to the crossbar server, such as a dedicatedcomputer at the site or a user’s laptop. Agents can be run directly on bare metal; however more commonly theywill be run within Docker containers for ease of setup, use, and monitoring, as described in Section 2.4.
2.2 Dependencies
We leverage several open source tools in ocs, which we describe in this section.
crossbar is an open source implementation of the Web Application Messaging Protocol (WAMP) used fordistributed applications. WAMP‡ is a websockets subprotocol that provides two application messaging patterns,RPC and PubSub. Developed by Crossbar.io (the company), crossbar.io (the software) is accompanied by theAutobahn libraries which provide open source WAMP implementations in several programming languages. Thiswas appealing when selecting a mechanism for RPC and PubSub, as it allowed support for Python, JavaScript,and, if needed, C++. These Autobahn libraries provide the base components which allow one to write WAMP“application components” that we use to run the ocs Agent code, described in more detail in Section 3.
The WAMP application components are necessarily asynchronous. Autobahn offers the choice of either ofthe asyncio or twisted libraries for implementing the asynchronous networking framework; we use the latter.
We selected the SPT3G software (spt3g software) framework§ for the ocs data storage format.10 The codeis written in C++ with a light Python layer. The internal structure of the files consist of “Frames”, which areprocessed through “Pipelines” by “Modules” one at a time. We have built a new library, so3g,¶ which operateson these standard G3 frames, taking advantage of the structure of the underlying spt3g software file format,while providing helper methods for loading data without users needing to consider the frame structure.
∗https://github.com/simonsobs/ocs†https://crossbar.io‡https://wamp-proto.org/§https://github.com/CMB-S4/spt3g_software¶https://github.com/simonsobs/so3g

Housekeeping (HK) data are collected and written to SPT3G files (or .g3 files) by the HK Aggregator Agent,where frame length and file length are configurable parameters. Detector data are collected by a G3 pipelinecalled the “SMuRF Streamer” and are sent over the network to the SMuRF Recorder Agent, where they arewritten to .g3 file on disk. For more information on these Agents see Section 3.
2.3 Configuration
The Agents and connection information for the WAMP router are defined within an ocs Site ConfigurationFile (SCF). This is a simple YAML file, containing the address for the WAMP router, some internal WAMPaddress information, and a list of each Agent, grouped by which host they will run on. Each Agent is definedby its “agent-class”, a unique name given to each type of Agent and an “instance-id”, a unique name given toa particular instance of a type of Agent (the latter is necessary because many copies of a single Agent may berunning on the network, say for interfacing with multiple identical pieces of hardware). Command-line argumentsto further configure Agents are passed to the Agent as a list.
The SCF, together with the Docker Compose configuration files that define the Docker containers in whichindividual ocs Agents run (see Sec. 2.4), completely define the ocs network. This makes the system incrediblyeasy to migrate to a different machine, or to restore to a machine that might need to be replaced due to ahardware failure or any other reason. In addition, an expert is often able to identify misconfiguration by viewingjust these two configuration files.
If an Agent is deployed outside of the Docker framework, the SCF defines the paths to the Agent’s code.These paths may be split into different repositories. The ocs repository provides core Agents critical to thefunctionality of ocs, while Agents specific to the Simons Observatory hardware are kept in a separate repositorycalled socs (the Simons Observatory Control System).‖
2.4 Docker
We use Docker extensively in the deployment of ocs within the Simons Observatory. It allows for the packagingof software, libraries, and configuration files for each Agent into shareable Docker images. These isolated,reproducible environments for each Agent have been valuable in the deployment of ocs in labs throughout theSO collaboration. Agents are built into images and published to Docker Hub,∗∗ an online resource for hostingand downloading public Docker images. This is done automatically by the Continuous Integration pipelinesdescribed in Section 2.6.
Docker Compose is used to start up the multi-container environment needed for ocs. Long-running servicessuch as the crossbar server, InfluxDB, and Grafana are managed separately, and configured to start at boot.This allows for the ocs stack to be restarted in a straightforward manner without affecting these third partyservices. Orchestration tools such as Docker Swarm, for managing docker containers across the network arestill being explored, though we note that Swarm does not support device connections like those needed for USBhardware such as the Lakeshore 240 (a thermometry readout system).
2.5 Open Source, Documentation, and User Contributions
Clear documentation is vital for adoption of any software package. Since the core of ocs is written in Pythonwe make use of the Sphinx tool†† for creating our documentation, which is freely hosted on Read the Docs,‡‡ anautomatic building, versioning, and hosting platform for open source project documentation. Each commit tothe ocs repositories triggers a new build of the documentation which is automatically updated on the Read theDocs website, and publicly viewable.
Documentation is split into several sections, including a User guide that provides a walk-through of the setupof an ocs network, the Agent reference detailing what each ocs Agent does and how to use and configure them,and a Developer guide describing in more detail how core components of ocs work and how users can develop
‖https://github.com/simonsobs/socs∗∗https://hub.docker.com/u/simonsobs††https://www.sphinx-doc.org/en/master/‡‡https://readthedocs.org/
their own Agents and Clients. This thorough documentation has been key to the development and use of ocs,including among the test labs within the Simons Observatory.
The core of ocs and the first Agents were initially developed by a small team of developers. This allowed forrapid development of the structure of ocs and demonstration of the ability to interface with specialized hardwarein the lab. The first example use case was temperature readout and control of a 3He/4He dilution refrigerator,primarily through the associated low noise resistance bridges and cryogenic temperature modules produced byLakeshore Cryotronics.∗
As test labs deployed more and more hardware during the design and building phase of SO they began usingocs installations to facilitate hardware testing. It is much easier to develop and debug new Agents when one hasdirect access to the requisite hardware. Thus, researchers in multiple labs developed new Agents for their specifichardware by modeling their work on existing Agents with the help of the ocs documentation. This practice hasmade the integration of hardware into the experiment relatively straightforward. It has also been valuable fordeveloping ocs since we have had several testing environments to work out bugs in the core ocs code.
2.6 CI Pipeline
The development of ocs has benefited from the use of Continuous Integration (CI), namely, the practice offrequently integrating code to a shared repository, triggering the automated building and testing of code changes.We initially used Travis CI as our CI platform, but recently migrated to GitHub Actions, which integrates nicelywith GitHub and allows simpler control over workflows triggering on specific events. The initial motivation was toautomate the building of updated Docker images for the Agents upon new commits. Before the use of continuousintegration, these images would need to be built by hand and pushed to a Docker registry for distribution, aneasy step to forget during development.
There are several workflows defined with the ocs repositories. The first focuses on testing. ocs has a set ofunit tests written to be run with pytest. The workflow will build the Docker images for each ocs componentand run the unit tests within an ocs container. Code coverage is reported, extracted from the container, andpublished to the Coveralls platform.† Finally the documentation is built within a container to test for any failuresin that process, as we have found it easy to break Sphinx builds on Read the Docs, especially when a new pythonmodule dependency is added. This workflow is valuable as it catches any bugs introduced by new changes thatmight break the unit tests. It is run on any commit and pull request, providing rapid feedback to contributingdevelopers.
The other workflows focus on the building and pushing of Docker images to Docker Hub. We distinguishbetween the stable releases of ocs and the development branch of ocs. Development images are built and pushedon merge commits to the “develop” branch. These have descriptive tags and allow for deployment of imagesunder testing before the next official versioned release. Official releases of ocs trigger a separate workflow whichalso builds Docker images with succinct tags corresponding to the release version, as well as the common “latest”tag for Docker images. In both workflows these images are pushed to Docker Hub. Stable images are only builton the main ocs branch, which is branch-protected and only merged to on scheduled releases.
3. OCS AGENTS
The ocs Agent is one of two major components of ocs. Each ocs Agent is a subclass of the Autobahn Applica-tionSession class. Connection and disconnection events that occur during the application life cycle are overriddento provide ocs functionality. On startup, these handle the registration of tasks and processes for remote callsfrom ocs Clients, the startup of any configured task or process, and the startup of the Agent heartbeat, a signalof Agent health. On shutdown they handle the stopping of any running tasks or processes, and shut down of theAgent. If an Agent for some reason becomes disconnected from the crossbar server, it attempts to reconnectfor a short period of time before shutting down altogether. This allows for brief outages of the crossbar server,say, for instance, if it needs to be restarted (though in practice the need for this is rare).
∗https://www.lakeshore.com†https://coveralls.io/
The OCSAgent class provides useful wrappers for PubSub and for providing the Agent operation commands.Each agent that will publish data must first register the communication channel, which we call the ocs Feed, aclass which handles the WAMP address space and the buffering and publication of data submitted to it by anAgent. Once a Feed is registered, the Agent can publish data to it in “blocks”, each of which contains co-sampleddata, whether for a single timestamp or a longer duration of time. The block structure is not allowed to changeafter construction. Its structure, published to a Feed, is a simple Python dictionary. These data are serializedbefore being sent over the network. Prior to publication, the Feed performs some verification of the messagedata structure. This check at the Feed level can be useful for debugging when developing an Agent.
Any agent, or supporting client, can subscribe to an ocs Feed. Agents that aggregate all data from otherAgents, like the HK Aggregator or InfluxDB Publisher Agent, subscribe to all ocs Feeds that are marked forrecording to disk.
Tasks and Processes made available for remote call in an Agent have a simple operation control API thatprovides four possible actions: “start”, “status”, “wait”, and “abort” or “stop” (for Tasks and Processes, re-spectively). “Start” will request that a task or process be run, passing any parameters needed for the operation.“Wait” will block until the operation has exited or a timeout has elapsed. “Status” returns the current statusof the operation. Possible values are “starting”, “running”, “stopping”, and “done”. The returned object canalso include informative data, such as the most recent data collected by the Agent in a structure we call theoperation session data. The “abort” or “stop” methods will abort the task or process. These operation controlactions are called by ocs Clients.
In the remainder of this Section we present details on several of the major ocs Agents, including those used forpointing the telescope, commanding the readout electronics, writing data to disk, and orchestrating observations.We also present a summary of all other supporting Agents.
3.1 Antenna Control Unit
The Antenna Control Unit (ACU) is an industrial PC used to control the motion of a single telescope platform.The Simons Observatory will use one ACU per telescope, provided by Vertex Antennentechnik,‡ the companythat has been commissioned to build the telescope platforms. Vertex Antennentechnik additionally providessoftware on the ACUs that provides an API for controlling the telescope platform, allowing users to switchbetween the operational modes required for observations. The ACU also publishes two data streams to ports ona computer provided by SO: a 200 Hz UDP stream containing time stamps and encoder values, and a 5 Hz TCPstream containing those same values in addition to monitors for errors and faults.
The ACU ocs Agent publishes the data received from each of these streams to an ocs Feed for recordingto file and for viewing in the live monitor. The Agent also provides Operations for commanding the telescope.The functioning of the incoming data monitors has been verified during factory acceptance testing for the firstcommissioned SAT at the Vertex Antennentechnik facility in Germany; testing of some tasks remains ongoing.
3.2 SMuRF Agents
The Simons Observatory will read out its detector array via superconducting quantum interference device multi-plexing (µMUX) with the SLAC Microresonator Radio Frequency (SMuRF) warm electronics system.1,11 Com-munication with the SMuRF system is facilitated by the rogue§ C++ software library. rogue implementslow-level communication with the SMuRF FPGA, providing register access and asynchronous data streaming. Itincludes an Experimental Physics and Industrial Control System (EPICS) server that allows register reading andwriting operations to be executed from high-level clients, such as the Pysmurf library, a Python library providedby SLAC for interfacing with the SMuRF systems.¶
A dedicated SMuRF server is used to run rogue, Pysmurf, and related ocs Agents, and to temporarily storeauxiliary data before it is copied to a more permanent storage node where it is archived along with the ocs
housekeeping data. For detector data acquisition, we are using a custom rogue plugin that collects detector
‡https://www.vertexant.com/§https://github.com/slaclab/rogue¶https://github.com/slaclab/pysmurf
data and relevant metadata through the asynchronous streaming interface. Data are grouped into chunks ofabout one second and packaged into serializable frames using the SPT3G data format. Frames are sent over thenetwork to the storage node where they are received by the SMuRF Recorder ocs Agent that writes them todisk.
Control of the SMuRF system and high-level analysis is managed with the Pysmurf library, which utilizes theEPICS interface to control the hardware. In development, Pysmurf is primarily controlled interactively throughan iPython interface or a Jupyter notebook. Once common procedures have been established, functions can berun through ocs using a Pysmurf Controller agent that manages the execution of Pysmurf scripts.
Pysmurf generates important companion data such as plots and summaries that describe detector parametersand operating behavior. This companion data must also be archived along with the detector data, which is donethrough the use of the Pysmurf Monitor and Pysmurf Archiver ocs agents. Pysmurf passes the auxiliary filemetadata to the Pysmurf Monitor Agent running on the server, which then writes the metadata to a database onthe storage node. The Pysmurf Archiver runs on the storage node and monitors the database for new metadataentries and then copies the corresponding files over to be archived along with the detector and housekeepingdata.
3.3 Observation Sequencer
The Observation Sequencer Agent orchestrates observatory systems to perform observations. In this sense it isalso an ocs Client, issuing commands to other Agents on the ocs network. The sequencer requests the surveyplan from a separate program and executes a series of commands, e.g. to the various SMuRF Agents to readythe detectors, to the ACU Agent to point the telescope.
The Sequencer will record its performed actions in a database to support downstream monitoring. This willbe used to flag errors during data acquisition, confirm the data for a given observation were acquired, associatethe data on disk with the given survey plan, and group data files and calibration operations together. TheSequencer is currently in a development phase.
3.4 Additional Hardware Agents
Table 1 shows a summary of other ocs Agents that have been written or are under development for use on theSimons Observatory. These Agents are easily shared among other ocs users and several are user-contributed.Beyond the Agents listed here are more to be developed, including Agents to interface with Fourier TransformSpectrometers, polarization grid calibrators, cooling loops, additional power supplies, and more.
4. OCS CLIENTS
ocs Clients are the programs that command single or multi-agent sites, orchestrating device operation anddata collection across the observatory. Most commonly these will be Python scripts, JavaScript embedded ina users web browser, or subroutines within ocs Agents. Clients can connect to the crossbar server either viawebsockets, for instance, using the wampy python package, or via HTTP or HTTPS. In order for clients to supportsubscription, they must connect via websockets and not the HTTP bridge.
Within ocs there are two methods for writing a Python based Client: the Basic Client, in which the user mustdefine each operation they wish to call, and the Matched Client, which performs this definition automatically,matching operation calls to their defined task or process names. By default Basic Clients connect via websockets,while MatchedClients connect via HTTP, though both backends are supported in either case. A Matched Client,communicating over HTTP is perhaps the simplest Client for getting started quickly, and for simple interactionswith running Agents. Clients can be run from anywhere on the network where the crossbar server is run,allowing for users to send commands from their laptops as simply as from on-site computing infrastructure.Javascript clients are discussed in Sec. 4.1.

4.1 OCSWeb
OCSWeb is an ensemble of ocs Clients implemented in JavaScript and rendered as a GUI in a web browser.Two screenshots are shown in Figure 2. The elements of OCSWeb are a JavaScript library, HTML and CSS filesto present a basic interface and styling, and a variety of Agent-specific JavaScript modules to produce tailoredinterfaces.
For basic functionality, the browser must be able to connect to crossbar through the websocket interface. Themain page of the interface presents a configuration box and a list of active ocs Agents. Users may interactivelyselect different Agents and browse through the Tasks, Processes and Feeds presented by each one, including thelatest session data and log information. The main page does not permit any detailed control but is useful forbasic health monitoring, debugging and development purposes.
Control panels that are tailored to specific Agent types can be launched from the main interface, with eachappearing in a new tab of the main window. The control panels are rendered according to JavaScript codedeveloped specifically for that Agent class. As is the case for the Agent code itself, the creation of Agent-specificpanels is largely left in the hands of developers working with those Agents and the associated hardware. However,the OCSWeb library provides a framework for generating basic GUI controls and displays, along with examplesof how to attach handlers to dispatch Agent requests and process returned information. The goal is that Agentdevelopers not need to learn much JavaScript to produce a useful control panel. The basic library is somewhatlimited, but does not preclude experienced JavaScript developers from creating more sophisticated, customizedcontrol panels should the need arise.
Plans are in development to support persistent configuration between sessions through some combination ofa configuration server and HTTP cookies; this will permit views involving certain subsets of Agents to persistfrom session to session.
5. LIVE MONITORING
Remote live monitoring of telescope systems is critical to ensuring high observation efficiency. Our goal has beento provide a web interface for real time viewing of housekeeping systems that remote observers can use to assessthe health of the observatory. These systems generally consist of slow data rate timestreams, on the order ofseveral Hz sampling rates or slower. Higher data rate timestreams, such as the raw detector data, are moresuitable for custom local interfaces. We searched for existing tools to solve this problem, and have chosen severalopen source tools.
5.1 Grafana
Grafana‖ is an open source observability web application used for visualization and analytics of time seriesdata. It supports many time series database and relational database backends as “data sources”. Once a datasource is configured, and data are inserted into the database, Grafana can query the database and display theresulting data in a user’s web browser dynamically. This is done on web pages called “dashboards”, in plotscalled “panels”. A screenshot showing a Grafana dashboard with several panels is shown in Figure 3.
Dashboards are persistent and can be loaded upon revisiting the web application. They can be configuredto automatically refresh, and provide a modern web interface for timeseries plots. We have selected InfluxDB asour primary data source backend. All housekeeping data within ocsare published through the crossbar servervia ocsFeeds. There are two primary subscribers to these feeds: the HK Aggregator and the InfluxDB Publisher.These both record separate copies of the HK data, to .g3 files and to the Influx Database, respectively.
‖https://grafana.com/

Figure 2. OCSWeb main page (top) and special control panel for the telescope platform control Agent (bottom).

Figure 3. A screenshot of the Grafana live monitor showing cryogenic thermometry during a cooldown of the SAT1receiver at UCSD. The y-axis in all plots is temperature in Kelvin and the x-axis is time, showing approximately a monthof time during which the cryostat was cooled and several tests were run.
5.2 InfluxDB
InfluxDB, a time series database developed by InfluxData,∗∗ is a popular backend data sources for Grafana,and is designed for fast access to large volumes of time series data. Hardware running InfluxDB must be sizedappropriately, depending on the number of writes per second and the number of queries per second. We havefound the performance suitable on moderate modern desktop computers typically found in labs for the slowhousekeeping data within SO on shorter timescales, from one day to several months. Loading a significantamount of data can cause issues, so one must be aware of the queries configured within Grafana. We areexploring solutions to this: see Section 5.5.
5.3 Log Aggregation with Loki
Loki is a log aggregation system designed by Grafana Labs. Written by the same team that made Grafana,it integrates very well with the Grafana web interface. A logging driver for Docker publishes logs to the Lokiservice. Users can then follow logs or query for past logs directly within the Grafana web interface. Aggregationof logs external to Docker can be performed using a tool called promtail, also from Grafana Labs, however mostof our requirements are met by the Docker logging driver so we we are not using it at this time. This may changein the future.
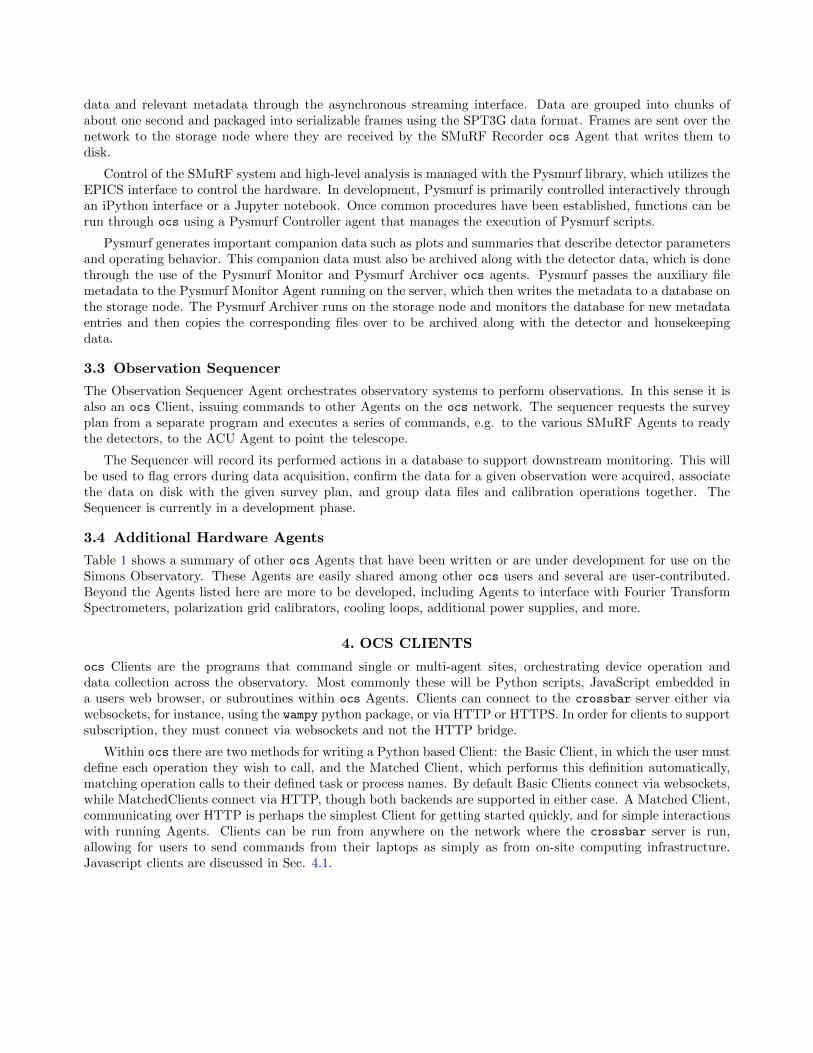
The interface allows for individual containers, or entire Compose services to be viewed. ocs logs simply printto stdout, which results in logging to Docker’s configured logging driver. Logs remain visible via the “dockerlogs” command, while also being aggregated within Loki. This allows for easy viewing of logs in the event of anerror somewhere within the ocssystem in a cohesive interface. The interface is shown in Figure 4.
5.4 Detector Data
The detector data volume is large enough that the HK live monitoring system cannot support the full detec-tor data rate. The Pysmurf Monitor Agent has the ability to send a small subset of downsampled detectortimestreams to the HK live monitoring system for basic checks. The full data rate detector timestreams can bemonitored locally via a custom tool from the South Pole Telescope called lyrebird.†† Lyrebird is being adaptedfor use on SO.
∗∗https://www.influxdata.com/††https://github.com/SouthPoleTelescope/lyrebird
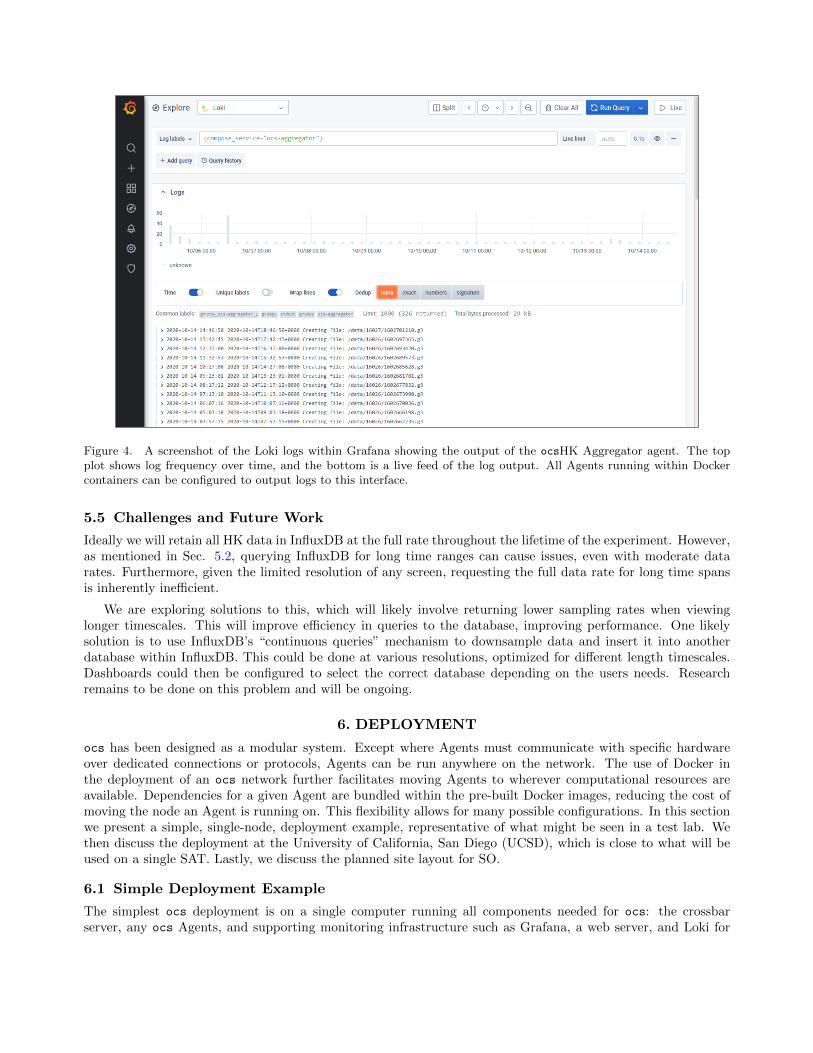
Figure 4. A screenshot of the Loki logs within Grafana showing the output of the ocsHK Aggregator agent. The topplot shows log frequency over time, and the bottom is a live feed of the log output. All Agents running within Dockercontainers can be configured to output logs to this interface.
5.5 Challenges and Future Work
Ideally we will retain all HK data in InfluxDB at the full rate throughout the lifetime of the experiment. However,as mentioned in Sec. 5.2, querying InfluxDB for long time ranges can cause issues, even with moderate datarates. Furthermore, given the limited resolution of any screen, requesting the full data rate for long time spansis inherently inefficient.
We are exploring solutions to this, which will likely involve returning lower sampling rates when viewinglonger timescales. This will improve efficiency in queries to the database, improving performance. One likelysolution is to use InfluxDB’s “continuous queries” mechanism to downsample data and insert it into anotherdatabase within InfluxDB. This could be done at various resolutions, optimized for different length timescales.Dashboards could then be configured to select the correct database depending on the users needs. Researchremains to be done on this problem and will be ongoing.
6. DEPLOYMENT
ocs has been designed as a modular system. Except where Agents must communicate with specific hardwareover dedicated connections or protocols, Agents can be run anywhere on the network. The use of Docker inthe deployment of an ocs network further facilitates moving Agents to wherever computational resources areavailable. Dependencies for a given Agent are bundled within the pre-built Docker images, reducing the cost ofmoving the node an Agent is running on. This flexibility allows for many possible configurations. In this sectionwe present a simple, single-node, deployment example, representative of what might be seen in a test lab. Wethen discuss the deployment at the University of California, San Diego (UCSD), which is close to what will beused on a single SAT. Lastly, we discuss the planned site layout for SO.
6.1 Simple Deployment Example
The simplest ocs deployment is on a single computer running all components needed for ocs: the crossbarserver, any ocs Agents, and supporting monitoring infrastructure such as Grafana, a web server, and Loki for
log aggregation (described in more detail in Sec. 5.3). Hardware with dedicated connections, such as USBconnections, connect directly to this machine. Any networked devices that ocs sends commands to or receivesdata from must, of course, be on the same network as this machine. Figure 5 shows a diagram of this simplelayout.‡‡
Figure 5. A diagram of a simple ocs network. A single node, “OCS-Host”, runs all containers, represented by the coloredboxes within the node. Connections to containers within the node are assumed. Users interact via external ocs Clients(not pictured here), or via OCSWeb and Grafana, served over the NGINX web server.
A modest desktop machine is capable of running this system. Most systems like this within SO are equippedwith a quad-core CPU from the last 5–7 years and 12–16 GB of RAM. The example shown here could be used forreadout and monitoring of a cryostat in the lab, with temperature control, hardware permitting. In this setting,data rates are typically low: 10 Hz or less per Agent.
6.2 Test Lab Deployment and Development
Test institution configurations will often span multiple nodes and operating systems, with network configurationsthat depend on many factors such as which agents are required to run and network restrictions imposed by thelab or university. In most cases there is a primary storage node that runs the core set of ocs agents and supportcontainers, including the HK Aggregator and InfluxDB Publisher agents, the registry, the database containersand the Grafana server. Other nodes that are required to manage specific pieces of hardware such as the BlueforsDR or the SMuRF system are connected on a private subnet.
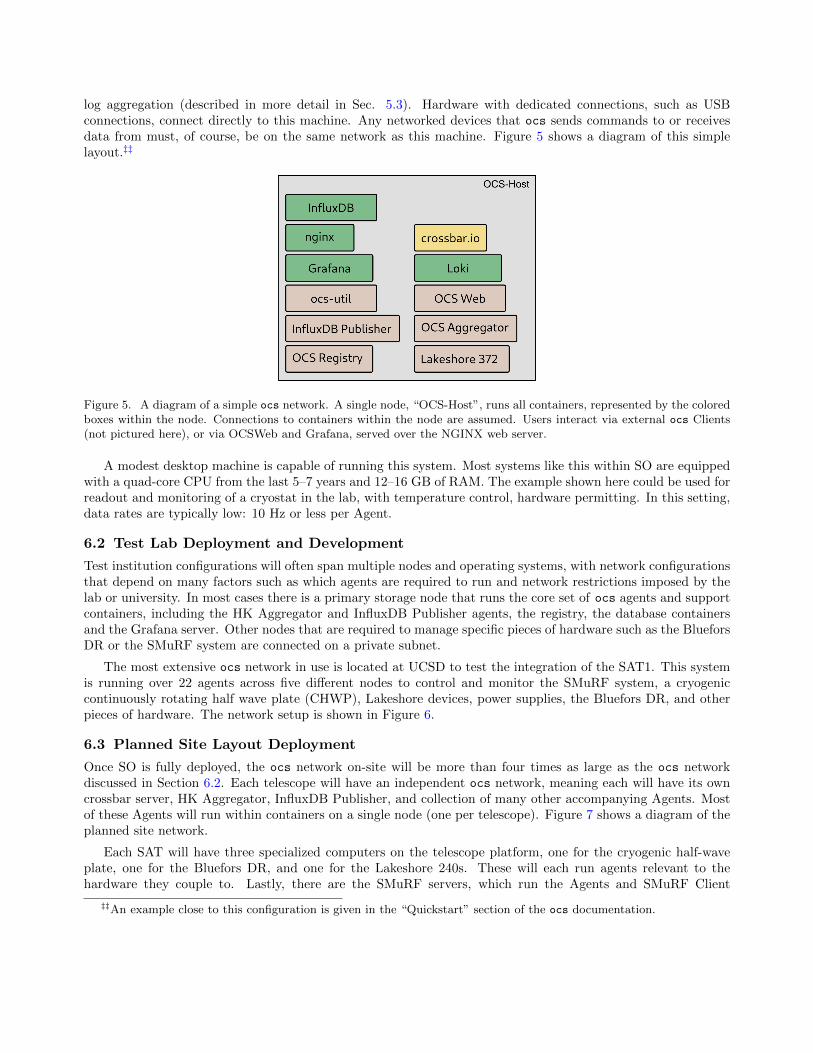
The most extensive ocs network in use is located at UCSD to test the integration of the SAT1. This systemis running over 22 agents across five different nodes to control and monitor the SMuRF system, a cryogeniccontinuously rotating half wave plate (CHWP), Lakeshore devices, power supplies, the Bluefors DR, and otherpieces of hardware. The network setup is shown in Figure 6.
6.3 Planned Site Layout Deployment
Once SO is fully deployed, the ocs network on-site will be more than four times as large as the ocs networkdiscussed in Section 6.2. Each telescope will have an independent ocs network, meaning each will have its owncrossbar server, HK Aggregator, InfluxDB Publisher, and collection of many other accompanying Agents. Mostof these Agents will run within containers on a single node (one per telescope). Figure 7 shows a diagram of theplanned site network.
Each SAT will have three specialized computers on the telescope platform, one for the cryogenic half-waveplate, one for the Bluefors DR, and one for the Lakeshore 240s. These will each run agents relevant to thehardware they couple to. Lastly, there are the SMuRF servers, which run the Agents and SMuRF Client
‡‡An example close to this configuration is given in the “Quickstart” section of the ocs documentation.
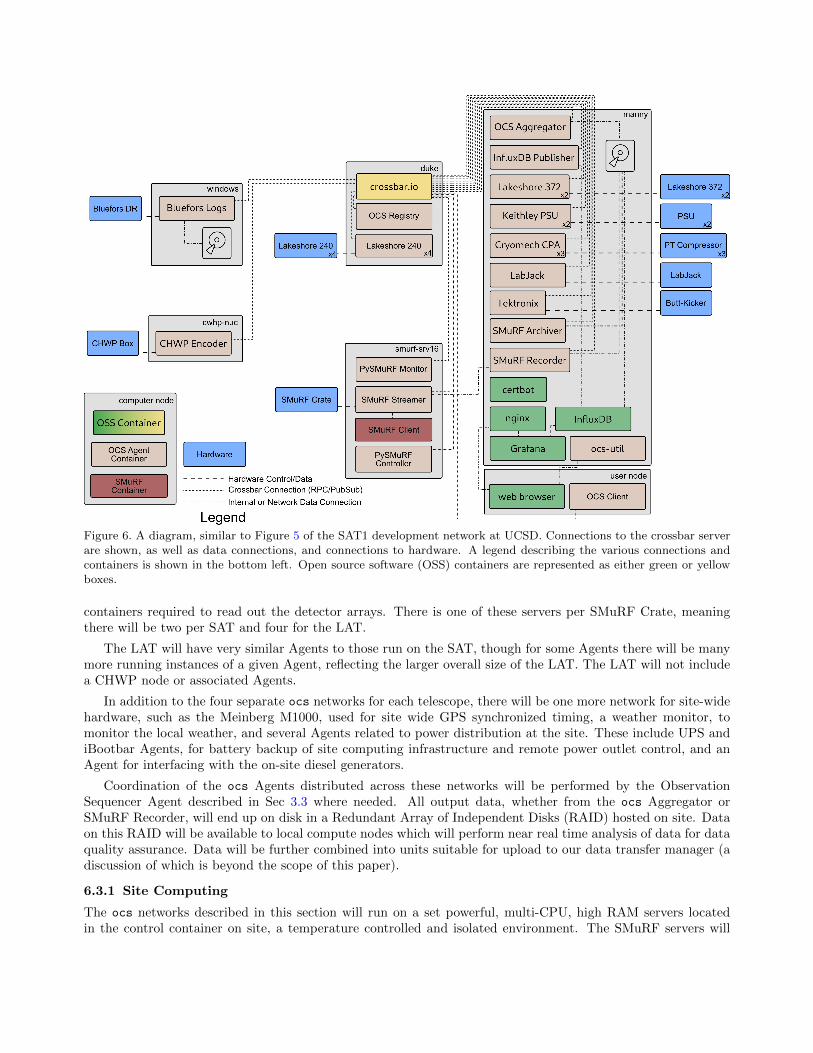
Figure 6. A diagram, similar to Figure 5 of the SAT1 development network at UCSD. Connections to the crossbar serverare shown, as well as data connections, and connections to hardware. A legend describing the various connections andcontainers is shown in the bottom left. Open source software (OSS) containers are represented as either green or yellowboxes.
containers required to read out the detector arrays. There is one of these servers per SMuRF Crate, meaningthere will be two per SAT and four for the LAT.
The LAT will have very similar Agents to those run on the SAT, though for some Agents there will be manymore running instances of a given Agent, reflecting the larger overall size of the LAT. The LAT will not includea CHWP node or associated Agents.
In addition to the four separate ocs networks for each telescope, there will be one more network for site-widehardware, such as the Meinberg M1000, used for site wide GPS synchronized timing, a weather monitor, tomonitor the local weather, and several Agents related to power distribution at the site. These include UPS andiBootbar Agents, for battery backup of site computing infrastructure and remote power outlet control, and anAgent for interfacing with the on-site diesel generators.
Coordination of the ocs Agents distributed across these networks will be performed by the ObservationSequencer Agent described in Sec 3.3 where needed. All output data, whether from the ocs Aggregator orSMuRF Recorder, will end up on disk in a Redundant Array of Independent Disks (RAID) hosted on site. Dataon this RAID will be available to local compute nodes which will perform near real time analysis of data for dataquality assurance. Data will be further combined into units suitable for upload to our data transfer manager (adiscussion of which is beyond the scope of this paper).
6.3.1 Site Computing
The ocs networks described in this section will run on a set powerful, multi-CPU, high RAM servers locatedin the control container on site, a temperature controlled and isolated environment. The SMuRF servers will

Figure 7. A diagram of the site ocs network. All nodes are connected via the on site network. Crossbar connectionsoutside of a single node are shown. Connections within a node are assumed. One instance of an SAT ocs network isshown by the central group of nodes. At full deployment three of these will be present. Multiple copies of given Agentsare shown with multipliers. The UPS and iBootbar Agent counts, N and M , are still being determined.
also run in this location, and will run on Dell R440 servers. The dedicated NUC (short for Intel’s “Next Unit ofComputing”, a small form factor PC) hardware on the telescope platforms are ruggedized Intel NUCs equippedwith Intel Celeron processors.
The site will be equipped with a Meinberg M1000 timing system that synchronizes with GPS satellites andprovides precision timing to the site network via the Precision Time Protocol (PTP) as well as inter-rangeinstrumentation group (IRIG) timecodes and pulse per second (PPS) timing to the SMuRF master timingelectronics. Each telescope platform will have a Meinberg SyncBox/N2X that accepts the PTP signal from thenetwork and can be configured to output a variety of timing signals on three different BNC outputs. These willprovide any precision timing signal required nearby the telescopes, such as for the CHWPs. The site networkingequipment will all be PTP compatible, and appropriately configured to distribute the PTP timing signal within±100 ns.
7. SUMMARY
We have presented an overview of the Observatory Control System for the Simons Observatory. The design andimplementation of this distributed control system is modular and will scale up as we deploy the observatory andbeyond. The use of open source tools, such as crossbar, Grafana, InfluxDB, and Docker, has allowed us tofocus on the core ocs functionality while delivering a powerful monitoring interface, and convenient deploymentoptions. The functionality provided by ocs is a critical aspect of the observatory and will enable the sciencegoals outlined in our forecast paper.2
ocs is already integrated into the activities of SO through its use in labs doing hardware development andassembly. These preliminary deployments of ocs are not only contributing to the ongoing deployment of theexperiment but have also been invaluable for debugging and developing our software. This process has beenassisted by the use of Docker and by the automated testing and building of Docker images in the CI pipelines.The extensive documentation has enabled users at these labs to develop their own Agents and extend thefunctionality of ocs. ocs, and the SO specific Agents in socs, are both developed as open source software

and are permissively licensed under the BSD 2-Clause license. The software is available on GitHub, and weencourage the community to try examples detailed within the documentation, to consider using ocs for theircontrol software, and to contribute to its development.
APPENDIX A. ACRONYMS
Table 2 shows a list of all acronyms used in this paper.
ACKNOWLEDGMENTS
This work was funded by the Simons Foundation (Award #457687). ZX is supported by the Gordon and BettyMoore Foundation. We would like to thank the communities behind the multiple open source packages in usewith ocs.
REFERENCES
[1] Henderson, S. W., Ahmed, Z., Austermann, J., Becker, D., Bennett, D. A., Brown, D., Chaudhuri, S., Cho,H.-M. S., D’Ewart, J. M., Dober, B., Duff, S. M., Dusatko, J. E., Fatigoni, S., Frisch, J. C., Gard, J. D.,Halpern, M., Hilton, G. C., Hubmayr, J., Irwin, K. D., Karpel, E. D., Kernasovskiy, S. S., Kuenstner, S. E.,Kuo, C.-L., Li, D., Mates, J. A. B., Reintsema, C. D., Smith, S. R., Ullom, J., Vale, L. R., Winkle, D. D. V.,Vissers, M., and Yu, C., “Highly-multiplexed microwave SQUID readout using the SLAC MicroresonatorRadio Frequency (SMuRF) electronics for future CMB and sub-millimeter surveys,” Proc. SPIE 10708, 170– 185 (2018).
[2] Ade, P., Aguirre, J., Ahmed, Z., Aiola, S., Ali, A., Alonso, D., Alvarez, M. A., Arnold, K., Ashton, P.,Austermann, J., Awan, H., Baccigalupi, C., Baildon, T., Barron, D., Battaglia, N., Battye, R., Baxter,E., Bazarko, A., Beall, J. A., Bean, R., Beck, D., Beckman, S., Beringue, B., Bianchini, F., Boada, S.,Boettger, D., Bond, J. R., Borrill, J., Brown, M. L., Bruno, S. M., Bryan, S., Calabrese, E., Calafut, V.,Calisse, P., Carron, J., Challinor, A., Chesmore, G., Chinone, Y., Chluba, J., Cho, H.-M. S., Choi, S.,Coppi, G., Cothard, N. F., Coughlin, K., Crichton, D., Crowley, K. D., Crowley, K. T., Cukierman, A.,D’Ewart, J. M., Dunner, R., de Haan, T., Devlin, M., Dicker, S., Didier, J., Dobbs, M., Dober, B., Duell,C. J., Duff, S., Duivenvoorden, A., Dunkley, J., Dusatko, J., Errard, J., Fabbian, G., Feeney, S., Ferraro,S., Fluxa, P., Freese, K., Frisch, J. C., Frolov, A., Fuller, G., Fuzia, B., Galitzki, N., Gallardo, P. A.,Tomas Galvez Ghersi, J., Gao, J., Gawiser, E., Gerbino, M., Gluscevic, V., Goeckner-Wald, N., Golec, J.,Gordon, S., Gralla, M., Green, D., Grigorian, A., Groh, J., Groppi, C., Guan, Y., Gudmundsson, J. E.,Han, D., Hargrave, P., Hasegawa, M., Hasselfield, M., Hattori, M., Haynes, V., Hazumi, M., He, Y., Healy,E., Henderson, S. W., Hervias-Caimapo, C., Hill, C. A., Hill, J. C., Hilton, G., Hilton, M., Hincks, A. D.,Hinshaw, G., Hlozek, R., Ho, S., Ho, S.-P. P., Howe, L., Huang, Z., Hubmayr, J., Huffenberger, K., Hughes,J. P., Ijjas, A., Ikape, M., Irwin, K., Jaffe, A. H., Jain, B., Jeong, O., Kaneko, D., Karpel, E. D., Katayama,N., Keating, B., Kernasovskiy, S. S., Keskitalo, R., Kisner, T., Kiuchi, K., Klein, J., Knowles, K., Koopman,B., Kosowsky, A., Krachmalnicoff, N., Kuenstner, S. E., Kuo, C.-L., Kusaka, A., Lashner, J., Lee, A., Lee,E., Leon, D., Leung, J. S. Y., Lewis, A., Li, Y., Li, Z., Limon, M., Linder, E., Lopez-Caraballo, C., Louis,T., Lowry, L., Lungu, M., Madhavacheril, M., Mak, D., Maldonado, F., Mani, H., Mates, B., Matsuda, F.,Maurin, L., Mauskopf, P., May, A., McCallum, N., McKenney, C., McMahon, J., Meerburg, P. D., Meyers,J., Miller, A., Mirmelstein, M., Moodley, K., Munchmeyer, M., Munson, C., Naess, S., Nati, F., Navaroli,M., Newburgh, L., Nguyen, H. N., Niemack, M., Nishino, H., Orlowski-Scherer, J., Page, L., Partridge, B.,Peloton, J., Perrotta, F., Piccirillo, L., Pisano, G., Poletti, D., Puddu, R., Puglisi, G., Raum, C., Reichardt,C. L., Remazeilles, M., Rephaeli, Y., Riechers, D., Rojas, F., Roy, A., Sadeh, S., Sakurai, Y., Salatino,M., Sathyanarayana Rao, M., Schaan, E., Schmittfull, M., Sehgal, N., Seibert, J., Seljak, U., Sherwin, B.,Shimon, M., Sierra, C., Sievers, J., Sikhosana, P., Silva-Feaver, M., Simon, S. M., Sinclair, A., Siritanasak,P., Smith, K., Smith, S. R., Spergel, D., Staggs, S. T., Stein, G., Stevens, J. R., Stompor, R., Suzuki,A., Tajima, O., Takakura, S., Teply, G., Thomas, D. B., Thorne, B., Thornton, R., Trac, H., Tsai, C.,Tucker, C., Ullom, J., Vagnozzi, S., van Engelen, A., Van Lanen, J., Van Winkle, D. D., Vavagiakis, E. M.,Verges, C., Vissers, M., Wagoner, K., Walker, S., Ward, J., Westbrook, B., Whitehorn, N., Williams, J.,Williams, J., Wollack, E. J., Xu, Z., Yu, B., Yu, C., Zago, F., Zhang, H., Zhu, N., and Simons Observatory
Collaboration, “The Simons Observatory: science goals and forecasts,” J. Cosmology Astropart. Phys. 2019,056 (Feb. 2019).
[3] Lee, A., Abitbol, M. H., Adachi, S., Ade, P., Aguirre, J., Ahmed, Z., Aiola, S., Ali, A., Alonso, D., Alvarez,M. A., Arnold, K., Ashton, P., Atkins, Z., Austermann, J., Awan, H., Baccigalupi, C., Baildon, T., BaleatoLizancos, A., Barron, D., Battaglia, N., Battye, R., Baxter, E., Bazarko, A., Beall, J. A., Bean, R., Beck,D., Beckman, S., Beringue, B., Bhandarkar, T., Bhimani, S., Bianchini, F., Boada, S., Boettger, D., Bolliet,B., Bond, J. R., Borrill, J., Brown, M. L., Bruno, S. M., Bryan, S., Calabrese, E., Calafut, V., Calisse, P.,Carron, J., Carl, F. M., Cayuso, J., Challinor, A., Chesmore, G., Chinone, Y., Chluba, J., Cho, H.-M. S.,Choi, S., Clark, S., Clarke, P., Contaldi, C., Coppi, G., Cothard, N. F., Coughlin, K., Coulton, W., Crichton,D., Crowley, K. D., Crowley, K. T., Cukierman, A., D’Ewart, J. M., Dunner, R., de Haan, T., Devlin, M.,Dicker, S., Dober, B., Duell, C. J., Duff, S., Duivenvoorden, A., Dunkley, J., El Bouhargani, H., Errard, J.,Fabbian, G., Feeney, S., Fergusson, J., Ferraro, S., Fluxa, P., Freese, K., Frisch, J. C., Frolov, A., Fuller,G., Galitzki, N., Gallardo, P. A., Galvez Ghersi, J. T., Gao, J., Gawiser, E., Gerbino, M., Gluscevic, V.,Goeckner-Wald, N., Golec, J., Gordon, S., Gralla, M., Green, D., Grigorian, A., Groh, J., Groppi, C., Guan,Y., Gudmundsson, J. E., Halpern, M., Han, D., Hargrave, P., Harrington, K., Hasegawa, M., Hasselfield,M., Hattori, M., Haynes, V., Hazumi, M., Healy, E., Henderson, S. W., Hensley, B., Hervias-Caimapo, C.,Hill, C. A., Hill, J. C., Hilton, G., Hilton, M., Hincks, A. D., Hinshaw, G., Hlozek, R., Ho, S., Ho, S.-P. P.,Hoang, T. D., Hoh, J., Hotinli, S. C., Huang, Z., Hubmayr, J., Huffenberger, K., Hughes, J. P., Ijjas, A.,Ikape, M., Irwin, K., Jaffe, A. H., Jain, B., Jeong, O., Johnson, M., Kaneko, D., Karpel, E. D., Katayama,N., Keating, B., Keskitalo, R., Kisner, T., Kiuchi, K., Klein, J., Knowles, K., Kofman, A., Koopman, B.,Kosowsky, A., Krachmalnicoff, N., Kusaka, A., La Plante, P., Lashner, J., Lee, A., Lee, E., Lewis, A., Li,Y., Li, Z., Limon, M., Linder, E., Liu, J., Lopez-Caraballo, C., Louis, T., Lungu, M., Madhavacheril, M.,Mak, D., Maldonado, F., Mani, H., Mates, B., Matsuda, F., Maurin, L., Mauskopf, P., May, A., McCallum,N., McCarrick, H., McKenney, C., McMahon, J., Meerburg, P. D., Mertens, J., Meyers, J., Miller, A.,Mirmelstein, M., Moodley, K., Moore, J., Munchmeyer, M., Munson, C., Murata, M., Naess, S., Namikawa,T., Nati, F., Navaroli, M., Newburgh, L., Nguyen, H. N., Nicola, A., Niemack, M., Nishino, H., Nishinomiya,Y., Orlowski-Scherer, J., Pagano, L., Partridge, B., Perrotta, F., Phakathi, P., Piccirillo, L., Pierpaoli, E.,Pisano, G., Poletti, D., Puddu, R., Puglisi, G., Raum, C., Reichardt, C. L., Remazeilles, M., Rephaeli,Y., Riechers, D., Rojas, F., Rotti, A., Roy, A., Sadeh, S., Sakurai, Y., Salatino, M., Sathyanarayana Rao,M., Saunders, L., Schaan, E., Schmittfull, M., Sehgal, N., Seibert, J., Seljak, U., Shellard, P., Sherwin, B.,Shimon, M., Sierra, C., Sievers, J., Sifon, C., Sikhosana, P., Silva-Feaver, M., Simon, S. M., Sinclair, A.,Smith, K., Sohn, W., Sonka, R., Spergel, D., Spisak, J., Staggs, S. T., Stein, G., Stevens, J. R., Stompor,R., Suzuki, A., Tajima, O., Takakura, S., Teply, G., Thomas, D. B., Thorne, B., Thornton, R., Trac, H.,Treu, J., Tsai, C., Tucker, C., Ullom, J., Vagnozzi, S., van Engelen, A., Van Lanen, J., Van Winkle, D. D.,Vavagiakis, E. M., Verges, C., Vissers, M., Wagoner, K., Walker, S., Wang, Y., Ward, J., Westbrook, B.,Whitehorn, N., Williams, J., Williams, J., Wollack, E., Xu, Z., Yasini, S., Young, E., Yu, B., Yu, C., Zago,F., Zannoni, M., Zhang, H., Zheng, K., Zhu, N., and Zonca, A., “The Simons Observatory,” in [Bulletin ofthe American Astronomical Society ], 51, 147 (Sept. 2019).
[4] Story, K., Leitch, E., Ade, P., Aird, K. A., Austermann, J. E., Beall, J. A., Becker, D., Bender, A. N.,Benson, B. A., Bleem, L. E., Britton, J., Carlstrom, J. E., Chang, C. L., Chiang, H. C., Cho, H.-M.,Crawford, T. M., Crites, A. T., Datesman, A., de Haan, T., Dobbs, M. A., Everett, W., Ewall-Wice, A.,George, E. M., Halverson, N. W., Harrington, N., Henning, J. W., Hilton, G. C., Holzapfel, W. L., Hoover,S., Huang, N., Hubmayr, J., Irwin, K. D., Karfunkle, M., Keisler, R., Kennedy, J., Lee, A. T., Li, D.,Lueker, M., Marrone, D. P., McMahon, J. J., Mehl, J., Meyer, S. S., Montgomery, J., Montroy, T. E., Nagy,J., Natoli, T., Nibarger, J. P., Niemack, M. D., Novosad, V., Padin, S., Pryke, C., Reichardt, C. L., Ruhl,J. E., Saliwanchik, B. R., Sayre, J. T., Schaffer, K. K., Shirokoff, E., Smecher, G., Stalder, B., Tucker, C.,Vanderlinde, K., Vieira, J. D., Wang, G., Williamson, R., Yefremenko, V., Yoon, K. W., and Young, E.,“South Pole Telescope software systems: control, monitoring, and data acquisition,” Proc. SPIE 8451, 286– 296 (2012).
[5] BICEP2 Collaboration, Ade, P. A. R., Aikin, R. W., Amiri, M., Barkats, D., Benton, S. J., Bischoff, C. A.,Bock, J. J., Brevik, J. A., Buder, I., Bullock, E., Davis, G., Day, P. K., Dowell, C. D., Duband, L., Filippini,J. P., Fliescher, S., Golwala, S. R., Halpern, M., Hasselfield, M., Hildebrandt, S. R., Hilton, G. C., Irwin,

K. D., Karkare, K. S., Kaufman, J. P., Keating, B. G., Kernasovskiy, S. A., Kovac, J. M., Kuo, C. L.,Leitch, E. M., Llombart, N., Lueker, M., Netterfield, C. B., Nguyen, H. T., O’Brient, R., Ogburn, R. W.,I., Orlando, A., Pryke, C., Reintsema, C. D., Richter, S., Schwarz, R., Sheehy, C. D., Staniszewski, Z. K.,Story, K. T., Sudiwala, R. V., Teply, G. P., Tolan, J. E., Turner, A. D., Vieregg, A. G., Wilson, P., Wong,C. L., and Yoon, K. W., “BICEP2. II. Experiment and three-year Data Set,” ApJ 792, 62 (Sept. 2014).
[6] Switzer, E. R., Allen, C., Amiri, M., Appel, J. W., Battistelli, E. S., Burger, B., Chervenak, J. A., Dahlen,A. J., Das, S., Devlin, M. J., Dicker, S. R., Doriese, W. B., Dunner, R., Essinger-Hileman, T., Gao, X.,Halpern, M., Hasselfield, M., Hilton, G. C., Hincks, A. D., Irwin, K. D., Knotek, S., Fisher, R. P., Fowler,J. W., Jarosik, N., Kaul, M., Klein, J., Lau, J. M., Limon, M., Lupton, R. H., Marriage, T. A., Martocci,K. L., Moseley, S. H., Netterfield, C. B., Niemack, M. D., Nolta, M. R., Page, L., Parker, L. P., Reid, B. A.,Reintsema, C. D., Sederberg, A. J., Sievers, J. L., Spergel, D. N., Staggs, S. T., Stryzak, O. R., Swetz, D. S.,Thornton, R. J., Wollack, E. J., and Zhao, Y., “Systems and control software for the Atacama CosmologyTelescope,” in [Advanced Software and Control for Astronomy II ], Bridger, A. and Radziwill, N. M., eds.,7019, 856 – 867, International Society for Optics and Photonics, SPIE (2008).
[7] Swetz, D. S., Ade, P. A. R., Amiri, M., Appel, J. W., Battistelli, E. S., Burger, B., Chervenak, J., Devlin,M. J., Dicker, S. R., Doriese, W. B., Dunner, R., Essinger-Hileman, T., Fisher, R. P., Fowler, J. W.,Halpern, M., Hasselfield, M., Hilton, G. C., Hincks, A. D., Irwin, K. D., Jarosik, N., Kaul, M., Klein, J.,Lau, J. M., Limon, M., Marriage, T. A., Marsden, D., Martocci, K., Mauskopf, P., Moseley, H., Netterfield,C. B., Niemack, M. D., Nolta, M. R., Page, L. A., Parker, L., Staggs, S. T., Stryzak, O., Switzer, E. R.,Thornton, R., Tucker, C., Wollack, E., and Zhao, Y., “Overview of the Atacama Cosmology Telescope:Receiver, Instrumentation, and Telescope Systems,” The Astrophysical Journal Supplement Series 194, 41(June 2011).
[8] Thornton, R. J., Ade, P. A. R., Aiola, S., Angile, F. E., Amiri, M., Beall, J. A., Becker, D. T., Cho, H.-M.,Choi, S. K., Corlies, P., Coughlin, K. P., Datta, R., Devlin, M. J., Dicker, S. R., Dunner, R., Fowler, J. W.,Fox, A. E., Gallardo, P. A., Gao, J., Grace, E., Halpern, M., Hasselfield, M., Henderson, S. W., Hilton,G. C., Hincks, A. D., Ho, S. P., Hubmayr, J., Irwin, K. D., Klein, J., Koopman, B., Li, D., Louis, T.,Lungu, M., Maurin, L., McMahon, J., Munson, C. D., Naess, S., Nati, F., Newburgh, L., Nibarger, J.,Niemack, M. D., Niraula, P., Nolta, M. R., Page, L. A., Pappas, C. G., Schillaci, A., Schmitt, B. L., Sehgal,N., Sievers, J. L., Simon, S. M., Staggs, S. T., Tucker, C., Uehara, M., Lanen, J. v., Ward, J. T., andWollack, E. J., “The Atacama Cosmology Telescope: The Polarization-Sensitive ACTPol Instrument,” TheAstrophysical Journal Supplement Series 227, 21 (Dec. 2016).
[9] Koopman, B. J., Detector Development and Polarization Analyses for the Atacama Cosmology Telescope,PhD thesis, Cornell U. (2018).
[10] Harrington, N., Constraints on Short Lived Signals at 150 GHz, PhD thesis, University of California, Berke-ley (2018). https://escholarship.org/uc/item/7jv1d54w.
[11] Kernasovskiy, S. A., Kuenstner, S. E., Karpel, E., Ahmed, Z., Van Winkle, D. D., Smith, S., Dusatko, J.,Frisch, J. C., Chaudhuri, S., Cho, H. M., Dober, B. J., Henderson, S. W., Hilton, G. C., Hubmayr, J.,Irwin, K. D., Kuo, C. L., Li, D., Mates, J. A. B., Nasr, M., Tantawi, S., Ullom, J., Vale, L., and Young,B., “SLAC Microresonator Radio Frequency (SMuRF) Electronics for Read Out of Frequency-Division-Multiplexed Cryogenic Sensors,” arXiv:1805.08363 [astro-ph] (May 2018). Comment: 7 pages, 5 figures,Submitted to the Journal of Low Temperature Physics (Proceedings of the 17th International Workshop onLow Temperature Detectors).

Table
1.
Sum
mary
of
curr
ent
and
indev
elopm
entocs
Agen
ts.
Core
ocs
Agen
tsare
mark
edby
an
ast
eris
k.
All
oth
erA
gen
tslist
edare
kep
tw
ithsocs.
Agent
Hard
ware
/S
oft
ware
Develo
pm
ent
Sta
tus
Desc
rip
tion
Agg
rega
torA
gent∗
Hou
seke
epin
gA
rch
ive
Inu
seS
aves
HK
dat
afr
om
feed
sto
.g3
file
sin
the
HK
arc
hiv
e.B
luef
orsA
gent
Blu
efor
sL
D40
0D
ilu
tion
Ref
riger
ato
rIn
use
Pars
esan
dp
ass
eslo
gs
from
LD
400
soft
ware
toocs.
Cry
omec
hC
PA
Age
nt
Cry
omec
hC
PA
Mod
elC
om
pre
ssors
Inu
seC
om
mu
nic
ate
sw
ith
com
pre
ssor
over
Eth
ern
etto
reco
rdop
erati
on
sst
ati
stic
s.O
n/O
ffco
ntr
ol
stil
lin
dev
elop
men
t.C
HW
PA
gent
Cu
stom
Bu
ilt
Cry
ogen
icH
WP
Un
der
dev
el-
op
men
tC
om
man
dan
dco
ntr
ol
cryo
gen
ich
alf
wav
ep
late
(CH
WP
)h
ard
ware
.D
SE
Age
nt
Dee
pS
eaE
lect
ron
ics
Contr
oll
erU
nd
erd
evel
-op
men
tC
oll
ect
die
sel
gen
erato
rst
ati
stic
sov
erm
od
bu
sin
terf
ace
.
Hos
tMas
terA
gent∗
ocs
Age
nts
Inu
seO
pti
on
al
Agen
tto
start
an
dst
op
Agen
tin
stan
ces.
Use
ful
for
run
nin
gA
gen
tsou
tsid
eof
Dock
erco
nta
iner
s.iB
oot
bar
Age
nt
iBoot
Bar
PD
Us
Ind
evel
op
-m
ent
Mon
itor
an
dco
ntr
ol
man
aged
pow
erd
istr
ibu
tion
un
its
(PD
Us)
for
rem
ote
pow
ercy
clin
gof
elec
tron
ics.
Infl
uxD
BA
gent∗
Infl
ux
Dat
abas
eIn
use
Rec
ord
HK
data
feed
sto
Infl
ux
data
base
for
vie
win
gin
Gra
fan
a.
Lak
esh
ore3
72A
gent
Lak
esh
ore
372
Res
ista
nce
Bri
dge
Inu
se100
mK
ther
mom
eter
read
ou
tan
dh
eate
rco
ntr
ol
for
dil
u-
tion
refr
iger
ator
op
erati
on
.L
akes
hor
e240
Age
nt
Lak
esh
ore
240
Inp
ut
Mod
ule
Inu
se1K
-300K
ther
mom
eter
read
ou
t.L
abJac
kA
gent
Lab
Jac
kT
4/T
7In
use
Com
mu
nic
ate
sw
ith
aL
ab
Jack
over
Eth
ern
etfo
rgen
eric
DA
C.
Use
din
warm
ther
mom
etry
read
ou
t.P
fieff
erA
gent
Pfi
effer
TP
G36
6In
use
Six
chan
nel
pre
ssu
regau
ge
contr
oll
erre
ad
ou
tov
erE
ther
-n
et.
Use
dto
mon
itor
pre
ssu
res
wit
hin
vacu
um
syst
ems
of
the
dil
uti
on
refr
iger
ato
rs.
Mei
nb
ergM
1000
Age
nt
Mei
nb
erg
LA
NT
IME
M1000
Inu
seM
on
itor
hea
lth
of
Mei
nb
erg
M1000
tim
ing
syst
emvia
the
Sim
ple
Net
work
Man
agem
ent
Pro
toco
l(S
NM
P).
Reg
istr
yA
gent∗
ocs
Age
nts
Un
der
dev
el-
op
men
tT
rack
sth
est
ate
of
oth
erru
nnin
gocs
Agen
tson
the
net
-w
ork
.S
CP
IPS
UA
gent
SC
PI
Com
pat
ible
PS
Us
Inu
seC
om
man
dan
dco
ntr
ol
pow
ersu
pp
lies
com
pati
ble
wit
hS
tan
dard
Com
man
ds
for
Pro
gra
mm
ab
leIn
stru
men
tsco
m-
mu
nic
ati
on
pro
toco
l.S
yn
acce
ssA
gent
Syn
acce
ssP
DU
sIn
use
Mon
itor
an
dco
ntr
ol
man
aged
PD
Us
for
rem
ote
pow
ercy
-cl
ing
of
elec
tron
ics.
UP
SA
gent
UP
SB
atte
ryB
acku
ps
Ind
evel
op
-m
ent
Mon
itor
state
of
SN
MP
com
pati
ble
UP
Sb
att
ery
back
up
s.

Table 2. Acronyms.
Acronym Meaning or ExplanationACT The Atacama Cosmology TelescopeACU Antenna Control UnitAPI Application Programming InterfaceBICEP Background Imaging of Cosmic Extragalactic Polarization TelescopeBNC Bayonet Neill–Concelman, a common coaxial connector typeCI Continuous IntegrationCPU Central processing unitCSS Cascading Style SheetsCWHP Cryogenic Half-wave PlateDR Dilution RefrigeratorEPICS Experimental Physics and Industrial Control SystemFPGA Field-programmable gate array.g3 Short term for referring to spt3g software
GCP General Control Program, control software used in past CMB experimentsGPS Global Positioning SystemGUI Graphical user interfaceHK Housekeeping data (i.e. non-detector data)HTML Hypertext Markup LanguageHTTP(S) Hypertext Transfer Protocol (Secure)IRIG Inter-Range Instrumentation GroupLAT Large Aperture TelescopeNUC Intel’s “Next Unit of Computing”PC Personal computerPPS Pulse per secondPTP Precision Time ProtocolPubsub Publish/Subscribeocs Observatory Control SystemRAID Redundant Array of Independent DisksRAM Random-access memoryRPC Remote procedure callSAT Small Aperture TelescopeSCF OCS Site Configuration FileSLAC SLAC National Accelerator LaboratorySMuRF SLAC Microresonator Radio FrequencySPT South Pole TelescopeSO Simons Observatorysocs Simons Observatory Control SystemSPT3G The South Pole Telescope 3rd Generation, can also refer to the spt3g software packageTCP Transmission Control ProtocolTES Transition Edge SensorUCSD University of California, San DiegoUDP User Datagram ProtocolµMUX Microwave multiplexingUPS Uninterruptible power supplyUSB Universal Serial BusWAMP Web Application Messaging ProtocolYAML Yet Another Markup Language