Plastic Shrinkage Cracking of Concrete Report number: ISI2012-17
Journal of Babylon University/Engineering Sciences/ No.(4)/ Vol.(25): 2017
2463
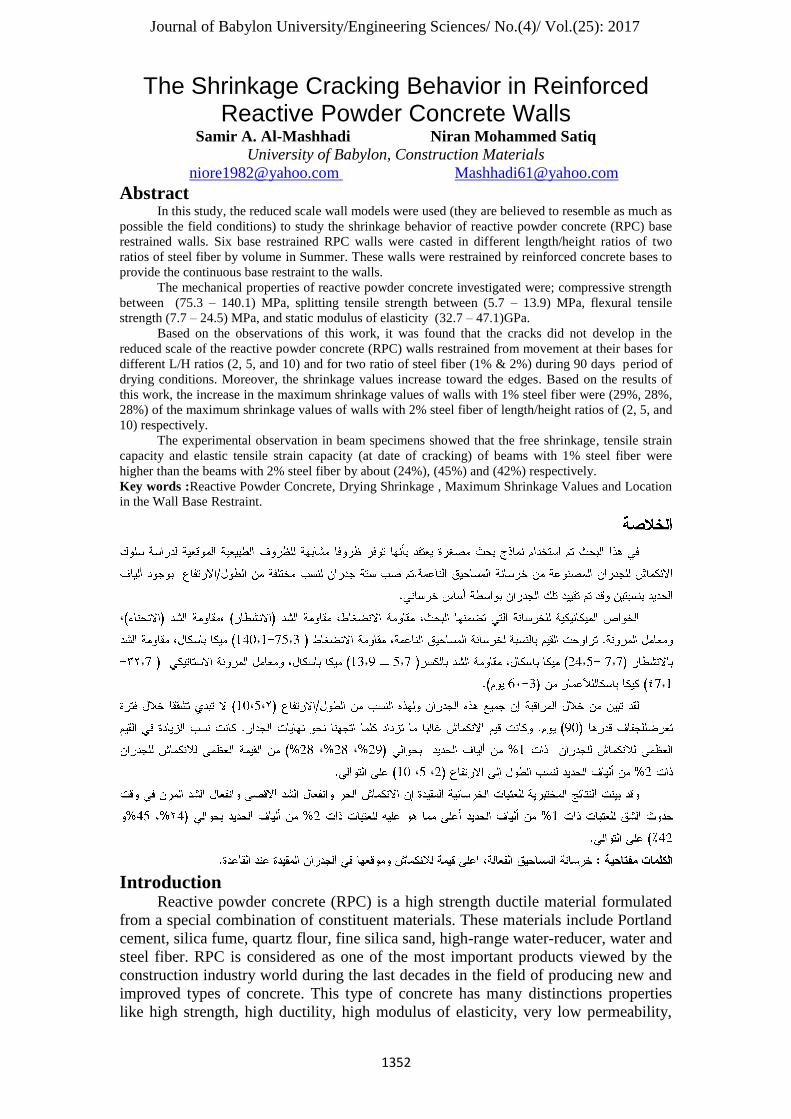
The Shrinkage Cracking Behavior in Reinforced Reactive Powder Concrete Walls
Samir A. Al-Mashhadi Niran Mohammed Satiq
University of Babylon, Construction Materials [email protected] [email protected]
Abstract In this study, the reduced scale wall models were used (they are believed to resemble as much as
possible the field conditions) to study the shrinkage behavior of reactive powder concrete (RPC) base
restrained walls. Six base restrained RPC walls were casted in different length/height ratios of two
ratios of steel fiber by volume in Summer. These walls were restrained by reinforced concrete bases to
provide the continuous base restraint to the walls.
The mechanical properties of reactive powder concrete investigated were; compressive strength
between (75.3 – 140.1) MPa, splitting tensile strength between (5.7 – 13.9) MPa, flexural tensile
strength (7.7 – 24.5) MPa, and static modulus of elasticity (32.7 – 47.1)GPa.
Based on the observations of this work, it was found that the cracks did not develop in the
reduced scale of the reactive powder concrete (RPC) walls restrained from movement at their bases for
different L/H ratios (2, 5, and 10) and for two ratio of steel fiber (1% & 2%) during 90 days period of
drying conditions. Moreover, the shrinkage values increase toward the edges. Based on the results of
this work, the increase in the maximum shrinkage values of walls with 1% steel fiber were (29%, 28%,
28%) of the maximum shrinkage values of walls with 2% steel fiber of length/height ratios of (2, 5, and
10) respectively.
The experimental observation in beam specimens showed that the free shrinkage, tensile strain
capacity and elastic tensile strain capacity (at date of cracking) of beams with 1% steel fiber were
higher than the beams with 2% steel fiber by about (24%), (45%) and (42%) respectively.
Key words :Reactive Powder Concrete, Drying Shrinkage , Maximum Shrinkage Values and Location
in the Wall Base Restraint.
٬
٫٫
٫٫٫٫٫
٫
٬ ٬
٬٬
٬٬
Introduction Reactive powder concrete (RPC) is a high strength ductile material formulated
from a special combination of constituent materials. These materials include Portland
cement, silica fume, quartz flour, fine silica sand, high-range water-reducer, water and
steel fiber. RPC is considered as one of the most important products viewed by the
construction industry world during the last decades in the field of producing new and
improved types of concrete. This type of concrete has many distinctions properties
like high strength, high ductility, high modulus of elasticity, very low permeability,
Journal of Babylon University/Engineering Sciences/ No.(4)/ Vol.(25): 2017
2464
and high impact resistance as compared with the ordinary and the high performance
concrete. Due to the higher cement content, the shrinkage deformation of RPC was
large.The effect of the steel fibers in RPC mixtures is to reduce the shrinkage by
restraining effect offered by the fibers.(Allena and Newtson, 2013).
Garas et.al., 2008 have reported a reduction in free shrinkage by about 50% and
autogenous shrinkage by about 42% when 2% of steel fibers (by volume) is added to
RPC mixture.The durability of RPC is comparable to that of the natural rocks with
very low permeability and it is resistant to carbonation. After early age heat treatment,
there is almost neither shrinkage nor creep.
Reactive powder concrete suffers an autogenous shrinkage strain of about 500 x
10-6
. The shrinkage is essentially the result of the chemical reactions within the RPC
and is not the same as the drying shrinkage in conventional concretes. As a result,
even for RPC cured at room temperatures, the great majority of the shrinkage occurs
in the first 28 days after casting.(Michael, 2012).
Ian, 2000; György, 2009 found that the autogenous shrinkage of RPC is very
pronounced and may reach values beyond 1200 10-6
. When such measurement starts
e.g. at the concrete age of one day, most of the autogenous shrinkage, which develops
mainly between an age of 8 to 24 hours, has already taken place and is consequently
not recorded.
The microfiber reinforcement reduces the inherent brittleness of the concrete,
especially RPC. Fibers spaced at the micron scale can interact with the microcracks,
delay localization and increase the tensile strength of the matrix. In addition,
microfiber reinforcement delays the age of the first visible crack and reduces the crack
width in the restrained shrinkage tests. The performance of fiber-reinforced concrete
(FRC) is governed by the ratio of the elastic modulus of the matrix, strength of fiber-
matrix bond, aspect ratio (fiber length/fiber diameter) of the fiber, and the material
properties of the fiber. Only relatively small amounts, usually less than 1% by
volume, of fiber reinforcement can be added to the conventional concrete because the
fibers significantly reduce the workability of the fresh concrete. At this dosage, the
fibers can improve shrinkage cracking resistance and slightly enhance the ductility.
To maximize these benefits and produce a strain-hardening response, larger doses
must be added to the matrix. (Anson et.al., 2002).
Experimental Work
Materials
Aljisir locally available ordinary Portland cement Type V (OPC) was used in all
concrete mixtures The chemical composition shown in Table (1). The local natural
sand obtained from Najef sources in Iraq, all particles of RPC separated sand were
greater than 600µm and smaller than 150 µm; and they were removed by sieving, as
presented in Table (2). Micro silica made in U.A.E commix LTD; P.O. Box
5936.Sharjah was used throughout this research. A superplasticizer (high range water
reducing)called Glenium 54 was used. Micro steel fibers used throughout the
experimental program were manufactured by Changzhou Luqiao Building Materials
Company, China.
Journal of Babylon University/Engineering Sciences/ No.(4)/ Vol.(25): 2017
2465
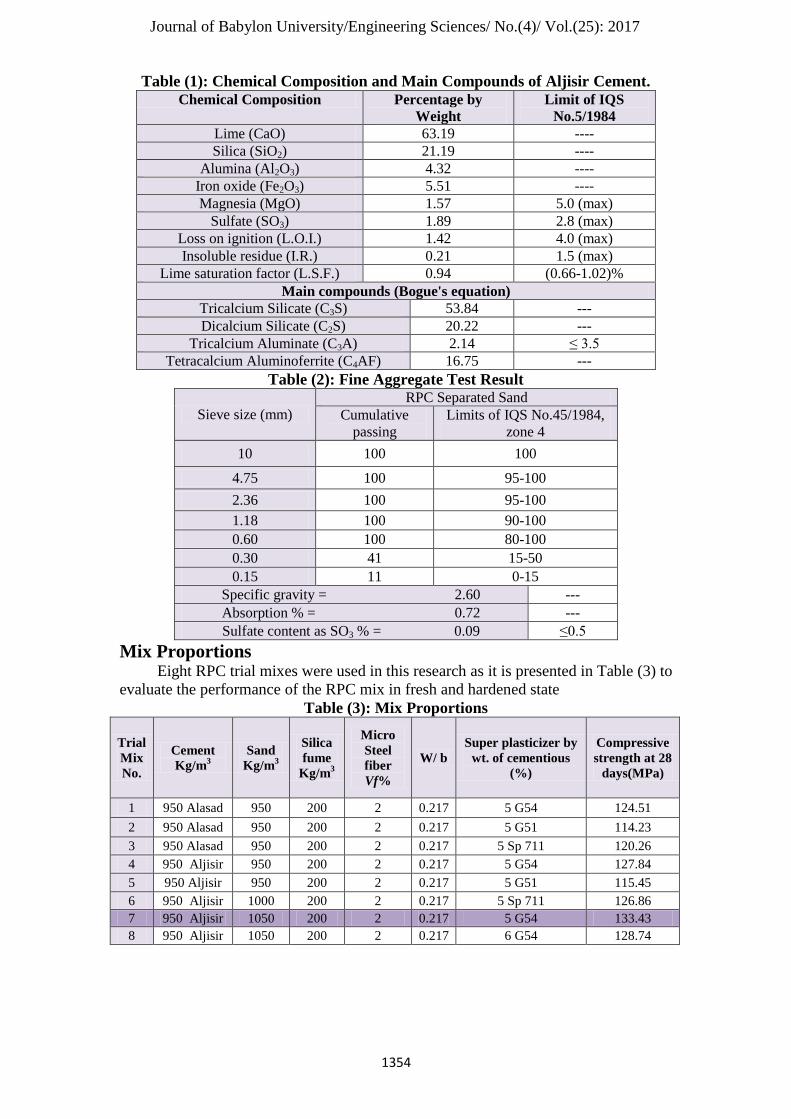
Table (1): Chemical Composition and Main Compounds of Aljisir Cement.
Chemical Composition Percentage by
Weight
Limit of IQS
No.5/1984
Lime (CaO) 63.19 ----
Silica (SiO2) 21.19 ----
Alumina (Al2O3) 4.32 ----
Iron oxide (Fe2O3) 5.51 ----
Magnesia (MgO) 1.57 5.0 (max)
Sulfate (SO3) 1.89 2.8 (max)
Loss on ignition (L.O.I.) 1.42 4.0 (max)
Insoluble residue (I.R.) 0.21 1.5 (max)
Lime saturation factor (L.S.F.) 0.94 (0.66-1.02)%
Main compounds (Bogue's equation)
Tricalcium Silicate (C3S) 53.84 ---
Dicalcium Silicate (C2S) 20.22 ---
Tricalcium Aluminate (C3A) 2.14 ≤ 3.5
Tetracalcium Aluminoferrite (C4AF) 16.75 ---
Table (2): Fine Aggregate Test Result
Sieve size (mm)
RPC Separated Sand
Cumulative
passing
Limits of IQS No.45/1984,
zone 4
10 100 100
4.75 100 95-100
2.36 100 95-100
1.18 100 90-100
0.60 100 80-100
0.30 41 15-50
0.15 11 0-15
Specific gravity = 2.60 ---
Absorption % = 0.72 ---
Sulfate content as SO3 % = 0.09 ≤0.5
Mix Proportions Eight RPC trial mixes were used in this research as it is presented in Table (3) to
evaluate the performance of the RPC mix in fresh and hardened state
Table (3): Mix Proportions
Trial
Mix
No.
Cement
Kg/m3
Sand
Kg/m3
Silica
fume
Kg/m3
Micro
Steel
fiber
Vf%
W/ b
Super plasticizer by
wt. of cementious
(%)
Compressive
strength at 28
days(MPa)
1 950 Alasad 950 200 2 0.217 5 G54 124.51
2 950 Alasad 950 200 2 0.217 5 G51 114.23
3 950 Alasad 950 200 2 0.217 5 Sp 711 120.26
4 950 Aljisir 950 200 2 0.217 5 G54 127.84
5 950 Aljisir 950 200 2 0.217 5 G51 115.45
6 950 Aljisir 1000 200 2 0.217 5 Sp 711 126.86
7 950 Aljisir 1050 200 2 0.217 5 G54 133.43
8 950 Aljisir 1050 200 2 0.217 6 G54 128.74
Journal of Babylon University/Engineering Sciences/ No.(4)/ Vol.(25): 2017
2466
Molds : The molds in this research were as follows:
1- (50 50 50) mm cubes to obtain concrete specimens for compressive strength test.
2- (100 200) mm cylinders to obtain concrete specimens for splitting tensile strength
and modulus of elasticity test.
3- (100 100 300) mm prisms to obtain concrete specimens for flexural tensile
strength test.
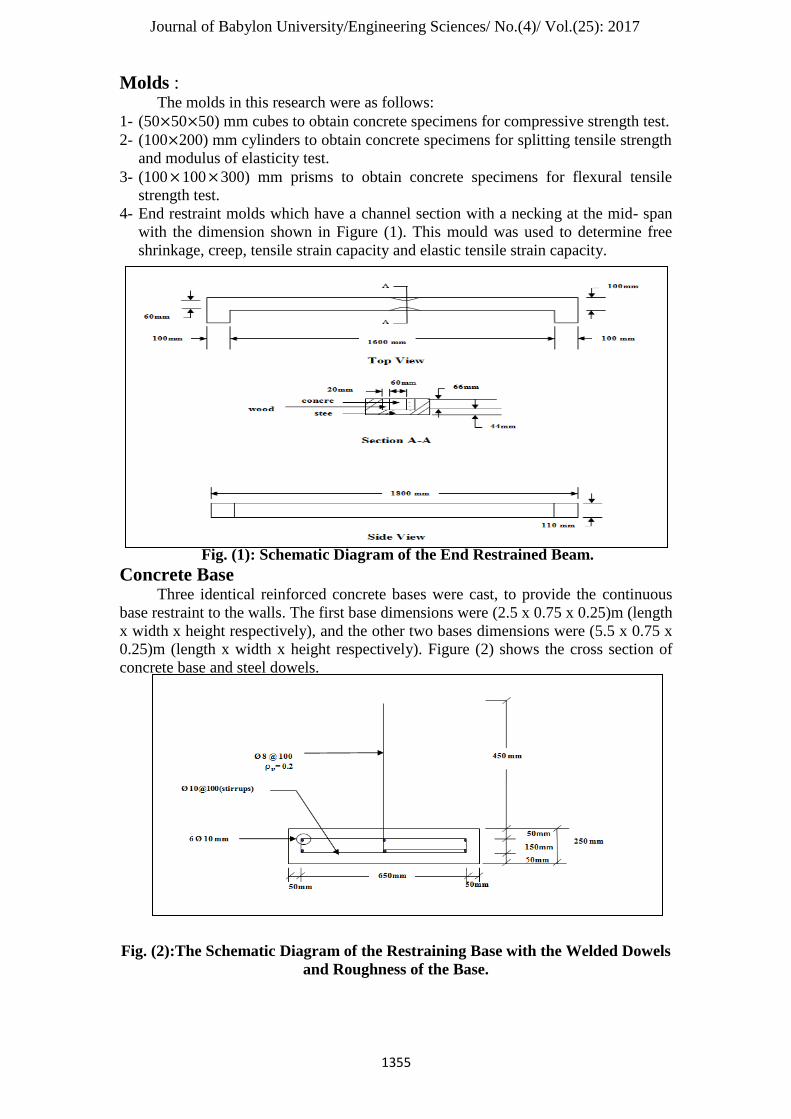
4- End restraint molds which have a channel section with a necking at the mid- span
with the dimension shown in Figure (1). This mould was used to determine free
shrinkage, creep, tensile strain capacity and elastic tensile strain capacity.
Fig. (1): Schematic Diagram of the End Restrained Beam.
Concrete Base
Three identical reinforced concrete bases were cast, to provide the continuous
base restraint to the walls. The first base dimensions were (2.5 x 0.75 x 0.25)m (length
x width x height respectively), and the other two bases dimensions were (5.5 x 0.75 x
0.25)m (length x width x height respectively). Figure (2) shows the cross section of
concrete base and steel dowels.
Fig. (2):The Schematic Diagram of the Restraining Base with the Welded Dowels
and Roughness of the Base.
Journal of Babylon University/Engineering Sciences/ No.(4)/ Vol.(25): 2017
2467
Wall Notation The RPC walls which contain a six 50 mm thickness concrete walls reinforced
with a steel fiber ratio (1% and 2%) were casted in Summer season, as shown in
Table(4).
Table (4): Walls Characteristics.
Wall Notation Length
mm
Height
mm
L/H
Ratio
Steel fiber
content Vf%
RPC2-1* 1000 500 2 1
RPC2-2 1000 500 2 2
RPC5-1 2500 500 5 1
RPC5-2 2500 500 5 2
RPC10-1 2500 250 10 1
RPC10-2 2500 250 10 2
*RPC2-1 RPC: Reactive powder concrete wall 2: L/H ratio 1: Steel fiber content Vf%
Mixing and Casting of Walls The mixing method was important to obtain the required necessary homogeneity
and workability of the concrete mix. RPC was mixed by putting cementious materials
(the required quantity of cement was mixed in dry state with the micro silica fume)
into a container and dry mixed using a spiral hand mixer. Then, fine sand was added
into the container and they were mixed. The required amount of water and super
plasticizers were added and the mixing process continued, and then when the
consistency is achieved, the fibers were added slowly and mixing process continued
until the dispersion was evident.
Curing and Exposure to Drying To prevent plastic shrinkage cracking due to rapid evaporation from the upper
surface of the walls, the wetted hessian sheets and the polythene sheets were used to
cover the walls after the final lift was cast. The formwork was removed after 24 hours
from the casting and then the walls were covered with the wetted hessian sheets and
the polythene sheets for 7 days. The same curing procedure was applied to cubes,
cylinders, prisms and beams.
Results and Discussions
Restrained Shrinkage of the Walls The measurement of longitudinal movement of the walls was carried out to
investigate the effect of base restraint of the walls on the shrinkage behavior. These
measurements were conducted for a drying period of 90 days in Summer. Table (5)
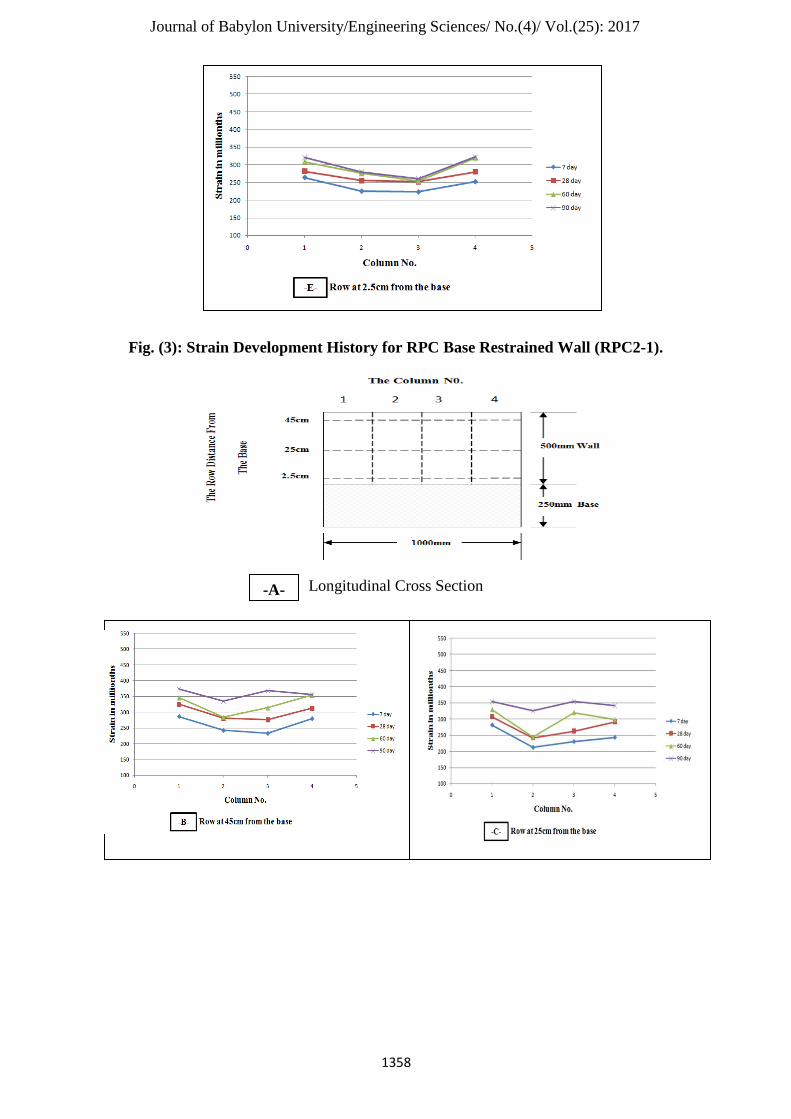
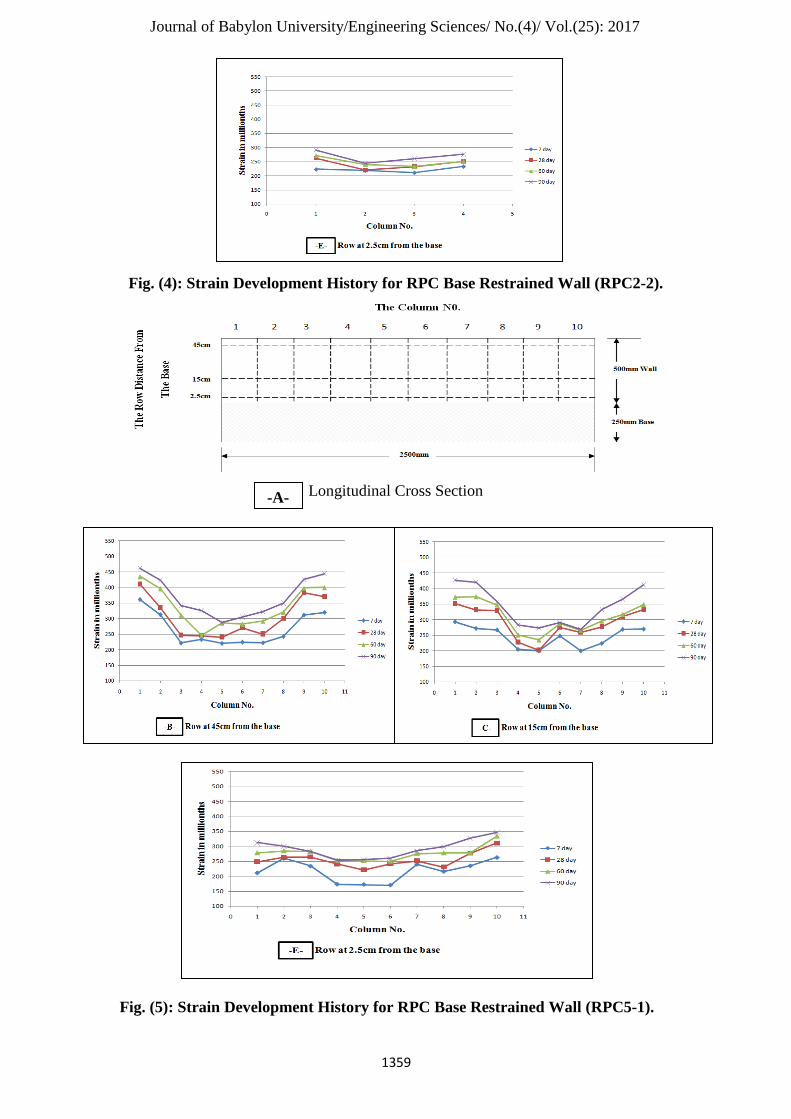
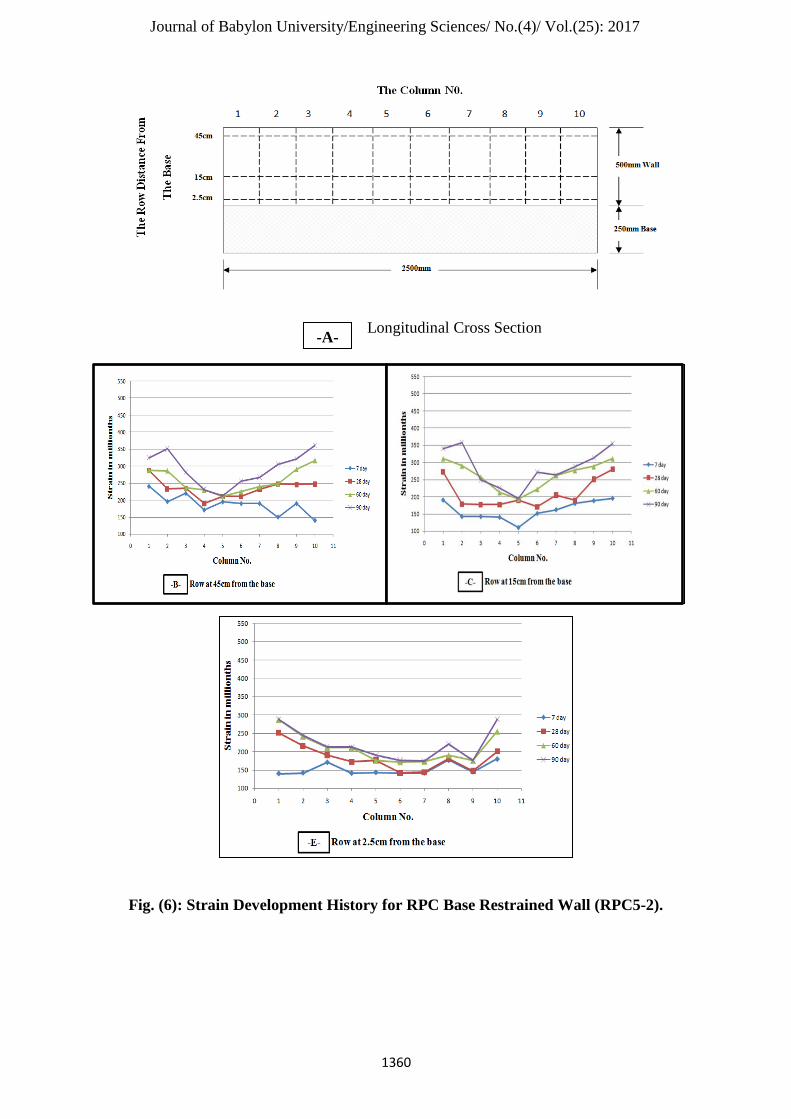
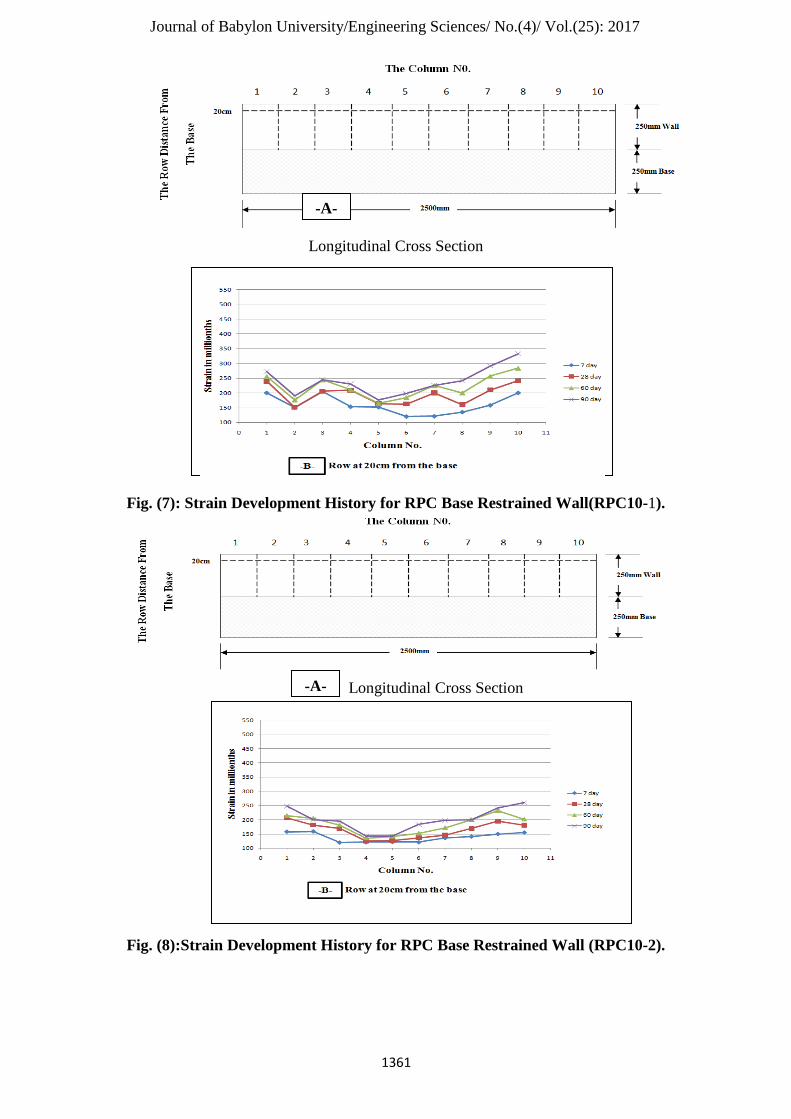
and Figures (3 to 8) show the restrained shrinkage strain development with age at 3
rows ( 25, 250 and 450 mm distance from the base) for the walls of 500mm height
and 1000mm length, 3 rows (25, 150 and 450 distance from the base) for the walls of
500mm height and 2500mm length and 1 row (200mm distance from the base) for the
walls of 250mm height and 2500mm length.
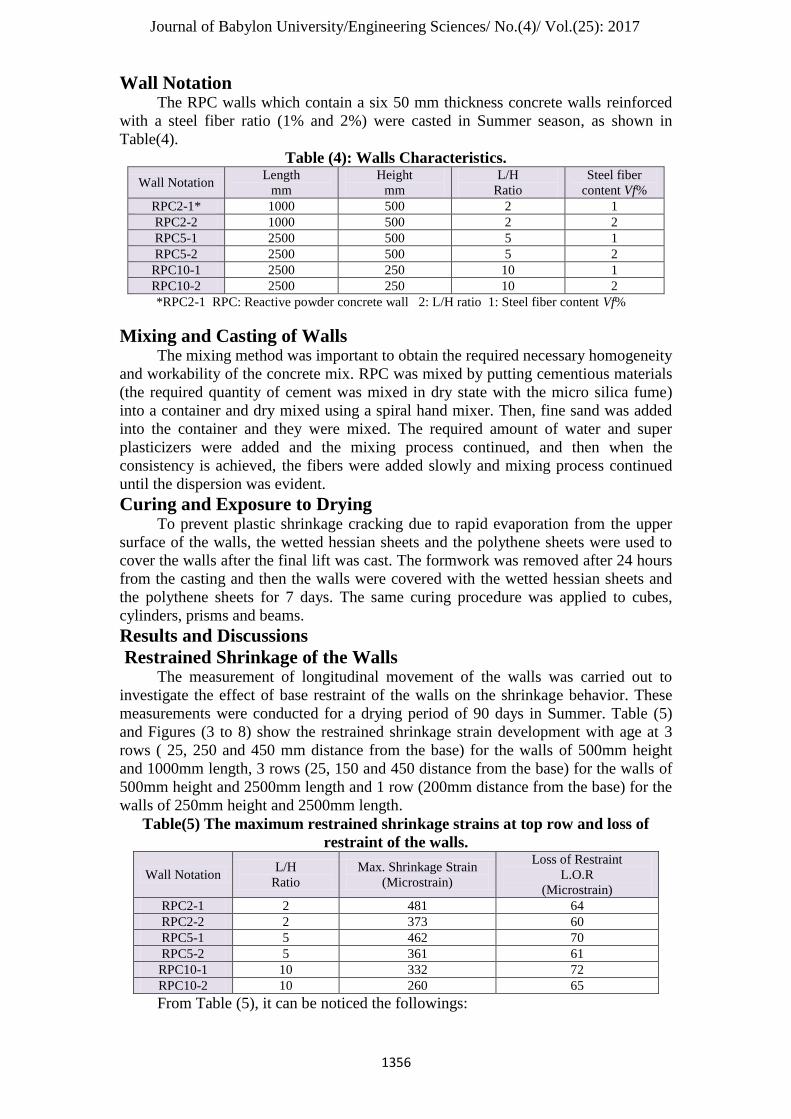
Table(5) The maximum restrained shrinkage strains at top row and loss of
restraint of the walls.
Wall Notation L/H
Ratio
Max. Shrinkage Strain
(Microstrain)
Loss of Restraint
L.O.R
(Microstrain)
RPC2-1 2 481 64
RPC2-2 2 373 60
RPC5-1 5 462 70
RPC5-2 5 361 61
RPC10-1 10 332 72
RPC10-2 10 260 65
From Table (5), it can be noticed the followings:
Journal of Babylon University/Engineering Sciences/ No.(4)/ Vol.(25): 2017
2468
1- The maximum shrinkage strains were found to be decreasing with increasing in
L/H ratios for two ratio(1% & 2%) of steel fiber walls. This may be attributed to
the fact that the action of restraint is increasing with the increasing of L/H ratio,
this agrees with (AL-Ta'ee, 2008) study of high strength concrete.
2- There is an increase in the maximum shrinkage values of walls with 1% steel fiber
by about (29%, 28%, 27.6%) of the maximum shrinkage values of walls with 2%
steel fiber for walls with length/height ratio (2, 5, and 10) respectively. This due to
the addition of further fibers which improve the tensile cracking resistance, post
cracking strength, ductility and energy absorption capacity.
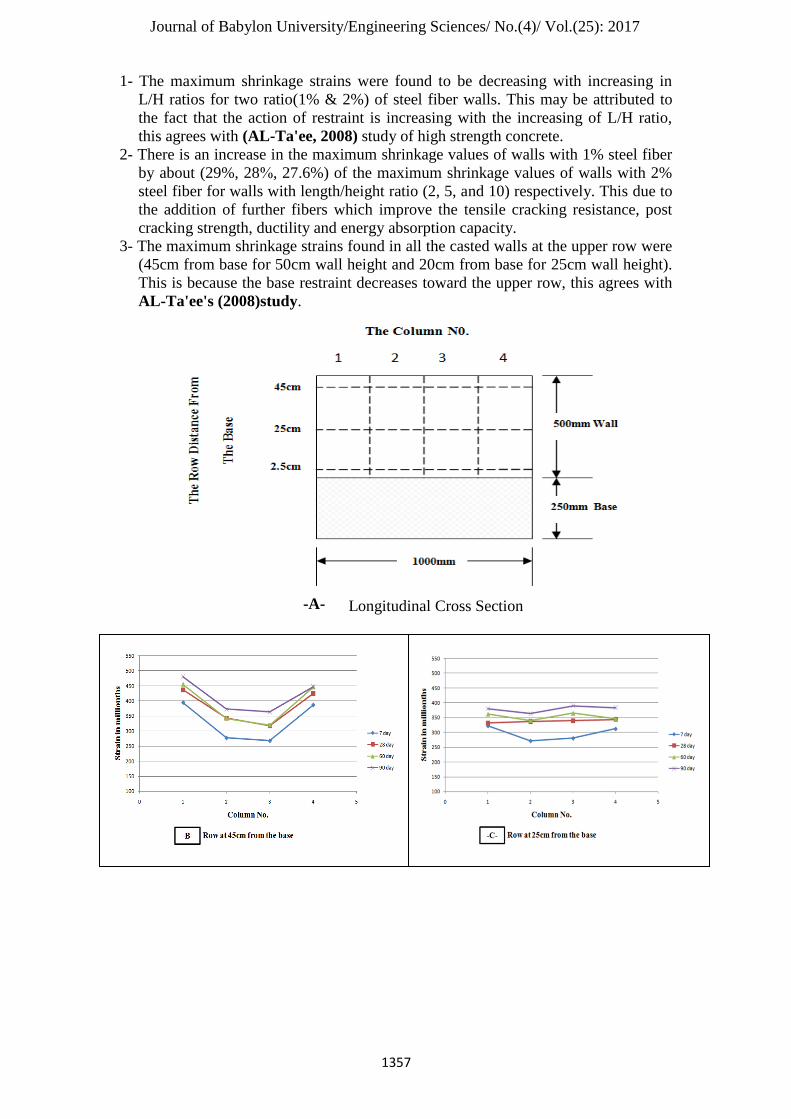
3- The maximum shrinkage strains found in all the casted walls at the upper row were
(45cm from base for 50cm wall height and 20cm from base for 25cm wall height).
This is because the base restraint decreases toward the upper row, this agrees with
AL-Ta'ee's (2008)study.
Longitudinal Cross Section
-A-
Journal of Babylon University/Engineering Sciences/ No.(4)/ Vol.(25): 2017
2469
Fig. (3): Strain Development History for RPC Base Restrained Wall (RPC2-1).
Longitudinal Cross Section
-A-
Journal of Babylon University/Engineering Sciences/ No.(4)/ Vol.(25): 2017
246:
Fig. (4): Strain Development History for RPC Base Restrained Wall (RPC2-2).
Longitudinal Cross Section
Fig. (5): Strain Development History for RPC Base Restrained Wall (RPC5-1).
-A-
Journal of Babylon University/Engineering Sciences/ No.(4)/ Vol.(25): 2017
2471
Longitudinal Cross Section
Fig. (6): Strain Development History for RPC Base Restrained Wall (RPC5-2).
-A-
Journal of Babylon University/Engineering Sciences/ No.(4)/ Vol.(25): 2017
2472
Longitudinal Cross Section
Fig. (7): Strain Development History for RPC Base Restrained Wall(RPC10-1).
Longitudinal Cross Section
Fig. (8):Strain Development History for RPC Base Restrained Wall (RPC10-2).
-A-
-A-
Journal of Babylon University/Engineering Sciences/ No.(4)/ Vol.(25): 2017
2473
From Figures (3 to 8), it can be noticed that:
1- The shrinkage strains in the exterior columns were more than the shrinkage strains
in the interior columns of most walls. This may be attributed to the large surface
area which is subjected to the drying conditions
2- There is a continuous increasing in the shrinkage strains with age. This indicates
that no crack occurrence. This may be due to the dense microstructure and
presence of steel fibers in RPC mixtures which provide superior mechanical
properties (high strength, ductility, and toughness)
3- There are certain values in the row 2.5cm from the base in all walls although its
position is very close to the base. This is may be due to some slippage which
occurs between base and wall and due to the loss of restraint which comes from
contraction of the base.
Cracking of The Walls
Theoretically, the first crack must occur at the centre of the wall and it starting
from base, this can be attributed to the highest values of the degrees of restraint at this
position (ACI 207, 1973). In spite of the long observation period (90 days) of all
RPC walls, no crack occurrence at any place was observed.
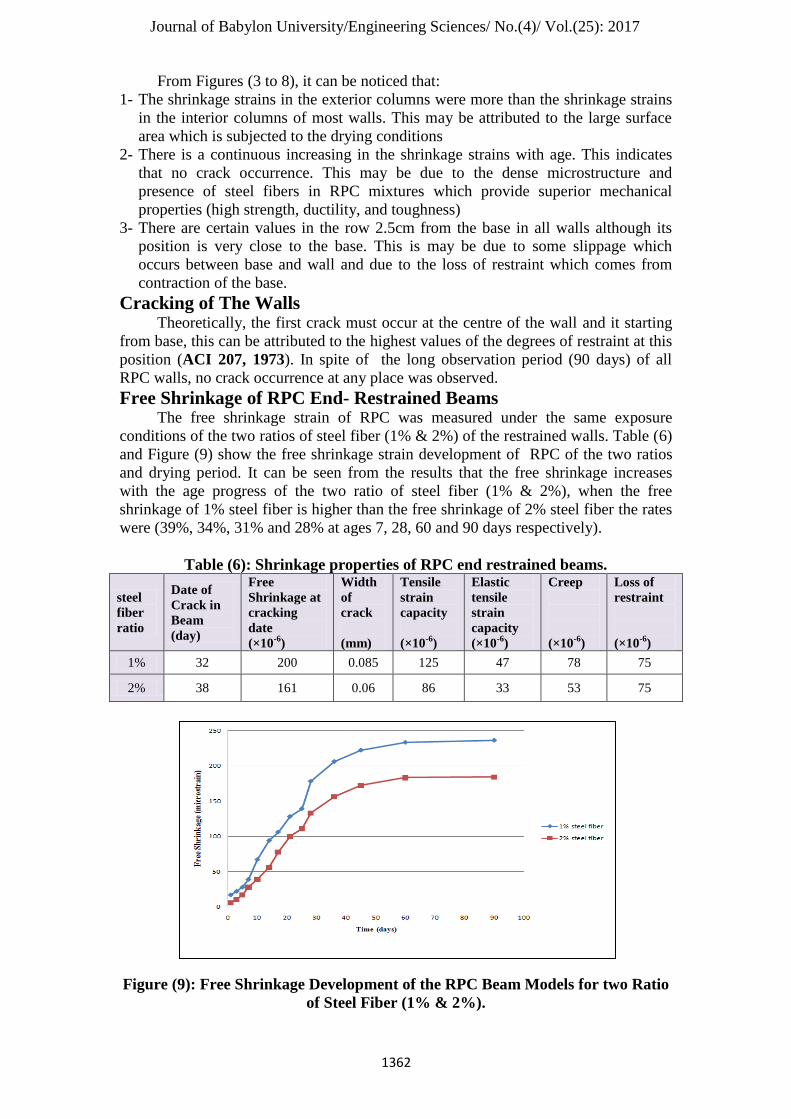
Free Shrinkage of RPC End- Restrained Beams
The free shrinkage strain of RPC was measured under the same exposure
conditions of the two ratios of steel fiber (1% & 2%) of the restrained walls. Table (6)
and Figure (9) show the free shrinkage strain development of RPC of the two ratios
and drying period. It can be seen from the results that the free shrinkage increases
with the age progress of the two ratio of steel fiber (1% & 2%), when the free
shrinkage of 1% steel fiber is higher than the free shrinkage of 2% steel fiber the rates
were (39%, 34%, 31% and 28% at ages 7, 28, 60 and 90 days respectively).
Table (6): Shrinkage properties of RPC end restrained beams.
steel
fiber
ratio
Date of
Crack in
Beam
(day)
Free
Shrinkage at
cracking
date
(×10-6
)
Width
of
crack
(mm)
Tensile
strain
capacity
(×10-6
)
Elastic
tensile
strain
capacity
(×10-6
)
Creep
(×10-6
)
Loss of
restraint
(×10-6
)
1% 32 200 0.085 125 47 78 75
2% 38 161 0.06 86 33 53 75
Figure (9): Free Shrinkage Development of the RPC Beam Models for two Ratio
of Steel Fiber (1% & 2%).
Journal of Babylon University/Engineering Sciences/ No.(4)/ Vol.(25): 2017
2474
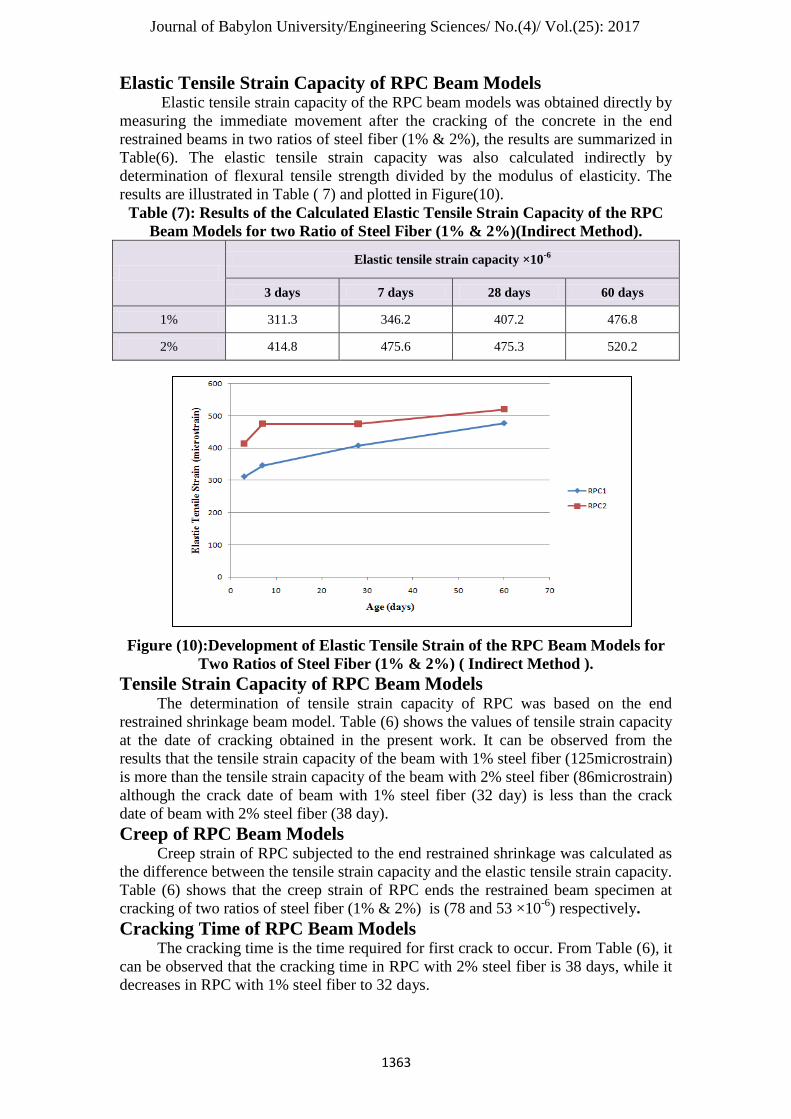
Elastic Tensile Strain Capacity of RPC Beam Models
Elastic tensile strain capacity of the RPC beam models was obtained directly by
measuring the immediate movement after the cracking of the concrete in the end
restrained beams in two ratios of steel fiber (1% & 2%), the results are summarized in
Table(6). The elastic tensile strain capacity was also calculated indirectly by
determination of flexural tensile strength divided by the modulus of elasticity. The
results are illustrated in Table ( 7) and plotted in Figure(10).
Table (7): Results of the Calculated Elastic Tensile Strain Capacity of the RPC
Beam Models for two Ratio of Steel Fiber (1% & 2%)(Indirect Method).
Elastic tensile strain capacity ×10
-6
3 days 7 days 28 days 60 days
1% 311.3 346.2 407.2 476.8
2% 414.8 475.6 475.3 520.2
Figure (10):Development of Elastic Tensile Strain of the RPC Beam Models for
Two Ratios of Steel Fiber (1% & 2%) ( Indirect Method ).
Tensile Strain Capacity of RPC Beam Models The determination of tensile strain capacity of RPC was based on the end
restrained shrinkage beam model. Table (6) shows the values of tensile strain capacity
at the date of cracking obtained in the present work. It can be observed from the
results that the tensile strain capacity of the beam with 1% steel fiber (125microstrain)
is more than the tensile strain capacity of the beam with 2% steel fiber (86microstrain)
although the crack date of beam with 1% steel fiber (32 day) is less than the crack
date of beam with 2% steel fiber (38 day).
Creep of RPC Beam Models
Creep strain of RPC subjected to the end restrained shrinkage was calculated as
the difference between the tensile strain capacity and the elastic tensile strain capacity.
Table (6) shows that the creep strain of RPC ends the restrained beam specimen at
cracking of two ratios of steel fiber (1% & 2%) is (78 and 53 ×10-6
) respectively.
Cracking Time of RPC Beam Models
The cracking time is the time required for first crack to occur. From Table (6), it
can be observed that the cracking time in RPC with 2% steel fiber is 38 days, while it
decreases in RPC with 1% steel fiber to 32 days.
Journal of Babylon University/Engineering Sciences/ No.(4)/ Vol.(25): 2017
2475
Conclusions Based on the test results and the theoretical analysis of the present work, the
following conclusions can be drawn:
Mixture Preparation and Mechanical Properties of RPC Using and increasing steel fiber volumetric content from 0% to 1% and 2%
leads to an increase in the mechanical properties of RPC as follows:
1. The compressive strength increases by 15.9% and 23.6% respectively.
2. The splitting tensile strength increases by 60.6% and 84.5% respectively.
3. The flexural strength increases by 46.8% and 78.2% respectively.
4. The modulus of elasticity increases by 4.4% and 8.6% respectively.
Experimental Results of RPC Walls 1- The experimental observations clearly indicate that the cracking did not develop in
RPC base restrained walls with L/H ( 2 , 5 and 10) for two ratio of steel fiber (1%
& 2%) during 90 day period of drying.
2- The shrinkage strain in all the RPC walls occurred at high rates at early ages of 7,
14, and 28 days. when the shrinkage results are compared with shrinkage results of
the high strength concrete & the normal concrete of the previous studies, the
shrinkage of the reactive powder concrete at early age is more than the shrinkage
of the high strength concrete & normal concrete, but at later ages it is less than the
shrinkage of the high strength concrete & the normal concrete.
3- The maximum shrinkage values increased toward the edges and top of the most
walls.
4- The maximum shrinkage strains for 1% steel fiber walls was more than of 2% steel
fiber walls by about (29%, 28%, 28%) of L/H (2, 5 and 10) respectively.
5- It was found from the end-restrained beam specimens results that the drying
shrinkage is less for reactive powder concrete than for the high strength concrete &
normal concrete.
6- The free shrinkage of the beam with 1% steel fiber (at the date of cracking) was
higher than of the beam with 2% steel fiber by about (24%) in end restrained
beams, the free shrinkage is less for reactive powder concrete than for the high
strength concrete & normal concrete.
7- The tensile strain capacity of the beam with 1% steel fiber at the date of cracking is
higher than that of the beam with 2% steel fiber about (45%) . On the other hand,
the elastic tensile strain capacity of the beam with 1% steel fiber at date of
cracking is higher than that of the beam with 2% steel fiber by about (42%), the
tensile strain capacity and the elastic tensile strain capacity at date of cracking are
less for reactive powder concrete than for the high strength concrete & normal
concrete.
8- The creep strain of the beam with 1% steel fiber, the beam with 2% steel fiber (78
and 53 microstrain), and the creep coefficient (0.15) in reactive powder concrete
are less than for high strength concrete & normal concrete.
9- The creep strain of beam with 2% steel fiber at date of cracking is higher than that
of the beam with 1% steel fiber by about (47 %).
10- The date of cracking in end restrained beam increases with the increases of steel
fiber ratio, the cracking time was of the beam with 1% steel fiber and the beam
with 2% steel fiber were (32 and 38 day).
References ACI Committee 207, 1973" Effect of Restraint, Volume Change and Rein-
forcement on Cracking of Massive Concrete ", Journalof American concrete
Institute.

Journal of Babylon University/Engineering Sciences/ No.(4)/ Vol.(25): 2017
2476
Allena S, Newtson CM. 2013"Shrinkage of ultra-high strength concrete".
IndianConcrete Journal; 87(12):53–62.
Anson, M. Ko, J. M. and Lam, E.S.S. , 2002"Advances in Building Technology
"Proceedings of the International Conference on Advances In Building
Technology [electronic resource]. 4-6 December, Hong Kong, China. Elsevier.
Fardis Editor, 2012 "Innovative Materials and Techniques in Concrete
Construction". Springer Dordrecht Heidelberg London New York, Springer
Science + Business Media B.V..
Garas VY, Kahn LF, Kurtis KE., 2008"Preliminary Investigation of the Effect of
Steel Fibers on the Tensile Creep and Shrinkage of Ultra- high
Performance Concrete",Ise-Shima, Japan, October, pp. 741–744Michacl N.
György L. Balàzs, 2009"Structural Concrete" Textbook on behavior, design
and performance. Second edition . Volume 1, pp.135
Ian R Gilbert, 2000 "Design Guidelines for Ductal Prestressed". The University of
NSW May, pp 53.
Iraqi Specification, No. 45, ", 1984"Aggregate from Natural Sources for Concrete
and Construction.
Iraqi Specification, No. 5, 1984 "Portland Cement".
Mohammed AL-Ta'ee , 2008"Drying Shrinkage of High Strength Concrete Walls
with BASE Restraint" M.Sc. Thesis, University of Babylon.