The Shape of Things to Come for P/C Insurance Markets … Shape of Things to Come for P/C Insurance...
73
The Shape of Things to Come for P/C Insurance Markets and the American Workplace Robert P. Hartwig, Ph.D., CPCU, President & Economist Insurance Information Institute 110 William Street New York, NY 10038 Tel: 212.346.5520 Cell: 917.453.1885 [email protected] www.iii.org NCCI Annual Issues Symposium Orlando, FL May 5, 2016 Download at www.iii.org/presentations
-
Upload
truongtuong -
Category
Documents
-
view
217 -
download
0
Transcript of The Shape of Things to Come for P/C Insurance Markets … Shape of Things to Come for P/C Insurance...

The Shape of Things to Come for P/C Insurance Markets and the
American Workplace
Robert P. Hartwig, Ph.D., CPCU, President & EconomistInsurance Information Institute 110 William Street New York, NY 10038
Tel: 212.346.5520 Cell: 917.453.1885 [email protected] www.iii.org
NCCI Annual Issues SymposiumOrlando, FLMay 5, 2016
Download at www.iii.org/presentations
2
P/C Insurance Industry Financial Overview
2015: Second-Best Year in the Post-Crisis Era & Carbon Copy of 2014
Modest CATs, Reserve ReleasesWorkers Comp Helped Too
2
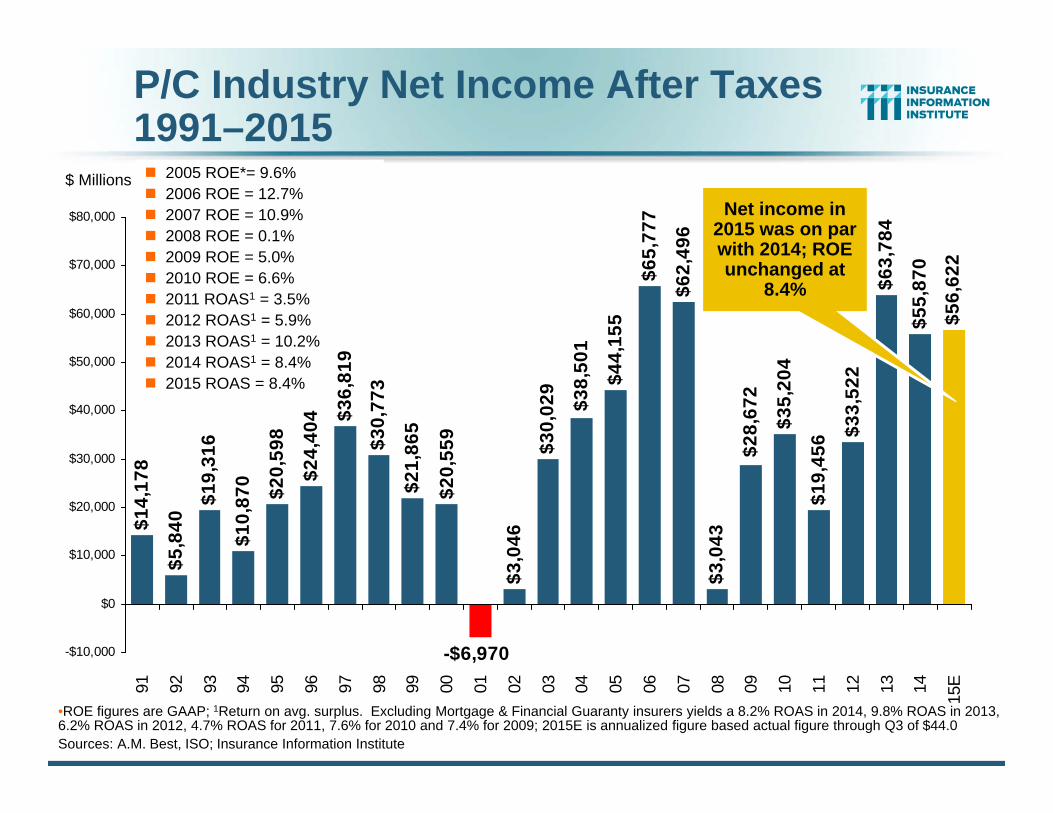
P/C Industry Net Income After Taxes1991–2015 2005 ROE*= 9.6% 2006 ROE = 12.7% 2007 ROE = 10.9% 2008 ROE = 0.1% 2009 ROE = 5.0% 2010 ROE = 6.6% 2011 ROAS1 = 3.5% 2012 ROAS1 = 5.9% 2013 ROAS1 = 10.2% 2014 ROAS1 = 8.4% 2015 ROAS = 8.4%
•ROE figures are GAAP; 1Return on avg. surplus. Excluding Mortgage & Financial Guaranty insurers yields a 8.2% ROAS in 2014, 9.8% ROAS in 2013, 6.2% ROAS in 2012, 4.7% ROAS for 2011, 7.6% for 2010 and 7.4% for 2009; 2015E is annualized figure based actual figure through Q3 of $44.0Sources: A.M. Best, ISO; Insurance Information Institute
$14,
178
$5,8
40$1
9,31
6
$10,
870 $20,
598
$24,
404 $3
6,81
9$3
0,77
3
$21,
865
$3,0
46$3
0,02
9
$62,
496
$3,0
43
$35,
204
$19,
456 $3
3,52
2$6
3,78
4
$55,
870
$56,
622
$38,
501
$20,
559
$44,
155
$65,
777
-$6,970
$28,
672
-$10,000
$0
$10,000
$20,000
$30,000
$40,000
$50,000
$60,000
$70,000
$80,000
91 92 93 94 95 96 97 98 99 00 01 02 03 04 05 06 07 08 09 10 11 12 13 14 15E
Net income in 2015 was on par with 2014; ROE unchanged at
8.4%
$ Millions
-5%
0%
5%
10%
15%
20%
25%
75 76 77 78 79 80 81 82 83 84 85 86 87 88 89 90 91 92 93 94 95 96 97 98 99 00 01 02 03 04 05 06 07 08 09 10 11 12 13 14 15
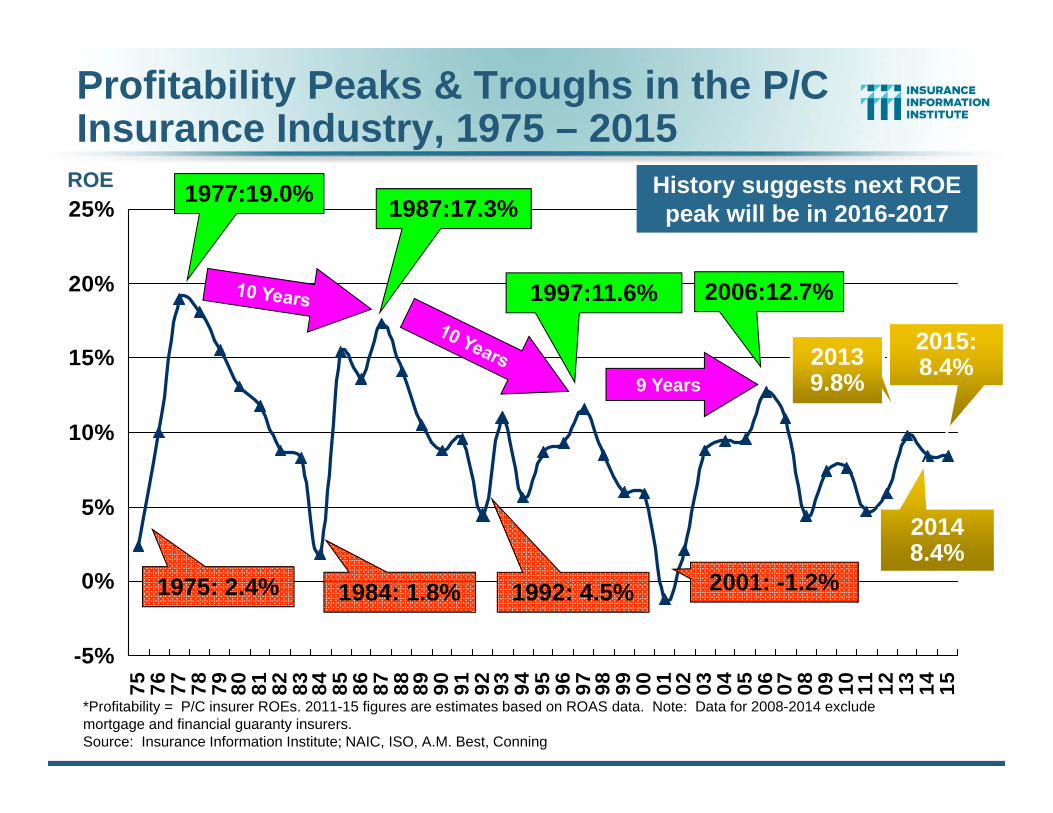
Profitability Peaks & Troughs in the P/C Insurance Industry, 1975 – 2015
*Profitability = P/C insurer ROEs. 2011-15 figures are estimates based on ROAS data. Note: Data for 2008-2014 exclude mortgage and financial guaranty insurers.Source: Insurance Information Institute; NAIC, ISO, A.M. Best, Conning
1977:19.0% 1987:17.3%
1997:11.6% 2006:12.7%
1984: 1.8% 1992: 4.5% 2001: -1.2%
9 Years
History suggests next ROE peak will be in 2016-2017
ROE
1975: 2.4%
2013 9.8%
2014 8.4%
2015: 8.4%
5
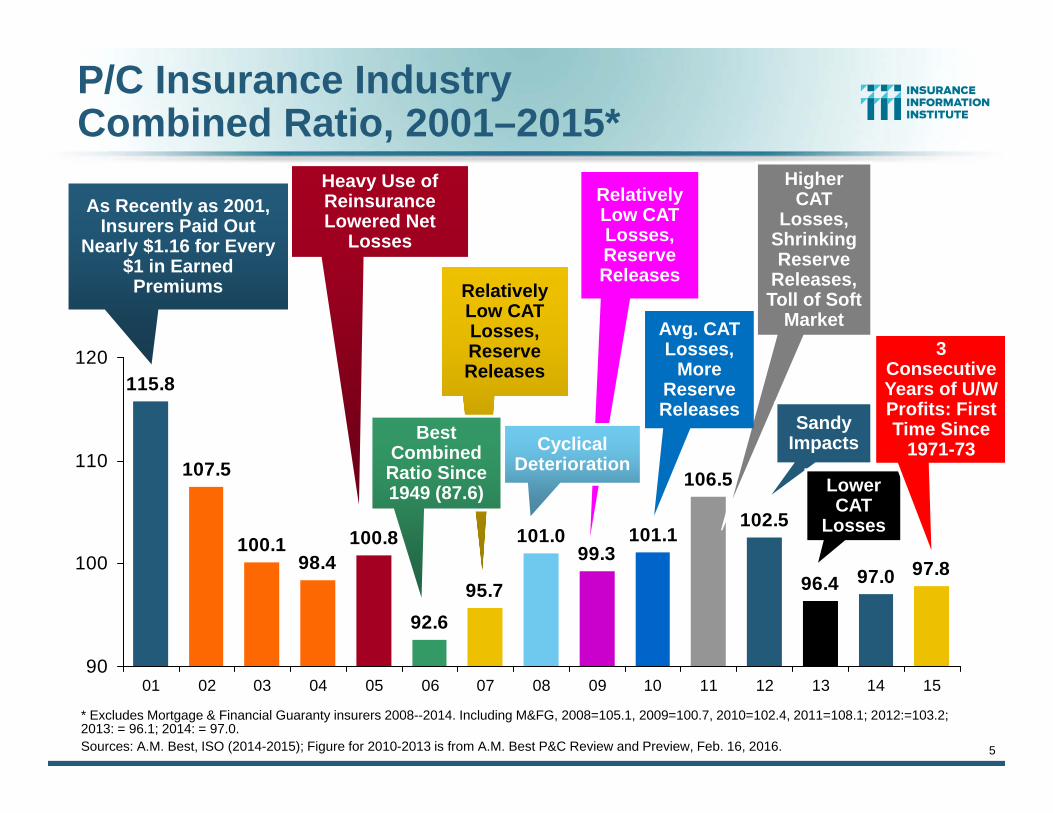
P/C Insurance Industry Combined Ratio, 2001–2015*
* Excludes Mortgage & Financial Guaranty insurers 2008--2014. Including M&FG, 2008=105.1, 2009=100.7, 2010=102.4, 2011=108.1; 2012:=103.2; 2013: = 96.1; 2014: = 97.0. Sources: A.M. Best, ISO (2014-2015); Figure for 2010-2013 is from A.M. Best P&C Review and Preview, Feb. 16, 2016.
95.7
99.3101.1
106.5
102.5
96.4 97.0 97.8101.0
92.6
100.898.4
100.1
107.5
115.8
90
100
110
120
01 02 03 04 05 06 07 08 09 10 11 12 13 14 15
As Recently as 2001, Insurers Paid Out
Nearly $1.16 for Every $1 in Earned Premiums Relatively
Low CAT Losses, Reserve Releases
Heavy Use of Reinsurance Lowered Net
Losses
Relatively Low CAT Losses, Reserve Releases
Higher CAT
Losses, Shrinking Reserve
Releases, Toll of Soft
Market
Cyclical Deterioration
Sandy Impacts
Lower CAT
Losses
Best Combined
Ratio Since 1949 (87.6)
Avg. CAT Losses,
More Reserve Releases
3 Consecutive Years of U/W Profits: First Time Since
1971-73
6
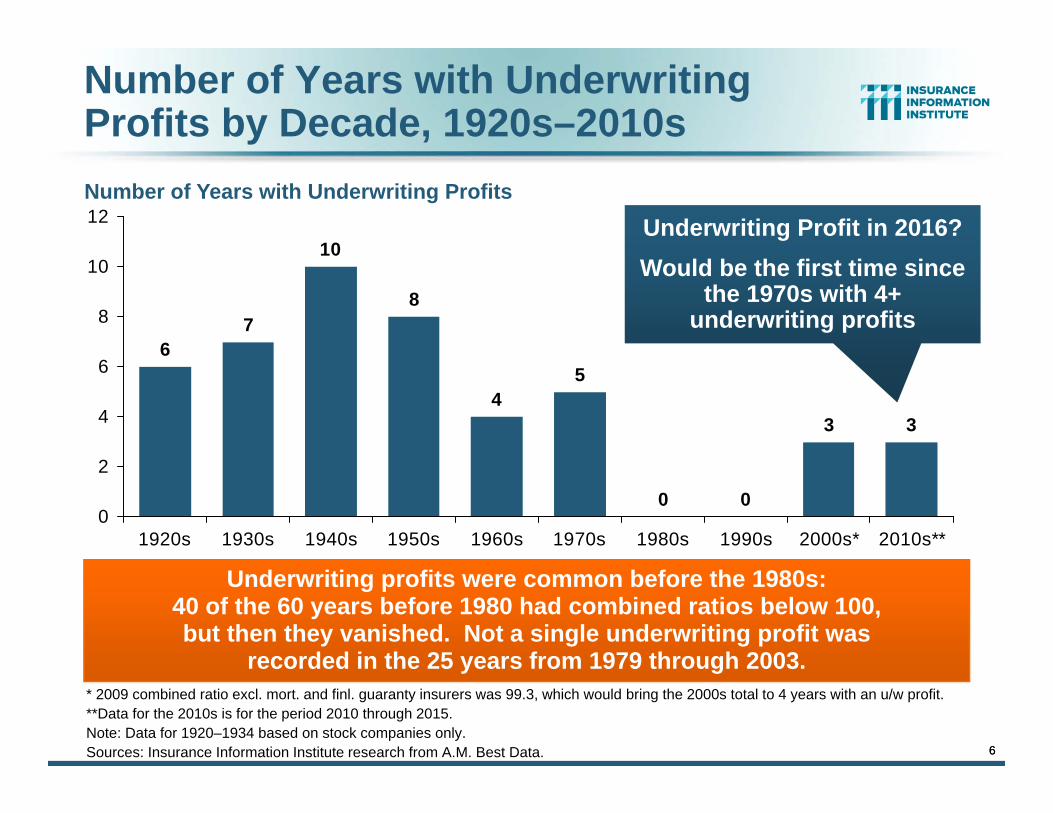
Number of Years with Underwriting Profits by Decade, 1920s–2010s
0 0
3 3
54
8
10
76
0
2
4
6
8
10
12
1920s 1930s 1940s 1950s 1960s 1970s 1980s 1990s 2000s* 2010s**
* 2009 combined ratio excl. mort. and finl. guaranty insurers was 99.3, which would bring the 2000s total to 4 years with an u/w profit.**Data for the 2010s is for the period 2010 through 2015.Note: Data for 1920–1934 based on stock companies only.Sources: Insurance Information Institute research from A.M. Best Data.
Number of Years with Underwriting Profits
Underwriting profits were common before the 1980s:40 of the 60 years before 1980 had combined ratios below 100, but then they vanished. Not a single underwriting profit was
recorded in the 25 years from 1979 through 2003.
6
Underwriting Profit in 2016?Would be the first time since
the 1970s with 4+ underwriting profits
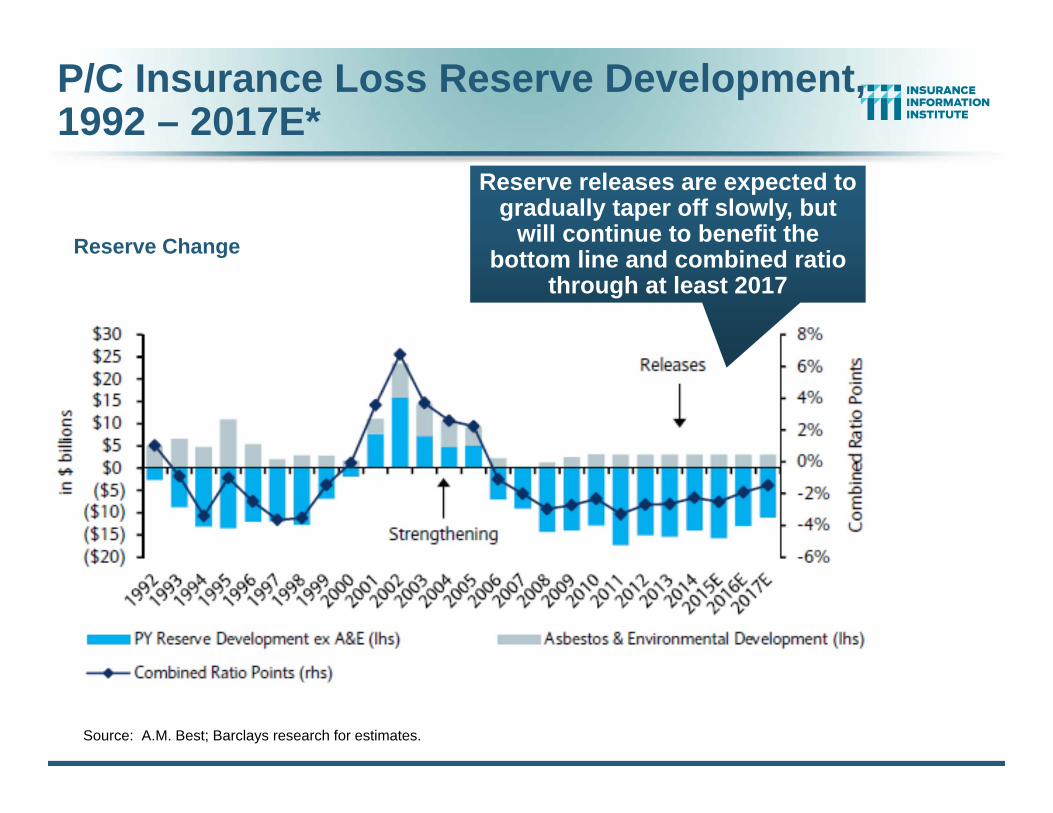
Source: A.M. Best; Barclays research for estimates.
Reserve Change
P/C Insurance Loss Reserve Development, 1992 – 2017E*
Reserve releases are expected to gradually taper off slowly, but
will continue to benefit the bottom line and combined ratio
through at least 2017
8
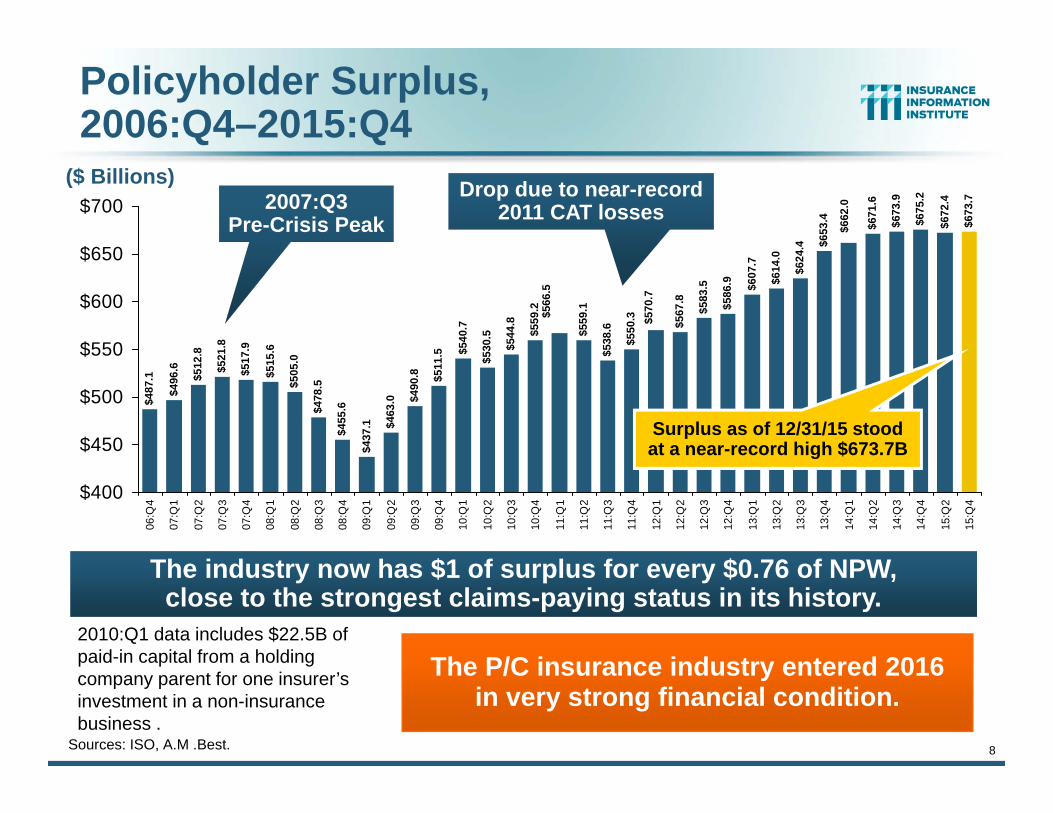
Policyholder Surplus, 2006:Q4–2015:Q4
Sources: ISO, A.M .Best.
($ Billions)$4
87.1
$496
.6
$512
.8
$521
.8
$478
.5
$455
.6
$437
.1 $463
.0 $490
.8 $511
.5 $540
.7
$530
.5
$544
.8
$559
.2
$559
.1
$538
.6
$550
.3 $567
.8
$583
.5
$586
.9 $607
.7
$614
.0
$624
.4 $653
.4 $671
.6
$673
.9
$675
.2
$672
.4
$673
.7
$662
.0
$570
.7
$566
.5
$505
.0
$515
.6
$517
.9
$400
$450
$500
$550
$600
$650
$700
06:Q
4
07:Q
1
07:Q
2
07:Q
3
07:Q
4
08:Q
1
08:Q
2
08:Q
3
08:Q
4
09:Q
1
09:Q
2
09:Q
3
09:Q
4
10:Q
1
10:Q
2
10:Q
3
10:Q
4
11:Q
1
11:Q
2
11:Q
3
11:Q
4
12:Q
1
12:Q
2
12:Q
3
12:Q
4
13:Q
1
13:Q
2
13:Q
3
13:Q
4
14:Q
1
14:Q
2
14:Q
3
14:Q
4
15:Q
2
15:Q
4
2007:Q3Pre-Crisis Peak
Surplus as of 12/31/15 stood at a near-record high $673.7B
2010:Q1 data includes $22.5B of paid-in capital from a holding company parent for one insurer’s investment in a non-insurance business .
The industry now has $1 of surplus for every $0.76 of NPW,close to the strongest claims-paying status in its history.
Drop due to near-record 2011 CAT losses
The P/C insurance industry entered 2016in very strong financial condition.
9
-5%
0%
5%
10%
15%
20%
25%
71 72 73 74 75 76 77 78 79 80 81 82 83 84 85 86 87 88 89 90 91 92 93 94 95 96 97 98 99 00 01 02 03 04 05 06 07 08 09 10 11 12 13 14 15*
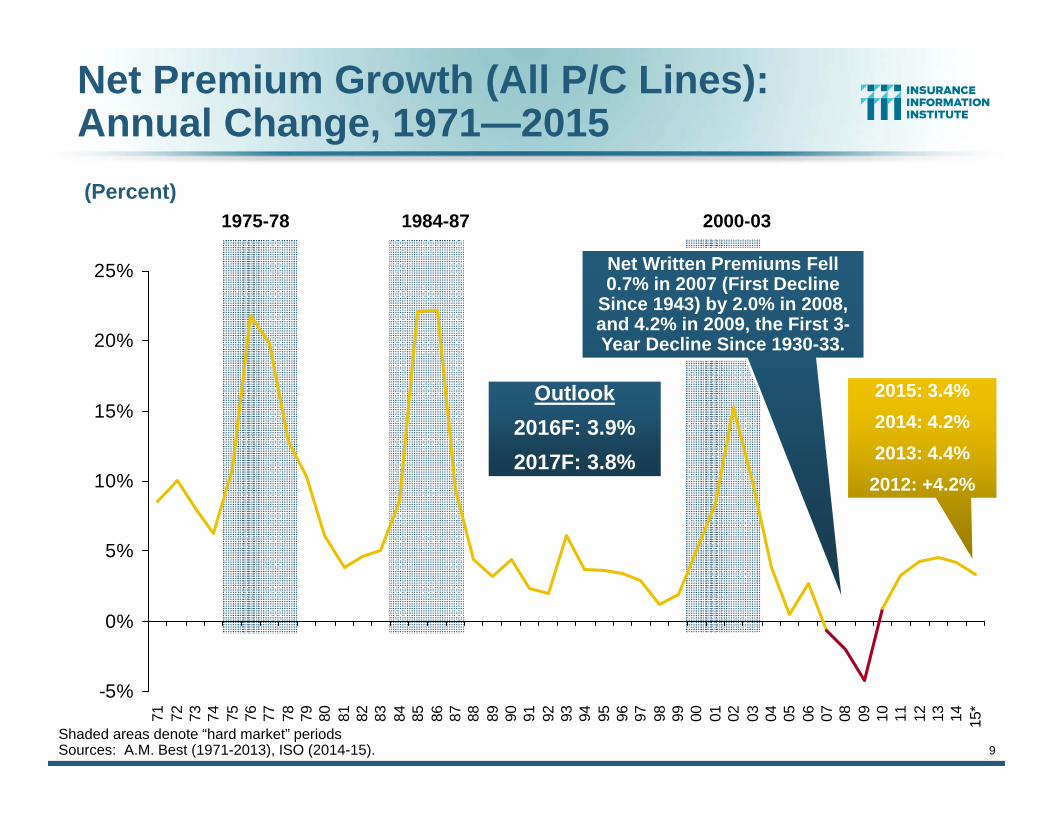
Net Premium Growth (All P/C Lines): Annual Change, 1971—2015(Percent)
1975-78 1984-87 2000-03
Shaded areas denote “hard market” periodsSources: A.M. Best (1971-2013), ISO (2014-15).
Net Written Premiums Fell 0.7% in 2007 (First Decline
Since 1943) by 2.0% in 2008, and 4.2% in 2009, the First 3-Year Decline Since 1930-33.
2015: 3.4%2014: 4.2%2013: 4.4%
2012: +4.2%
Outlook2016F: 3.9%2017F: 3.8%
-20%
-15%
-10%
-5%
0%
5%
10%
15%
20%
25%
30%
26 28 30 32 34 36 38 40 42 44 46 48 50 52 54 56 58 60 62 64 66 68 70 72 74 76 78 80 82 84 86 88 90 92 94 96 98 00 02 04 06 08 10 12 14
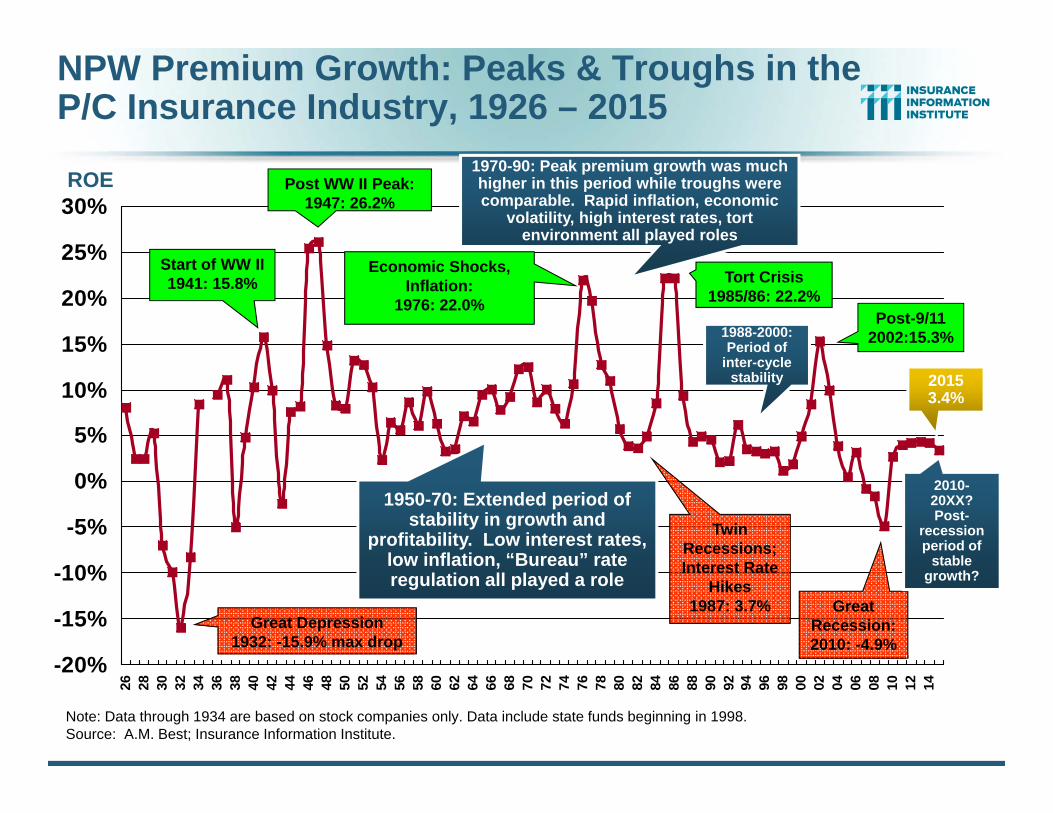
Note: Data through 1934 are based on stock companies only. Data include state funds beginning in 1998.Source: A.M. Best; Insurance Information Institute.
Economic Shocks, Inflation:
1976: 22.0%
Tort Crisis1985/86: 22.2%
Post-9/112002:15.3%
Twin Recessions; Interest Rate
Hikes1987: 3.7% Great
Recession:2010: -4.9%
ROE
2015 3.4%
NPW Premium Growth: Peaks & Troughs in the P/C Insurance Industry, 1926 – 2015
Great Depression1932: -15.9% max drop
Post WW II Peak:1947: 26.2%
Start of WW II1941: 15.8%
1950-70: Extended period of stability in growth and
profitability. Low interest rates, low inflation, “Bureau” rate regulation all played a role
1970-90: Peak premium growth was much higher in this period while troughs were comparable. Rapid inflation, economic
volatility, high interest rates, tort environment all played roles
1988-2000: Period of
inter-cycle stability
2010-20XX? Post-
recession period of
stable growth?
11
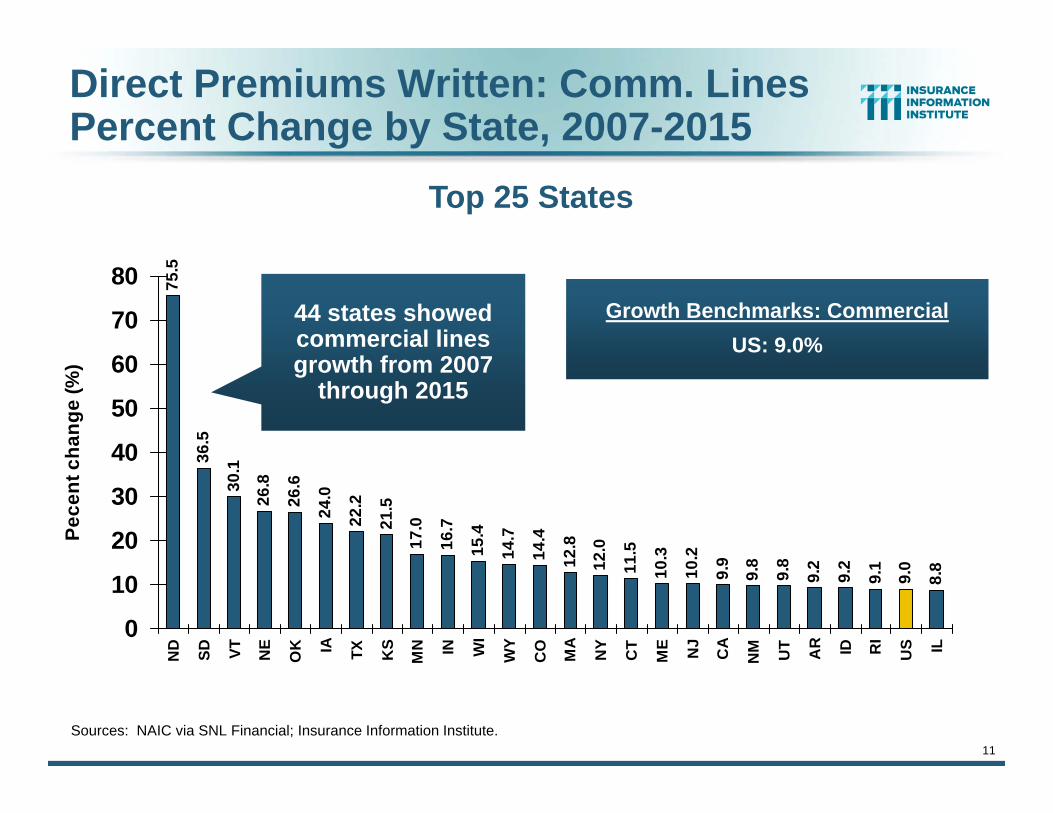
Direct Premiums Written: Comm. LinesPercent Change by State, 2007-2015
75.5
36.5
30.1
26.8
26.6
24.0
22.2
21.5
17.0
16.7
15.4
14.7
14.4
12.8
12.0
11.5
10.3
10.2
9.9
9.8
9.8
9.2
9.2
9.1
9.0
8.8
0
10
20
30
40
50
60
70
80
ND SD VT NE
OK IA TX KS
MN IN WI
WY
CO MA
NY
CT
ME NJ
CA
NM UT AR ID RI
US IL
Pece
nt c
hang
e (%
)
Sources: NAIC via SNL Financial; Insurance Information Institute.
Top 25 States
44 states showed commercial lines growth from 2007
through 2015
Growth Benchmarks: CommercialUS: 9.0%
12
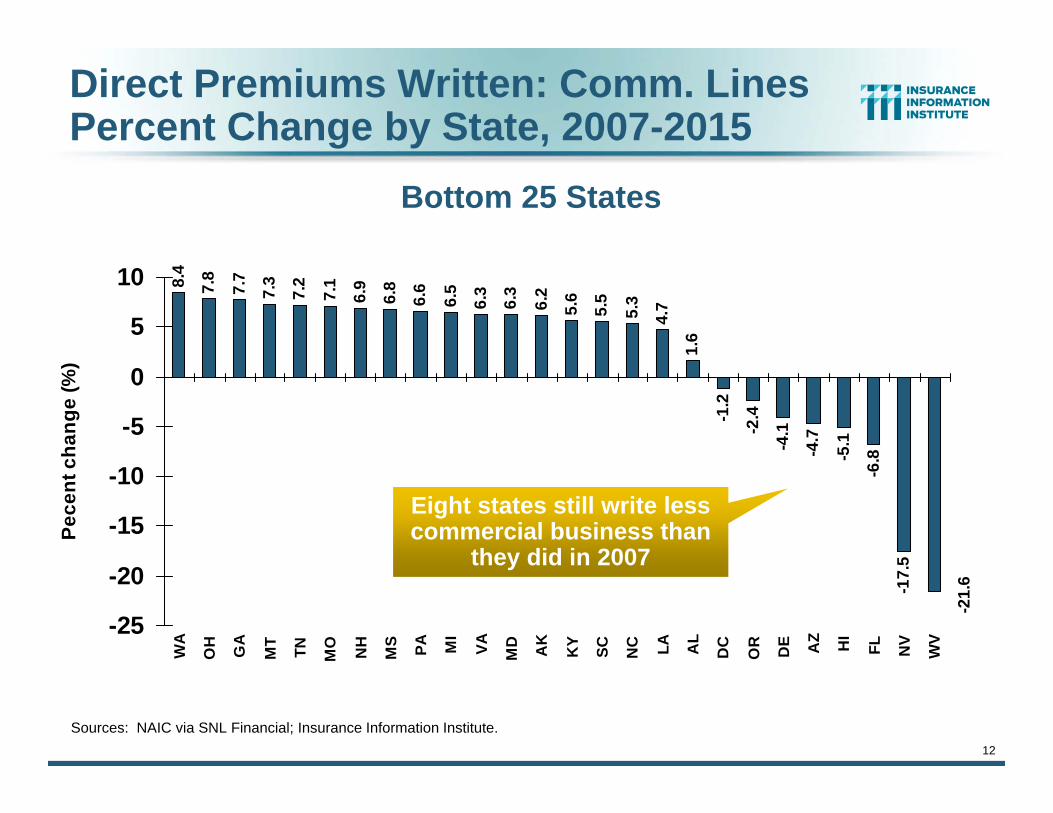
Direct Premiums Written: Comm. LinesPercent Change by State, 2007-2015
8.4
7.8
7.7
7.3
7.2
7.1
6.9
6.8
6.6
6.5
6.3
6.3
6.2
5.6
5.5
5.3
4.7
1.6
-1.2
-2.4
-4.1
-4.7
-5.1
-6.8
-17.
5
-21.
6
-25
-20
-15
-10
-5
0
5
10
WA
OH GA
MT
TN MO NH
MS PA MI
VA MD AK
KY
SC NC LA AL
DC
OR DE AZ HI
FL NV
WV
Pece
nt c
hang
e (%
)
Bottom 25 States
Sources: NAIC via SNL Financial; Insurance Information Institute.
Eight states still write less commercial business than
they did in 2007
13
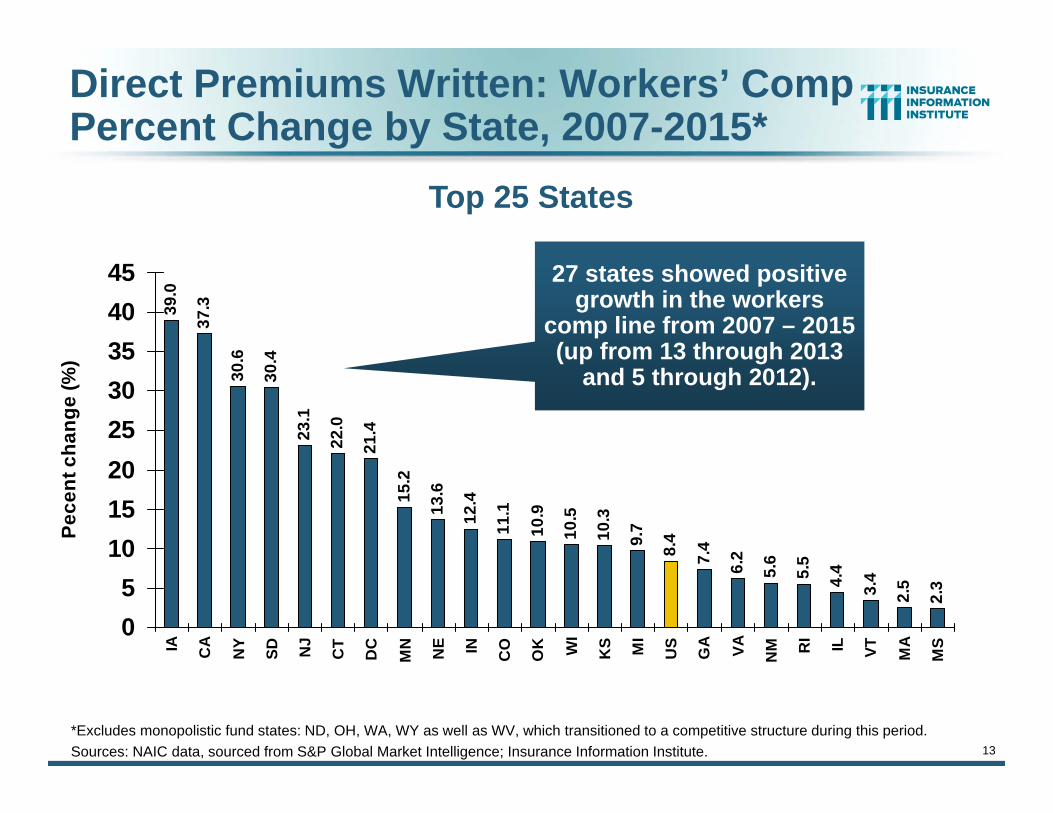
Direct Premiums Written: Workers’ CompPercent Change by State, 2007-2015*
39.0
37.3
30.6
30.4
23.1
22.0
21.4
15.2
13.6
12.4
11.1
10.9
10.5
10.3
9.7
8.4
7.4
6.2
5.6
5.5
4.4
3.4
2.5
2.3
05
1015202530354045
IA CA
NY
SD NJ
CT
DC
MN NE IN CO
OK WI
KS MI
US
GA VA NM R
I IL VT MA
MS
Pece
nt c
hang
e (%
)
*Excludes monopolistic fund states: ND, OH, WA, WY as well as WV, which transitioned to a competitive structure during this period.Sources: NAIC data, sourced from S&P Global Market Intelligence; Insurance Information Institute.
Top 25 States
27 states showed positive growth in the workers
comp line from 2007 – 2015 (up from 13 through 2013
and 5 through 2012).
14
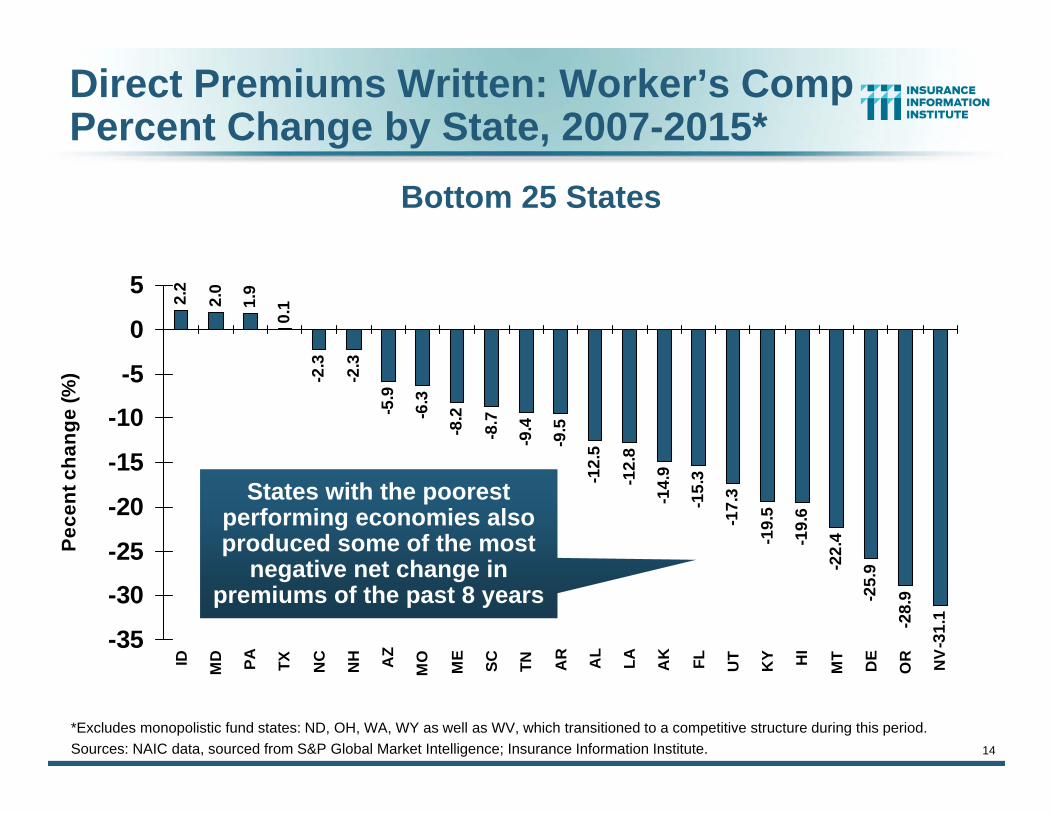
Direct Premiums Written: Worker’s CompPercent Change by State, 2007-2015*
2.2
2.0
1.9
0.1
-2.3
-2.3
-5.9
-6.3
-8.2
-8.7
-9.4
-9.5
-12.
5
-12.
8
-14.
9
-15.
3
-17.
3
-19.
5
-19.
6
-22.
4
-25.
9
-28.
9
-31.
1
-35
-30
-25
-20
-15
-10
-5
0
5
ID MD PA TX NC
NH AZ
MO
ME
SC TN AR AL
LA AK FL UT
KY HI
MT
DE
OR NV
Pece
nt c
hang
e (%
)
Bottom 25 States
*Excludes monopolistic fund states: ND, OH, WA, WY as well as WV, which transitioned to a competitive structure during this period.Sources: NAIC data, sourced from S&P Global Market Intelligence; Insurance Information Institute.
States with the poorest performing economies also produced some of the most
negative net change in premiums of the past 8 years
15
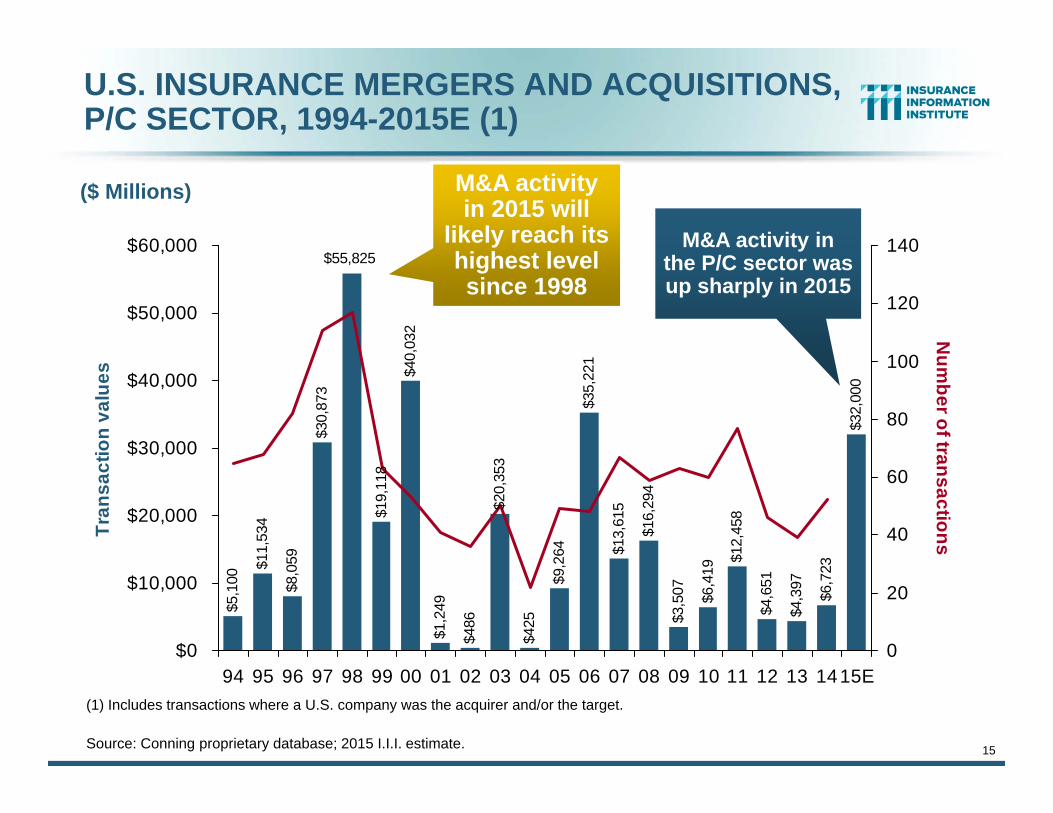
U.S. INSURANCE MERGERS AND ACQUISITIONS,P/C SECTOR, 1994-2015E (1)
$5,1
00
$11,
534
$8,0
59
$30,
873
$19,
118
$40,
032
$1,2
49
$486
$20,
353
$425
$9,2
64
$35,
221
$13,
615
$16,
294
$3,5
07 $6,4
19
$12,
458
$4,6
51
$4,3
97
$6,7
23
$32,
000
$55,825
$0
$10,000
$20,000
$30,000
$40,000
$50,000
$60,000
94 95 96 97 98 99 00 01 02 03 04 05 06 07 08 09 10 11 12 13 1415E
Tran
sact
ion
valu
es
0
20
40
60
80
100
120
140
Num
ber of transactions
($ Millions)
(1) Includes transactions where a U.S. company was the acquirer and/or the target.
Source: Conning proprietary database; 2015 I.I.I. estimate.
M&A activity in the P/C sector was up sharply in 2015
M&A activity in 2015 will
likely reach its highest level since 1998
16
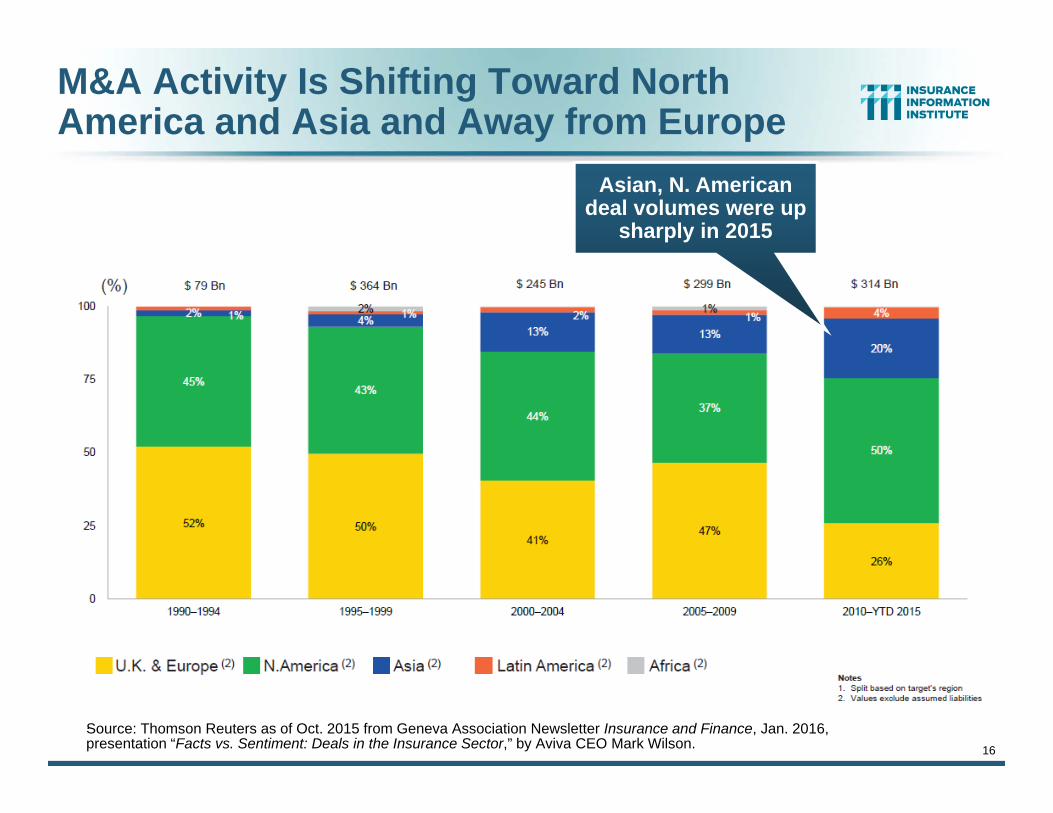
M&A Activity Is Shifting Toward North America and Asia and Away from Europe
.Source: Thomson Reuters as of Oct. 2015 from Geneva Association Newsletter Insurance and Finance, Jan. 2016, presentation “Facts vs. Sentiment: Deals in the Insurance Sector,” by Aviva CEO Mark Wilson.
Asian, N. American deal volumes were up
sharply in 2015

INVESTMENTS: THE NEW REALITY
17
Investment Performance is a Key Driver of Profitability
Depressed Yields Will Necessarily Influence Underwriting & Pricing
17

Property/Casualty Insurance Industry Investment Income: 2000–20151
$38.9$37.1 $36.7
$38.7
$54.6
$51.2
$47.1 $47.6$49.2
$48.0 $47.3 $46.4 $47.2
$39.6
$49.5$52.3
$30
$40
$50
$60
00 01 02 03 04 05 06 07 08 09 10 11 12 13 14 15
Due to persistently low interest rates, investment income fell in 2012, 2013 and 2014 but showed a small (1.9%) increase in 2015—
a trend that may continue.
1 Investment gains consist primarily of interest and stock dividends. Sources: ISO; Insurance Information Institute.
($ Billions) Investment earnings are still below their 2007 pre-crisis peak
19
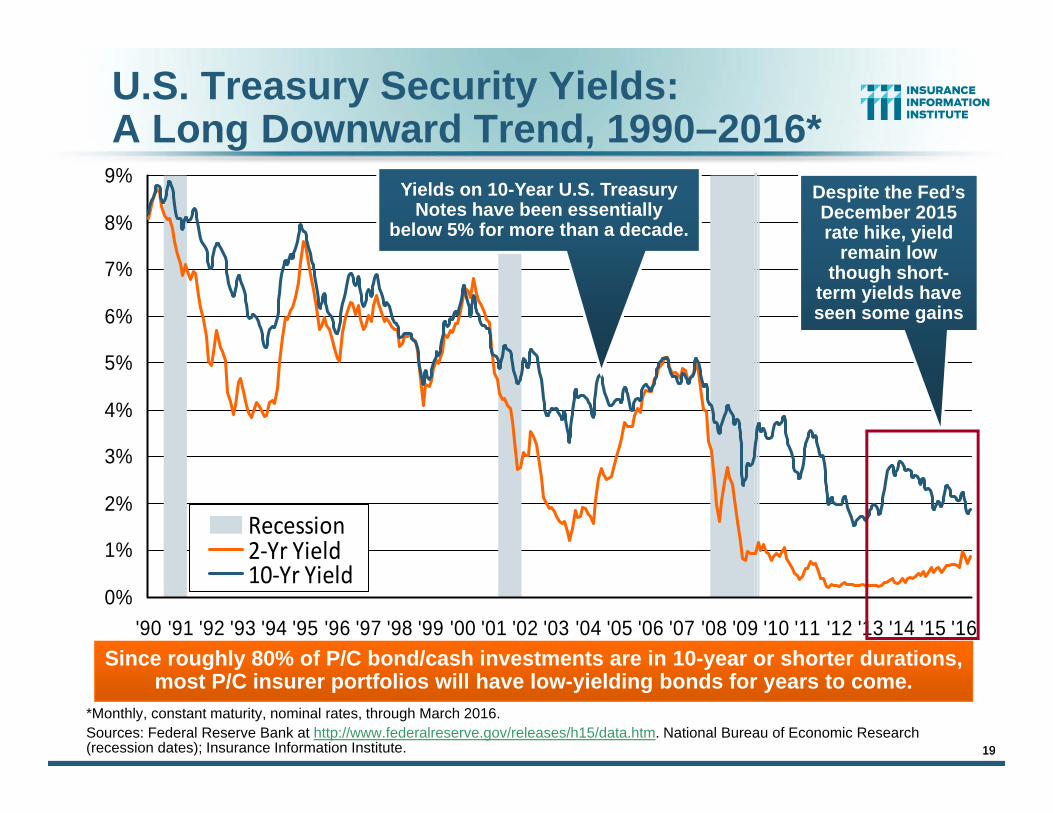
U.S. Treasury Security Yields:A Long Downward Trend, 1990–2016*
*Monthly, constant maturity, nominal rates, through March 2016.Sources: Federal Reserve Bank at http://www.federalreserve.gov/releases/h15/data.htm. National Bureau of Economic Research (recession dates); Insurance Information Institute.
0%
1%
2%
3%
4%
5%
6%
7%
8%
9%
'90 '91 '92 '93 '94 '95 '96 '97 '98 '99 '00 '01 '02 '03 '04 '05 '06 '07 '08 '09 '10 '11 '12 '13 '14 '15 '16
Recession2‐Yr Yield10‐Yr Yield
Yields on 10-Year U.S. Treasury Notes have been essentially
below 5% for more than a decade.
Since roughly 80% of P/C bond/cash investments are in 10-year or shorter durations, most P/C insurer portfolios will have low-yielding bonds for years to come.
Despite the Fed’s December 2015 rate hike, yield
remain low though short-
term yields have seen some gains
19
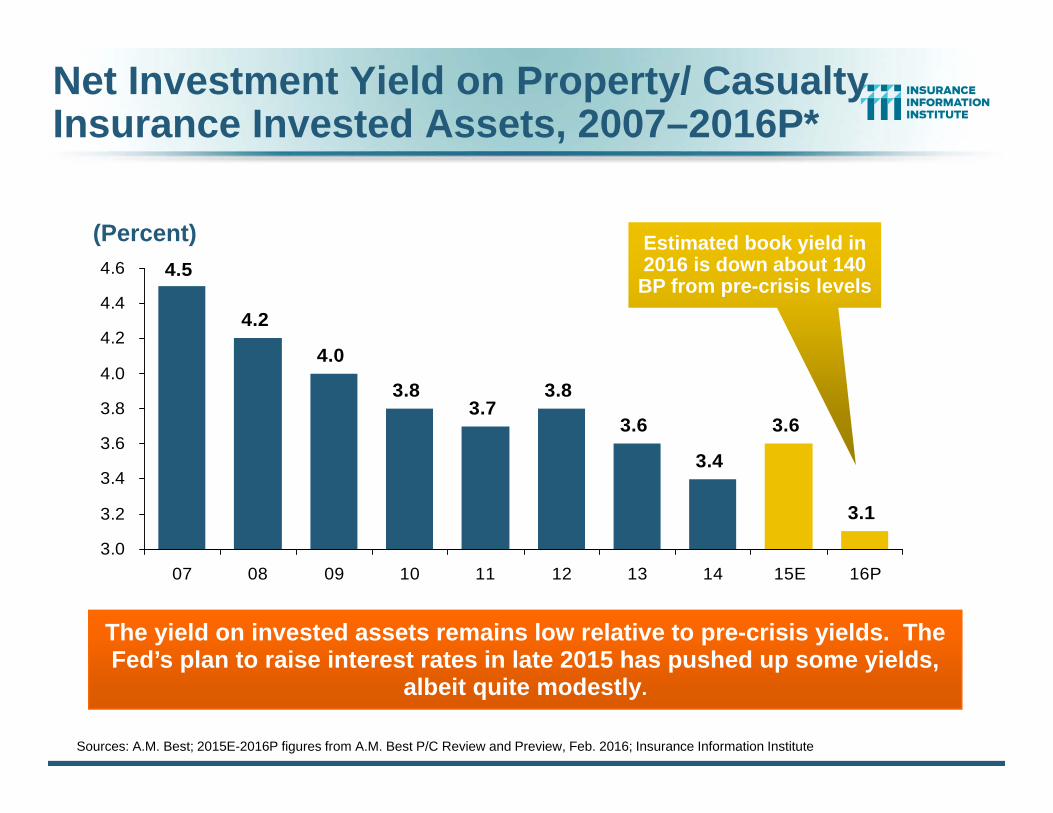
Net Investment Yield on Property/ Casualty Insurance Invested Assets, 2007–2016P*
4.5
4.2
4.0
3.8
3.4
3.6
3.1
3.73.8
3.6
3.0
3.2
3.4
3.6
3.8
4.0
4.2
4.4
4.6
07 08 09 10 11 12 13 14 15E 16P
The yield on invested assets remains low relative to pre-crisis yields. The Fed’s plan to raise interest rates in late 2015 has pushed up some yields,
albeit quite modestly.
Sources: A.M. Best; 2015E-2016P figures from A.M. Best P/C Review and Preview, Feb. 2016; Insurance Information Institute
(Percent) Estimated book yield in 2016 is down about 140 BP from pre-crisis levels
21
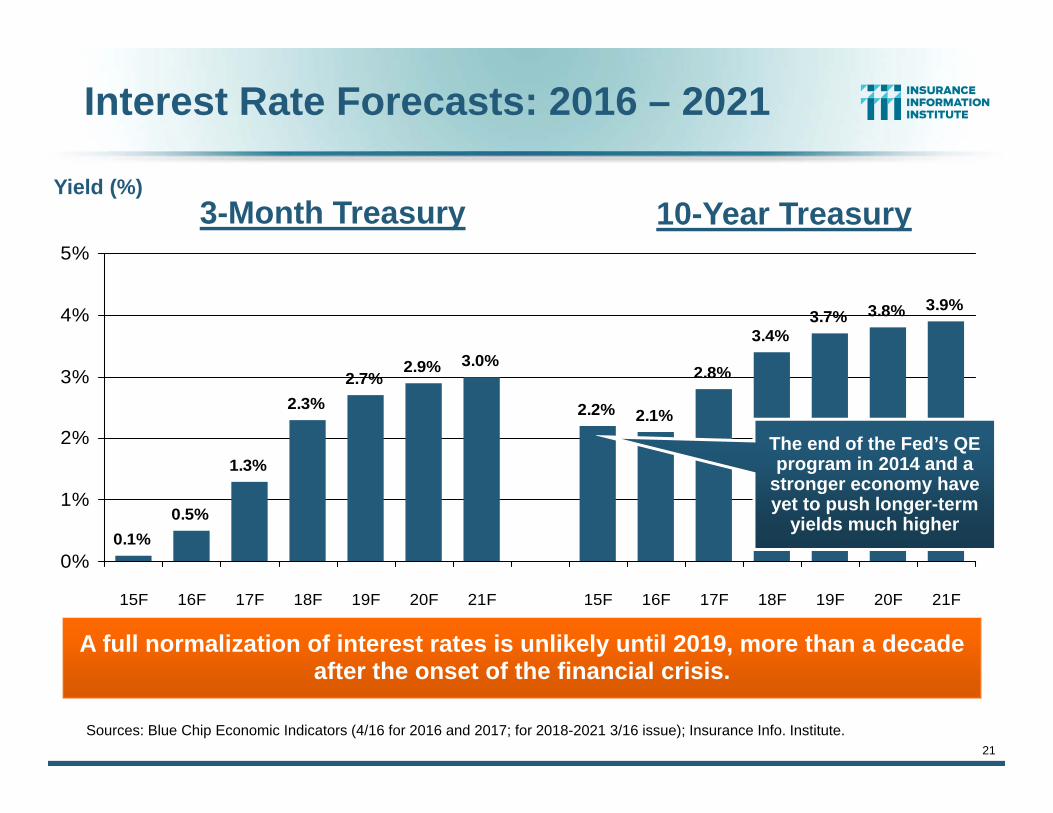
Interest Rate Forecasts: 2016 – 2021
3.0%
2.2% 2.1%
2.8%
3.4%3.7% 3.8% 3.9%
0.1%0.5%
1.3%
2.3%2.7%
2.9%
0%
1%
2%
3%
4%
5%
15F 16F 17F 18F 19F 20F 21F 15F 16F 17F 18F 19F 20F 21F
A full normalization of interest rates is unlikely until 2019, more than a decade after the onset of the financial crisis.
Yield (%)
Sources: Blue Chip Economic Indicators (4/16 for 2016 and 2017; for 2018-2021 3/16 issue); Insurance Info. Institute.
3-Month Treasury 10-Year Treasury
The end of the Fed’s QE program in 2014 and a
stronger economy have yet to push longer-term
yields much higher
Profitability & Politics
2222
How Is Profitability Affected by the President’s Political Party?
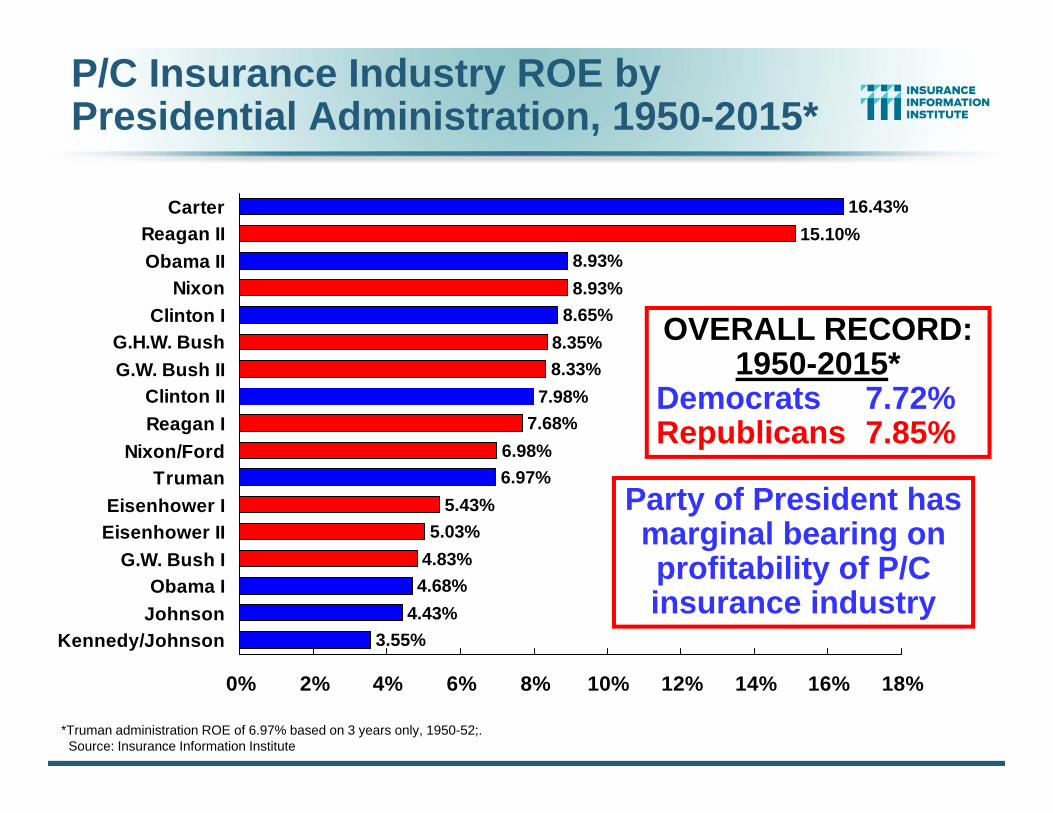
15.10%8.93%8.93%
8.65%8.35%8.33%
7.98%7.68%
6.98%6.97%
5.43%5.03%
4.83%4.68%
4.43%3.55%
16.43%
0% 2% 4% 6% 8% 10% 12% 14% 16% 18%
CarterReagan IIObama II
NixonClinton I
G.H.W. BushG.W. Bush II
Clinton IIReagan I
Nixon/FordTruman
Eisenhower IEisenhower II
G.W. Bush IObama I
JohnsonKennedy/Johnson
*Truman administration ROE of 6.97% based on 3 years only, 1950-52;.Source: Insurance Information Institute
OVERALL RECORD: 1950-2015*
Democrats 7.72%Republicans 7.85%
Party of President has marginal bearing on profitability of P/C insurance industry
P/C Insurance Industry ROE by Presidential Administration, 1950-2015*
24
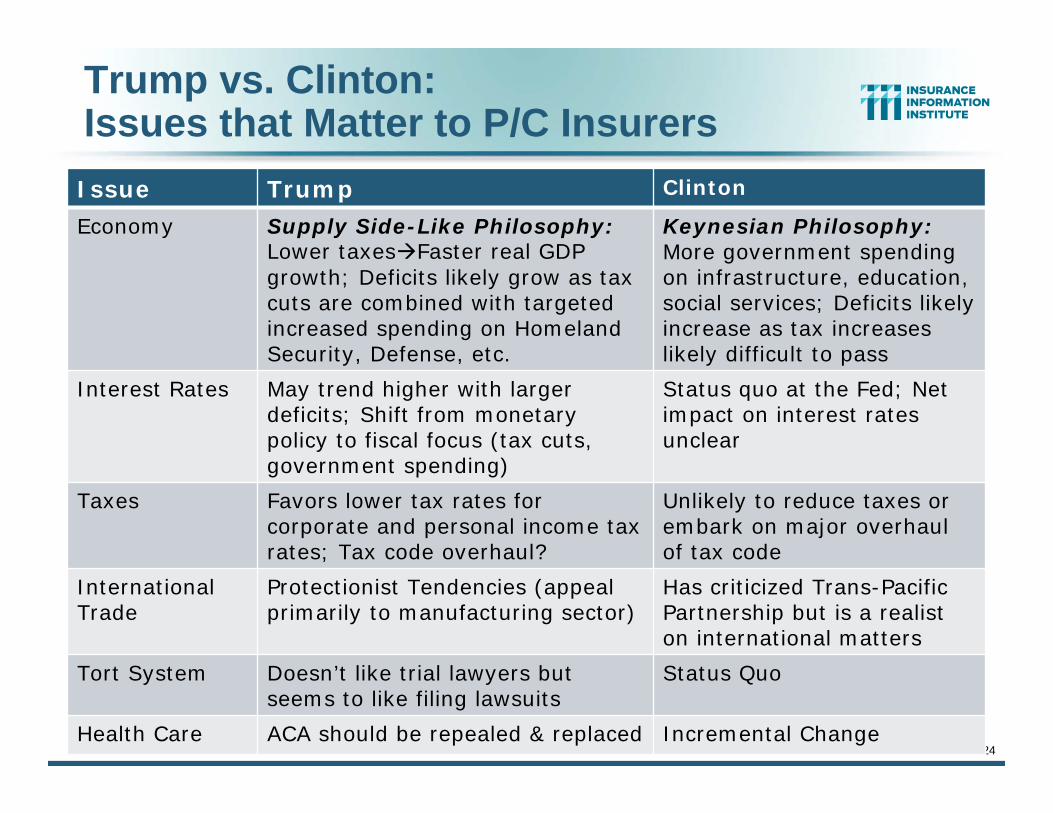
Trump vs. Clinton:Issues that Matter to P/C Insurers
Issue Trump Clinton
Economy Supply Side-Like Philosophy:Lower taxesFaster real GDP growth; Deficits likely grow as tax cuts are combined with targeted increased spending on Homeland Security, Defense, etc.
Keynesian Philosophy: More government spending on infrastructure, education, social services; Deficits likely increase as tax increases likely difficult to pass
Interest Rates May trend higher with larger deficits; Shift from monetary policy to fiscal focus (tax cuts, government spending)
Status quo at the Fed; Net impact on interest rates unclear
Taxes Favors lower tax rates for corporate and personal income tax rates; Tax code overhaul?
Unlikely to reduce taxes or embark on major overhaul of tax code
International Trade
Protectionist Tendencies (appeal primarily to manufacturing sector)
Has criticized Trans-PacificPartnership but is a realist on international matters
Tort System Doesn’t like trial lawyers butseems to like filing lawsuits
Status Quo
Health Care ACA should be repealed & replaced Incremental Change
Source: James Madison Institute, February 2008.
ME
NH
MA
CT
PA
WVVA
NC
LATX
OK
NE
ND
MN
MI
IL
IA
ID
WA
OR
AZ
HI
NJRI C+
DE
AL
VT
NY
MD
SC
GA
TN
AL
FL
MS
ARNM
KYMOKS
SD WI
INOH
MT
CA
NV
UT
WY
CO
AK
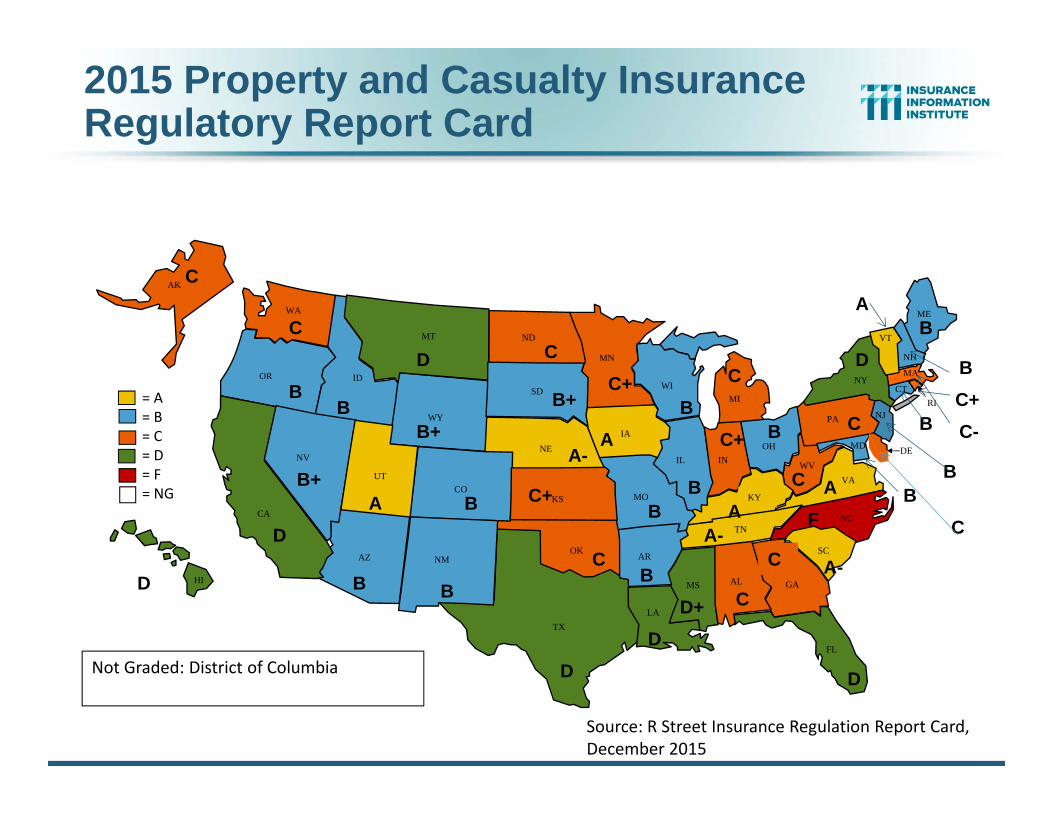
= A= B= C= D= F= NG
Source: R Street Insurance Regulation Report Card, December 2015
B+ A
B
A-
B+
B
A
A-
CC
BB
D
F
C
C+
A C-
B
D
C
C
BC
A
B
B
A
B
B
C+
B
B
B+
C
B
B
A-
C+
C
C
CDB
D+D
D D
D
2015 Property and Casualty InsuranceRegulatory Report Card
Not Graded: District of Columbia
26
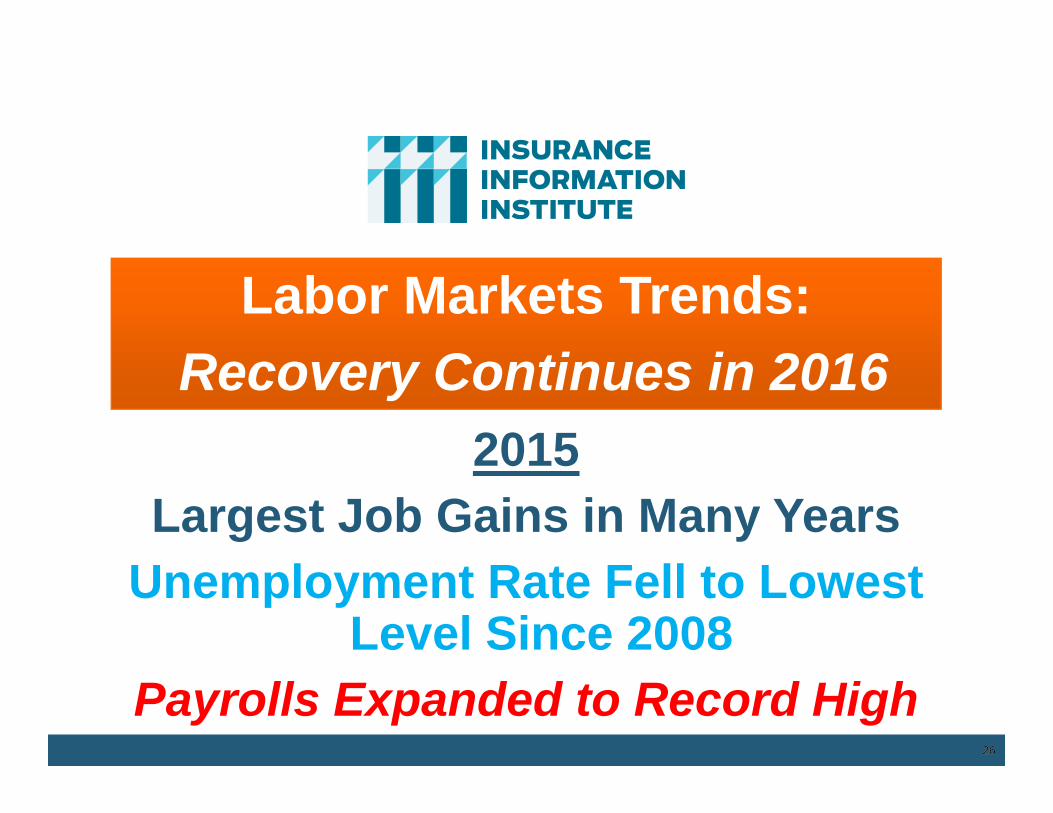
Labor Markets Trends:Recovery Continues in 2016
2015Largest Job Gains in Many Years
Unemployment Rate Fell to Lowest Level Since 2008
Payrolls Expanded to Record High26
27
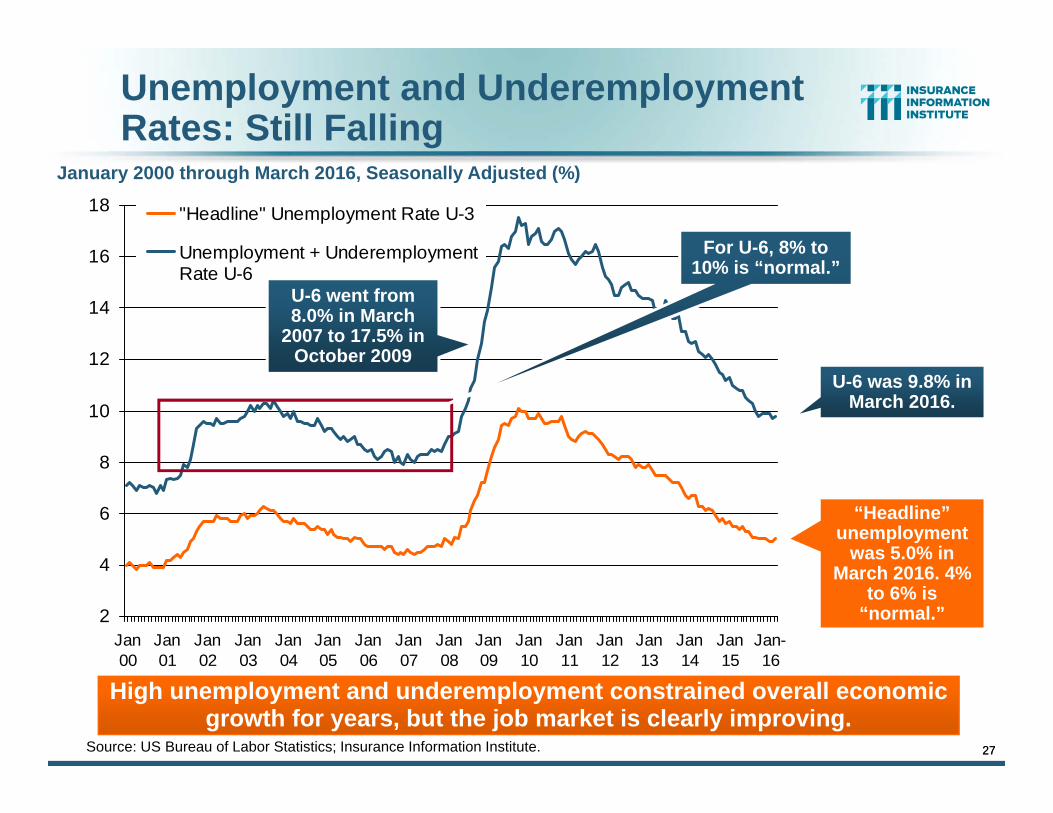
Unemployment and Underemployment Rates: Still Falling
2
4
6
8
10
12
14
16
18
Jan00
Jan01
Jan02
Jan03
Jan04
Jan05
Jan06
Jan07
Jan08
Jan09
Jan10
Jan11
Jan12
Jan13
Jan14
Jan15
Jan-16
"Headline" Unemployment Rate U-3
Unemployment + UnderemploymentRate U-6
“Headline” unemployment
was 5.0% in March 2016. 4%
to 6% is “normal.”
Source: US Bureau of Labor Statistics; Insurance Information Institute.
U-6 was 9.8% in March 2016.
January 2000 through March 2016, Seasonally Adjusted (%)
High unemployment and underemployment constrained overall economic growth for years, but the job market is clearly improving.
27
U-6 went from 8.0% in March
2007 to 17.5% in October 2009
For U-6, 8% to 10% is “normal.”
28
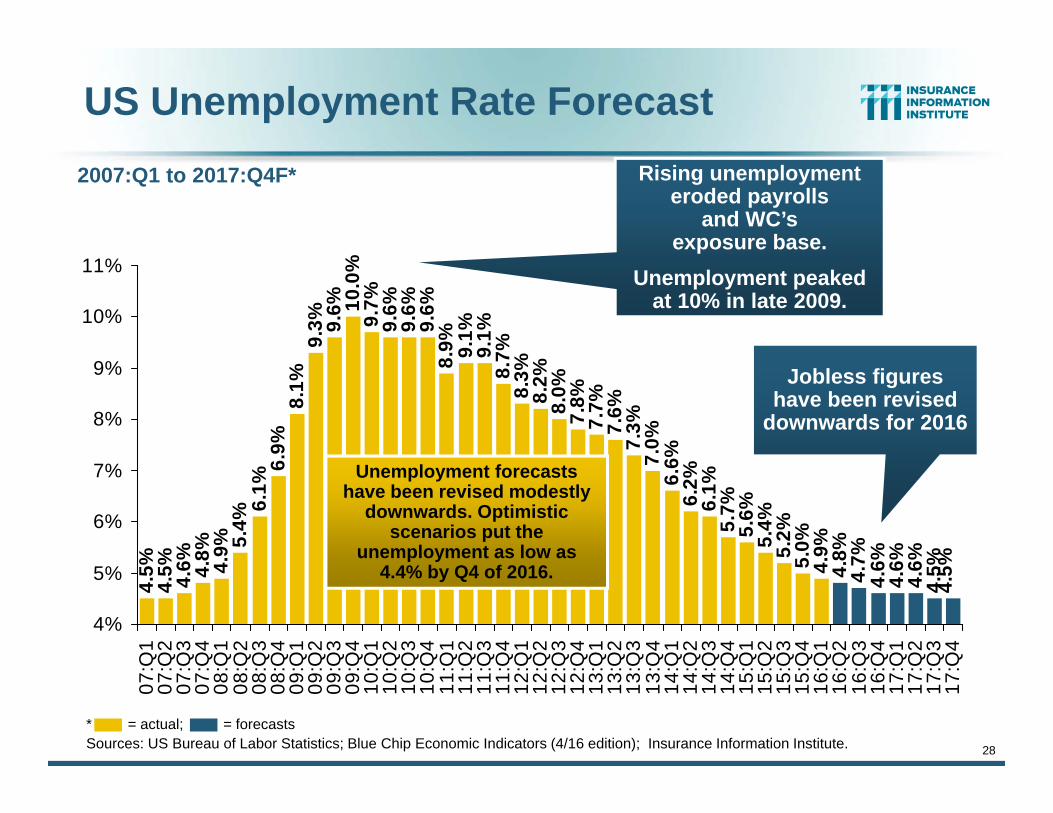
US Unemployment Rate Forecast4.
5%4.
5% 4.6% 4.8% 4.9% 5.
4%6.
1%6.
9%8.
1%9.
3% 9.6% 10
.0%
9.7%
9.6%
9.6%
8.9% 9.1%
9.1%
8.7%
8.3%
8.2%
8.0%
7.8%
7.7%
7.6%
7.3%
7.0%
6.6%
6.2%
6.1%
5.7%
5.6%
5.4%
5.2%
5.0%
4.9%
4.8%
4.7%
4.6%
4.6%
4.6%
4.5%
4.5%
9.6%
4%
5%
6%
7%
8%
9%
10%
11%
07:Q
107
:Q2
07:Q
307
:Q4
08:Q
108
:Q2
08:Q
308
:Q4
09:Q
109
:Q2
09:Q
309
:Q4
10:Q
110
:Q2
10:Q
310
:Q4
11:Q
111
:Q2
11:Q
311
:Q4
12:Q
112
:Q2
12:Q
312
:Q4
13:Q
113
:Q2
13:Q
313
:Q4
14:Q
114
:Q2
14:Q
314
:Q4
15:Q
115
:Q2
15:Q
315
:Q4
16:Q
116
:Q2
16:Q
316
:Q4
17:Q
117
:Q2
17:Q
317
:Q4
Rising unemployment eroded payrolls
and WC’s exposure base.
Unemployment peaked at 10% in late 2009.
* = actual; = forecastsSources: US Bureau of Labor Statistics; Blue Chip Economic Indicators (4/16 edition); Insurance Information Institute.
2007:Q1 to 2017:Q4F*
Unemployment forecasts have been revised modestly
downwards. Optimistic scenarios put the
unemployment as low as 4.4% by Q4 of 2016.
Jobless figures have been revised
downwards for 2016
29
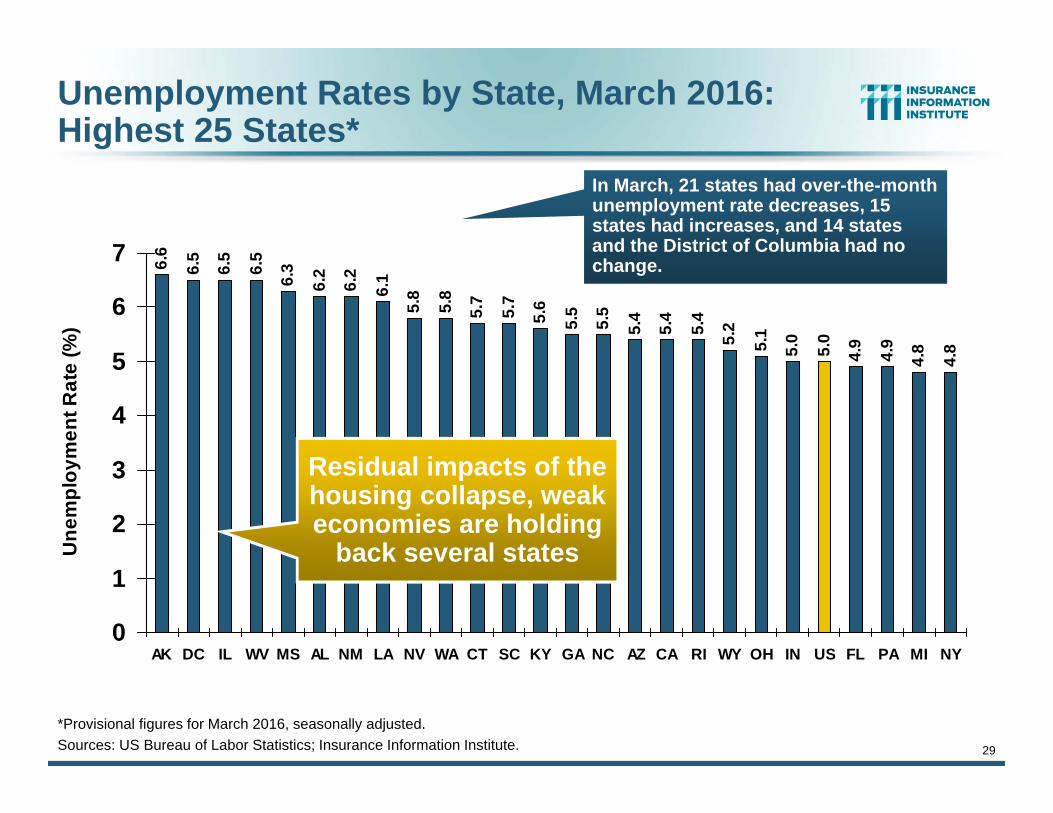
Unemployment Rates by State, March 2016:Highest 25 States*
6.6
6.5
6.5
6.5
6.3
6.2
6.2
6.1
5.8
5.8
5.7
5.7
5.6
5.5
5.5
5.4
5.4
5.4
5.2
5.1
5.0
5.0
4.9
4.9
4.8
4.8
0
1
2
3
4
5
6
7
AK DC IL WV MS AL NM LA NV WA CT SC KY GA NC AZ CA RI WY OH IN US FL PA MI NY
Une
mpl
oym
ent R
ate
(%)
*Provisional figures for March 2016, seasonally adjusted.Sources: US Bureau of Labor Statistics; Insurance Information Institute.
In March, 21 states had over-the-month unemployment rate decreases, 15 states had increases, and 14 states and the District of Columbia had no change.
Residual impacts of the housing collapse, weak economies are holding
back several states
30
4.7
4.5
4.5
4.5
4.4
4.4
4.4
4.4
4.3
4.3
4.2
4.0
4.0
3.9
3.8
3.8
3.7
3.5
3.4
3.3
3.1
3.1
3.0
2.9
2.6
2.5
0
1
2
3
4
5
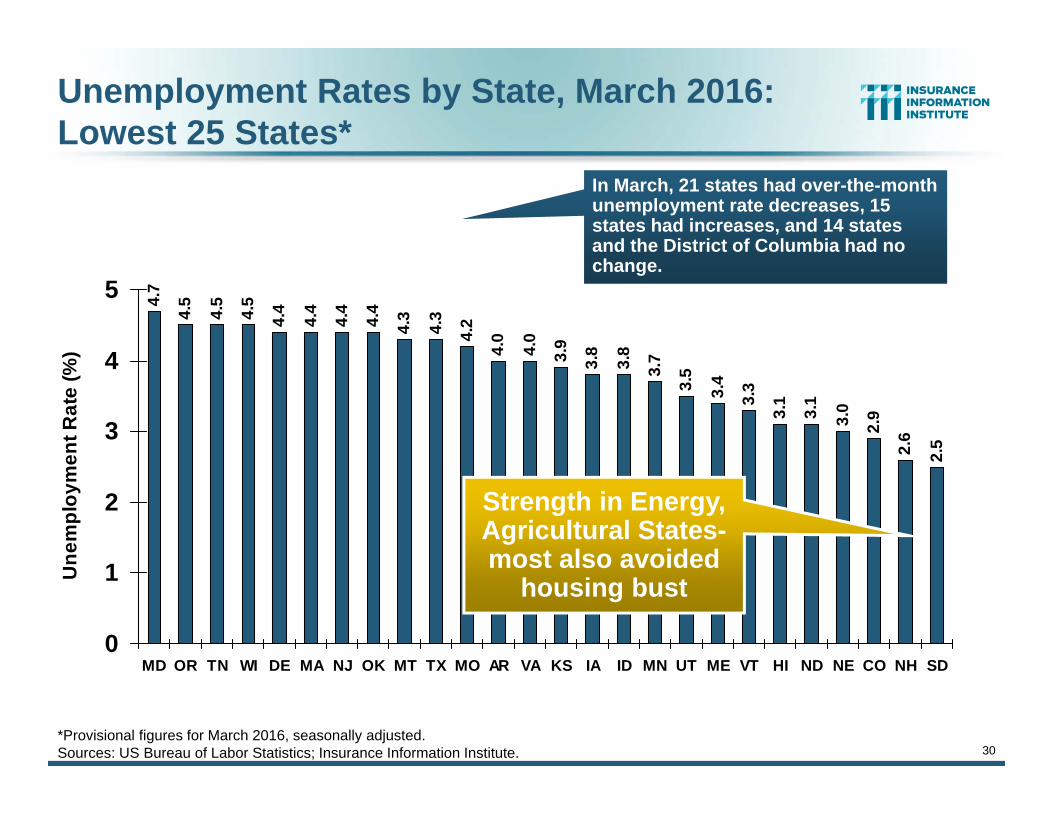
MD OR TN WI DE MA NJ OK MT TX MO AR VA KS IA ID MN UT ME VT HI ND NE CO NH SD
Une
mpl
oym
ent R
ate
(%)
Unemployment Rates by State, March 2016: Lowest 25 States*
*Provisional figures for March 2016, seasonally adjusted.Sources: US Bureau of Labor Statistics; Insurance Information Institute.
In March, 21 states had over-the-month unemployment rate decreases, 15 states had increases, and 14 states and the District of Columbia had no change.
Strength in Energy, Agricultural States-most also avoided
housing bust
31
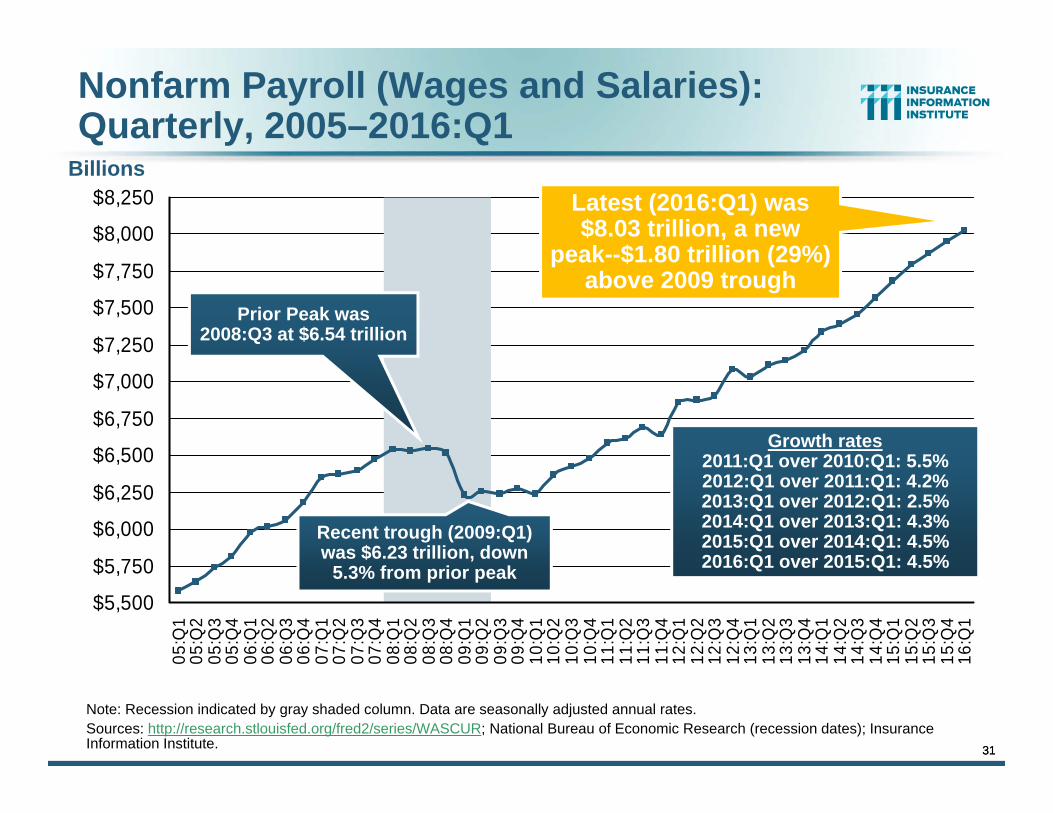
Nonfarm Payroll (Wages and Salaries):Quarterly, 2005–2016:Q1
Note: Recession indicated by gray shaded column. Data are seasonally adjusted annual rates.Sources: http://research.stlouisfed.org/fred2/series/WASCUR; National Bureau of Economic Research (recession dates); Insurance Information Institute.
Billions
$5,500
$5,750
$6,000
$6,250
$6,500
$6,750
$7,000
$7,250
$7,500
$7,750
$8,000
$8,25005
:Q1
05:Q
205
:Q3
05:Q
406
:Q1
06:Q
206
:Q3
06:Q
407
:Q1
07:Q
207
:Q3
07:Q
408
:Q1
08:Q
208
:Q3
08:Q
409
:Q1
09:Q
209
:Q3
09:Q
410
:Q1
10:Q
210
:Q3
10:Q
411
:Q1
11:Q
211
:Q3
11:Q
412
:Q1
12:Q
212
:Q3
12:Q
413
:Q1
13:Q
213
:Q3
13:Q
414
:Q1
14:Q
214
:Q3
14:Q
415
:Q1
15:Q
215
:Q3
15:Q
416
:Q1
Prior Peak was 2008:Q3 at $6.54 trillion
Recent trough (2009:Q1) was $6.23 trillion, down
5.3% from prior peak
Growth rates2011:Q1 over 2010:Q1: 5.5%2012:Q1 over 2011:Q1: 4.2%2013:Q1 over 2012:Q1: 2.5%2014:Q1 over 2013:Q1: 4.3% 2015:Q1 over 2014:Q1: 4.5%2016:Q1 over 2015:Q1: 4.5%
31
Latest (2016:Q1) was $8.03 trillion, a new
peak--$1.80 trillion (29%) above 2009 trough
$2,000
$3,000
$4,000
$5,000
$6,000
$7,000
90 91 92 93 94 95 96 97 98 99 00 01 02 03 04 05 06 07 08 09 10 11 12 13 14 15$25
$30
$35
$40
$45
$50Wage & Salary DisbursementsWC NPW
32
Payroll Base* WC NWP
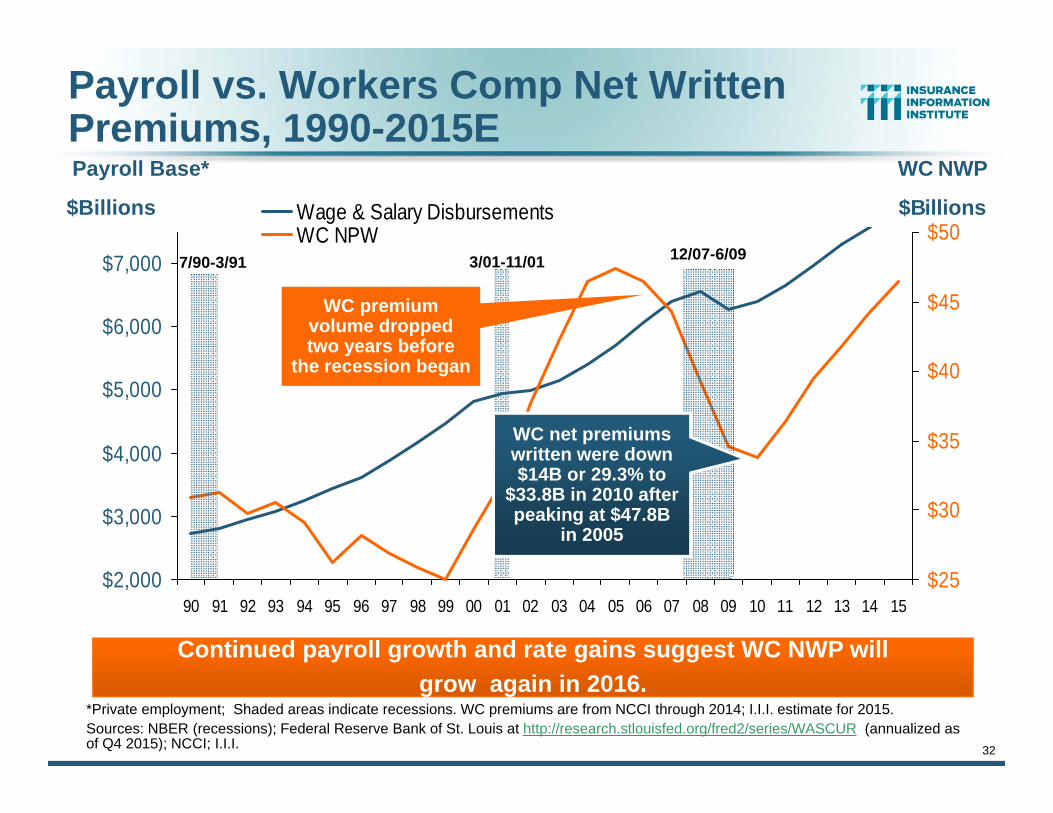
Payroll vs. Workers Comp Net Written Premiums, 1990-2015E
*Private employment; Shaded areas indicate recessions. WC premiums are from NCCI through 2014; I.I.I. estimate for 2015.Sources: NBER (recessions); Federal Reserve Bank of St. Louis at http://research.stlouisfed.org/fred2/series/WASCUR (annualized as of Q4 2015); NCCI; I.I.I.
Continued payroll growth and rate gains suggest WC NWP will grow again in 2016.
7/90-3/91 3/01-11/01 12/07-6/09
$Billions $Billions
WC premium volume dropped two years before
the recession began
WC net premiums written were down $14B or 29.3% to
$33.8B in 2010 after peaking at $47.8B
in 2005
33
POSITIVE LABOR MARKET DEVELOPMENTS
Key Factors Driving Workers Compensation Exposure
33
34
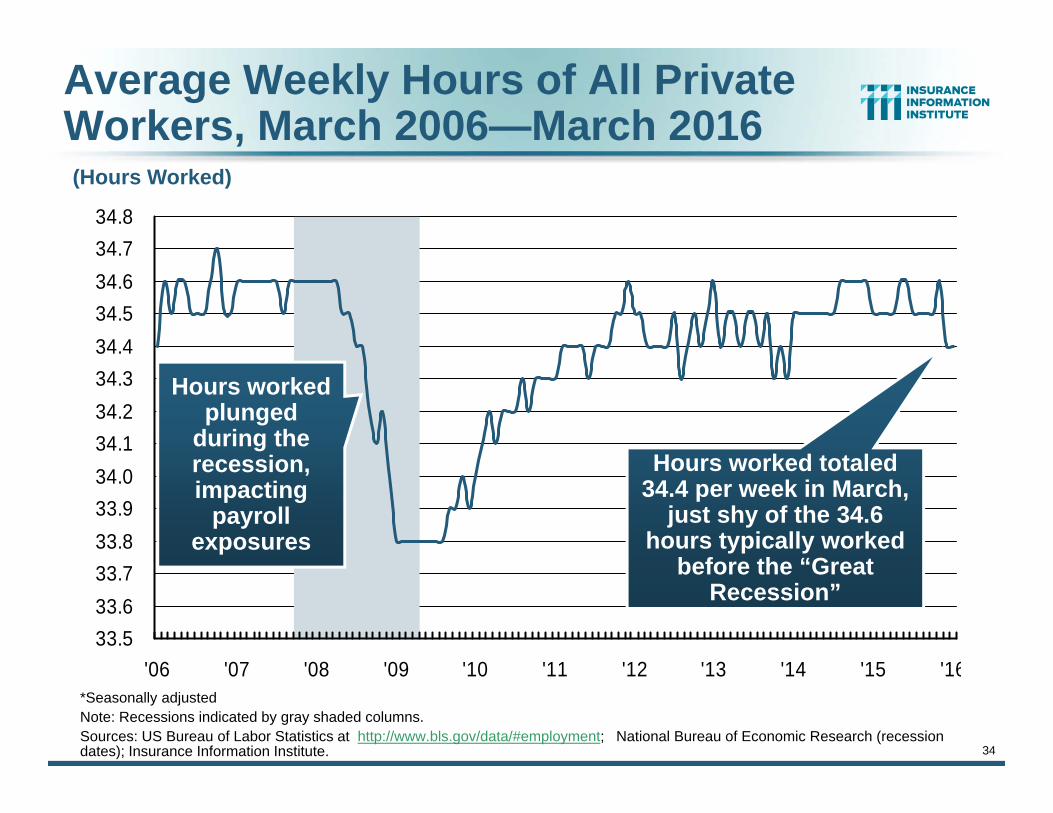
Average Weekly Hours of All Private Workers, March 2006—March 2016
*Seasonally adjustedNote: Recessions indicated by gray shaded columns.Sources: US Bureau of Labor Statistics at http://www.bls.gov/data/#employment; National Bureau of Economic Research (recession dates); Insurance Information Institute.
33.533.633.733.833.934.034.134.234.334.434.534.634.734.8
'06 '07 '08 '09 '10 '11 '12 '13 '14 '15 '16
Hours worked totaled 34.4 per week in March,
just shy of the 34.6 hours typically worked
before the “Great Recession”
Hours worked plunged
during the recession, impacting
payroll exposures
(Hours Worked)
35
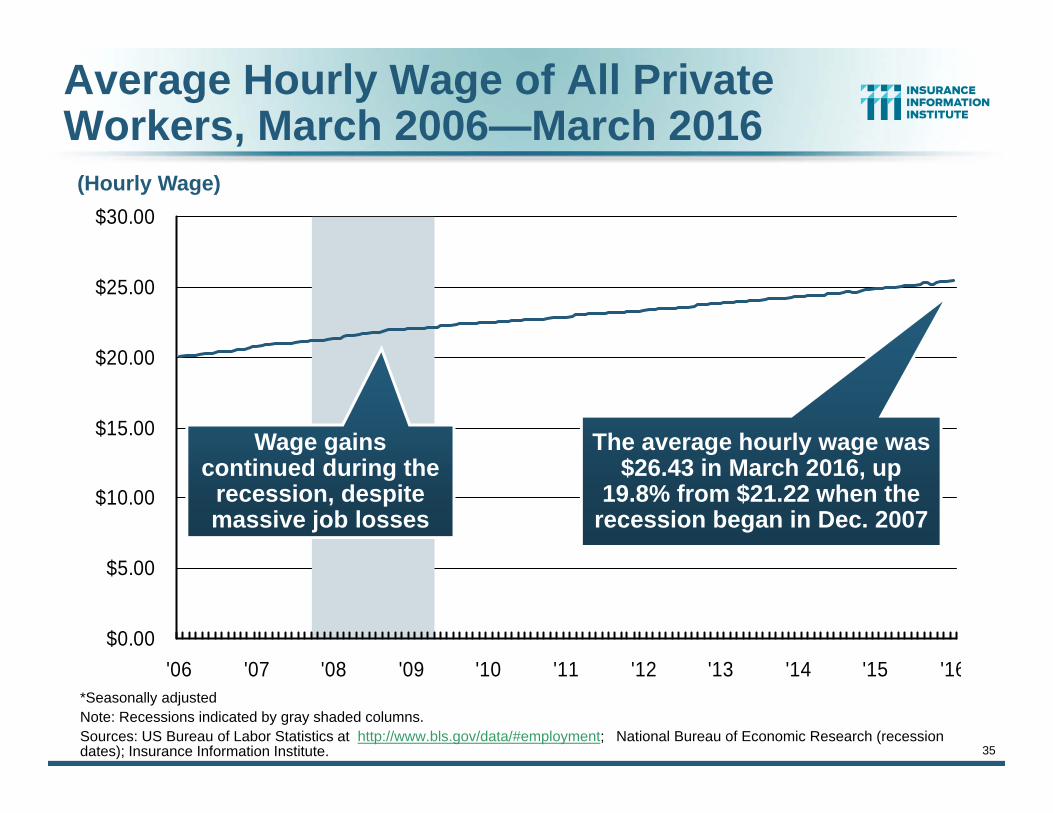
Average Hourly Wage of All Private Workers, March 2006—March 2016
*Seasonally adjustedNote: Recessions indicated by gray shaded columns.Sources: US Bureau of Labor Statistics at http://www.bls.gov/data/#employment; National Bureau of Economic Research (recession dates); Insurance Information Institute.
$0.00
$5.00
$10.00
$15.00
$20.00
$25.00
$30.00
'06 '07 '08 '09 '10 '11 '12 '13 '14 '15 '16
The average hourly wage was $26.43 in March 2016, up
19.8% from $21.22 when the recession began in Dec. 2007
Wage gains continued during the
recession, despite massive job losses
(Hourly Wage)
36
ADVERSE LONG-TERMLABOR MARKET DEVELOPMENTS
Key Factors Harming Workers Compensation Exposure and the
Overall Economy
36
37
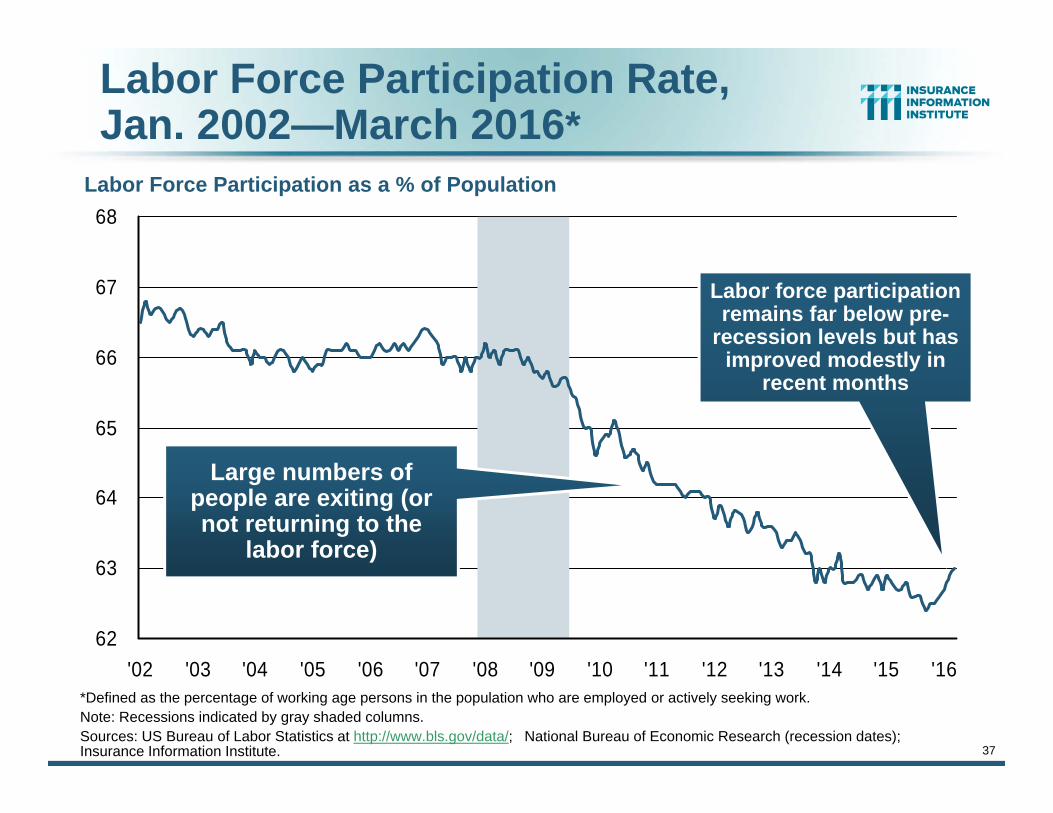
Labor Force Participation Rate,Jan. 2002—March 2016*
*Defined as the percentage of working age persons in the population who are employed or actively seeking work.Note: Recessions indicated by gray shaded columns.Sources: US Bureau of Labor Statistics at http://www.bls.gov/data/; National Bureau of Economic Research (recession dates); Insurance Information Institute.
62
63
64
65
66
67
68
'02 '03 '04 '05 '06 '07 '08 '09 '10 '11 '12 '13 '14 '15 '16
Large numbers of people are exiting (or not returning to the
labor force)
Labor force participation remains far below pre-
recession levels but has improved modestly in
recent months
Labor Force Participation as a % of Population
38
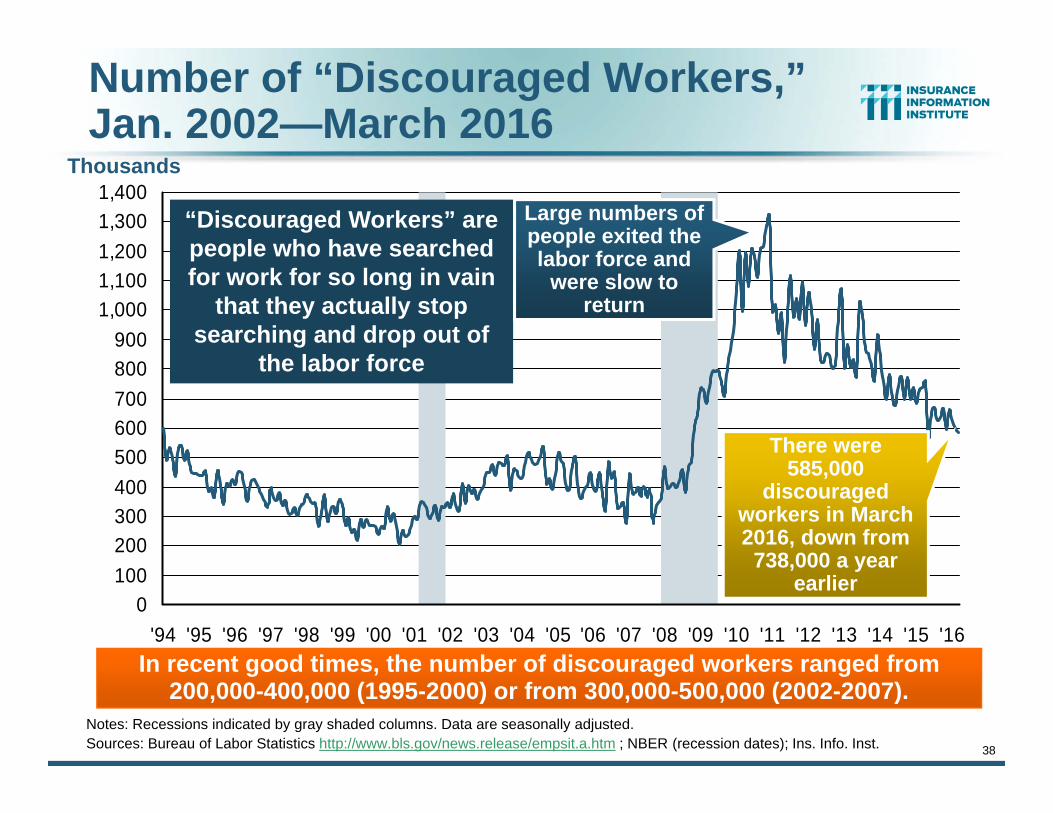
Notes: Recessions indicated by gray shaded columns. Data are seasonally adjusted.Sources: Bureau of Labor Statistics http://www.bls.gov/news.release/empsit.a.htm ; NBER (recession dates); Ins. Info. Inst.
0100200300400500600700800900
1,0001,1001,2001,3001,400
'94 '95 '96 '97 '98 '99 '00 '01 '02 '03 '04 '05 '06 '07 '08 '09 '10 '11 '12 '13 '14 '15 '16In recent good times, the number of discouraged workers ranged from
200,000-400,000 (1995-2000) or from 300,000-500,000 (2002-2007).
There were 585,000
discouraged workers in March 2016, down from
738,000 a year earlier
Thousands
“Discouraged Workers” are people who have searched for work for so long in vain
that they actually stop searching and drop out of
the labor force
Number of “Discouraged Workers,”Jan. 2002—March 2016
Large numbers of people exited the labor force and
were slow to return

CONSTRUCTION INDUSTRY OVERVIEW & OUTLOOK
39
The Construction Sector Is Critical to the Economy and the P/C Insurance Industry
39
40
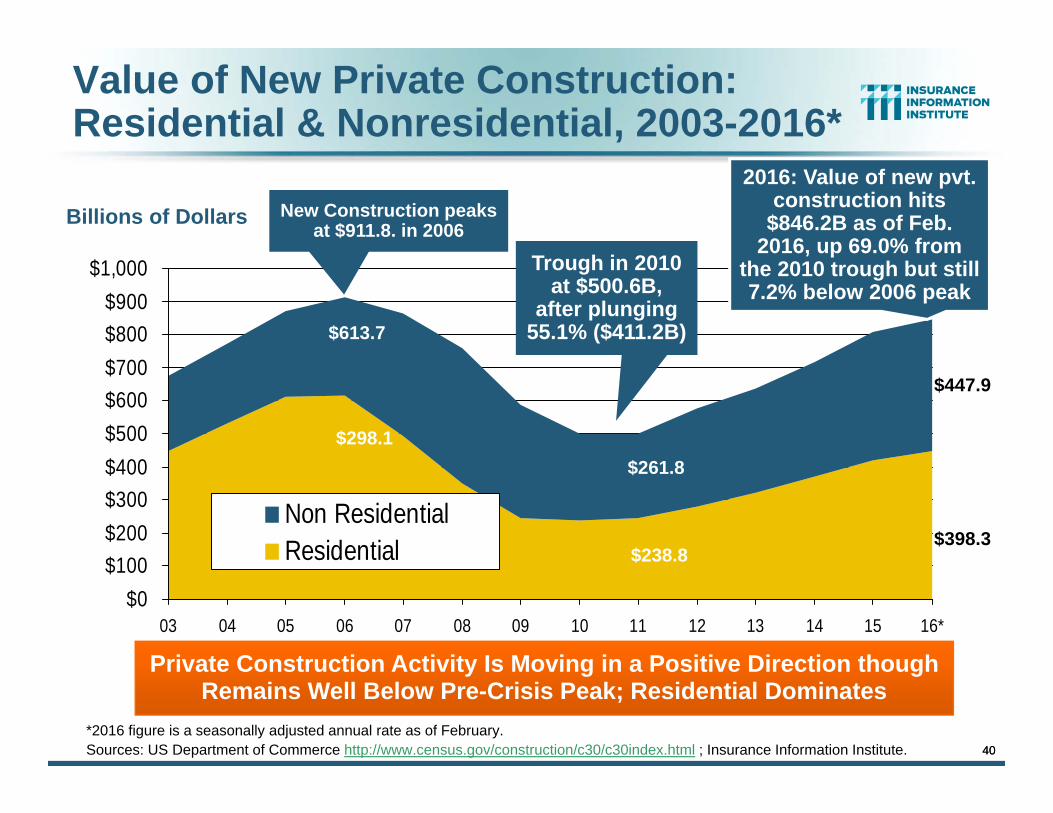
Value of New Private Construction: Residential & Nonresidential, 2003-2016*
Billions of Dollars
$0$100$200$300$400$500$600$700$800$900
$1,000
03 04 05 06 07 08 09 10 11 12 13 14 15 16*
Non ResidentialResidential
Private Construction Activity Is Moving in a Positive Direction though Remains Well Below Pre-Crisis Peak; Residential Dominates
$298.1
$613.7
New Construction peaks at $911.8. in 2006
Trough in 2010 at $500.6B,
after plunging 55.1% ($411.2B)
2016: Value of new pvt. construction hits
$846.2B as of Feb. 2016, up 69.0% from
the 2010 trough but still 7.2% below 2006 peak
40
$261.8
$238.8
$447.9
$398.3
*2016 figure is a seasonally adjusted annual rate as of February.Sources: US Department of Commerce http://www.census.gov/construction/c30/c30index.html ; Insurance Information Institute.
41
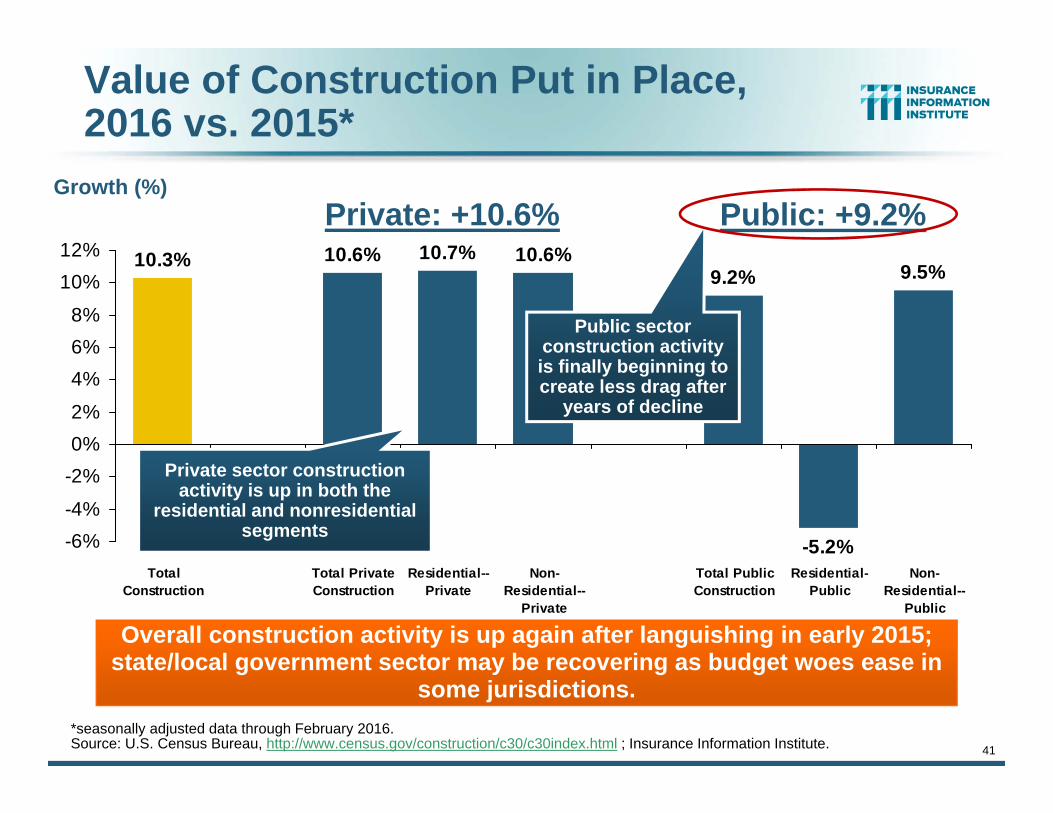
Value of Construction Put in Place, 2016 vs. 2015*
9.2%
-5.2%
9.5%10.3% 10.6% 10.7% 10.6%
-6%-4%
-2%0%2%
4%6%8%
10%12%
TotalConstruction
Total PrivateConstruction
Residential--Private
Non-Residential--
Private
Total PublicConstruction
Residential-Public
Non-Residential--
Public
Overall construction activity is up again after languishing in early 2015; state/local government sector may be recovering as budget woes ease in
some jurisdictions.
Growth (%)
Private sector construction activity is up in both the
residential and nonresidential segments
*seasonally adjusted data through February 2016.Source: U.S. Census Bureau, http://www.census.gov/construction/c30/c30index.html ; Insurance Information Institute.
Private: +10.6% Public: +9.2%
Public sector construction activity is finally beginning to create less drag after
years of decline
42
(Millions of Units)
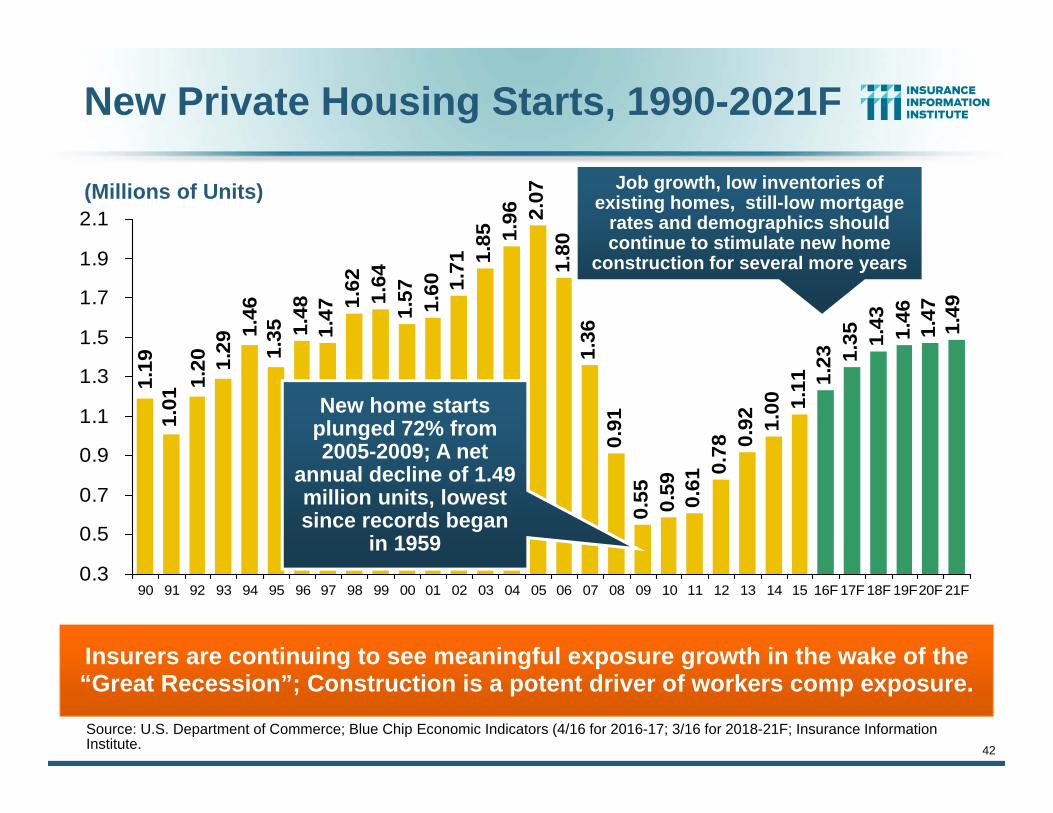
New Private Housing Starts, 1990-2021F
1.48
1.47 1.
62 1.64
1.57 1.60 1.
71 1.85 1.
96 2.07
1.80
1.36
0.91
0.55 0.59 0.61
0.78 0.
92 1.00 1.
11 1.23 1.
35 1.43 1.46
1.47 1.49
1.351.
461.
291.
201.
011.
19
0.3
0.5
0.7
0.9
1.1
1.3
1.5
1.7
1.9
2.1
90 91 92 93 94 95 96 97 98 99 00 01 02 03 04 05 06 07 08 09 10 11 12 13 14 15 16F 17F 18F 19F20F 21F
Source: U.S. Department of Commerce; Blue Chip Economic Indicators (4/16 for 2016-17; 3/16 for 2018-21F; Insurance Information Institute.
Insurers are continuing to see meaningful exposure growth in the wake of the “Great Recession”; Construction is a potent driver of workers comp exposure.
New home starts plunged 72% from 2005-2009; A net
annual decline of 1.49 million units, lowest since records began
in 1959
Job growth, low inventories of existing homes, still-low mortgage
rates and demographics should continue to stimulate new home
construction for several more years
43
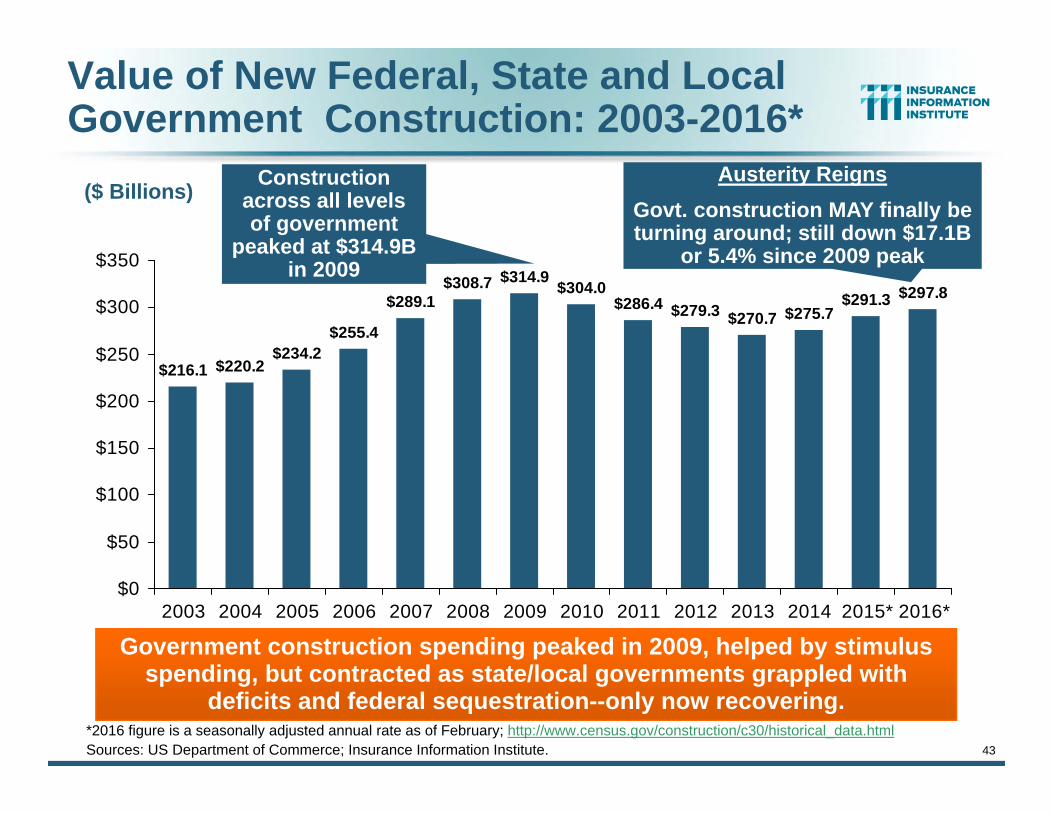
$314.9 $304.0$286.4 $279.3 $270.7 $275.7
$291.3 $297.8
$216.1 $220.2$234.2
$255.4
$289.1$308.7
$0
$50
$100
$150
$200
$250
$300
$350
2003 2004 2005 2006 2007 2008 2009 2010 2011 2012 2013 2014 2015* 2016*
($ Billions)
Government construction spending peaked in 2009, helped by stimulus spending, but contracted as state/local governments grappled with
deficits and federal sequestration--only now recovering.
Value of New Federal, State and Local Government Construction: 2003-2016*
*2016 figure is a seasonally adjusted annual rate as of February; http://www.census.gov/construction/c30/historical_data.htmlSources: US Department of Commerce; Insurance Information Institute.
Construction across all levels of government
peaked at $314.9B in 2009
Austerity ReignsGovt. construction MAY finally be turning around; still down $17.1B
or 5.4% since 2009 peak
44
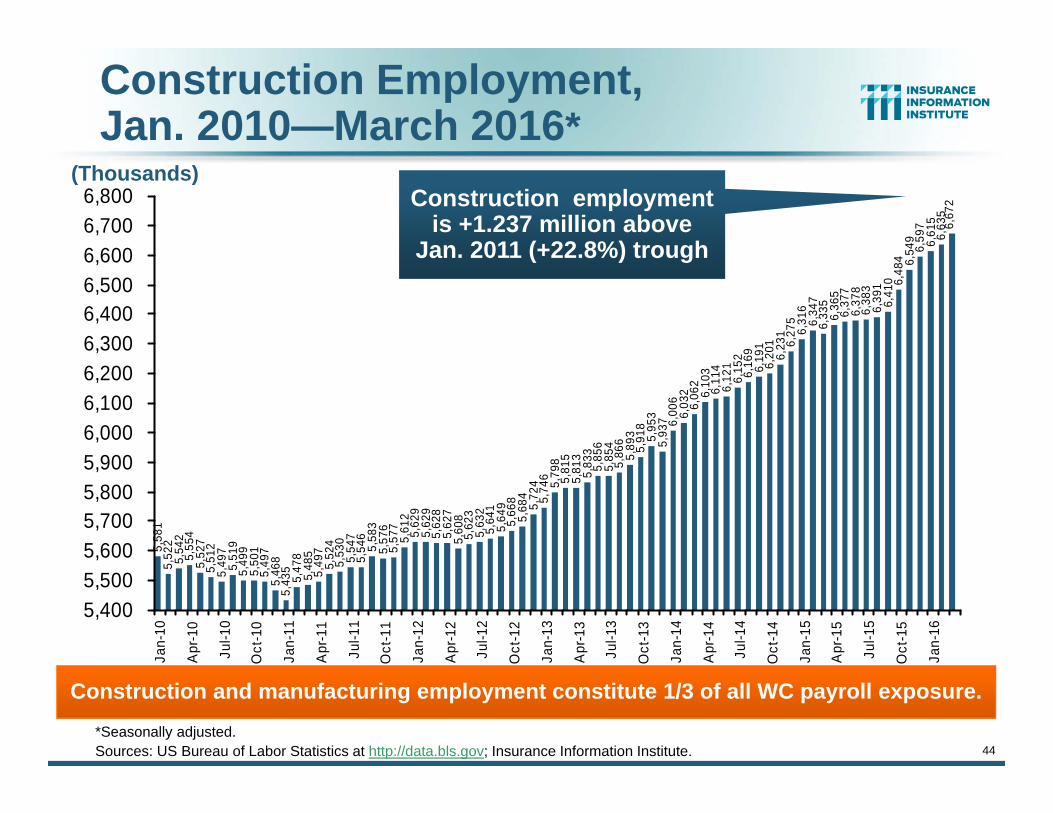
Construction Employment,Jan. 2010—March 2016*
*Seasonally adjusted.Sources: US Bureau of Labor Statistics at http://data.bls.gov; Insurance Information Institute.
5,58
15,
522
5,54
25,
554
5,52
75,
512
5,49
75,
519
5,49
95,
501
5,49
75,
468
5,43
55,
478
5,48
55,
497
5,52
45,
530
5,54
75,
546
5,58
35,
576
5,57
75,
612
5,62
95,
629
5,62
85,
627
5,60
85,
623
5,63
25,
641
5,64
95,
668
5,68
45,
724
5,74
6 5,79
85,
815
5,81
35,
833
5,85
65,
854
5,86
65,
893
5,91
85,
953
5,93
7 6,00
66,
032
6,06
26,
103
6,11
46,
121
6,15
26,
169
6,19
16,
201
6,23
16,
275
6,31
66,
347
6,33
56,
365
6,37
76,
378
6,38
36,
391
6,41
0 6,48
4 6,54
96,
597
6,61
56,
635
6,67
2
5,4005,5005,6005,7005,8005,9006,0006,1006,2006,3006,4006,5006,6006,7006,800
Jan-
10
Apr
-10
Jul-1
0
Oct
-10
Jan-
11
Apr
-11
Jul-1
1
Oct
-11
Jan-
12
Apr
-12
Jul-1
2
Oct
-12
Jan-
13
Apr
-13
Jul-1
3
Oct
-13
Jan-
14
Apr
-14
Jul-1
4
Oct
-14
Jan-
15
Apr
-15
Jul-1
5
Oct
-15
Jan-
16
Construction employment is +1.237 million above
Jan. 2011 (+22.8%) trough
(Thousands)
Construction and manufacturing employment constitute 1/3 of all WC payroll exposure.
45
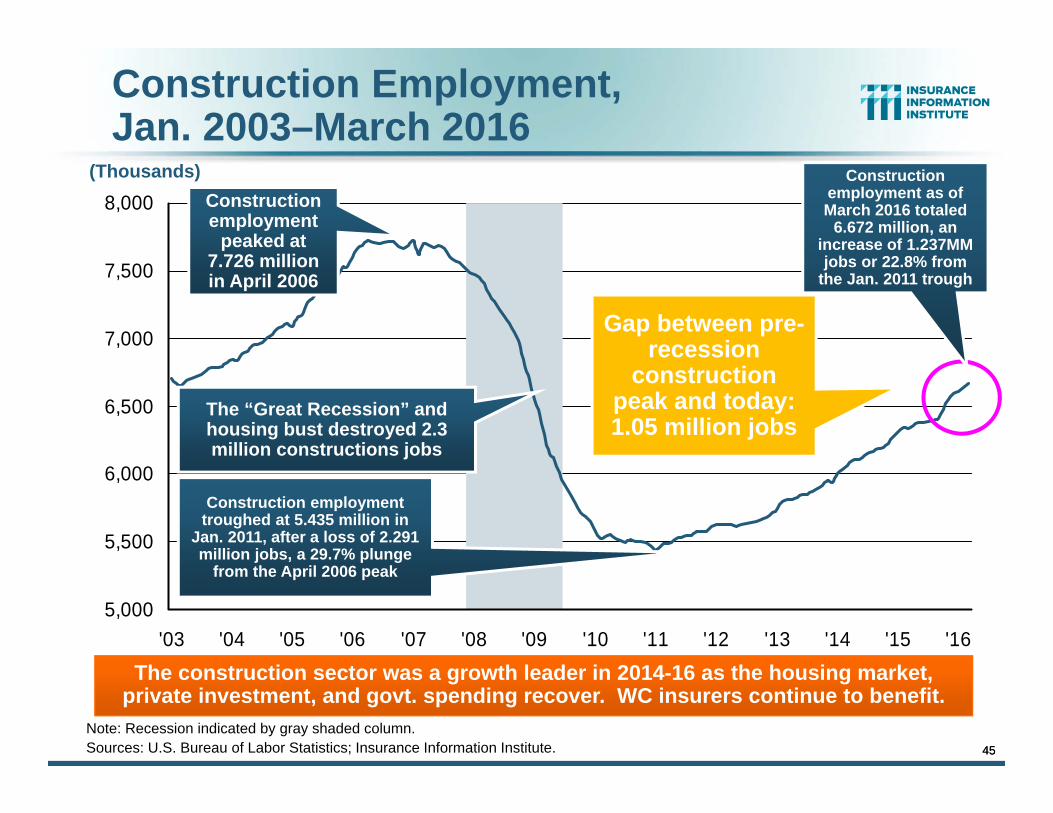
Construction Employment, Jan. 2003–March 2016
Note: Recession indicated by gray shaded column.Sources: U.S. Bureau of Labor Statistics; Insurance Information Institute.
5,000
5,500
6,000
6,500
7,000
7,500
8,000
'03 '04 '05 '06 '07 '08 '09 '10 '11 '12 '13 '14 '15 '16
The “Great Recession” and housing bust destroyed 2.3 million constructions jobs
The construction sector was a growth leader in 2014-16 as the housing market, private investment, and govt. spending recover. WC insurers continue to benefit.
Construction employment troughed at 5.435 million in
Jan. 2011, after a loss of 2.291 million jobs, a 29.7% plunge
from the April 2006 peak
45
Construction employment
peaked at 7.726 million in April 2006
(Thousands) Construction employment as of March 2016 totaled
6.672 million, an increase of 1.237MM jobs or 22.8% from
the Jan. 2011 trough
Gap between pre-recession
construction peak and today: 1.05 million jobs

MANUFACTURING & ENERGY SECTOR OVERVIEW & OUTLOOK
46
The U.S. Manufacturing and Energy Sectors Are Being Buffeted by a
High Dollar, Weak Export Markets and Plunging Oil Prices
46
47
$200,000
$300,000
$400,000
$500,000
Jan-9
2Ja
n-93
Jan-9
4Ja
n-95
Jan-9
6Ja
n-97
Jan-9
8Ja
n-99
Jan-0
0Ja
n 01
Jan 0
2Ja
n 03
Jan 0
4Ja
n 05
Jan 0
6Ja
n 07
Jan 0
8Ja
n 09
Jan 1
0Ja
n 11
Jan 1
2Ja
n 13
Jan 1
4Ja
n 15
Jan 1
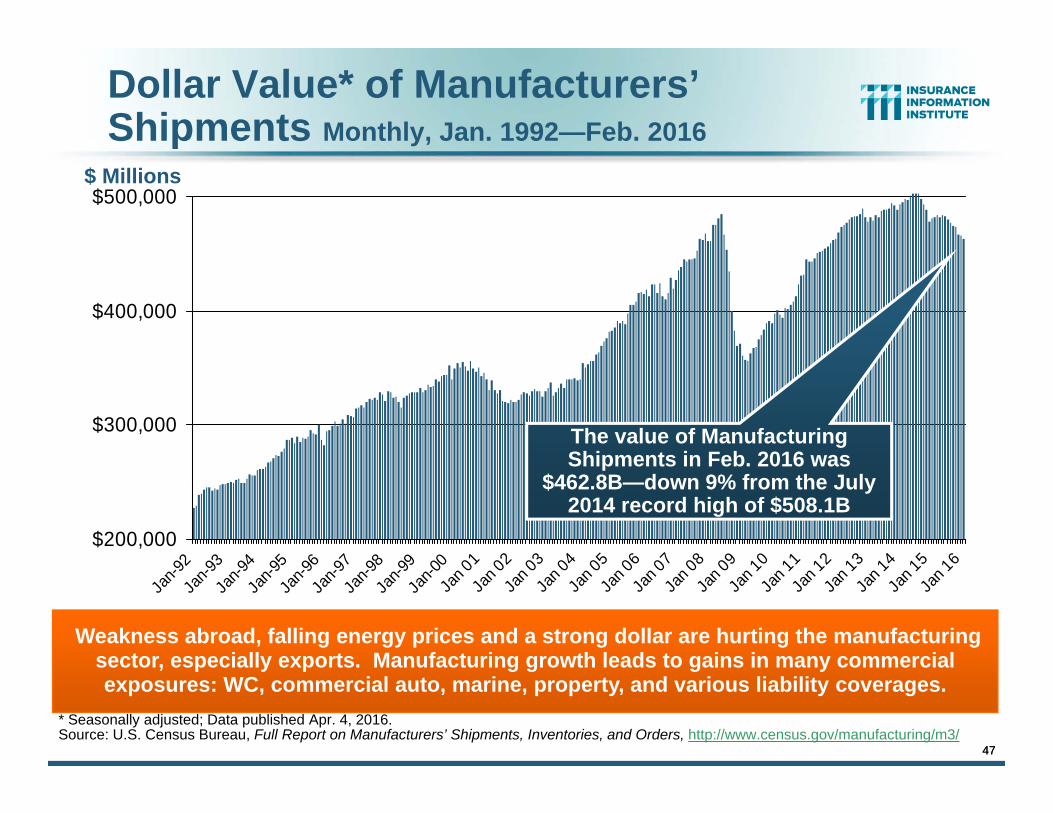
6Dollar Value* of Manufacturers’ Shipments Monthly, Jan. 1992—Feb. 2016
* Seasonally adjusted; Data published Apr. 4, 2016.Source: U.S. Census Bureau, Full Report on Manufacturers’ Shipments, Inventories, and Orders, http://www.census.gov/manufacturing/m3/
Weakness abroad, falling energy prices and a strong dollar are hurting the manufacturing sector, especially exports. Manufacturing growth leads to gains in many commercial exposures: WC, commercial auto, marine, property, and various liability coverages.
$ Millions
47
The value of Manufacturing Shipments in Feb. 2016 was
$462.8B—down 9% from the July 2014 record high of $508.1B
58.3
57.1
60.4
59.6
57.8
55.3
55.1
55.2
55.3 56
.9 58.2
58.5
60.8 61.4
59.7
59.7
54.2 55
.851
.4 52.5
52.5
51.8 52.2 53
.1 54.1
51.9 53
.3 54.1
52.5
50.2
50.5
50.7 51
.651
.749
.950
.253
.1 54.2
50.7
49.0
50.9
55.4
55.7 56.2
56.4 57
.056
.551
.353
.2 53.7 54
.9 55.4
55.3 57
.159
.056
.659
.058
.755
.553
.553
.352
.351
.6 53.1
53.1
51.9
51.0
50.0
49.4
48.4
48.0
48.2 49
.551
.850
.851.3
40
45
50
55
60
65
Jan-
10Fe
b-10
Mar
-10
Apr
-10
May
-10
Jun-
10Ju
l-10
Aug
-10
Sep
-10
Oct
-10
Nov
-10
Dec
-10
Jan-
11Fe
b-11
Mar
-11
Apr
-11
May
-11
Jun-
11Ju
l-11
Aug
-11
Sep
-11
Oct
-11
Nov
-11
Dec
-11
Jan-
12Fe
b-12
Mar
-12
Apr
-12
May
-12
Jun-
12Ju
l-12
Aug
-12
Sep
-12
Oct
-12
Nov
-12
Dec
-12
Jan-
13Fe
b-13
Mar
-13
Apr
-13
May
-13
Jun-
13Ju
l-13
Aug
-13
Sep
-13
Oct
-13
Nov
-13
Dec
-13
Jan-
14Fe
b-14
Mar
-14
Apr
-14
May
-14
Jun-
14Ju
l-14
Aug
-14
Sep
-14
Oct
-14
Nov
-14
Dec
-14
Jan-
15Fe
b-15
Mar
-15
Apr
-15
May
-15
Jun-
15Ju
l-15
Aug
-15
Sep
-15
Oct
-15
Nov
-15
Dec
-15
Jan-
16Fe
b-16
Mar
-16
Apr
-16
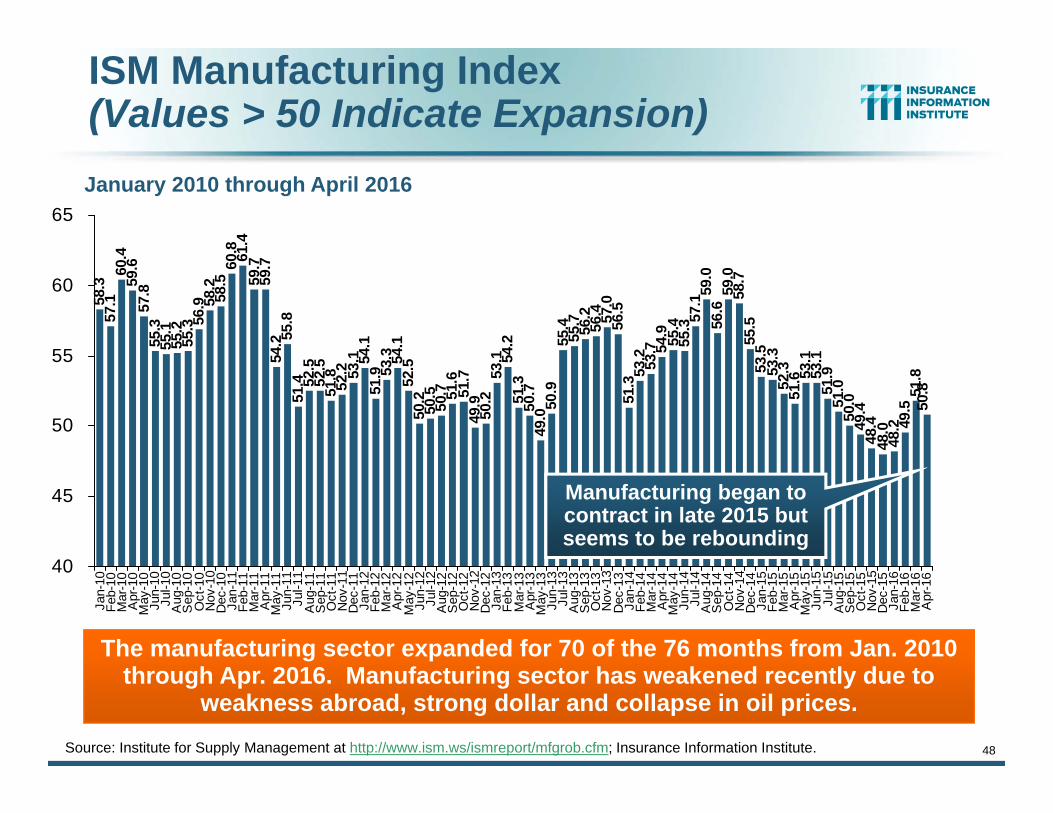
ISM Manufacturing Index(Values > 50 Indicate Expansion)January 2010 through April 2016
The manufacturing sector expanded for 70 of the 76 months from Jan. 2010 through Apr. 2016. Manufacturing sector has weakened recently due to
weakness abroad, strong dollar and collapse in oil prices.Source: Institute for Supply Management at http://www.ism.ws/ismreport/mfgrob.cfm; Insurance Information Institute.
Manufacturing began to contract in late 2015 but seems to be rebounding
48
49
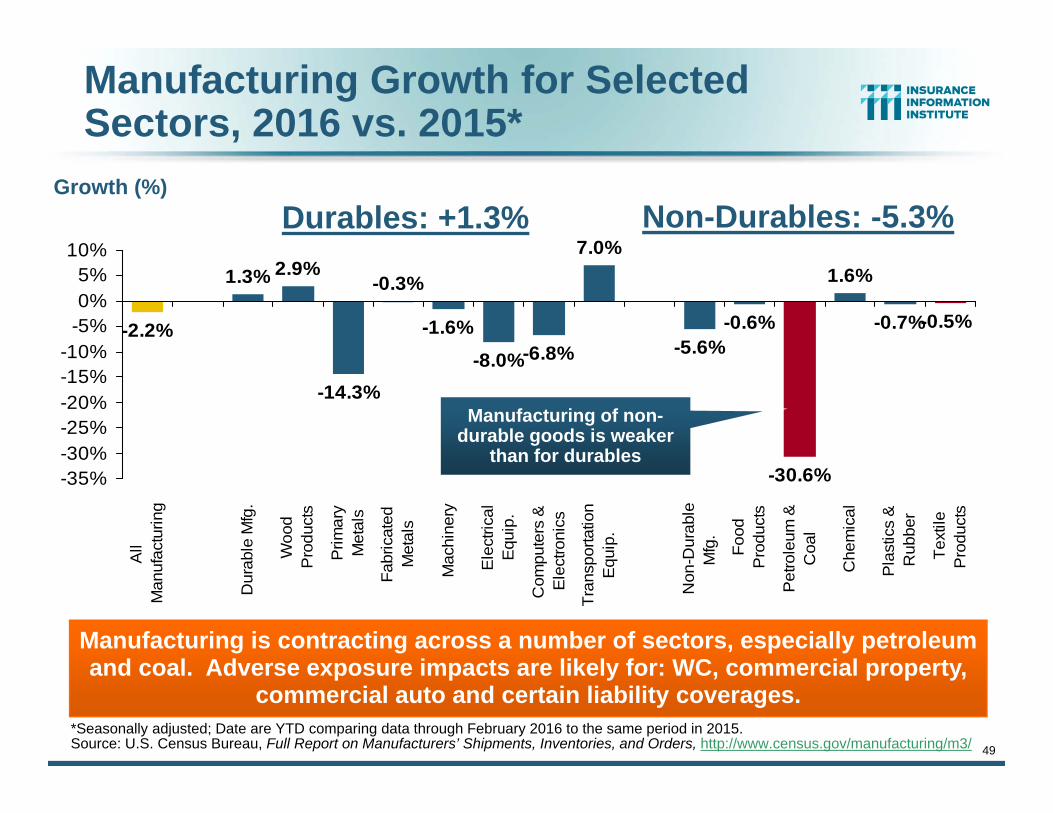
Manufacturing Growth for Selected Sectors, 2016 vs. 2015*
-1.6%-8.0%-6.8%
7.0%
-5.6%-0.6%
-30.6%
1.6%
-0.7%-0.5%-2.2%
1.3% 2.9%
-14.3%
-0.3%
-35%-30%-25%-20%-15%-10%
-5%0%5%
10%
All
Man
ufac
turin
g
Dur
able
Mfg
.
Woo
dP
rodu
cts
Prim
ary
Met
als
Fabr
icat
edM
etal
s
Mac
hine
ry
Ele
ctric
alE
quip
.
Com
pute
rs &
Ele
ctro
nics
Tran
spor
tatio
nE
quip
.
Non
-Dur
able
Mfg
.
Food
Pro
duct
s
Pet
role
um &
Coa
l
Che
mic
al
Pla
stic
s &
Rub
ber
Text
ileP
rodu
cts
Manufacturing is contracting across a number of sectors, especially petroleum and coal. Adverse exposure impacts are likely for: WC, commercial property,
commercial auto and certain liability coverages.
Growth (%)
Manufacturing of non-durable goods is weaker
than for durables
*Seasonally adjusted; Date are YTD comparing data through February 2016 to the same period in 2015.Source: U.S. Census Bureau, Full Report on Manufacturers’ Shipments, Inventories, and Orders, http://www.census.gov/manufacturing/m3/
Durables: +1.3% Non-Durables: -5.3%
50
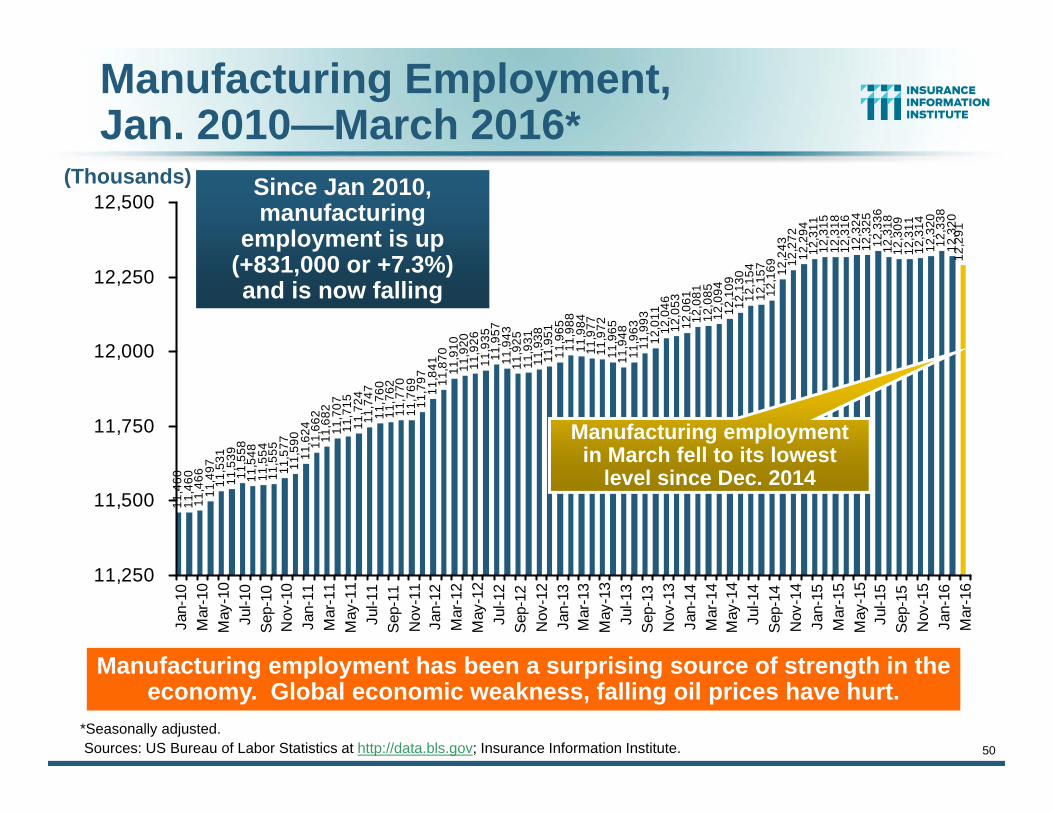
Manufacturing Employment,Jan. 2010—March 2016*
11,4
6011
,460
11,4
6611
,497
11,5
3111
,539
11,5
5811
,548
11,5
5411
,555
11,5
7711
,590
11,6
2411
,662
11,6
8211
,707
11,7
1511
,724
11,7
4711
,760
11,7
6211
,770
11,7
6911
,797
11,8
4111
,870
11,9
1011
,920
11,9
2611
,935
11,9
5711
,943
11,9
2511
,931
11,9
3811
,951
11,9
6511
,988
11,9
8411
,977
11,9
7211
,965
11,9
4811
,963
11,9
9312
,011
12,0
4612
,053
12,0
6112
,081
12,0
8512
,094
12,1
0912
,130
12,1
5412
,157
12,1
69 12,2
4312
,272
12,2
9412
,311
12,3
1512
,318
12,3
1612
,324
12,3
2512
,336
12,3
1812
,309
12,3
1112
,314
12,3
2012
,338
12,3
2012
,291
11,250
11,500
11,750
12,000
12,250
12,500Ja
n-10
Mar
-10
May
-10
Jul-1
0S
ep-1
0N
ov-1
0Ja
n-11
Mar
-11
May
-11
Jul-1
1S
ep-1
1N
ov-1
1Ja
n-12
Mar
-12
May
-12
Jul-1
2S
ep-1
2N
ov-1
2Ja
n-13
Mar
-13
May
-13
Jul-1
3S
ep-1
3N
ov-1
3Ja
n-14
Mar
-14
May
-14
Jul-1
4S
ep-1
4N
ov-1
4Ja
n-15
Mar
-15
May
-15
Jul-1
5S
ep-1
5N
ov-1
5Ja
n-16
Mar
-16
Manufacturing employment has been a surprising source of strength in the economy. Global economic weakness, falling oil prices have hurt.
*Seasonally adjusted.Sources: US Bureau of Labor Statistics at http://data.bls.gov; Insurance Information Institute.
(Thousands) Since Jan 2010, manufacturing
employment is up (+831,000 or +7.3%)and is now falling
Manufacturing employment in March fell to its lowest
level since Dec. 2014
51
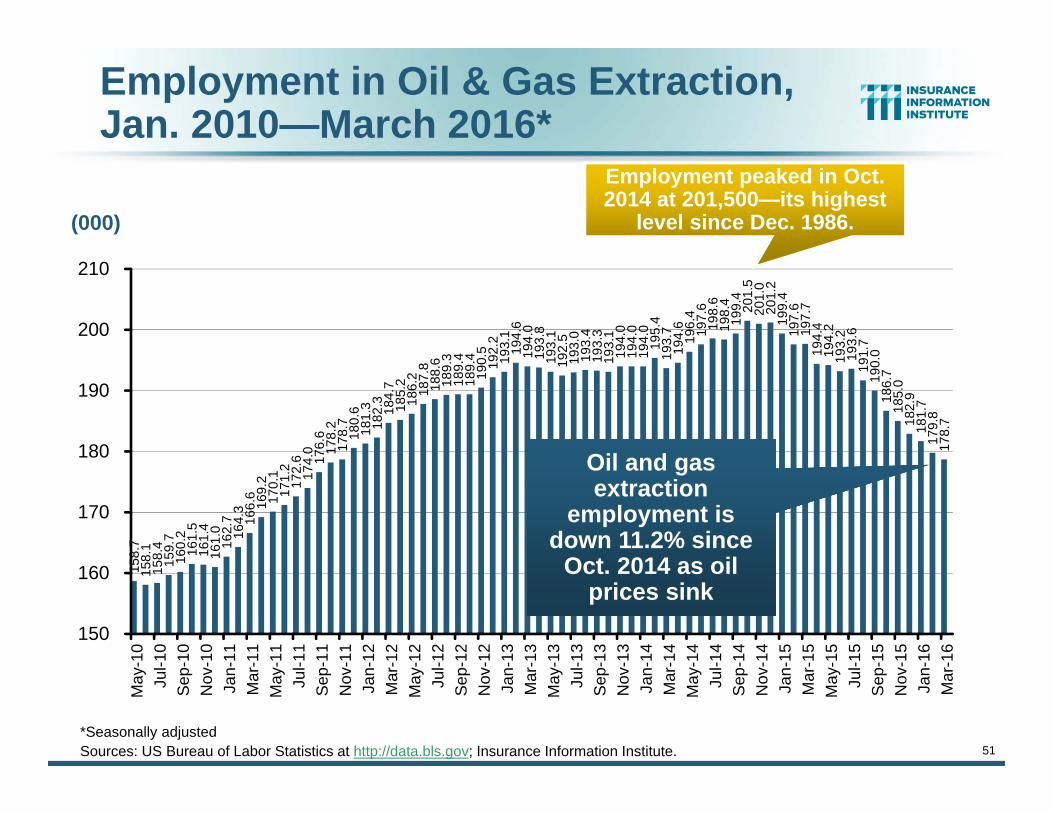
Employment in Oil & Gas Extraction,Jan. 2010—March 2016*
*Seasonally adjustedSources: US Bureau of Labor Statistics at http://data.bls.gov; Insurance Information Institute.
158.
715
8.1
158.
415
9.7
160.
216
1.5
161.
416
1.0
162.
716
4.3
166.
616
9.2
170.
117
1.2
172.
617
4.0
176.
617
8.2
178.
718
0.6
181.
318
2.3
184.
718
5.2
186.
218
7.8
188.
618
9.3
189.
418
9.4
190.
519
2.2
193.
119
4.6
194.
019
3.8
193.
119
2.5
193.
019
3.4
193.
319
3.1
194.
019
4.0
194.
019
5.4
193.
719
4.6
196.
419
7.6
198.
619
8.4
199.
420
1.5
201.
020
1.2
199.
419
7.6
197.
719
4.4
194.
219
3.2
193.
619
1.7
190.
018
6.7
185.
018
2.9
181.
717
9.8
178.
7
150
160
170
180
190
200
210
May
-10
Jul-1
0S
ep-1
0N
ov-1
0Ja
n-11
Mar
-11
May
-11
Jul-1
1S
ep-1
1N
ov-1
1Ja
n-12
Mar
-12
May
-12
Jul-1
2S
ep-1
2N
ov-1
2Ja
n-13
Mar
-13
May
-13
Jul-1
3S
ep-1
3N
ov-1
3Ja
n-14
Mar
-14
May
-14
Jul-1
4S
ep-1
4N
ov-1
4Ja
n-15
Mar
-15
May
-15
Jul-1
5S
ep-1
5N
ov-1
5Ja
n-16
Mar
-16
Oil and gas extraction
employment is down 11.2% since
Oct. 2014 as oil prices sink
(000)
Employment peaked in Oct. 2014 at 201,500—its highest
level since Dec. 1986.
The Sharing Economy: An Update
The On-Demand Economy Will Transform the American
Workforce and the P/C Insurance Industry Too
52
53
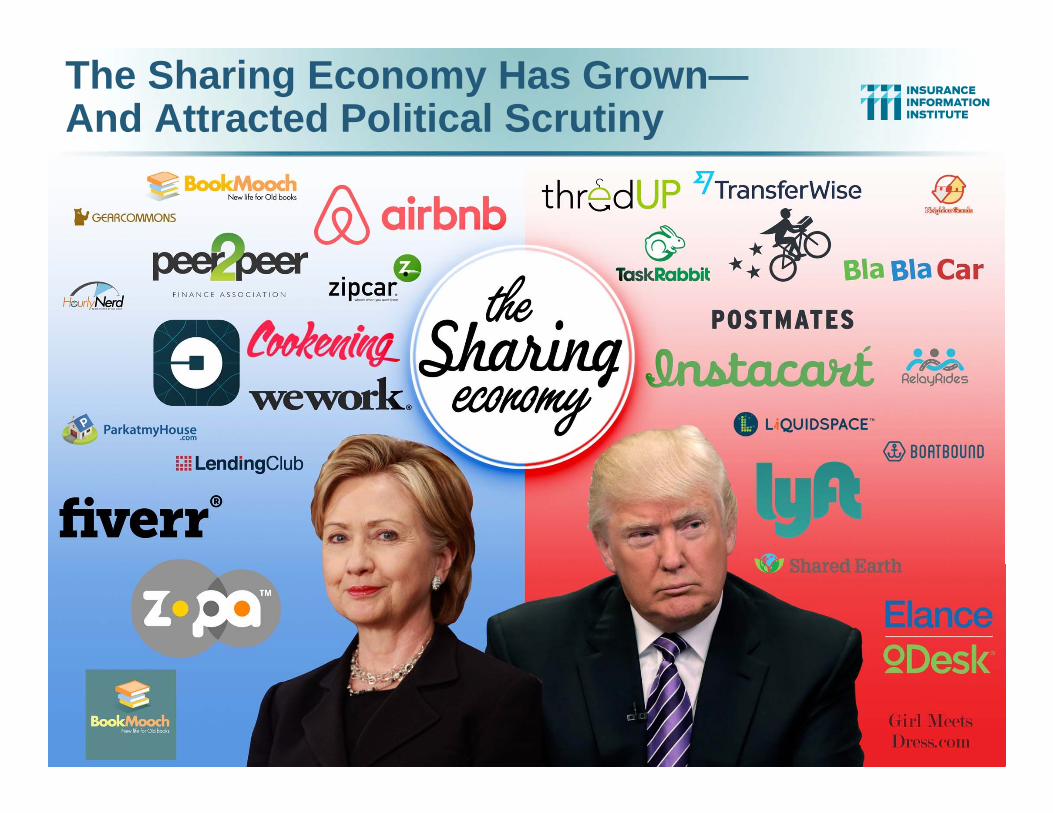
The Sharing Economy Has Grown—And Attracted Political Scrutiny
54
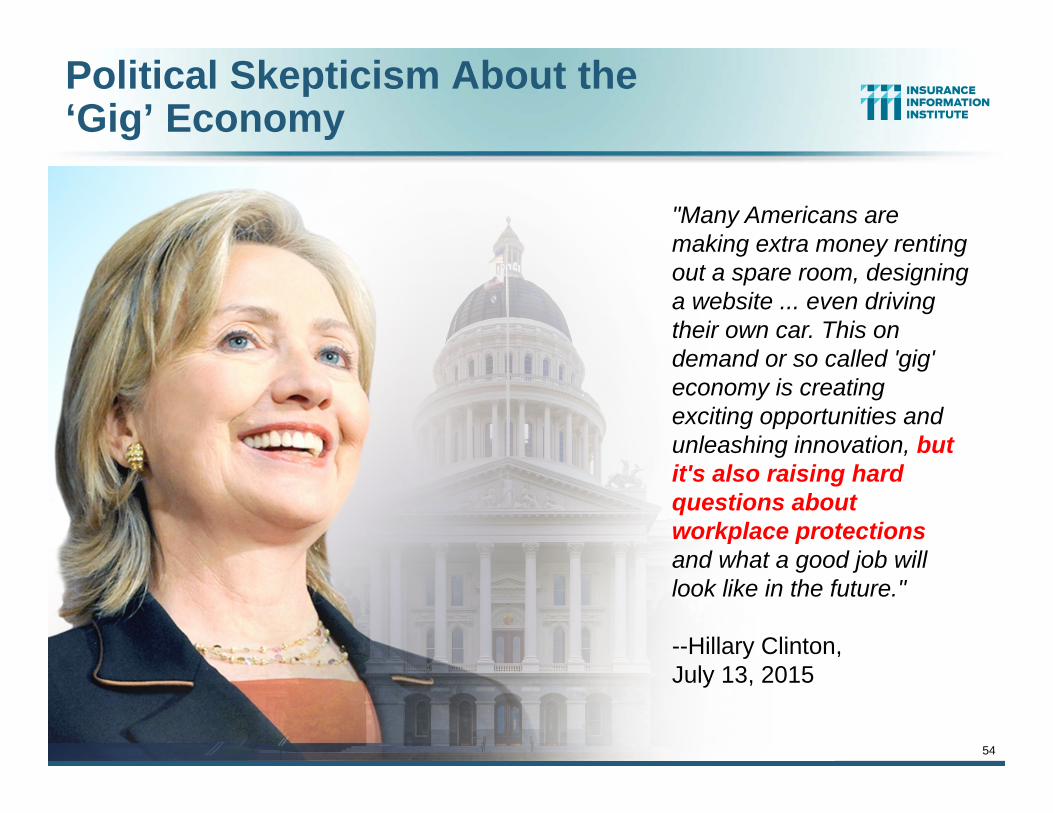
Political Skepticism About the‘Gig’ Economy
"Many Americans are making extra money renting out a spare room, designing a website ... even driving their own car. This on demand or so called 'gig' economy is creating exciting opportunities and unleashing innovation, but it's also raising hard questions about workplace protections and what a good job will look like in the future."
--Hillary Clinton, July 13, 2015
55
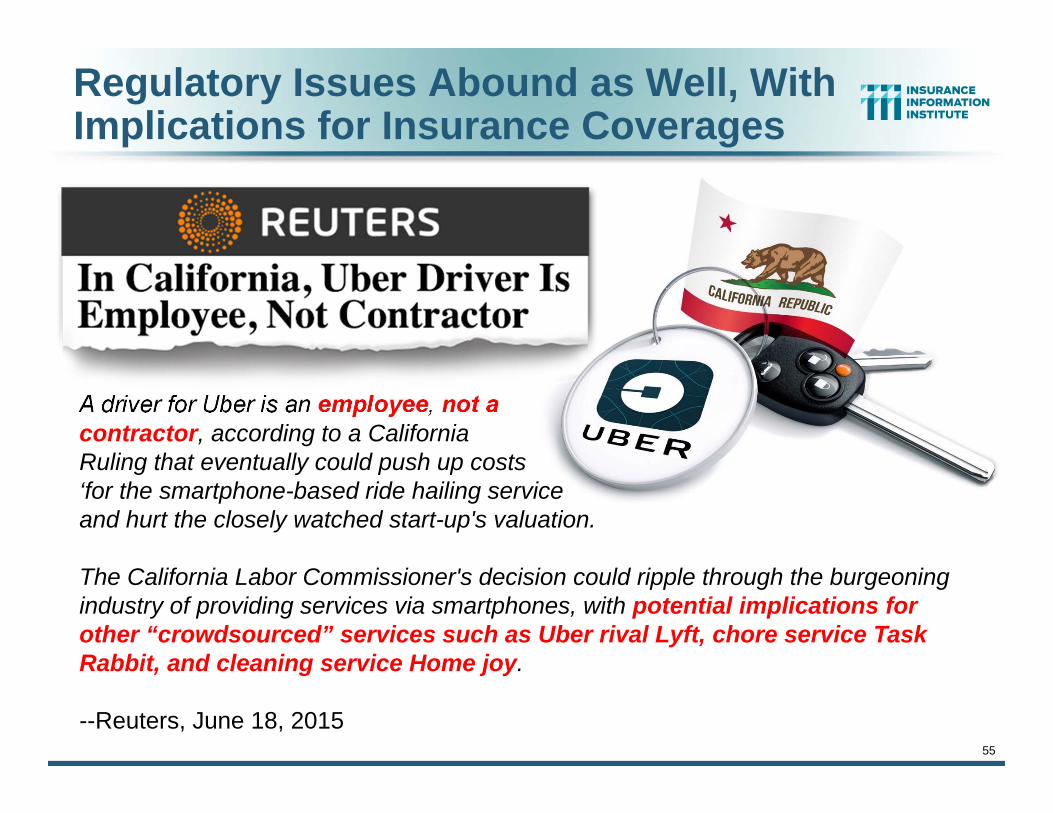
Regulatory Issues Abound as Well, With Implications for Insurance Coverages
A driver for Uber is an employee, not a contractor, according to a California Ruling that eventually could push up costs ‘for the smartphone-based ride hailing service and hurt the closely watched start-up's valuation.
The California Labor Commissioner's decision could ripple through the burgeoning industry of providing services via smartphones, with potential implications for other “crowdsourced” services such as Uber rival Lyft, chore service Task Rabbit, and cleaning service Home joy.
--Reuters, June 18, 2015
56
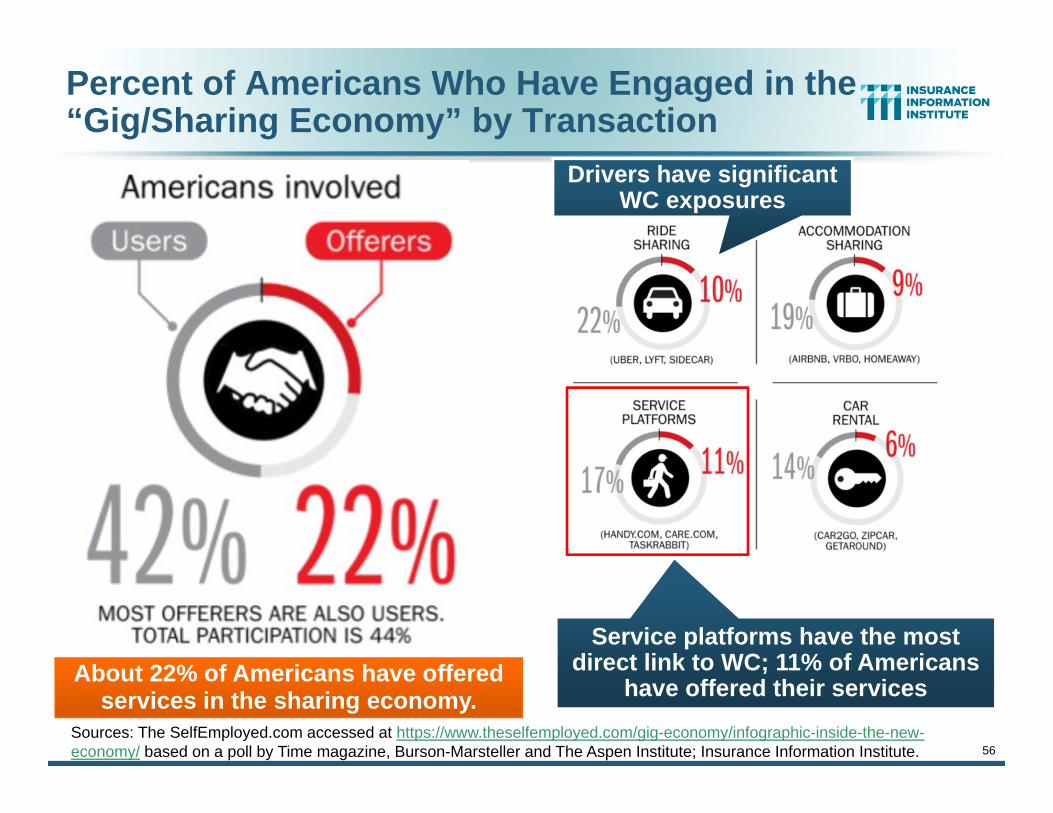
Percent of Americans Who Have Engaged in the “Gig/Sharing Economy” by Transaction
Sources: The SelfEmployed.com accessed at https://www.theselfemployed.com/gig-economy/infographic-inside-the-new-economy/ based on a poll by Time magazine, Burson-Marsteller and The Aspen Institute; Insurance Information Institute.
About 22% of Americans have offered services in the sharing economy.
Service platforms have the most direct link to WC; 11% of Americans
have offered their services
Drivers have significant WC exposures
57
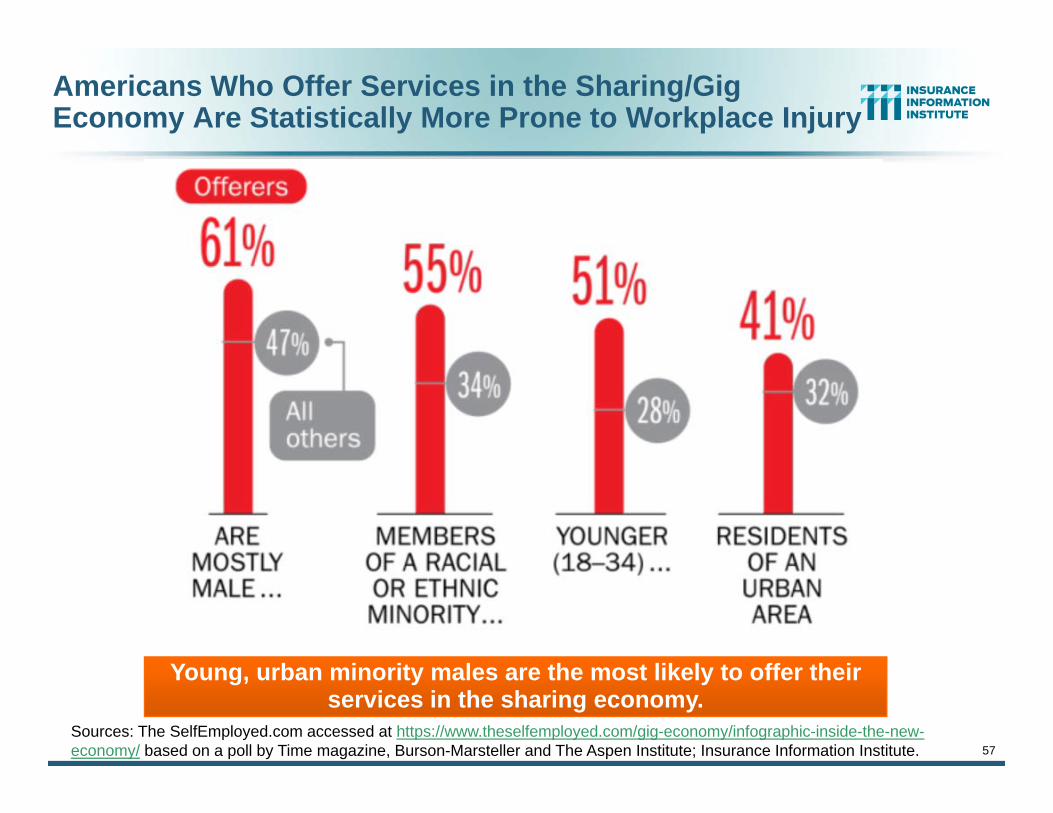
Americans Who Offer Services in the Sharing/Gig Economy Are Statistically More Prone to Workplace Injury
Sources: The SelfEmployed.com accessed at https://www.theselfemployed.com/gig-economy/infographic-inside-the-new-economy/ based on a poll by Time magazine, Burson-Marsteller and The Aspen Institute; Insurance Information Institute.
Young, urban minority males are the most likely to offer their services in the sharing economy.
58
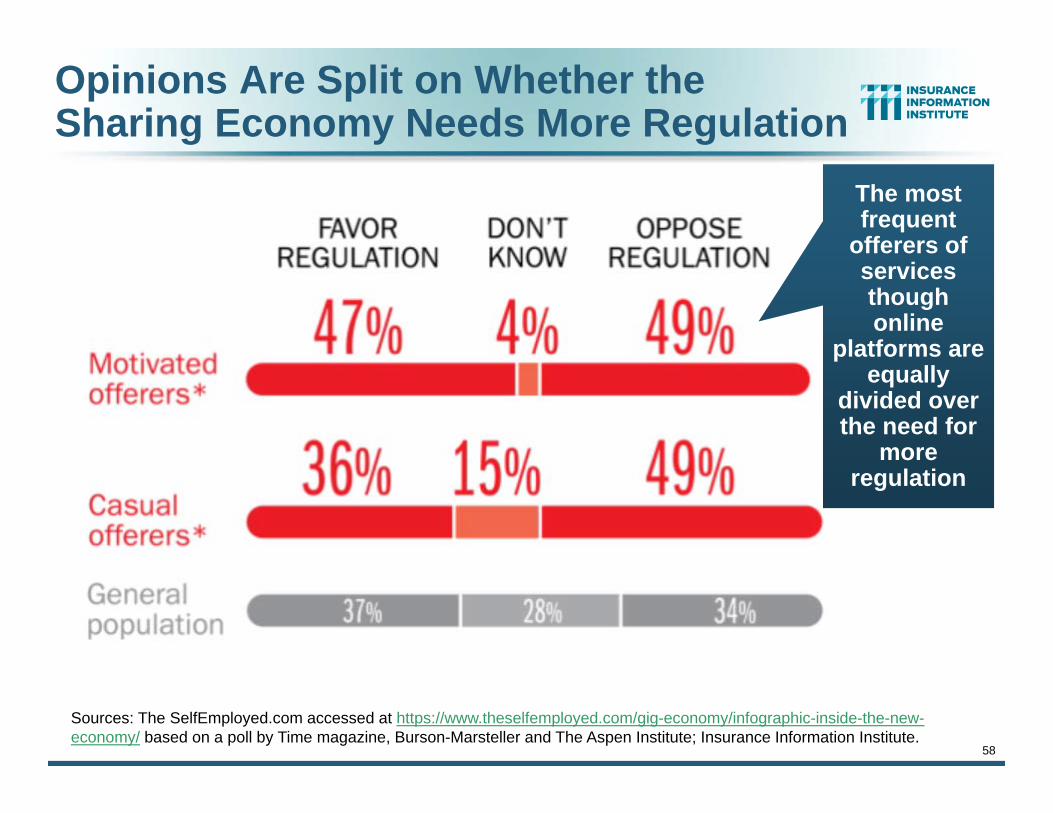
Opinions Are Split on Whether the Sharing Economy Needs More Regulation
Sources: The SelfEmployed.com accessed at https://www.theselfemployed.com/gig-economy/infographic-inside-the-new-economy/ based on a poll by Time magazine, Burson-Marsteller and The Aspen Institute; Insurance Information Institute.
The most frequent
offerers of services though online
platforms are equally
divided over the need for
more regulation
59
THE ‘INTERNET OF THINGS’
Capturing Economic Value Amid a Shifting Insurer Value Chain
60
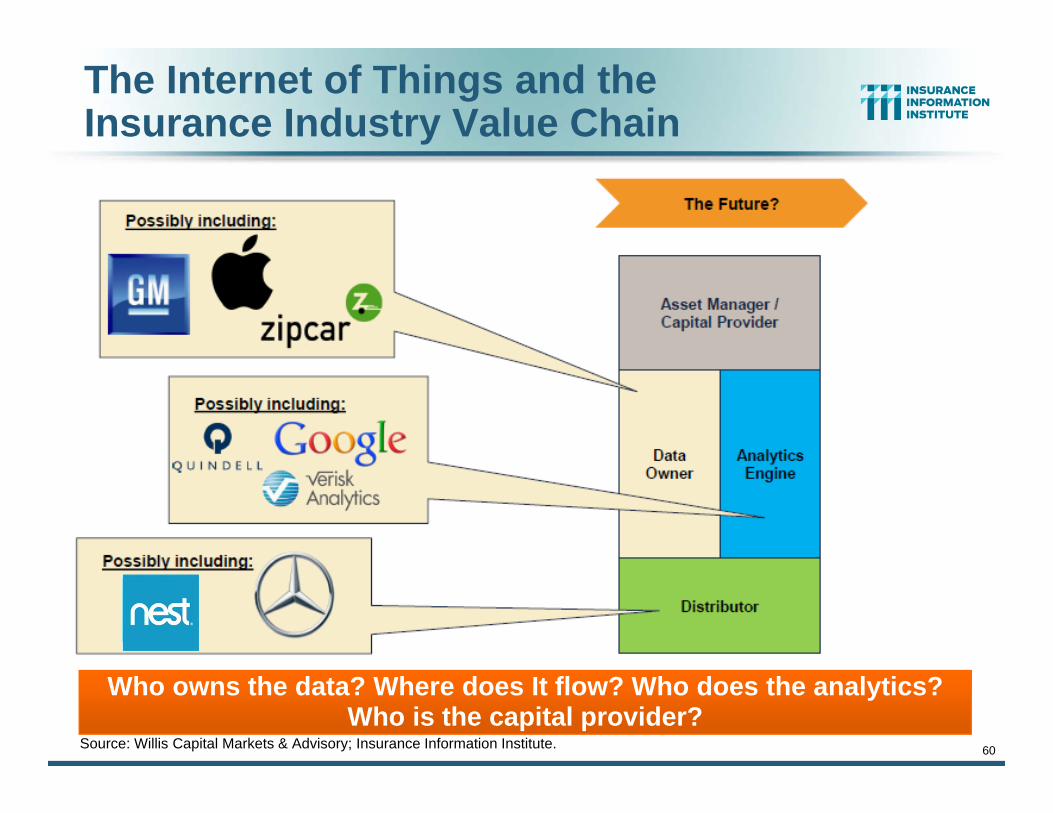
The Internet of Things and the Insurance Industry Value Chain
Source: Willis Capital Markets & Advisory; Insurance Information Institute.
Who owns the data? Where does It flow? Who does the analytics? Who is the capital provider?
61
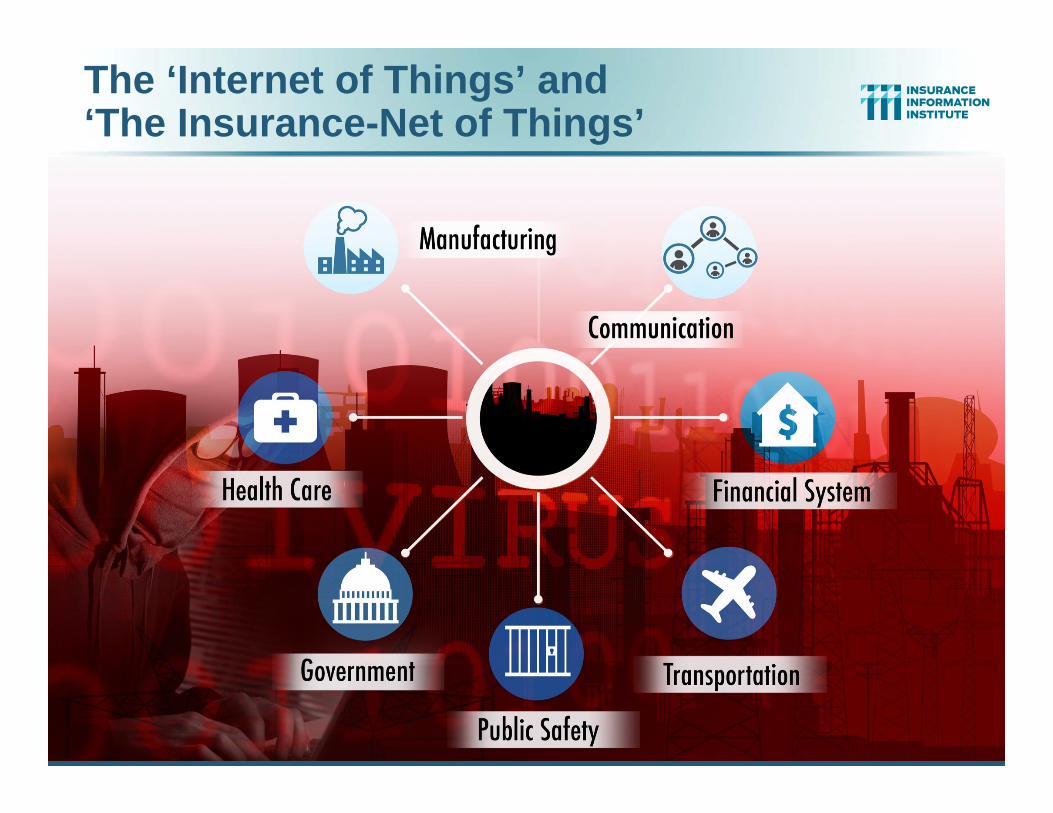
The ‘Internet of Things’ and ‘The Insurance-Net of Things’

62
Aviation
Rail & Public Transport
Trucking & Fleet Vehicles
Marine Transport
Private Motor Vehicles
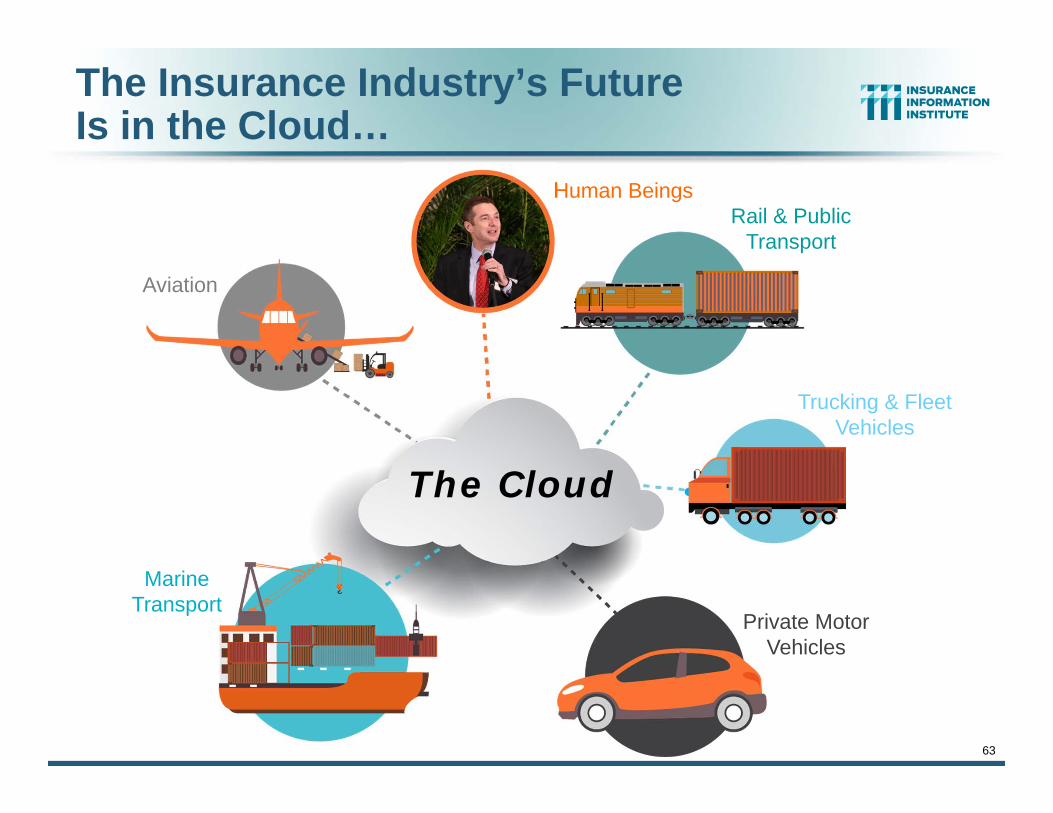
The Insurance Industry’s Future Is in the Cloud…
The Cloud
63
Aviation
Rail & Public Transport
Trucking & Fleet Vehicles
Marine Transport
Private Motor Vehicles
The Cloud
The Insurance Industry’s Future Is in the Cloud…
Human Beings
64
OCCUPATIONAL DEATHS IN TRANSPORTATION:
IS TECHNOLOGY THE SOLUTION?
Technology Promises Safer Vehicles, Highways But How Much of this Is
Silicon Valley Hype?
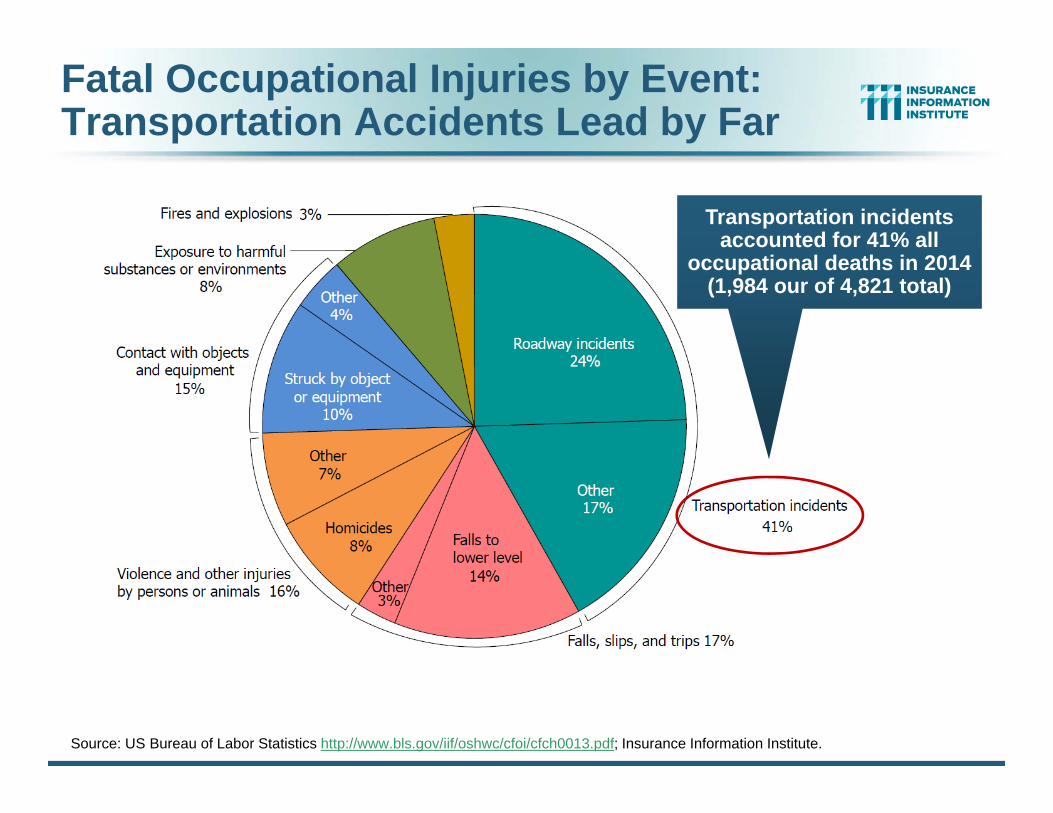
Fatal Occupational Injuries by Event: Transportation Accidents Lead by Far
Transportation incidents accounted for 41% all
occupational deaths in 2014 (1,984 our of 4,821 total)
Source: US Bureau of Labor Statistics http://www.bls.gov/iif/oshwc/cfoi/cfch0013.pdf; Insurance Information Institute.
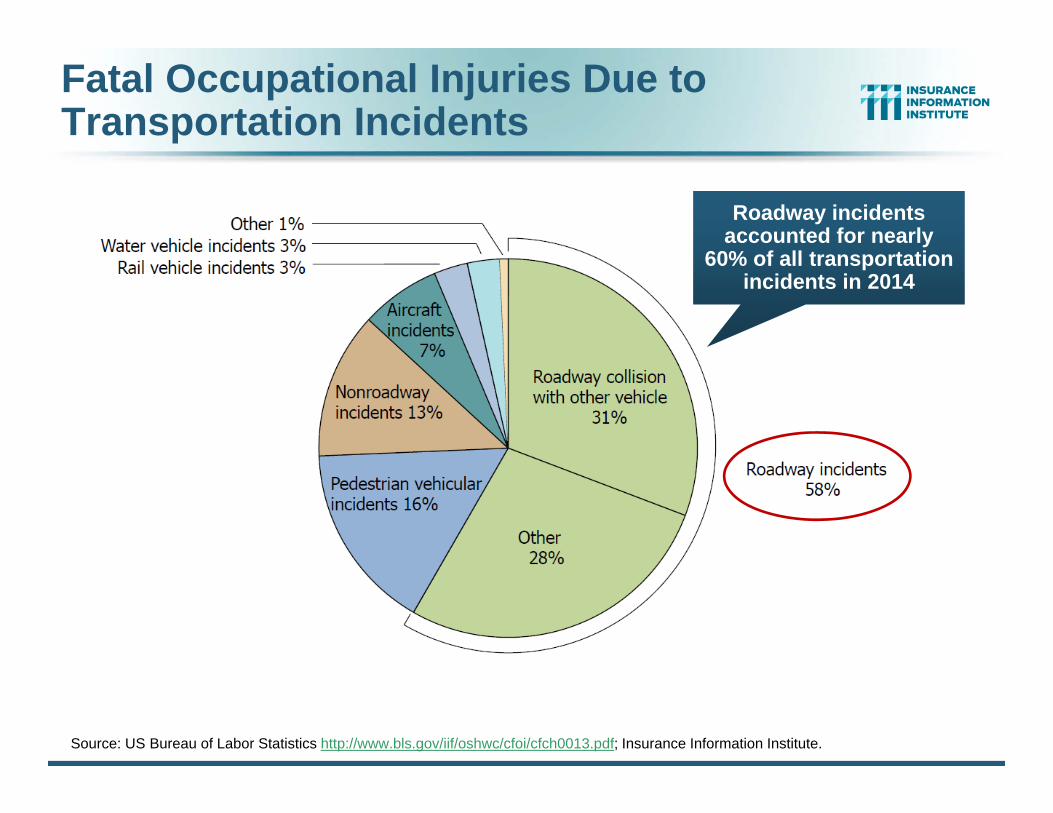
Fatal Occupational Injuries Due to Transportation Incidents
Source: US Bureau of Labor Statistics http://www.bls.gov/iif/oshwc/cfoi/cfch0013.pdf; Insurance Information Institute.
Roadway incidents accounted for nearly
60% of all transportation incidents in 2014
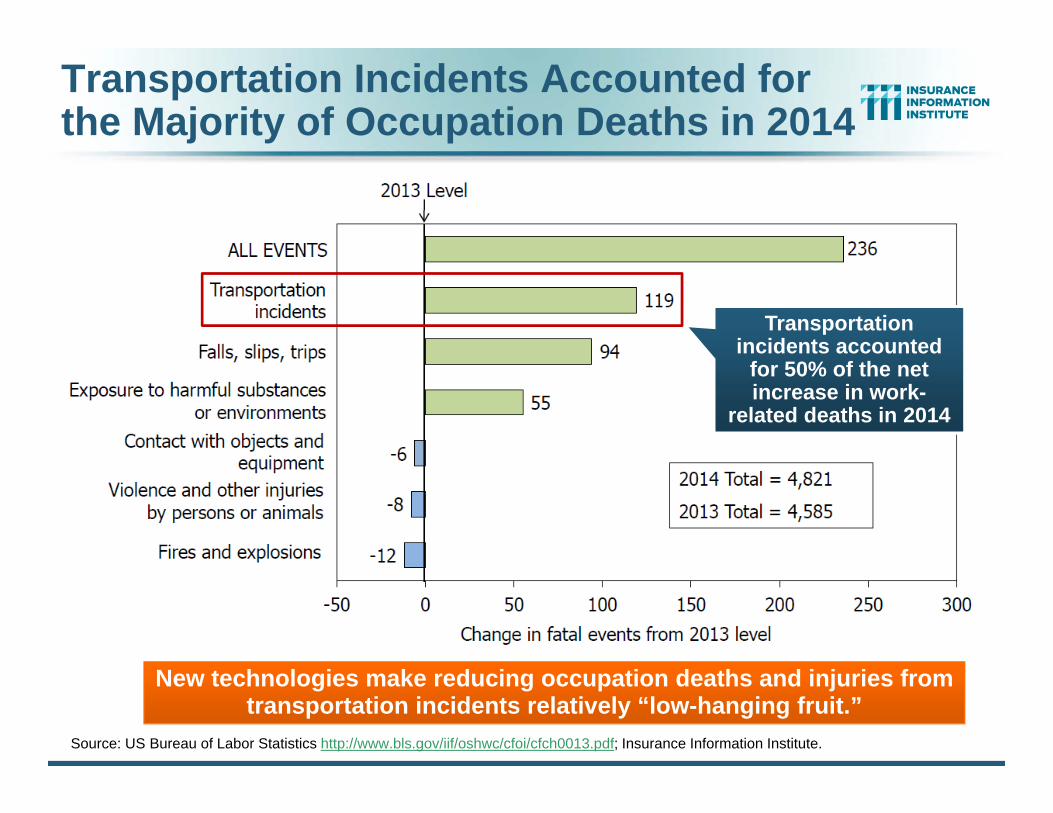
Transportation Incidents Accounted for the Majority of Occupation Deaths in 2014
Source: US Bureau of Labor Statistics http://www.bls.gov/iif/oshwc/cfoi/cfch0013.pdf; Insurance Information Institute.
Transportation incidents accounted
for 50% of the net increase in work-
related deaths in 2014
New technologies make reducing occupation deaths and injuries from transportation incidents relatively “low-hanging fruit.”
68
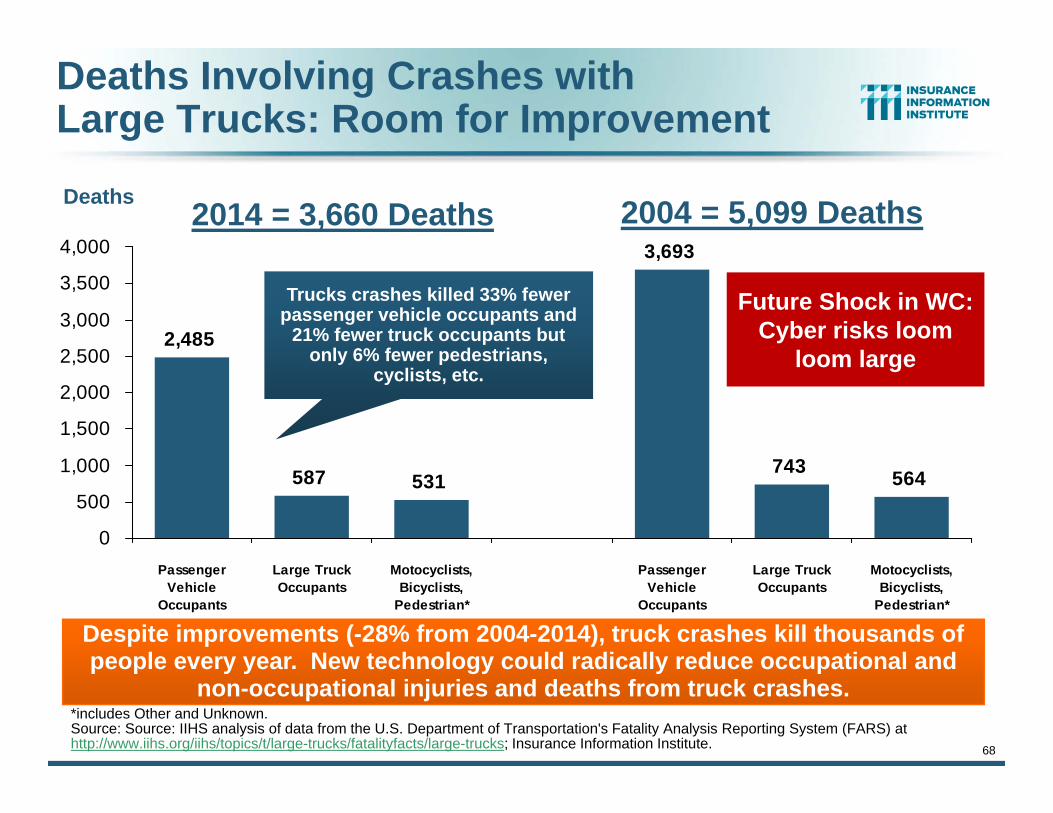
Deaths Involving Crashes with Large Trucks: Room for Improvement
564
2,485
587 531
3,693
743
0
500
1,000
1,500
2,000
2,500
3,000
3,500
4,000
PassengerVehicle
Occupants
Large TruckOccupants
Motocyclists,Bicyclists,
Pedestrian*
PassengerVehicle
Occupants
Large TruckOccupants
Motocyclists,Bicyclists,
Pedestrian*
Despite improvements (-28% from 2004-2014), truck crashes kill thousands of people every year. New technology could radically reduce occupational and
non-occupational injuries and deaths from truck crashes.
Deaths
Trucks crashes killed 33% fewer passenger vehicle occupants and
21% fewer truck occupants but only 6% fewer pedestrians,
cyclists, etc.
*includes Other and Unknown.Source: Source: IIHS analysis of data from the U.S. Department of Transportation's Fatality Analysis Reporting System (FARS) at http://www.iihs.org/iihs/topics/t/large-trucks/fatalityfacts/large-trucks; Insurance Information Institute.
2014 = 3,660 Deaths 2004 = 5,099 Deaths
Future Shock in WC:Cyber risks loom
loom large

#RiskyRideSXSWMarch 13, 2016, Austin, TX

70
INSURANCE TECHNOLOGY:FIN TECH ZEROES IN
Number and Value of Deals Is Increasing
In Search of the Elusive Insurance ‘Unicorn’
71
$62 $29 $22 $18
$240
$31 $44 $71 $37$107
$29$133
$415
$148$82
$171
$1,848
$369$272
$650
$32
6
10
5 4
1310 11
13
18
11
20
9
1820
27
1922
27
34
30
47
$0
$200
$400
$600
$800
$1,000
$1,200
$1,400
$1,600
$1,800
$2,000
11:Q
111
:Q2
11:Q
311
:Q4
12:Q
112
:Q2
12:Q
312
:Q4
13:Q
113
:Q2
13:Q
313
:Q4
14:Q
114
:Q2
14:Q
314
:Q4
15:Q
115
:Q2
15:Q
315
:Q4
16:Q
1
Inve
stm
ent
0
5
10
15
20
25
30
35
40
45
50
Num
ber of Deals
($ Millions)
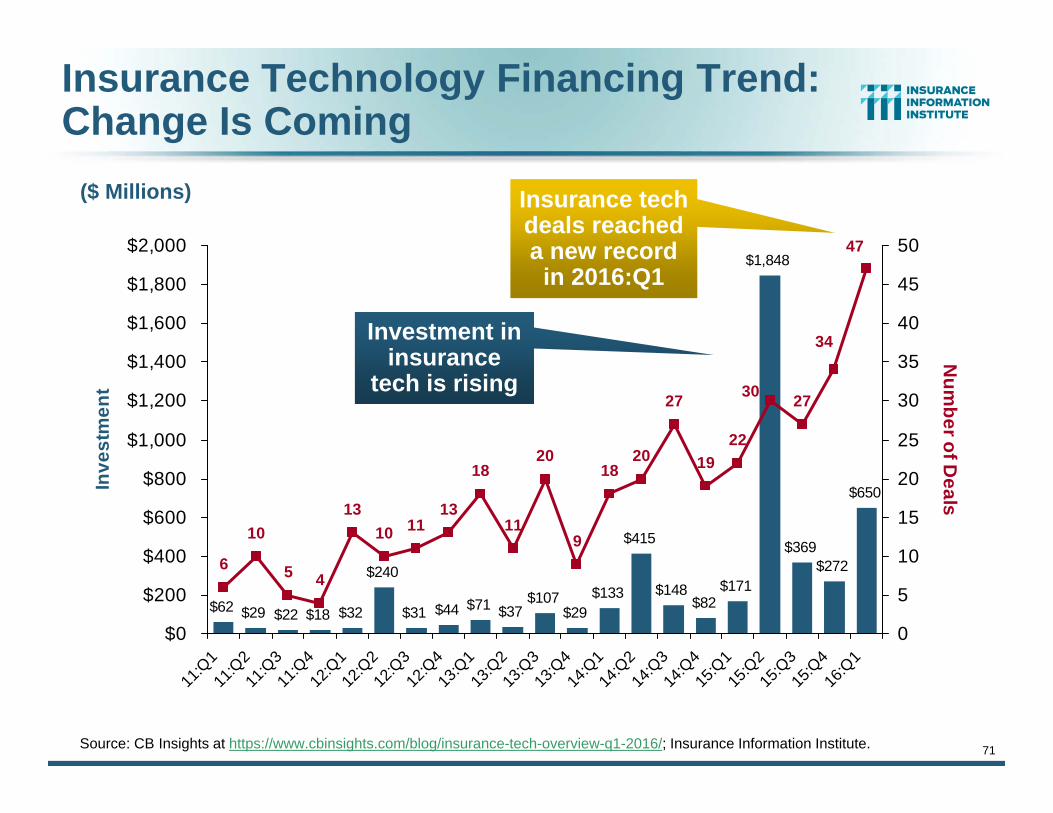
Investment in insurance
tech is rising
Insurance tech deals reached a new record
in 2016:Q1
Source: CB Insights at https://www.cbinsights.com/blog/insurance-tech-overview-q1-2016/; Insurance Information Institute.
Insurance Technology Financing Trend: Change Is Coming
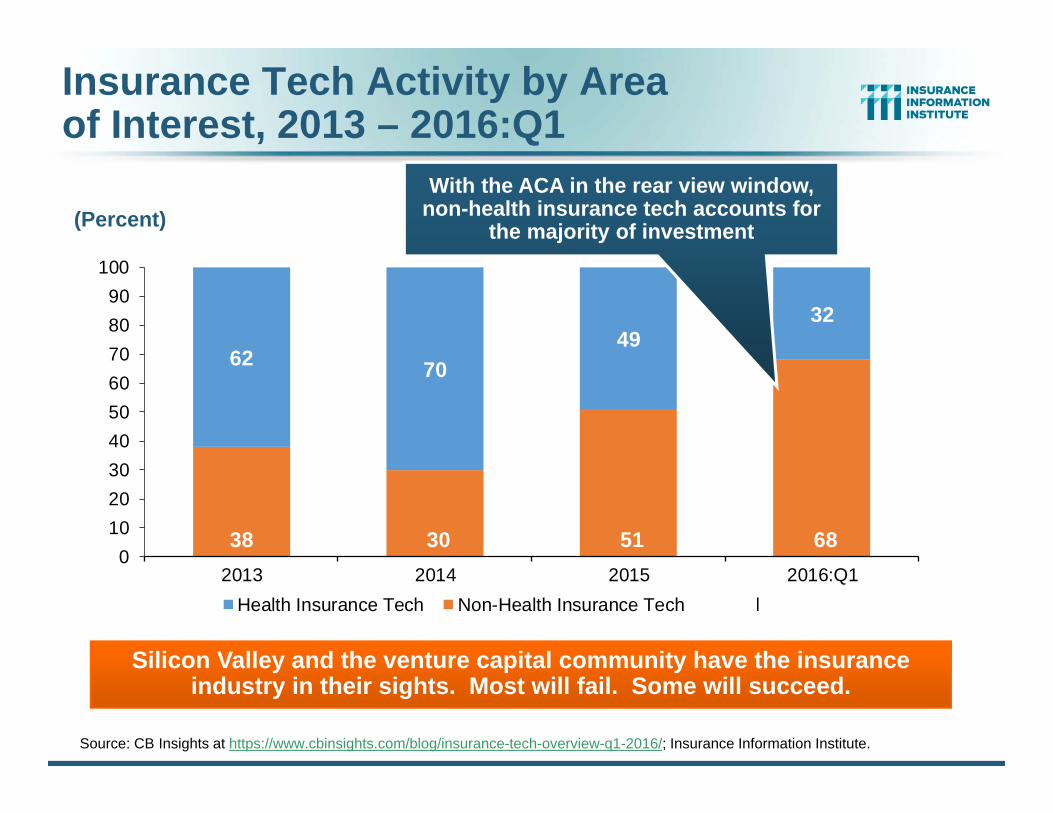
Insurance Tech Activity by Area of Interest, 2013 – 2016:Q1
38 30 51 68
62 7049
32
0102030405060708090
100
2013 2014 2015 2016:Q1Health Insurance Tech Non-Health Insurance Tech Total
Silicon Valley and the venture capital community have the insurance industry in their sights. Most will fail. Some will succeed.
Source: CB Insights at https://www.cbinsights.com/blog/insurance-tech-overview-q1-2016/; Insurance Information Institute.
(Percent)With the ACA in the rear view window,
non-health insurance tech accounts for the majority of investment

www.iii.org
Thank you for your timeand your attention!
Twitter: twitter.com/bob_HartwigDownload at www.iii.org/presentations
Insurance Information Institute Online:
73