The seismic monitoring network of Mt. Vesuvius - Home | …€¦ · · 2017-04-04The seismic...
13
ANNALS OF GEOPHYSICS, 56, 4, 2013, S0450; doi:10.4401/ag-6456 S0450 The seismic monitoring network of Mt. Vesuvius Massimo Orazi * , Luca D’Auria, Anna Tramelli, Ciro Buonocunto, Marco Capello, Antonio Caputo, Walter De Cesare, Flora Giudicepietro, Marcello Martini, Rosario Peluso, Giovanni Scarpato Istituto Nazionale di Geofisica e Vulcanologia, Sezione di Napoli, Osservatorio Vesuviano, Naples, Italy ABSTRACT Mt. Vesuvius (southern Italy) is one of the most hazardous volcanoes in the world. Its activity is currently characterized by moderate seismicity, with hypocenters located beneath the crater zone with depth rarely ex- ceeding 5 km and magnitudes generally less than 3. The current configu- ration of the seismic monitoring network of Mt. Vesuvius consists of 18 seismic stations and 7 infrasound microphones. During the period 2006- 2010 a seismic array with 48 channels was also operative. The station distribution provides appropriate coverage of the area around the volcanic edifice. The current development of the network and its geometry, under conditions of low seismic noise, allows locating seismic events with M<1. Remote instruments continuously transmit data to the main acquisition center in Naples. Data transmission is realized using different technolog- ical solutions based on UHF, Wi-Fi radio links, and TCP/IP client-server applications. Data are collected in the monitoring center of the Osserva- torio Vesuviano (Italian National Institute of Geophysics and Volcanol- ogy, Naples section), which is equipped with systems for displaying and analyzing signals, using both real-time automatic and manual proce- dures. 24-hour surveillance allows to immediately communicate any sig- nificant anomaly to the Civil Protection authorities. 1. Introduction Vesuvius is one of the most dangerous volcanoes as a consequence of the high urbanization of the sur- rounding areas [De Natale et al. 2011]. In the 19th century an increasing interest in the Earth studies leaded to the foundation of the Osser- vatorio Vesuviano, the first volcanological observa- tory in the world [Owens 2013]. Luigi Palmieri, who was appointed director of the Osservatorio in 1854, started the first seismological observations on a vol- cano using a seismometer designed and built by him- self [Giudicepietro et al. 2010]. The first seismometers were installed on Mt. Vesuvius since the second half of the century, at the Osservatorio Vesuviano. Since then, at least 12 eruptions occurred alternated by near persistent Strombolian activity. The detection of seis- micity associated with this eruptive activity repre- sents the first recording of seismo-volcanic signals in the world. The intense volcanic activity of that period al- lowed Palmieri to understand the usefulness of the seis- mic observations to forecast an approaching eruption. At the beginning, only one seismometer, the Palmieri’s seismometer, was used to monitor the volcano. The network improved during time till the actual one that counts up to 18 seismic stations equipped with several kinds of sensors. Currently, it is known [De Natale et al. 2011] that an eruption of Vesuvius could represent a significant threat for the population living in this area. To mitigate this risk the Italian Civil Protection authorities devel- oped an emergency plan based on updated scientific in- formation concerning the dynamics of Vesuvius. The plan requires a modern and efficient monitoring net- work able to record several kind of scientific data and to make them available for real time and near immediate analysis (http://www.protezionecivile.gov.it/jcms/it/ view_pde.wp?contentId=PDE12771) [Convertito and Zollo 2011]. In the monitoring center, automatic systems, based on real time analysis of seismological data, provide a useful support for a quick analysis of all the acquired data. Moreover all seismic events are manually classified, picked and, if possible, located. Finally all event wave- forms and parameters are stored in a relational database [Giudicepietro et al. 2008, Scarpato 2011]. The Osservatorio Vesuviano (now part of the INGV, Italian National Institute of Geophysics and Volcanology, as Naples section) is the reporting authority for event locations and magnitudes and maintains the authori- tative event catalog. Article history Received December 24, 2012; accepted April 18, 2013. Subject classification: Vesuvius, Seismic network, Volcano monitoring, Network performance. Special Issue: Vesuvius monitoring and knowledge
Transcript of The seismic monitoring network of Mt. Vesuvius - Home | …€¦ · · 2017-04-04The seismic...

ANNALS OF GEOPHYSICS, 56, 4, 2013, S0450; doi:10.4401/ag-6456
S0450
The seismic monitoring network of Mt. Vesuvius
Massimo Orazi*, Luca D’Auria, Anna Tramelli, Ciro Buonocunto, Marco Capello,Antonio Caputo, Walter De Cesare, Flora Giudicepietro, Marcello Martini,Rosario Peluso, Giovanni Scarpato
Istituto Nazionale di Geofisica e Vulcanologia, Sezione di Napoli, Osservatorio Vesuviano, Naples, Italy
ABSTRACT
Mt. Vesuvius (southern Italy) is one of the most hazardous volcanoes inthe world. Its activity is currently characterized by moderate seismicity,with hypocenters located beneath the crater zone with depth rarely ex-ceeding 5 km and magnitudes generally less than 3. The current configu-ration of the seismic monitoring network of Mt. Vesuvius consists of 18seismic stations and 7 infrasound microphones. During the period 2006-2010 a seismic array with 48 channels was also operative. The stationdistribution provides appropriate coverage of the area around the volcanicedifice. The current development of the network and its geometry, underconditions of low seismic noise, allows locating seismic events with M<1.Remote instruments continuously transmit data to the main acquisitioncenter in Naples. Data transmission is realized using different technolog-ical solutions based on UHF, Wi-Fi radio links, and TCP/IP client-serverapplications. Data are collected in the monitoring center of the Osserva-torio Vesuviano (Italian National Institute of Geophysics and Volcanol-ogy, Naples section), which is equipped with systems for displaying andanalyzing signals, using both real-time automatic and manual proce-dures. 24-hour surveillance allows to immediately communicate any sig-nificant anomaly to the Civil Protection authorities.
1. IntroductionVesuvius is one of the most dangerous volcanoes
as a consequence of the high urbanization of the sur-rounding areas [De Natale et al. 2011].
In the 19th century an increasing interest in theEarth studies leaded to the foundation of the Osser-vatorio Vesuviano, the first volcanological observa-tory in the world [Owens 2013]. Luigi Palmieri, whowas appointed director of the Osservatorio in 1854,started the first seismological observations on a vol-cano using a seismometer designed and built by him-self [Giudicepietro et al. 2010]. The first seismometerswere installed on Mt. Vesuvius since the second halfof the century, at the Osservatorio Vesuviano. Sincethen, at least 12 eruptions occurred alternated by near
persistent Strombolian activity. The detection of seis-micity associated with this eruptive activity repre-sents the first recording of seismo-volcanic signals inthe world.
The intense volcanic activity of that period al-lowed Palmieri to understand the usefulness of the seis-mic observations to forecast an approaching eruption.At the beginning, only one seismometer, the Palmieri’sseismometer, was used to monitor the volcano. Thenetwork improved during time till the actual one thatcounts up to 18 seismic stations equipped with severalkinds of sensors.
Currently, it is known [De Natale et al. 2011] thatan eruption of Vesuvius could represent a significantthreat for the population living in this area. To mitigatethis risk the Italian Civil Protection authorities devel-oped an emergency plan based on updated scientific in-formation concerning the dynamics of Vesuvius. Theplan requires a modern and efficient monitoring net-work able to record several kind of scientific data and tomake them available for real time and near immediateanalysis (http://www.protezionecivile.gov.it/jcms/it/view_pde.wp?contentId=PDE12771) [Convertito andZollo 2011].
In the monitoring center, automatic systems, basedon real time analysis of seismological data, provide auseful support for a quick analysis of all the acquireddata. Moreover all seismic events are manually classified,picked and, if possible, located. Finally all event wave-forms and parameters are stored in a relational database[Giudicepietro et al. 2008, Scarpato 2011].
The Osservatorio Vesuviano (now part of the INGV,Italian National Institute of Geophysics and Volcanology,as Naples section) is the reporting authority for eventlocations and magnitudes and maintains the authori-tative event catalog.
Article historyReceived December 24, 2012; accepted April 18, 2013.Subject classification:Vesuvius, Seismic network, Volcano monitoring, Network performance.
Special Issue: Vesuvius monitoring and knowledge

2. The permanent seismic networkThe main goal of the seismic monitoring network
of Mt. Vesuvius is to record and store seismic data ofthe Vesuvius volcanic area. These data contribute to thecompilation of a seismic catalog which is a benchmarkfor the scientific community that needs to study thisvolcano [D’Auria et al. 2013]. At the same time the Os-servatorio Vesuviano communicates scientific infor-mation to the Italian Civil Protection Department (DPC)regarding the state of the volcano.
The seismicity of Mt. Vesuvius is mainly localizedwithin a radius of 3 km from the center of volcano withdepth ranging from 8 km b.s.l. to 1 km a.s.l. [D’Auria etal. 2013]. For this reason the seismic stations are mainlylocated around the volcanic edifice with a higher den-sity in the Gran Cono crater area (Figure 1).
As reported in Table 1, the current monitoringseismic network of Vesuvius consists of 7 short-periodsingle-component sensors, 3 short-period 3-compo-nents sensors and 9 digital broadband sensors. TheOVO site hosts both a digital broadband and a 3C elec-tromagnetic analog sensors. The seismic network (Fig-ure 1) has been integrated by infrasound sensors and, inthe period 2006-2010, by a 48 channels seismic array.
The 8 stations closer to the Vesuvius crater are lo-cated far from the electricity grid and are then poweredby solar panels and batteries. A typical station powerconsumption is usually lower than 500 mA supplied by160 W solar modules and 160 Ah lead-acid gel batteries.The other 10 stations are located close to towns and are
connected to the electricity grid, with batteries provid-ing an energy storage.
Until 2006, the highest and closest stations to thevolcano edifice were BKE, on the east side of the GranCono, and OVO, in the historical building of the Os-servatorio Vesuviano. The instrumental observationscollected until then suggested a small magnitude localseismicity concentrated in the volume of the GranCono [Giudicepietro et al. 2010, D’Auria et al. 2013].Consequently, in order to locate these events, it was de-cided to increase the number of stations in this area byinstalling modern digital broadband stations. To achievethis goal, the first step was the realization of a modernWi-Fi radio infrastructure located on the top area ofthe volcano which assures a real time communicationlink toward the Osservatorio Vesuviano monitoringcenter (lines in Figure 1). New stations in the summitarea of Mt. Vesuvius were installed using a low-powerdigital acquisition system, named GILDA [Orazi et al.2006, 2008], designed and developed at the Osservato-rio Vesuviano to fit requirements of remote installationplaces. Thanks to these new installations it was possibleto better delineate a seismogenetic volume close to thecrater area which was, previously, poorly known [Giu-dicepietro et al. 2010, D’Auria et al. 2013].
All the broadband stations deployed on Vesuviusrun Guralp CMG-40T (60 sec – 50 Hz) sensors except forthe OVO station where a VBB sensor Nanometrics Tril-lium (response flat in the band 240s – 35 Hz) is used. Thislast sensor was installed in collaboration with Centro
ORAZI ET AL.
2
Figure 1. Map of Vesuvius permanent seismic monitoring network. Circles: short-period 1C stations; triangles: short-period 3C stations; di-amonds: broadband stations; stars: strainmeters; cross: seismic array (ARV1). The radio data transmission infrastructure is also shown. Blacklines: analog radio UHF lines; red lines: digital UHF lines; blue dotted lines: Wi-Fi lines; red dashed lines: ADSL digital connection; blackdashed lines: analog CDA data line.

3
Nazionale Terremoti (INGV, National Earthquake Cen-ter) in an underground vault close to the historical build-ing of the Osservatorio Vesuviano at a depth of 35 m.
In order to discriminate earthquakes from otherevents (thunders, artificial explosions) and to carry outscientific studies on the propagation of infrasounds atlocal and regional scale most of the broadband digitalstations have been equipped with infrasonic sensorstoo. Two kind of infrasonic sensors are employed, the
commercial Chaparral model 25V with flat responsebetween 10s – 200 Hz and an homemade sensor com-pletely designed and realized at the Osservatorio Vesu-viano [Buonocunto et al. 2011].
As for the short period stations, the sampling rateof all the broadband seismic stations and of infrasoundsensors is fixed at 100 sps.
In 2006, a permanent seismic array based on 16three-component short period sensors, was installed in
SEISMIC NETWORK OF MT. VESUVIUS
Station site Station codeNumber
of channelsTypology
Datatransmission type
Acquisitortype
Installedsensors
Year ofinstallation
OsservatorioVesuvianohistoricalheadquarter
OVO
3 AnalogAnalog
UHF radioAnalog
modulator3 orthogonal geot-
ech instr. S131971
3+1
Digital Wi-Fi radio GILDATrillium 240
+Chaparral 25V
2011
Ercolano HR9 1 AnalogAnalog
UHF radioAnalog
modulatorMark L4-C 1987
Cappella Vecchia CPV 3 AnalogAnalog
UHF radioAnalog
modulatorMark L4-3D 1992
Bunker Est BKE 3 AnalogAnalog
UHF radioAnalog
modulator3 orth. geoth. S13 1992
San Sebastiano SSB 1 AnalogAnalog
UHF radioAnalog
modulatorMark L4-C 1993
Terzigno TRZ 1 AnalogAnalog
UHF radioAnalog
modulatorMark L4-C 1994
S. Mariaa Castello
SMC 1 AnalogAnalog
UHF radioAnalog
modulatorMark L4-C 1995
Torre del Greco TDG 1 AnalogAnalog
UHF radioAnalog
modulatorMark L4-C 1995
Ottaviano OTV 1 AnalogAnalog
UHF radioAnalog
modulatorMark L4-C 1996
Pollena POB 3 DigitalDigital
UHF radioGILDA CMG-40T 2000
Pompei PPV 1 AnalogAnalog
UHF radioAnalog
modulatorMark L4-C 2004
Camaldolidella Torre
CMDT 3 Digital Cabled ADSL Q330 Guralp CMG-40T 2004
Cratere Ovest CRTO3+1
Digital Wi-Fi radio GILDAGuralp CMG-40T
+Infracyrus
2006
VesuvioCratere Est
VCRE3+1
Digital Wi-Fi radio GILDAGuralp CMG-40T
+Infracyrus
2008
VesuvioBunker Nord
VBKN3+1
Digital Wi-Fi radio GILDAGuralp CMG-40T
+Infracyrus
2009
Zona BaraccheForestale
VARP3+1
Digital Wi-Fi radio GILDAGuralp CMG-40T
+Infracyrus
2009
Zona BaraccheForestale
ARV1 16×3C Seismic array Wi-Fi radio Array 16 Lennartz 3D-Lite 2006
Vesuvio Tirone VTIR3+1
Digital Wi-Fi radio GILDAGuralp CMG-40T
+Infracyrus
2009
VesuvioValle del Gigante
VVDG3+1
Digital Wi-Fi radio GILDAGuralp CMG-40T
+Infracyrus
2009
Table 1. Station summary table of permanent seismic network of Mt. Vesuvius.

the west side area of the Gran Cono. The acquired datawere transmitted in real time using the OsservatorioVesuviano Wi-Fi infrastructure [Scarpato et al. 2007].The array was removed in 2010 because of the obso-lescence of its acquisition system. Currently we areplanning the installation of a new seismic array, with a3D configuration.
The short period stations use analog FM modula-tors transmitting via UHF radio band to the Data Ac-quisition Center in Posillipo (Naples). There a multi-channel data acquisition board performs the analog todigital conversion with a sampling rate of 100 sps and16 bit of digital resolution. All these stations are equippedwith 1 Hz short period electromagnetic sensors as re-ported in Table 1.
Digital data transmission uses three preferred car-riers: UHF digital lines, Wi-Fi infrastructures and com-mercial ADSL providers. The path from the station tothe acquisition center is sometimes composed of mul-tiple segments, each one with a different carrier (e.g.Wi-Fi+ADSL).
Since the UHF radio frequency band cannot carrya large amount of data, in 2004 the Osservatorio Vesu-viano began the deployment of a modern broadbanddigital radio infrastructure aimed to cover remote areasand the crater area of Vesuvius [Scarpato et al. 2007].After the first experience in Stromboli, in 2006 webegan the first installation in Vesuvius area with pro-fessional radio systems. These systems provide bothradio access and local Ethernet port respectively for re-mote and local clients allowing complex LAN (LocalArea Network) and WAN (Wide Area Network) con-nections. The used systems employ the free frequen-cies band of 2.4 GHz, and 5 GHz, as described in theIEEE802.11 protocol. The maximum transmissionpower for the two bands is respectively 100mW and 1Waccording to European legal standards.
Several radio repeaters, working as access point forseismic stations, compose the broadband digital radioinfrastructure. They are located close to stations or intheir line of sight. Repeaters and seismic stations areoften co-located in order to save installation costs bysharing solar energy production systems. This is thecase of VCRE and VVDG seismic stations. Nowadaysthe broadband digital radio infrastructure is composedby 5 repeaters located in the crater area (Figure 1).
All the data produced by the remote sensors aresent to the data acquisition center in Posillipo (Naples) ordirectly toward the Osservatorio Vesuviano in Naples.The near-immediate communication and analysis formonitoring purposes require a network with real timeseismic data transmission. The monitoring center ofthe Osservatorio Vesuviano collects all these real time
data and employes automatic software analysis systemsrunning on Earthworm (http://www.earthwormcetral.org). The Earthworm software suite was developed inthe early ’90s by the USGS and now is carried on by ISTI.It is composed by a group of software modules special-ized for a single task and designed to closely work to-gether. It also provides an API to develop homemademodules in order to easily add new functionalities tothe software suite.
We realized many Earthworm modules in orderto perform the acquisition of our digital stations, tosave the data in legacy formats and to perform auto-matic analyses. Moreover we also modified some exist-ing modules in order to adapt them to our specificneeds. The system for the automatic detection and lo-cation of events is based on Earthworm and has beencomplemented by a web interface [Scarpato 2011].
Using the Earthworm suite we also realized a ge-ographically distributed acquisition network. Earth-worm network functionality allowed us to build severalperipheral acquisition centers equipped with an ADSLconnection. Earthworm allows an efficient way to in-tegrate seismic data coming from different and het-erogeneous sources. In the Vesuvius area there are twolocal acquisition centers co-located with stations OVOand CMDT. Data coming from these peripheral cen-ters are then collected at the Osservatorio Vesuvianowhere they are automatically analyzed. Peripheral cen-ters also act as first level of storage in order to increasethe redundancy of the whole system. In case of majorconnection losses, data are always stored locally andcan be subsequently recovered.
Since their importance, the hardware and softwarearchitecture of these peripheral acquisition systems has
ORAZI ET AL.
4
Figure 2. Temporal variation of the magnitude of completeness(Mc) for events detected at BKE station (top) and the Mc for locatedevents (bottom).
5
been designed to be as more reliable as possible [Pelusoet al. 2009]. At the present more than three days of datarecordings are guaranteed also without any main elec-tricity power.
Real time data arriving at the Osservatorio Vesu-viano monitoring center are stored in a multi-tier struc-ture. The peripheral acquisition centers give the firstlevel of the tier. Once arrived at the main acquisitioncenter the data are stored in two small NAS (NetworkAttached Storage) for few months. The geographicalredundancy is needed to avoid any data loss due tohardware failures. The data are daily copied from thesetwo small machines to a NAS with a higher capacity, al-lowing years of storage. Finally, data are also dailybacked up on tapes for the final storage.
3. Network performances on VT earthquakes detec-tion and location
In the last 13 years the seismic network of Mt.Vesuvius has recorded about 21,000 transients of localorigin (i.e. recorded only by this network): 54% of thembeing local earthquakes, 30% artificial explosions inlocal quarries, 5% small local landslides and 11% thun-ders and other events [Esposito et al. 2013].
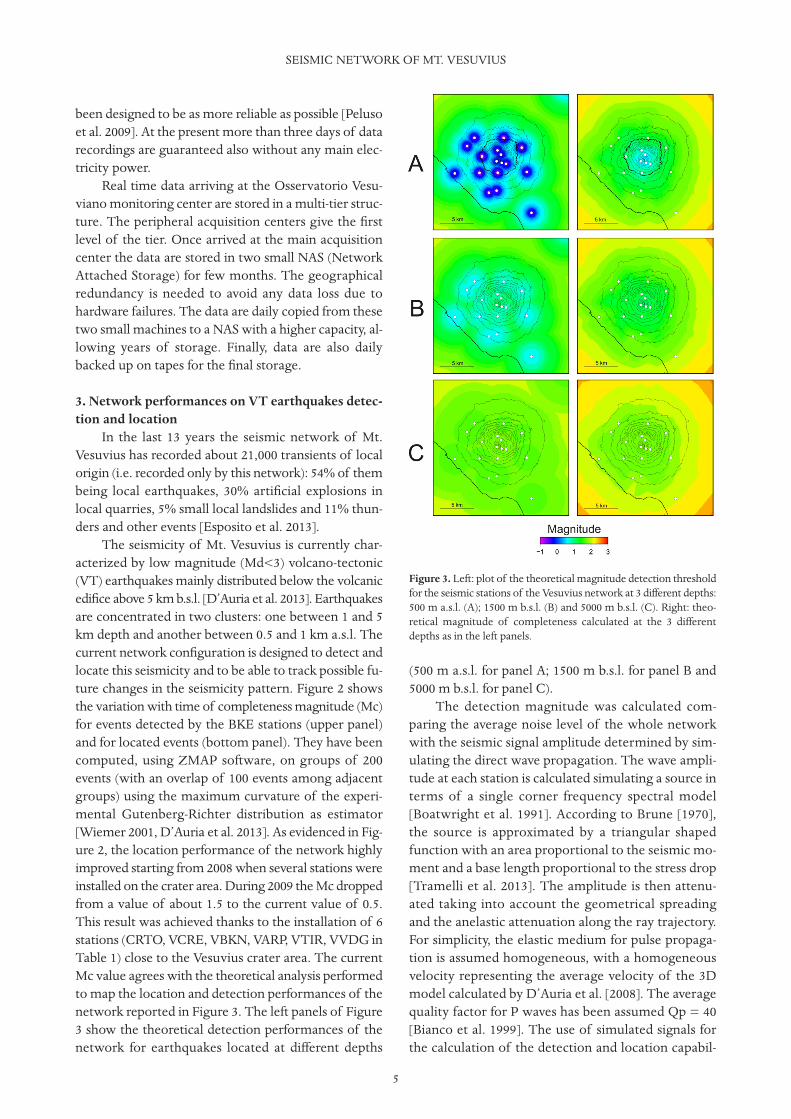
The seismicity of Mt. Vesuvius is currently char-acterized by low magnitude (Md<3) volcano-tectonic(VT) earthquakes mainly distributed below the volcanicedifice above 5 km b.s.l. [D’Auria et al. 2013]. Earthquakesare concentrated in two clusters: one between 1 and 5km depth and another between 0.5 and 1 km a.s.l. Thecurrent network configuration is designed to detect andlocate this seismicity and to be able to track possible fu-ture changes in the seismicity pattern. Figure 2 showsthe variation with time of completeness magnitude (Mc)for events detected by the BKE stations (upper panel)and for located events (bottom panel). They have beencomputed, using ZMAP software, on groups of 200events (with an overlap of 100 events among adjacentgroups) using the maximum curvature of the experi-mental Gutenberg-Richter distribution as estimator[Wiemer 2001, D’Auria et al. 2013]. As evidenced in Fig-ure 2, the location performance of the network highlyimproved starting from 2008 when several stations wereinstalled on the crater area. During 2009 the Mc droppedfrom a value of about 1.5 to the current value of 0.5.This result was achieved thanks to the installation of 6stations (CRTO, VCRE, VBKN, VARP, VTIR, VVDG inTable 1) close to the Vesuvius crater area. The currentMc value agrees with the theoretical analysis performedto map the location and detection performances of thenetwork reported in Figure 3. The left panels of Figure3 show the theoretical detection performances of thenetwork for earthquakes located at different depths
(500 m a.s.l. for panel A; 1500 m b.s.l. for panel B and5000 m b.s.l. for panel C).
The detection magnitude was calculated com-paring the average noise level of the whole networkwith the seismic signal amplitude determined by sim-ulating the direct wave propagation. The wave ampli-tude at each station is calculated simulating a source interms of a single corner frequency spectral model[Boatwright et al. 1991]. According to Brune [1970],the source is approximated by a triangular shapedfunction with an area proportional to the seismic mo-ment and a base length proportional to the stress drop[Tramelli et al. 2013]. The amplitude is then attenu-ated taking into account the geometrical spreadingand the anelastic attenuation along the ray trajectory.For simplicity, the elastic medium for pulse propaga-tion is assumed homogeneous, with a homogeneousvelocity representing the average velocity of the 3Dmodel calculated by D’Auria et al. [2008]. The averagequality factor for P waves has been assumed Qp = 40[Bianco et al. 1999]. The use of simulated signals forthe calculation of the detection and location capabil-
SEISMIC NETWORK OF MT. VESUVIUS
Figure 3. Left: plot of the theoretical magnitude detection thresholdfor the seismic stations of the Vesuvius network at 3 different depths:500 m a.s.l. (A); 1500 m b.s.l. (B) and 5000 m b.s.l. (C). Right: theo-retical magnitude of completeness calculated at the 3 differentdepths as in the left panels.

ity of a network allows defining its performances alsoin areas without recorded seismicity.
Results show that within the whole Gran Conoarea the magnitude detection threshold is close orlower than 0.0 for shallow earthquakes. At depth of1500 m the detection threshold rise to about 1.0, reach-ing a value of about 1.5 at 5000 m depth. Furthermorethis plot shows that the network is able to detect earth-quakes with magnitude 1.5 occurring within a radiusof 5 km from the crater and at depth up to 5 km.
In the right panels of Figure 3 the location per-formance of the seismic network is shown. This analy-sis is performed assuming that an earthquake is locatedwhen more than 4 stations are able to detect it. The de-tection capability is calculated as described above.
Results show that the current network configura-tion is able to locate events having magnitude higherthan 2 within the whole Vesuvius area. Furthermore,close to the crater axis the theoretical Mc ranges from0.5 at shallow depth to 1.5 at depths of 5 km.
We have also tested the change of the network per-formances in case of occurrence of strong volcanictremor. We have simulated this situation by multiply-ing the background noise by a factor of 10. In this casethe detection threshold at shallow depths rises to 0.8,and to about 2.5 at 5000 m depth. For the locatedevents, at shallow depth the threshold increases to 2.0,and to about 3. at 5000 m depth.
These results show the capability of the networkof tracking the seismicity located mostly along thecrater axis. A possible change of the seismicity pattern(e.g. seismicity associated to the opening of lateralvents) has been taken into account as well. The currentnetwork configuration is able to detect events locatedon the volcano edifice (that means roughly less 5 kmfrom the crater axis) up to magnitude 1.5 (Figure 3). Itshould also be considered that the Italian National Seis-mic Network has a good location performance in theVesuvius area starting from magnitude 2 [D’Alessandroet al. 2011]. This should allow the detection of any sig-nificant change in the seismicity pattern, prompting thedeployment of dense temporary networks to track thepossible evolution of the seismicity.
To better assess the performance of the networkwe also performed the resolution analysis of it by de-termining its location uncertainty. The method, de-scribed in Tramelli et al. [2013], consists in locatingsynthetic earthquakes using the network under test.Synthetic earthquakes with a chosen magnitude aregenerated on a grid spanning the whole analyzed vol-ume and the arrival times at each station are estimated.We used stations where the SNR is greater than 2 to lo-cate the synthetic earthquakes. When at least 4 stationsdetect the event, the location is performed using a lin-earized approach and the location error is estimatedthrough the covariance matrix. In Figure 4 we show thevertical location errors estimated for M = 0 (left) andM = 1 (right) earthquakes. The actual network allowsto locate M = 0 earthquakes below the central area ofthe volcanic edifice till a depth of 2-3 km b.s.l. Other-wise, M = 1 earthquakes can be located till a depth of8 km b.s.l. The vertical location errors are generallylower than 500 m for depth lower than 2 km. Belowthey are generally within the range 500-1000 m. Thedecrease of the performances with depth is justified byboth the lowering of the SNR and by the increase in theseismic wave velocity.
A further improvement of the network perform-ances could be obtained by deploying borehole seismicstations. This would increase the SNR by lowering thecultural noise level.
4. Array analysisA seismic array was deployed at the Southwest
flank of Mt. Vesuvius in 2006 (cross in Figure 1). It wasdesigned to investigate the presence of correlated sig-nals, possibly related to volcanic tremor sources. It wascomposed of 16 three-component short period sensors(Lennartz 3D-Lite) organized on 3 branches geometryas shown in Figure 5 (top left). The distance betweeneach sensor was 50 m. The array acquisition system was
ORAZI ET AL.
6
Figure 4. Results of the analysis of the location uncertainty of theseismic network for two earthquake magnitudes: M = 0 and M = 1.The color scale indicates the vertical error on the hypocenter location.

7
based on a central unit acquiring data from 16 ADCboards. Data were both locally stored and radio-trans-mitted to the Osservatorio Vesuviano monitoring cen-ter where they were real-time analyzed by a parallelcluster computing system. It furnished the propagationback-azimuth and the apparent velocity of the wave-fronts crossing the array calculated with the CSS-MUSIC method [Chiou and Bolt 1993].
In Figure 5 (top right) an example of the slownessspectrum of a 5 second signal window is shown. Fig-ure 5 (bottom) shows a typical 24 hours time series ofback-azimuth values for waves having frequenciesaround 1.18 Hz, starting on March 1st, 2007, at 15:00UTC. From this figure we identify different wave arrivaldirections related to different time periods during theday. In particular, during the night, the presence ofnoise coming from about 225 degrees may be relatedto marine noise as evidenced by Saccorotti et al. [2001].During daytime the noise is more complex and it is pos-sible to identify some different directions probably as-sociated to cultural noise. Array analysis confirmed thelack of volcanic tremor, in the considered time inter-val. This was also previously shown by Saccorotti et al.[2001] for a different time interval.
This array allowed studying the seismic wavefieldalso for very low magnitude earthquakes. For example
the M = −1 earthquake recorded by the seismic arrayat 03:42 UTC on March 4, 2008 (Figure 6). For strongerearthquakes it also allowed to identify seismic phasesand their propagation direction. In Figure 7 an M = 1earthquake recorded by the array on September 11,2009, at 21:06 UTC, is shown. The P phase, the S phaseand the coda of the signal are well distinguishable bothin backazimuth and in apparent velocity.
5. Other eventsEven if the main seismicity that is currently
recorded at Mt. Vesuvius consists of VT earthquakes,the network records a variety of different signals as ar-tificial explosions and thunders [Esposito et al. 2013]. Inthe following we illustrate two cases of peculiar signalsof natural origin.
LandslidesAmong the signals recorded by the Vesuvius net-
work, landslides are very common. They are usually re-lated to small rockfalls occurring within the Vesuviuscrater [Esposito et al. 2013]. Thanks to the stations de-ployed at the top of the volcano crater it is possible todetect and identify them.
An important landslide sequence occurred on June4-5, 2009, when the seismic network recorded at least
SEISMIC NETWORK OF MT. VESUVIUS
Figure 5. Top left: geometry of the permanent seismic array located in position indicated by the cross in Figure 1. Horizontal and verticalunits are meters; labels indicate the array element names. Top right: slowness spectrum of 5 second of signal. Units are in s/km. Bottom:backazimuth analysis for a time window representing a typical day.

15 signals associated to landslides. The major of themwas recorded at 04:41 UTC on June 5, 2009, and itssource was located on the inner wall of the Gran Conocrater. A following on-site inspection associated thisevent to a collapse affecting an area of 50×170 m2 insidethe Gran Cono. In Figure 8 (left) we show the June 5 mainlandslide recorded by the broadband station VCRE. Inthe Figure 8 (right) the low-pass 1 Hz filtered signal isshown. In the vertical component signal a marked down-ward pulse is visible. We postulate it to be related to thedownward single force component associated with theimpact of the landslide mass with the ground [Deparis
et al. 2008]. The availability of broadband recordingsfor these events could allow their quantification throughseismological techniques.
Low-frequency earthquakeOn May 11, 2012, at 01:09 UTC, the seismic net-
work of Mt.Vesuvius recorded two low amplitude sig-nals having peculiar features (Figure 9). In the past,long-period events, have been already identified at Vesu-vius [Bianco et al. 2005]. However the aforementionedsignals, have waveforms and spectra differing fromthose of typical LP events [Chouet 1996]. The first
ORAZI ET AL.
8
Figure 6 (above). Traces of a M = −1 earthquakes recorded by theseismic array on March 4, 2008, at 03:42 UTC. Amplitudes are nor-malized. Label on the right indicate the array elements (see Figure 5).Figure 7 (right). Backazimuth and apparent velocity analysis of anM = 1 earthquake recorded by the seismic array on September 11,2009, at 21:06 UTC. The size of circles in the two lower panels isproportional to the beam energy.
Figure 8. Waveforms of the major landslide recorded by the VCRE station on June 5, 2009, at 04:04 UTC. In the right panels the 1 Hz lowpass filtered signals are shown.

9
SEISMIC NETWORK OF MT. VESUVIUS
Figure 9. Traces of the very-low-frequency earthquake recorded by the seismic network of Mt. Vesuvius on May 11, 2012, at 01:09 UTC.The figure shows only the vertical components.
Figure 10. Top left: the three-components waveforms of the very-low-frequency earthquake recorded at OVO broadband sensor. On the top-right we show a zoom on the P and S-wave arrivals. Bottom left: displacement spectrum of the 3 waveforms shown above. Bottom right:spectrogram of the vertical component of the same event recorded at OVO.

event has clear P and S seismic phases (Figure 10). Thisallowed the determination of the event hypocenterwhich was below the volcanic edifice, West of the cone,
at a depth of about 1.36 km b.s.l. (Figure 11). In partic-ular, the station OVO, equipped with a Trillium 240 s,furnished the clearest waveform (top in Figure 10). TheP wave polarities were compatible with a double couplemechanism (Figure 11). The main signal was followed,about 70 s later, by another signal having a more com-plex waveform but a similar spectrum (bottom right inFigure 10). This second signals seems to consist in thesuperposition of many small events, having the samewaveform of the first one.
The displacement spectra of the S phase of thefirst event (bottom left in Figure 10) allowed the com-putation of the seismic moment which is about 6×10¹¹
Nm. The corner frequency has a value of about 2 Hz.Assuming a seismic rupture speed of 0.9*Vs, the com-puted stress drop has a significantly low value (less than0.1 bar), suggesting a source mechanism different fromtypical VT earthquakes. Another possibility is a slowerrupture speed compared to VT earthquakes.
ORAZI ET AL.
10
Figure 11. Focal mechanism and epicenter location of the low-fre-quency event.
Figure 12. 3000 s time window starting at 21:30 UTC on November 8, 2009, of the seismic and infrasonic signal recorded by the VARP sta-tion. The zooms show seismic (top) and infrasound (bottom) waveforms of an earthquake (A) and two thunders (B and C).

11
This kinematics is similar to that of slow earth-quakes, which are usually recorded along convergentplate boundaries [Ide at al. 2007]. It is interesting to notethat in this case such events have been observed in acompletely different geotectonic framework (a volcanowithin an extensional tectonic environment).
6. InfrasoundThe seismic network is integrated, since 2006, with
several infrasound sensors, as reported in Table 1. Forvolcanic monitoring purpose, infrasound signals are use-ful to quantify volcanic activity. Moreover these sensorsare particularly useful for the event discrimination task.Their signals, compared with the seismic ones, allow aquick and reliable discrimination between earthquakesand other signals, for example thunders [Arrowsmith etal. 2010]. The Vesuvius infrasound network has recordedvarious transients related to thunders, explosions, su-personic jets and bolides [D’Auria et al. 2006].
For instance, on November 8, 2009, a seismic swarmwas recorded simultaneously to a sequence of thunders.In Figure 12 we show a 3000 s time window starting at21:30 UTC on November 8. The zooms show bothseismic (top) and infrasound (bottom) waveforms of anearthquake (A) and two thunders (B and C). The infra-sonic earthquake waveform resembles the envelope ofthe seismic component. The infrasonic thunder wave-forms are, instead, completely different from the seis-mic traces.
Infrasound networks, as the Vesuvius one, havealso a peculiar scientific interest in various fields [Le Pi-chon et al. 2010]. The study of infrasound could po-tentially lead to new discoveries [Le Pichon et al. 2010].For example, Figure 13 shows the infrasonic (top 5 traces)and seismic (bottom) signals of an event of unknownorigin, recorded at Vesuvius at 13:01 UTC on October6, 2009. The sonic waveform consists of two distinctphases. Only the first one has also a seismic signature.Delays between arrival times suggest a source locatedin the SW direction. Future efforts will be devoted tothe development of automated procedures aimed at de-tecting and characterizing such signals.
7. Discussion and conclusionsThe seismic network of Mt. Vesuvius is the first
known monitoring network on a volcano. It startedworking in 1856 with the installation of the first elec-tromagnetic seismometer designed by Luigi Palmieri.Since then, seismological measurement systems havecontinuously monitored the volcano. The Osservato-rio Vesuviano continuously improves the network byapplying state of the art technologies and research toolsand methods.
The most modern part is constituted by digital sta-tions developed at the Osservatorio Vesuviano, GILDAdata logger [Orazi et al. 2006, 2008]. This station was de-signed for low consumption, high dynamic range specif-ically devoted for remote installations. The use of thisdata logger allowed the installation of several stationsclose to the summit area. This led to important resultsfor the volcano monitoring purposes. For instance, it al-lowed a better delineation of two seismogenetic vol-umes within the volcanic structure [Giudicepietro et al.2010, D’Auria et al. 2013]. In addition, the completenessmagnitude of the network was lowered down to 0 inthe area below the cone at a shallow depth (500 m a.s.l.)as shown in Figure 3 (top right panel). Future deploy-ment of borehole stations will further decrease thecompleteness magnitude of the seismic catalogue. Theinstallation of the summit stations allowed also theidentification and the characterization of several land-slides that affected the crater walls.
The current seismic stations distribution allows todetect M = 2 earthquakes also in the area surroundingthe volcano. Consequently the absence of a significantseismicity around Mt. Vesuvius can be stated. We have
SEISMIC NETWORK OF MT. VESUVIUS
Figure 13. Infrasonic (top 5 traces) and seismic (bottom) signals ofan event of unknown origin recorded on Vesuvius at 13:01 UTC onOctober 6, 2009. The arrows indicate two distinct phases in the in-frasonic waveforms.

shown that the current network configuration wouldbe able to detect changes in seismicity pattern, allowingan eventual reconfiguration of the monitoring systemas a temporary network.
All the new installed stations are equipped withbroadband sensors and GILDA data-logger. Conse-quently, not only the geometry of the network got im-proved, but also its frequency range sensibility. Thisallowed the first identification of a low-frequency earth-quake. Such sensors can be potentially able to recordseismo-volcanic signals like long-period events, whichare known to be reliable precursors of volcanic erup-tions [Chouet 1996]. The forthcoming installation of a3D seismic array will provide also a valuable tool forthe detection and location of possible sources of vol-canic tremor.
The data transmission infrastructure is organizedto be largely redundant by using different transmissionsystems (Wi-Fi, ADSL, UHF analog lines and UHF dig-ital lines). To avoid as much as possible data loss, localacquisition nodes collect data of subsets of network sta-tions. The current efforts are toward the improvementof the infrastructure robustness in order to allows itsoperation even in case of failure of one or more of itscomponents. This is a critical aspect for a network de-signed to operate during a possible volcanic emergency.The development of a heterogeneous data transmis-sion infrastructure has shown to be the best solution.
The development of the network and its infra-structure, has been accompanied by the parallel im-provement of the automatic analysis system. All thedata are collected and analyzed in real time by the Mon-itoring Centre of the Osservatorio Vesuviano. The ex-pert staff which is constantly in contact with the ItalianCivil Defense Authorities supervises the outputs of theautomated systems. All the output parameters are avail-able to the public at http://sismolab.ov.ingv.it/sismo/index.php.
The future development of the network will be sup-ported by quantitative numerical tools devoted to therealistic simulation of a wide range of seismo-volcanicsignals. These simulations will be used to check the im-provement of the seismic network performances.
Acknowledgements. We acknowledge the editor FrancescaBianco and two anonymous reviewers for their valuable commentsand suggestions which improved the manuscript.
ReferencesArrowsmith, S.J., J.B Johnson, D.P. Drob and M.A.H.
Hedlin (2010). The seismoacoustic wavefield: a newparadigm in studying geophysical phenomena, Rev.Geophys., 48, RG4003.
Bianco, F., M. Castellano, E. Del Pezzo and J.M. Ibanez
(1999). Attenuation of short period seismic waves atMt. Vesuvius, Italy, Geophys. J. Int., 138, 67-76.
Bianco, F., P. Cusano, S. Petrosino, M. Castellano, C.Buonocunto, M. Capello and E. Del Pezzo (2005)Small-aperture array for seismic monitoring of Mt.Vesuvius, Seismol. Res. Lett., 76, 344-355.
Boatwright, J., J.B. Fletcher and E.F. Thomas (1991) Ageneral inversion scheme for source, site, and prop-agation characteristics using multiply recorded setsof moderate-sized earthquakes, Bull. Seismol. Soc.Am., 81 (5), 1754-1782.
Brune, J.M. (1970). Tectonic stress and the spectra of seis-mic shear waves from earthquakes, J. Geophys. Res.,75 (26), 4997-5009; doi:10.1029/JB075i026p04997.
Buonocunto, C., L. D’Auria, A. Caputo, M. Martini andM. Orazi (2011). The Infracyrus infrasound sensor,Rapporti Tecnici INGV, no. 188. ISSN:2039-7941.
Chiou, S., and B.A. Bolt (1993). Seismic wave slownessestimation from broadband array data, Geophys. J.Int., 114, 234-248.
Chouet, B.A. (1996). Long-period volcano seismicity:its source and use in eruption forecasting, Nature,380, 309-316; doi:10.1038/380309a0.
Convertito, V., and A. Zollo (2011). Assessment of pre-crisis and syn-crisis seismic hazard at Campi Flegreiand Mt. Vesuvius volcanoes, Campania, southernItaly, Bull. Volcanol., 73, 767-783; doi:10.1007/s00445-011-0455-2.
D’Alessandro, A., D. Luzio, G. D’Anna and G. Man-gano (2011). Seismic network evaluation throughsimulation: an application to the Italian NationalSeismic Network, Bull. Seismol. Soc. Am., 101 (3),1213-1232; doi:10.1785/0120100066.
D’Auria, L., E. Marotta, M. Martini and P. Ricciolino(2006). Seismic and acoustic detection of a bolide air-burst in the Gulf of Naples (southern Italy), J. Geo-phys. Res., 111, B10307; doi:10.1029/2005JB004254.
D’Auria L., R. Curciotti, M. Martini, G. Borriello, W.De Cesare, F. Giudicepietro, P. Ricciolino and G.Scarpato (2008). PLINIO: an interactive web inter-face for seismic monitoring of Neapolitan volcanoes,In: W. Marzocchi and A. Zollo (eds.), Conception,verification and application of innovative techniquesto study active volcanoes, Roma, Istituto Naziona-le di Geofisica e Vulcanologia, 363-374. ISB:978-88-89972-09-0.
D’Auria, L., A.M. Esposito, D. Lo Bascio, P. Ricciolino,F. Giudicepietro, M. Martini, T. Caputo, W. De Ce-sare, M. Orazi, R. Peluso, G. Scarpato, C. Buono-cunto, M. Capello and A. Caputo (2013). The recentseismicity of Mt. Vesuvius: inference on seismo-genic processes, Annals of Geophysics, 56 (4), S0442;doi:10.4401/ag-6448.
ORAZI ET AL.
12

13
De Natale, G., C. Troise, F. Pingue, G. Mastrolorenzo,and L. Pappalardo (2011). The Somma-Vesuvius vol-cano (Southern Italy): structure, dynamics and haz-ard evolution, Earth-Science Reviews, 74, 73-111.
Deparis, J., D. Jongmans, F. Cotton, L. Baillet, F. Thou-venot and D. Hanz (2008). Analysis of rock-fall ava-lanche seismograms the French Alps, Bull. Seismol.Soc. Am., 98 (4), 1781-1796.
Esposito, A.M., L. D’Auria, F. Giudicepietro, T. Caputoand M. Martini (2013). Neural analysis of seismicdata: applications to the monitoring of Mt. Vesu-vius, Annals of Geophysics, 56 (4), S0446; doi:10.4401/ag-6452.
Giudicepietro, F., A. Esposito, L. D’Auria, M. Martiniand S. Scarpetta (2008). Automatic analysis of seis-mic data by using Neural Networks: applicationsto Italian volcanoes, In: W. Marzocchi and A. Zollo(eds.), Conception, verification and application of in-novative techniques to study active volcanoes, Roma,Istituto Nazionale di Geofisica e Vulcanologia, 399-415. ISB:978-88-89972-09-0.
Giudicepietro, F., M. Orazi, G. Scarpato, R. Peluso, L.D’Auria, P. Ricciolino, D. Lo Bascio, A.M. Esposito,G. Borriello, M. Capello, A. Caputo, C. Buonocunto,W. De Cesare, G. Vilardo and M. Martini (2010).Seismological Monitoring of Mount Vesuvius (Italy):More than a Century of Observations, Seismol. Res.Lett., 81, 625-634; doi:10.1785/gssrl.81.4.625.
Ide, S., G.C. Beroza, D.R. Shelly and T. Uchide (2007). Ascaling law for slow earthquakes, Nature, 447, 76-79.
Le Pichon, A., E. Blanc and A. Hauchecorne, eds. (2010).Infrasound monitoring for atmospheric studies,Springer Science+Business Media B.V.
Orazi, M., R. Peluso and M. Martini (2006). Data Ac-quisition for Volcano Monitoring, EOS, TransactionsA.G.U., 87 (38), 385-392.
Orazi, M., R. Peluso, A. Caputo, M. Capello, C. Buono-cunto and M. Martini (2008). A multiparametric lowpower digitizer: project and results, In: W. Marzoc-chi and A. Zollo (eds.), Conception, verification andapplication of innovative techniques to study activevolcanoes, Roma, Istituto Nazionale di Geofisica eVulcanologia, 435-460. ISB:978-88-89972-09-0.
Owens, B. (2013). Long-term research: Slow science,Nature, 495, 300-303; doi:10.1038/495300a.
Peluso, R., C. Buonocunto, A. Caputo, W. De Cesare,M. Orazi and G. Scarpato (2009). Tecniche di Alta Di-sponibilità per l’acquisizione di dati sismici in ambi-ente GNU/Linux: un’applicazione alla rete di Strom-boli, Quaderni di Geofisica, INGV, no. 74. ISSN:1590-2595.
Saccorotti, G., R. Maresca and E. Del Pezzo (2001).Array analyses of seismic noise at Mt. Vesuvius Vol-
cano, Italy, J. Volcanol. Geoth. Res., 110 (1/2), 79-100.Scarpato, G., W. De Cesare, M. Orazi, R. Peluso, A. Ca-
puto, M. Martini and F. Giudicepietro (2007). Si-stemi di trasmissione Wi-Fi per il monitoraggiosismico del Vesuvio, Open File Report, OsservatorioVesuviano, no. 11.
Scarpato, G. (2011). Nuovo sistema per le localizzazioniautomatiche degli eventi sismici basato su tecnolo-gie WEB: NEWWBSM, Rapporti Tecnici, INGV,no. 195.
Tramelli, A., C. Troise, G. De Natale, M. Orazi (2013).A new method for optimization and testing of mi-croseismic networks: an application to Campi Fle-grei (Southern Italy), Bull. Seismol. Soc. Am.,submitted.
Wiemer, S. (2001). A software package to analyze seis-micity: ZMAP, Seismol. Res. Lett., 72, 373-382.
*Corresponding author: Massimo Orazi,Istituto Nazionale di Geofisica e Vulcanologia, Sezione di Napoli,Osservatorio Vesuviano, Naples, Italy;email: [email protected].
© 2013 by the Istituto Nazionale di Geofisica e Vulcanologia. Allrights reserved.
SEISMIC NETWORK OF MT. VESUVIUS