
The SEED Family - cbs.dtu.dk · 60.2% CDA 21.7% Respiration Capsule Motility Membrane transport...
38
The SEED Family www.nmpdr.org www.theseed.org
Transcript of The SEED Family - cbs.dtu.dk · 60.2% CDA 21.7% Respiration Capsule Motility Membrane transport...

The SEED Family
www.nmpdr.org www.theseed.org

Firstbacterial genome
100bacteria
l genome
s1,000
bacterial
genomes
Num
ber
of
know
n s
equence
s
Year
How much has been sequenced?
Environmentalsequencing

Annotations vs. sequences

Subsystems Make Up Metabolism
Wik
ipedia
Meta
bolis
mhtt
p:/
/en.w
ikip
edia
.org
/wik
i/Po
rtal:M
eta
bolis
m

Chaperone Subunit Usher Adhesin
S. enterica Enteritidis 2389 2388 2387 2386
E. coli HS 3068 3067 3066 3065
B. cenocepacia J2315 2604 2603 2602 2601
S. maltophilia 1085 1088 1087 1086
Subsystem spreadsheet(conceptually)

Three level “hierarchy”
• Amino Acids and Derivatives– Alanine, serine, and glycine
• Serine Biosynthesis
• Amino Acids and Derivatives– Lysine, threonine, methionine, and cysteine
• Methionine Biosynthesis
Make your own subsystems!
Over 1,000 Subsystems

Class # SS Class # SS
Amino Acids and Derivatives
56 Nucleosides and Nucleotides
14
Carbohydrates 97 Phosphorus Metabolism 6
Cell Division / Cycle 10 Photosynthesis 9
Cell Wall and Capsule 50 Potassium metabolism 3
Clustering-based ss 193 Protein Metabolism 52
Cofactors, Vitamins, Pigments
43 RNA Metabolism 39
DNA Metabolism 30 Regulation/signaling 23
Fatty Acids, Lipids, and Isoprenoids
22 Respiration 44
Membrane Transport 41 Secondary Metabolism 24
Metabolism of Aromatic Compounds
30 Stress Response 37
Motility and Chemotaxis 8 Sulfur Metabolism 12
Nitrogen Metabolism 11 Virulence 116

Annotation of Complete Genomes
• Automated user originated processing
• Takes 1-7 hours depending on size and complexity of the genome
• ~2,000 external submissions, including hundreds of genomes not yet publicly released.
• Reannotation of >500 genomes complete
• 1,000 users, 200 organizations, 25 countries.
http://rast.nmpdr.org/
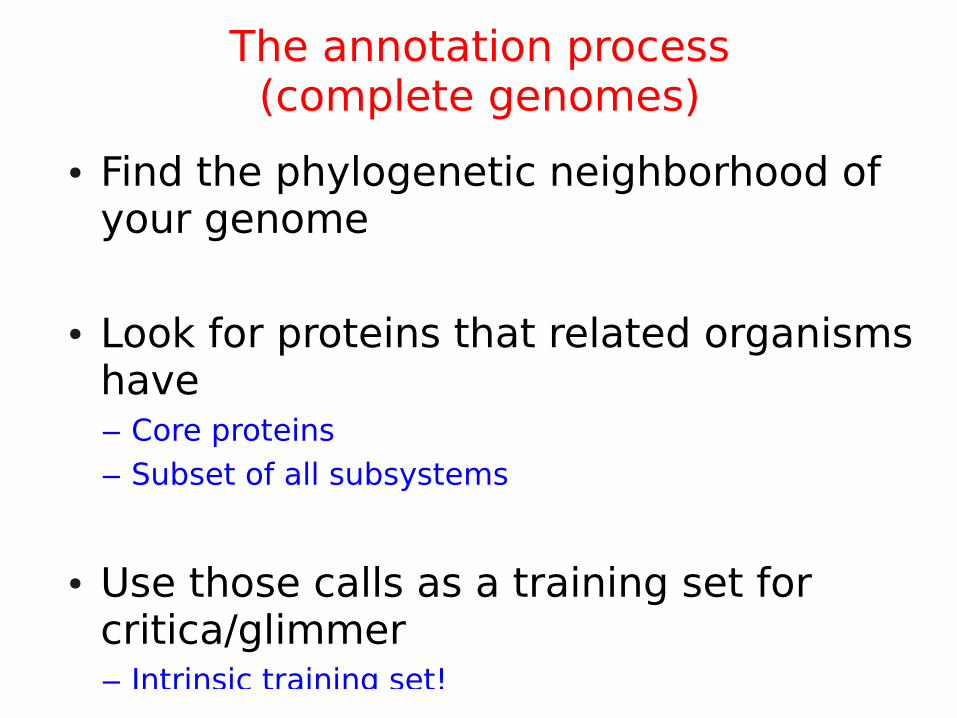
● Find the phylogenetic neighborhood of your genome
● Look for proteins that related organisms have– Core proteins
– Subset of all subsystems
● Use those calls as a training set for critica/glimmer– Intrinsic training set!
The annotation process(complete genomes)

This one’s for Gary

● Subsystem, GO, and KEGG connections– KEGG EC numbers– KEGG reaction numbers– SEED reaction numbers (Chris Henry)
● Metabolic flux models – Automatically generate FBA matrices (Aaron
Best/Matt DeJongh; Hope College)
Automatic metabolic reconstruction


The Populated Subsystem

Automatically compare metabolicreconstructions

● Rapidly correct missing annotations
● Add more members to subsystems
• Improves future genome annotations!
(especially with new subsystems)
Find and suggest candidate functions

• 10 genomes submitted on Thursday at 6 pm
• First annotation complete before 8 am Friday
● Remaining annotations completed Friday before noon
● (there were others in the pipeline too!)
● Presentation ASM 2009 Tuesday, 8pm
The Live ASM TestPhiladelphia, 2009

Genome Percent of Proteins in Subsystems
Haloferax denitrificans 20%
Haloferax mediterranei 19%
Haloferax sulfurifontis 19%
Haloferax volcanii DS2 19%
Haloarcula sp 33800 19%
Haloarcula sp 33799 18%
Subsystems coverage of sequenced Archaea

PHANTOME
Mya B
reitb
art, M
att Sulli
van, Jeff
Elhai,
Rob Edward
s
NSF
Haloferax sulfurifontis prophage
Prophages

Metagenomics RAST has 300 public metagenomes
Compared using tblastx
Comparing complete genomesto metagenomes

Human Poop

Thanks Nick Celms, Beltran RodriguezMueller, Mya Breitbart, & Forest Rohwer
High Salinity SalternsSan Diego, July 2004

Low salinity salterns High salinity salterns
July2004
Nov2005

The metagenomics RAST server

Automated Processing

www.nmpdr.org www.theseed.org
Summary View

Metagenomics ToolsAnnotation & Subsystems
www.nmpdr.org www.theseed.org

Metagenomics ToolsAnnotation & KEGG maps
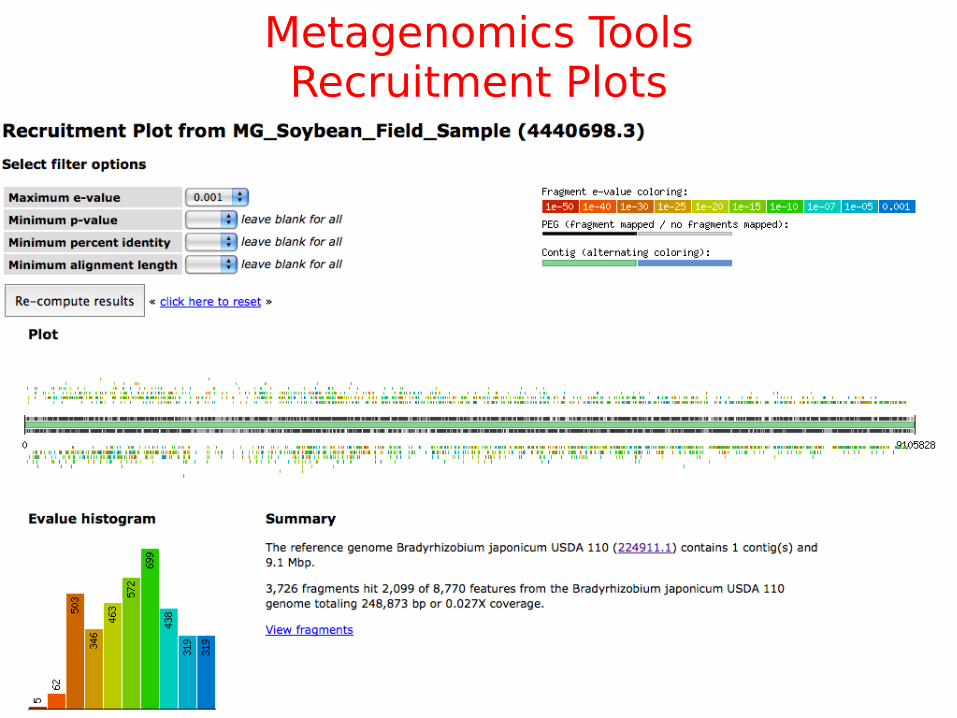
Metagenomics ToolsRecruitment Plots

Metagenomics ToolsPhylogenetic Reconstruction

Metagenomics ToolsComparative Tools

Hours
of
Com
pute
Tim
e
Input size (MB)
Computational Requirements~19 hours of compute per input megabyte
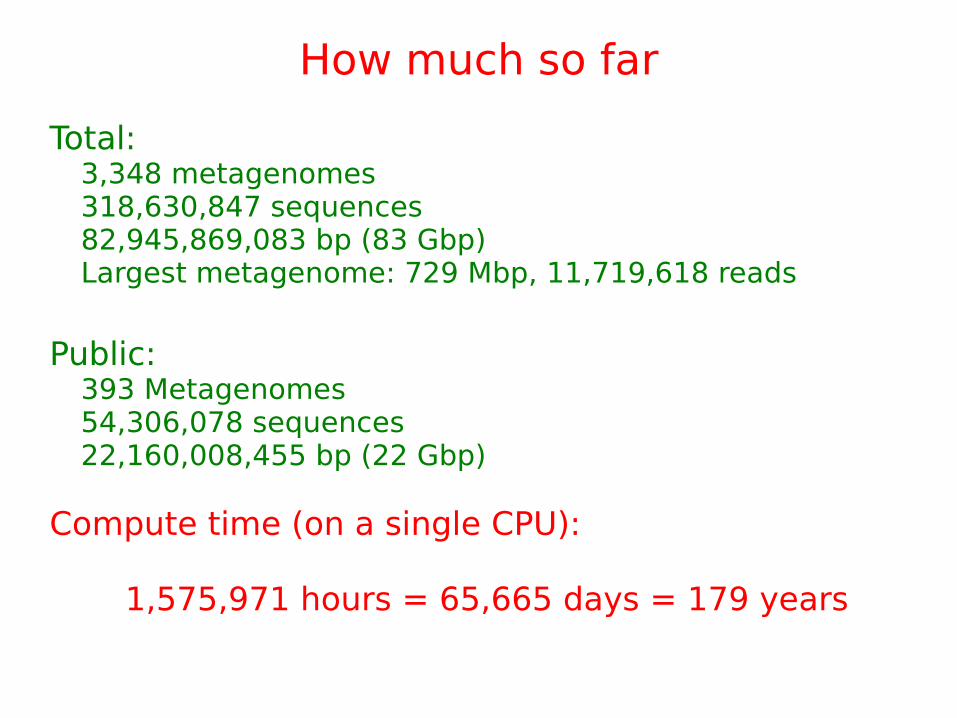
How much so far
Total:3,348 metagenomes318,630,847 sequences82,945,869,083 bp (83 Gbp)Largest metagenome: 729 Mbp, 11,719,618 reads
Public:393 Metagenomes54,306,078 sequences22,160,008,455 bp (22 Gbp)
Compute time (on a single CPU):
1,575,971 hours = 65,665 days = 179 years

Lots of computers, no pattern

Does it work?

Lots of sequencesall pyrosequencing

Metagenomics ToolsFunctional Heat Maps

Sulfur
CDA 60.2%
CD
A
21
.7%
Respiration
Capsule Motility
Membranetransport
Stress
Signaling
PhosphorusRNA
MineSaltern
MarineMicrobialites
CoralFish
AnimalsFreshwater
From Sequences To Environments
Dinsdale et al, Nature 2008

BACK!


