The Second Danish National Energy Efficiency Action Plan ... - Energy Efficiency Action Plan...
41
The Second Danish National Energy Efficiency Action Plan under Directive 2006/32/EC
Transcript of The Second Danish National Energy Efficiency Action Plan ... - Energy Efficiency Action Plan...

The Second Danish National Energy Efficiency Action Plan under Directive 2006/32/EC

- 2 -
Contents 1.1 Summary................................................................................................................. - 3 -
1.2 National energy efficiency context .......................................................................... - 3 -
1.3 National energy efficiency objectives...................................................................... - 5 -
1.3.1 NEEAP 1 objectives: ........................................................................................ - 6 -
2.1 Targets and outlook for gross energy consumption.................................................. - 7 -
2.2 Strategies aimed at reducing gross energy consumption .......................................... - 8 -
2.3 Measures aimed at savings in gross energy consumption......................................... - 9 -
3.1 National strategies aimed at reducing end-consumption of energy......................... - 10 -
3.2 Description of individual measures........................................................................ - 11 -
3.3 Achieved savings .................................................................................................. - 21 -
3.3.1 Achievement of the intermediary target for 2010............................................ - 22 -
3.3.2 Expected achievement of the energy savings target for 2016 .......................... - 22 -
3.4 Description of assessment methods used for evaluating Denmark’s saving measures in
the period 2008 to 2010 .............................................................................................. - 23 -
3.4.1 National bottom-up method ............................................................................ - 23 -
3.4.2 Description of top-down method .................................................................... - 25 -
4.1 Public sector activities........................................................................................... - 27 -
Implementation of Article 5(1) (use of at least two measures from Annex VI)............. - 29 -
4.2 Guidance and information on energy efficiency and savings.................................. - 30 -
Annex 1: Energy savings reported by network and distribution companies.................. - 32 -
Annex 2: Overview of share of allowance-covered consumption................................. - 36 -
Annex 3: Documentation of TD calculations............................................................... - 37 -

- 3 -
PART 1 - Introduction
1.1 Summary With long-term strategies and specific objectives, energy efficiency and savings in Denmark have contributed to decoupling the development in energy consumption from economic growth. The Danish Government’s overall objective for climate and energy policy is for Denmark to be inde-pendent of fossil fuels by 2050. This includes specific objectives to the effect that gross energy consumption is to decrease by a total of 4 per cent from 2006 levels between now and 2020 , that annual savings of 10.3 PJ in the end-consumption of energy are to be made and that Denmark is to be one of the three most energy-efficient countries in the world by 2020. Under Article 4 of Directive 2006/32/EC (ESD), Denmark shall aim to achieve an indicative en-ergy savings target of 9 % of final energy consumption in the period 2008-2016, corresponding to one per cent per year. Through the overall strategies and individual measures described in this ac-tion plan it is possible to show that the overall target for 2016 and the intermediary target for 2010 will be met. 1.2 National energy efficiency context Energy efficiencies and savings form an important part of Danish energy policy, and large-scale ef-ficiency improvements have been implemented over the past 25+ years. One result of efficiencies in households, businesses and in energy production in the form of extended use of combined heat and power is that for the last three decades gross energy consumption has remained almost constant in Denmark despite economic growth of approx. 78 per cent during this period. As may be seen in Figure 1, energy efficiency efforts over a number of years have stabilised the consumption of energy despite a considerable increase in GDP.

- 4 -
Figure 1: Development in GDP and gross energy consumption 1980-2009
The gross energy consumption has been adjusted for net exports and climatic variations as compared with a year of normal weather. Key: Danish: Indeks 1980=100, English: Index 1980=100 Danish: BNP i 2000 priser, English: GDP in 2000 prices Danish: Bruttoenergiforbrug, korrigeret, English: Gross energy consumption, adjusted The development in energy intensity in relation to both final energy consumption and gross energy consumption in the same period is shown in Figure 2.
Figure 2: Gross energy consumption and final energy consumption per million GDP 1980-2009
Key: Danish: Korrigeret [TJ pr. Mio. BNP (2000-priser)], English: Adjusted [TJ per million GDP (2000 prices)] Danish: Bruttoenergiforbrug, English: Gross energy consumption Danish: Endeligt energiforbrug, English: Final energy consumption
- 5 -
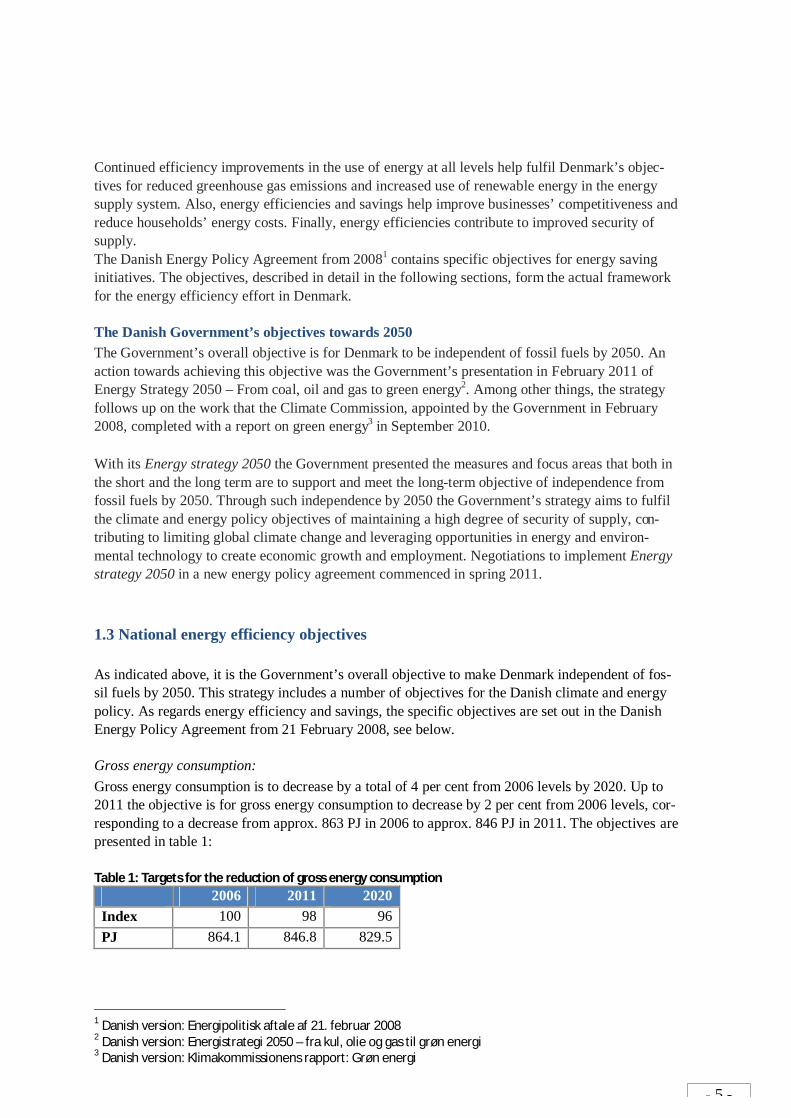
Continued efficiency improvements in the use of energy at all levels help fulfil Denmark’s objec-tives for reduced greenhouse gas emissions and increased use of renewable energy in the energy supply system. Also, energy efficiencies and savings help improve businesses’ competitiveness and reduce households’ energy costs. Finally, energy efficiencies contribute to improved security of supply. The Danish Energy Policy Agreement from 20081 contains specific objectives for energy saving initiatives. The objectives, described in detail in the following sections, form the actual framework for the energy efficiency effort in Denmark. The Danish Government’s objectives towards 2050 The Government’s overall objective is for Denmark to be independent of fossil fuels by 2050. An action towards achieving this objective was the Government’s presentation in February 2011 of Energy Strategy 2050 – From coal, oil and gas to green energy2. Among other things, the strategy follows up on the work that the Climate Commission, appointed by the Government in February 2008, completed with a report on green energy3 in September 2010. With its Energy strategy 2050 the Government presented the measures and focus areas that both in the short and the long term are to support and meet the long-term objective of independence from fossil fuels by 2050. Through such independence by 2050 the Government’s strategy aims to fulfil the climate and energy policy objectives of maintaining a high degree of security of supply, con-tributing to limiting global climate change and leveraging opportunities in energy and environ-mental technology to create economic growth and employment. Negotiations to implement Energy strategy 2050 in a new energy policy agreement commenced in spring 2011. 1.3 National energy efficiency objectives As indicated above, it is the Government’s overall objective to make Denmark independent of fos-sil fuels by 2050. This strategy includes a number of objectives for the Danish climate and energy policy. As regards energy efficiency and savings, the specific objectives are set out in the Danish Energy Policy Agreement from 21 February 2008, see below. Gross energy consumption: Gross energy consumption is to decrease by a total of 4 per cent from 2006 levels by 2020. Up to 2011 the objective is for gross energy consumption to decrease by 2 per cent from 2006 levels, cor-responding to a decrease from approx. 863 PJ in 2006 to approx. 846 PJ in 2011. The objectives are presented in table 1: Table 1: Targets for the reduction of gross energy consumption
2006 2011 2020 Index 100 98 96 PJ 864.1 846.8 829.5
1 Danish version: Energipolitisk aftale af 21. februar 2008 2 Danish version: Energistrategi 2050 – fra kul, olie og gas til grøn energi 3 Danish version: Klimakommissionens rapport: Grøn energi
- 6 -
Final energy consumption: Annual savings increased from 7.5 PJ/year to 1.5 per cent of final energy consumption in 2006, corresponding to 10.3 PJ. The Government’s objectives for 2020: In addition to the above objectives, the Government has presented a number of objectives for Den-mark towards 2020 in its work programme Denmark 2020 knowl-edge>growth>prosperity>welfare4, one of which is for Denmark to become a green and sustainable society and one of the three most energy-efficient countries in the world. Specifically, the target is for Denmark to be one of the three most energy-efficient countries in the OECD by 2020, based on energy intensity5. 1.3.1 NEEAP 1 objectives: Pursuant to Article 4 of Directive 2006/32/EC (ESD), Member States shall aim to achieve an in-dicative energy savings target of 9 % in the period 2008-2016, corresponding to one per cent per year. The first Danish Energy Efficiency Action Plan under the ESD (NEEAP 1) set the following na-tional energy savings targets for final energy consumption for the period 2008-2016: è 2008-2009 (incl.): 1.15 per cent per year of final energy consumption, corresponding to 7.5
PJ/year6. • 2010-2016 (incl.): 1.5 per cent per year of final energy consumption, corresponding to 10.3
PJ/year. The target for the period 2008-2009 is based on final energy consumption in 2003 and that for the period 2010-2020 on final energy consumption in 2006. However, this target is not calculated in the same way as the indicative national targets set out in the ESD. For example, the above target includes savings in sectors falling within the scope of the Emissions Trading System (ETS), and the lifetimes of savings in relation to the ESD target year 2016 have not been taken into account. Therefore, the national target has been adjusted below in re-lation to the conditions of the ESD obligations. The indicative energy savings targets pursuant to Article 4 of the ESD on the achievement of aver-age annual savings of 1 per cent of energy consumption shall, see Annex 1 of the Directive, be cal-culated based on average annual consumption in the five-year period preceding implementation of the Directive. When this target was calculated for use in NEEAP 1, it corresponded to the period 2002-2006. Table 2 shows that the 1 per cent target under the ESD thus corresponds directly to an-nual savings of 6.58 PJ. However, this calculation does not take account of the fact that part of the
4 Danish version: Danmark 2020 Viden > vækst > velstand > velfærd 5 In this context, energy intensity is defined as the total energy consumption-gross domestic product (GDP) ratio. 6 The target comes from the energy policy agreement from 2005: Agreement on the energy savings effort of 10 June 2005 (Aftale om energispareindsats 10. Juni 2005)

- 7 -
total end-consumption is covered by allowances as at the time of submission of NEEAP 1 there were no available data which could be used to distinguish energy consumption covered by allow-ances from energy consumption not covered by allowances. As statements of savings exclude sav-ings in energy consumption covered by allowances, the ESD savings target must be lowered ac-cordingly. Table 2: Total final energy consumption in the five-year period preceding implementation of the Direc-tive7 Year 2002 2003 2004 2005 2006 Average Final energy con-sumption (PJ)
641.7 646.9 658.7 665.0 679.4 658.3
2008 and 2009 data for energy consumption covered by allowances are now available. These data show that, on average, the energy consumption for 2008 and 2009 covered by allowances amounted to 4.6 per cent of end-consumption. Therefore the energy savings target of 6.58 PJ has been adjusted accordingly, resulting in an annual saving in end-consumption of 6.28 PJ, which gives a target saving of 56.5 PJ in final consumption when added up from 2008 to 2016. An over-view of the national objectives pursuant to Article 4 of the ESD and Annex 1 to the Directive is available in table 3. Table 3: Overview of energy savings targets and achieved/anticipated savings in gross and final energy consumption.
*Only initiatives on which a decision has already been reached are included, whereas effects from for ex-ample Energy Strategy 2050 and a possible future energy policy agreement for the time after 2011 are not included in anticipated savings. For a detailed explanation of this, please refer to section 3.3.2
PART 2 – Primary energy
2.1 Targets and outlook for gross energy consumption As described in section 1.3, Denmark has a target saying that gross energy consumption must de-crease by 2 per cent in 2011 and 4 per cent in 2020 as compared with the 2006 consumption. The latest Danish Energy Outlook from April 20118 shows that the objective of a 2 per cent reduction in
7 The stated consumption includes consumption in businesses covered by ETS. 8 Danish version: Danmarks Energifremskrivning april 2011
Gross energy Final energy consumption
Savings targets Achieved/anticipated savings
ESD savings tar-gets
Achieved/anticipated savings
2010 18.8 PJ 27.8 PJ 2011 17.3 PJ 62.1 PJ 2016 56.5 PJ 53.8 PJ 2020 34.6 PJ 46.1 PJ

- 8 -
2011 will be achieved with a considerable margin. The target of a 4 per cent reduction in 2020 will also be achieved, cf. table 4. Table 4: Targets and outlook for gross energy consumption Gross energy consump-tion (PJ)
2011 2020
Outlook 2011 802 818 Decrease from 2006 levels (per cent)
7 5
The outlook is based on a frozen policy process where only effects from already adopted measures are included, among these the Energy Policy Agreement from February 2008. Policy initiatives and proposals, which have not been finally adopted, are not included. Changes in assumptions, including variations in climatic conditions such as wind and precipitation and in economic growth estimates, may, however, have a considerable effect on gross energy con-sumption, just as another scenario for transport energy consumption or energy consumption in the North Sea will be directly reflected in gross energy consumption. Gross energy consumption is calculated as the energy consumption recorded in a calendar year and adjusted for fuel consumption associated with international electricity trade and climatic variations as compared with a year with “normal” weather. So the target includes energy consumption in all sectors, excluding gas flaring and international bunkering. 2.2 Strategies aimed at reducing gross energy consumption In February 2008, the Government entered into a broad political agreement with the Social Democ-ratic Party, the Danish People’s Party, the Socialist People’s Party, the Social-liberal Party and the New Alliance Party regarding Danish energy policy from 2008 to 2011. The purpose of the agree-ment was to increase the share of renewable energy and to further energy savings. Among other things, the agreement set objectives for the development in gross energy consumption by 2011 and 2020, cf. section 2.1. In February 2011, the Government presented Energy Strategy 2050. The strategy contains initia-tives for the period up to 2020 and establishes the framework for achieving the objective of fossil fuel independence by 2050. On the consumption side, Energy Strategy 2050 prepares the ground for an increase in the energy companies’ energy savings obligation by 50 per cent in 2013 and an additional 25 per cent in 2017 compared to today. Further, a tightening of the component requirements for a number of building elements (roof, floor, outer walls, windows, ventilation systems, etc.). Finally, Energy Strategy 2050 contains a new security of supply charge on energy consumption for heating, which will also have a restraining effect on energy consumption.
- 9 -
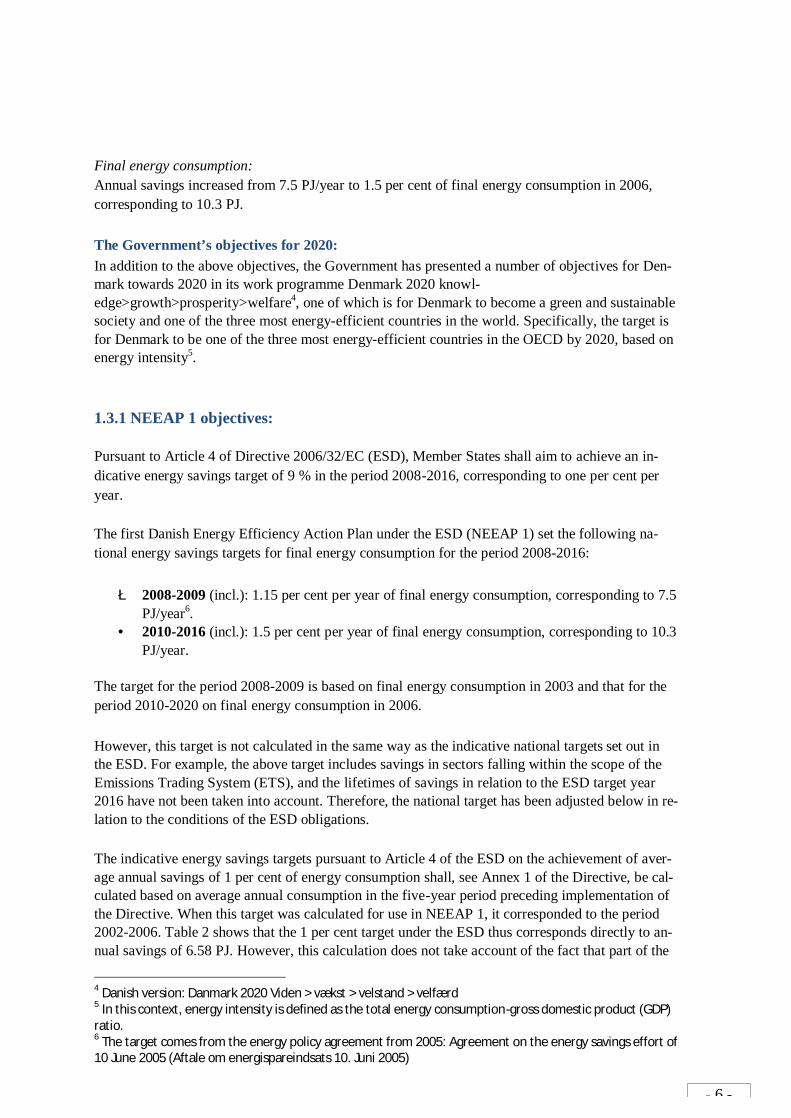
On the supply side, a considerably extended use of wind on land and at sea will also contribute to reducing gross energy consumption. Negotiations concerning Energy Strategy 2050 commenced in the spring of 2011. If a new energy policy agreement is made, which adheres to Energy Strategy 2050, the effects of the above initia-tives can be calculated as in shown in table 5 below. Table 5: Outlook for gross energy consumption in 2020 before and after Energy Strategy 2050 Gross energy consumption (PJ) 2020 Outlook 2011 818 Outlook after Energy Strategy 2050 781 Decrease from 2006 levels (per cent) 9.7
2.3 Measures aimed at savings in gross energy consumption Measures aimed at the supply side On the supply side, Energy Strategy 2050 includes (1) establishing a sea wind farm of 600 MW, (2) building a 400 MW sea wind plant closer to the coast than the large sea wind farms, and (3) erect-ing 1800 MW wind turbines on land. These measures are estimated to reduce gross energy con-sumption by approx. 15 PJ. Measures aimed at the distribution of energy As from 1 January 2010, savings within the distribution and transmission networks are included in the fulfilment of the companies’ energy savings obligations. In 2010, savings within the distribu-tion and transmission networks amounted to approx. 0.3 PJ of the companies’ total energy savings obligations of 6.1 PJ. Other measures aimed at gross energy consumption Savings in the energy consumption of the processing industry covered by allowances are included in the fulfilment of the companies’ energy savings obligations. The energy consumption covered by allowances constitutes approx. one third of the processing industry’s energy consumption. The energy consumption for fuel and flare in the Danish part of the North Sea corresponds to approx. 4 per cent of the Danish gross energy consumption. In order for the offshore sector to contribute to the fulfilment of the overall target in the agreement of 21 February 2008, an action plan for a more energy efficient re-covery of oil and gas in the North Sea 2009-2011 has been prepared to obtain a more energy-efficient oil and gas recovery. The purpose is to obtain a reduction of the energy consumption and thereby CO2 emissions from the recovery of oil and gas.

- 10 -
PART 3 - Final energy consumption
3.1 National strategies aimed at reducing end-consumption of energy Energy Policy Agreement - February 2008 Among other things, the Agreement sets out the national objective of implementing concrete en-ergy savings in the end-consumption of energy corresponding to 1.5 per cent of the final consump-tion in 2006 for the period from 2010 up to 2020. This objective means annual savings of 10.3 PJ. Moreover, the Agreement established that the energy savings obligations for the network and dis-tribution companies should be increased as from 2010 from 2.95 PJ/year to 5.4 PJ/year out of the total energy savings target of 10.3 PJ. The Energy Policy Agreement also contains the objective that the total energy consumption is to de-crease by 2 per cent in 2011 and by 4 per cent up to 2020 from 2006 levels. This is a strengthening of the development since 1980, where large energy savings and efficiencies have been achieved through a power-heat extension and other measures. As regards energy consumption in buildings, it was decided with the Agreement that for new build-ings restrictions are to be implemented which will reduce energy consumption in buildings by at least 25 per cent in 2010, at least 25 per cent in 2015 and at least 25 per cent in 2020, providing an overall reduction of at least 75 per cent by 2020, at the latest. In addition to the specific objectives for energy savings and efficiencies, DKK 20 mill. was set aside annually from 2008 to 2011, and subsequently DKK 5-10 mill. annually, for campaigns for energy savings in buildings. Of this amount, DKK 10 mill. was earmarked annually in 2008-2011 for the establishment of a research centre on energy savings in buildings. Sustainable transport – better infrastructure – December 20089 As part of the Government’s long-term objective for independence from fossil fuels, the strategy Sustainable transport from 2008 includes a number of CO2 reduction measures in the form of in-creased public transport, a green car tax and better fuel technologies to ensure that the transport sector contributes towards the target. Strategy for the reduction of energy consumption in buildings – April 200910 The Government’s strategy for a reduction of energy consumption in buildings contains 22 specific proposals for initiatives aimed at reducing energy consumption in both new and existing buildings as well as securing increased innovation, knowledge and education within energy-efficient con-struction. 9 Danish version: Bæredygtig transport / Bedre infrastruktur 10 Danish version: Reduktion af energiforbruget i bygninger
- 11 -
Energy Strategy 2050 – February 2011 Energy Strategy 2050 is the Government’s strategy detailing how to achieve the objective for inde-pendence from fossil fuels in 2050. It is also an important contribution towards meeting the more short-term energy and climate policy objectives, which have already been set out, in the time up to 2020. The strategy includes a massive expansion of renewable energy from wind power, biomass and biogas, which will increase the share of renewable energy to 33 per cent of energy consumption over the next few decades provided the strategy’s initiatives are implemented. Up to 2020, new sea-based wind turbines at Kriegers Flak and coastal and onshore turbines will double the produc-tion of wind power, making wind power cover 42 per cent of electricity consumption by 2020 as compared with today’s 20 per cent. In 2020, more than 60 per cent of electricity consumption will be covered by renewable energy. At the same time, an increased energy efficiency effort will mean that the gross energy consump-tion will be reduced by 9.7 per cent in 2020 as compared with 2006. 3.2 Description of individual measures This section describes the major individual measures contributing towards fulfilling the energy sav-ings target under the ESD. Measure 1 – Energy savings obligations for energy companies and an increase of the savings target for the effort (buildings, public sector, industry) In Denmark, pursuant to Act no. 520 of 7 June 2006 amending acts on electricity supply, natural gas supply and heat supply, etc. the network and distribution companies supplying electricity, natu-ral gas and district heating shall inform their customers about energy savings and contribute to real-ising energy savings, and in this connection specific annual energy savings targets may be stipu-lated. In terms of realising energy savings, the provisions form the basis of a market-based scheme that gives the companies a high degree of flexibility to obtain these savings as efficiently and cheaply as possible. The provisions are phrased so as to allow other operators etc. to contribute to implement-ing the savings. The scheme comprises end-consumption in all sectors except transport. The energy companies’ savings effort is financed through tariffs, and as regards the electricity net-work and natural gas companies this is effected within the established revenue framework. Savings obligations for energy companies (network and distribution companies) constitute a major part of the overall Danish energy savings programme. Since 2006 the network and distribution companies supplying electricity, natural gas, district heating and oil have been under an obligation to help implement tangible savings in energy end-consumption. The specific conditions for this
- 12 -
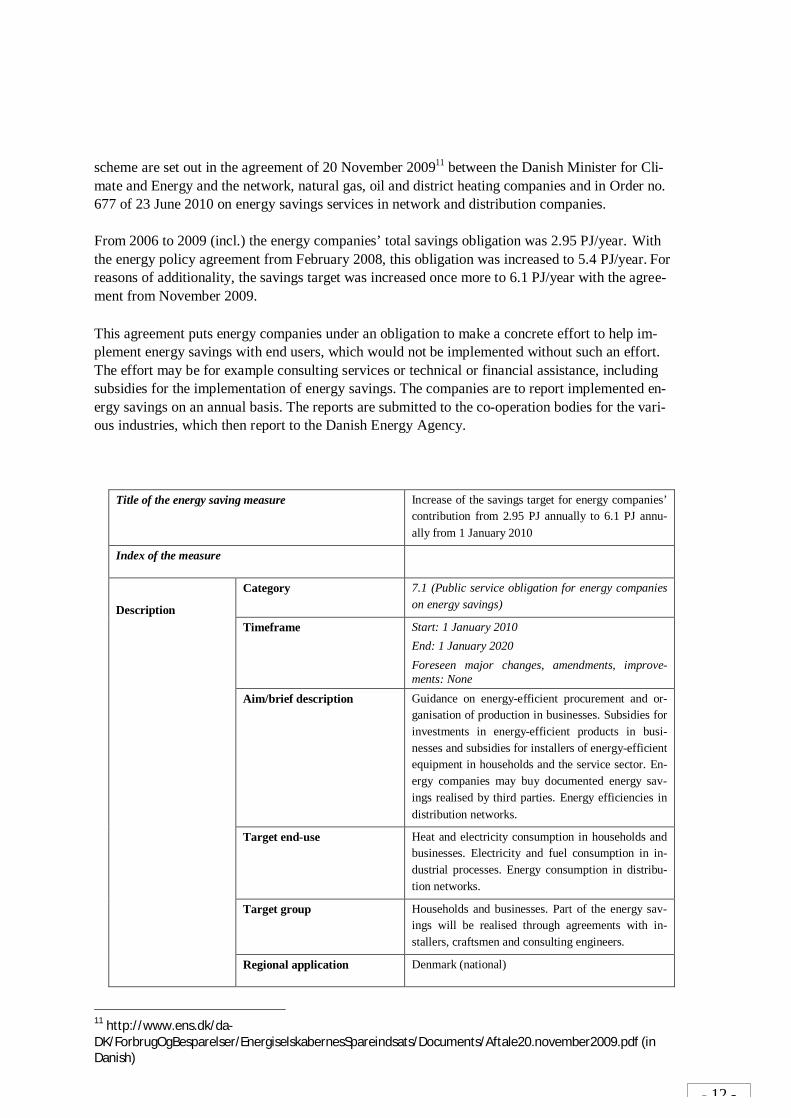
scheme are set out in the agreement of 20 November 200911 between the Danish Minister for Cli-mate and Energy and the network, natural gas, oil and district heating companies and in Order no. 677 of 23 June 2010 on energy savings services in network and distribution companies. From 2006 to 2009 (incl.) the energy companies’ total savings obligation was 2.95 PJ/year. With the energy policy agreement from February 2008, this obligation was increased to 5.4 PJ/year. For reasons of additionality, the savings target was increased once more to 6.1 PJ/year with the agree-ment from November 2009. This agreement puts energy companies under an obligation to make a concrete effort to help im-plement energy savings with end users, which would not be implemented without such an effort. The effort may be for example consulting services or technical or financial assistance, including subsidies for the implementation of energy savings. The companies are to report implemented en-ergy savings on an annual basis. The reports are submitted to the co-operation bodies for the vari-ous industries, which then report to the Danish Energy Agency.
Title of the energy saving measure Increase of the savings target for energy companies’ contribution from 2.95 PJ annually to 6.1 PJ annu-ally from 1 January 2010
Index of the measure
Category 7.1 (Public service obligation for energy companies on energy savings)
Timeframe Start: 1 January 2010 End: 1 January 2020 Foreseen major changes, amendments, improve-ments: None
Aim/brief description Guidance on energy-efficient procurement and or-ganisation of production in businesses. Subsidies for investments in energy-efficient products in busi-nesses and subsidies for installers of energy-efficient equipment in households and the service sector. En-ergy companies may buy documented energy sav-ings realised by third parties. Energy efficiencies in distribution networks.
Target end-use Heat and electricity consumption in households and businesses. Electricity and fuel consumption in in-dustrial processes. Energy consumption in distribu-tion networks.
Target group Households and businesses. Part of the energy sav-ings will be realised through agreements with in-stallers, craftsmen and consulting engineers.
Description
Regional application Denmark (national)
11 http://www.ens.dk/da-DK/ForbrugOgBesparelser/EnergiselskabernesSpareindsats/Documents/Aftale20.november2009.pdf (in Danish)

- 13 -
List and description of energy saving actions substantiating the measure
• Energy guidance • Subsidies for the purchase of energy-efficient
equipment • Purchase of energy savings realised by third
parties such as craftsmen, installers,etc. • Energy-efficiencies in distribution networks
Budget and financial source DKK 600-800 million annually
Implementing body Network and distribution companies
Information on im-plementation
Monitoring authority The Danish Energy Agency
Method for monitor-ing/measuring the resulting savings
Annual reports from network and distribution com-panies, spot checks and evaluations.
Savings achieved in 2010* Approx. 12 PJ
Expected energy savings in 2016*
Approx. 32 PJ
Expected impact on energy savings in 2020 (if available)
Approx. 49 PJ
Assumptions* • Savings have an average life of 8-18 years
• The savings would not have been realised with-out the companies’ participation.
Energy savings*
Overlaps, multiplication ef-fect, synergy
This is a transverse instrument which supports sec-tor-specific initiatives, except initiatives within the transport sector.

- 14 -
Measure 2 – Tightening up building regulations in 2010 (buildings) In April 2009, the Government presented a strategy for the reduction of energy consumption in buildings. In 2010, the strategy was implemented in the building regulations, providing stricter re-quirements on both new and existing buildings. The building regulations from 2010 (BR10) reduce the limits for the amount of energy that new buildings may use by 25 per cent from 2006 levels. Also, BR10 includes a voluntary building framework involving a reduction of energy consumption by 50 per cent, which will be made man-datory from 2015. In 2011, a voluntary building framework, which will reduce energy consumption in new buildings by 75 per cent as compared with 2006, is expected to be adopted. The reduction of 75 per cent from 2006 levels will be mandatory from 2020. According to the Government’s long-term vision, future buildings must comply with the concept of positive energy, that is, they must produce more energy than they consume. However, the major savings potential is in existing buildings. Therefore, the Government changed building legislation in 2010, allowing component requirements to be made for minor renovations and replacements. The basis of the component requirements is that energy efficiency initiatives must be cost-effective for the owner of the building. With this change the Government wishes to ensure that owners choose energy-efficient solutions when windows, pumps, boilers, etc. are to be replaced.
Title of the energy saving measure Tightening up building regulations
Index of the measure
Category 1.1 (Building codes and enforcement)
Timeframe Start: 30 June 2010 End: Forth going Foreseen major changes, amendments, improve-ments: None
Aim/brief description To further energy savings in buildings through stricter requirements for building envelopes, compo-nents and installations in new and existing buildings
Target end-use Heat consumption in new and existing buildings
Target group Small and large building owners, craftsmen, advi-sors, etc.
Description
Regional application Denmark (national)
Information on im-plementation
List and description of energy saving actions substantiating the measure
• Tightening up the energy framework for new buildings, reducing energy consumption by 25 per cent in 2010, 50 per cent in 2015 and by 75 per cent in 2020.
• Stricter energy requirements for building enve-lopes and windows in new buildings
• Component requirements for minor renovations of existing buildings
• Stricter component requirements for installa-

- 15 -
tions and building envelopes in existing build-ings
Budget and financial source Investment costs are defrayed by builders and will be counterbalanced by savings in current energy ex-penses.
Implementing body Private and public builders/building owners
Monitoring authority The Danish Enterprise and Construction Authority
Method for monitor-ing/measuring the resulting savings
Energy efficiency labelling in connection with the construction of new buildings and the sale of existing buildings.
Savings achieved in 2010* 1 PJ
Expected energy savings in 2016*
11 PJ
Expected impact on energy savings in 2020 (if available)
19 PJ
Assumptions* Savings would not be realised without the imple-mented tigthening up of the building regulations.
Energy savings*
Overlaps, multiplication ef-fect, synergy
The tightening up of the building regulations is sup-ported by information campaigns targeted at the building industry and private households.
Measure 3 – Increase of energy tax rates (horizontal measure): As part of a political package,12 the Government and the Danish People’s Party (DF) adopted a green tax reform in the spring of 2009, which increases tax on energy consumption and pollution, in part to finance tax reductions on labour and in part to support an ambitious climate, energy and environmental policy. The tax reform is estimated to reduce energy consumption and CO2 emis-sions in sectors not covered by allowances as well as increase the share of renewable energy. The most important initiatives of the package, which will impact energy consumption, include (1) an increase of energy tax on heat and electricity in households by approx. 15 per cent (2) the intro-duction of a new energy tax on fuel and electricity in industry, taking into consideration industries with a particularly high energy intensity and exposure to a high degree of international competition (3) a gradual reduction of the basic CO2 allowance for heavy-process companies not other-wise covered by allowances (4) the introduction of a tax on energy for air-conditioning (5) an in-crease of CFC tax to DKK 150 per CO2 equivalent. As part of a review of the political spring package the Government and DF agreed in May 2010 to reverse part of the energy tax on fuels and electricity in industry to ensure competitiveness and em-ployment. This will reduce some of the impact on energy consumption as compared with the origi-nal tax reform.
12 Danish version: Forårspakke 2.0

- 16 -
Title of the energy saving measure Increase of energy tax on energy consumption in households and industry.
Index of the measure
Category 3.2 (tax increases)
Timeframe Start: 1 January 2010 End: January onwards Foreseen major changes, amendments, improve-ments: None
Aim/brief description Increase of energy tax for households and industry. Increase of CO2 tax for the sector not covered by al-lowances, corresponding to the expected price of CO2 allowances.
Target end-use Heat and electricity consumption in households and industry (except for electric heating). Fuel consump-tion in industrial processes. CO2 emissions in the sector not covered by allowances.
Target group Households and industry except mineralogical and metallurgic processes, chemical reduction and elec-trolysis as well as primary agriculture.
Description
Regional application Denmark (national)
List and description of energy saving actions substantiating the measure
• Increase of energy tax on fuels for space heat-ing by DKK 7/GJ
• Increase of energy tax on electricity by DKK 17/GJ and a reduction of energy savings charge on electricity by DKK 7.5/GJ
• New green energy tax on electricity (additional levy) of DKK 17/GJ for households and non-VAT registered businesses and the professions
• New green energy tax on electricity (additional levy) of DKK 9.25/GJ for other businesses
• New energy tax on fuels for processing of DKK 8.6/GJ
• Space heating tax on industrial consumption of electricity for air-conditioning
• Tax on lubricating oil
Budget and financial source Total tax proceeds of approx. DKK 7 billion annu-ally. Of this amount industry contributes with DKK 6 billion annually.
Implementing body Danish Ministry for Taxation
Information on imple-mentation
Monitoring authority Danish Ministry for Taxation
Method for monitor-ing/measuring the resulting savings
Savings achieved in 2010* Approx. 1 PJ per year
Energy savings*
Expected energy savings in 2016*
Approx. 4 PJ per year

- 17 -
Expected impact on energy savings in 2020 (if available)
Approx. 8 PJ per year
Assumptions* The calculation of savings is based on general price elasticity as regards the connection between prices and energy consumption.
Overlaps, multiplication ef-fect, synergy
This is a horizontal measure that supports sector-specific initiatives.
Measure 4 – A green transport policy As part of the Government’s long-term objective for independence from fossil fuels, the strategy Sustainable transport from 2008 includes a number of CO2 reduction measures in the form of in-creased public transport, a green car tax and better fuel technologies to ensure that the transport sector contributes towards the target. The strategy sets out the overall framework and principles for the development of a green transport policy and contains a number of specific initiatives in the transport area. It is a broad agreement whose primary content is an investment plan for roads, rail-ways, etc. Title of the energy saving measure A green transport policy
Index of the measure B1: Recommendations in connection with public procurement of passenger cars
B2: Certification scheme for ”green transport busi-ness” and ”green transport municipality”
B3: Optimisation of aerodynamics for lorries
B4: Energy efficiency labelling of delivery cars
B5: Energy-efficient driving techniques
B6: Furthering of environmentally beneficial and energy-efficient public transport
B7: Energy and environmental requirements for taxi cabs
Description
Category B1: 2.1/(2.7) Guidance and recommendations as re-gards procurement of energy-efficient cars – tar-geted at public buyers (for example local authorities and regions).
B2: 2.2/4.1 Voluntary labelling scheme for busi-nesses and local authorities
B3: 3.1/2.1. Campaigns and establishment of net-works regarding best practices and a grant scheme – financial scope DKK 42 million
B4: 2.2/2.1 Mandatory energy efficiency labelling of delivery cars. Spot checks at car dealers and cam-paigns. Financial scope: DKK 14 million
B5: 2.5/2.1 Voluntary courses for motorists and guidance campaigns. Financial scope: DKK 28 mil-lion
B6: 2.6/(3.1) Experiments with for example energy-

- 18 -
efficient busses or busses using alternative fuels.
B7: 1.2 Minimum requirements are made on taxi cabs’ energy efficiency labelling (energy label C)
Timeframe 2010-2020 B3: 2009-2012
Aim/brief description Establishment of the overall framework and princi-ples for the development of a green transport policy in the next few years and a number of specific initia-tives in the transport area. It is a broad agreement whose primary content is an investment plan for roads, railways, etc. Only special initiatives for fur-thering green transport have been included here. However, certain parts of the investment plan con-tains elements that help further more energy-efficient and environmentally beneficial forms of transport (modal shift).
Target end-use The transport sector
Target group Both publicly and privately operated freight and pas-senger transport. Includes both road and rail trans-port as well as both shared and individual transport
Regional application Denmark
Information on imple-mentation
List and description of energy saving actions substantiating the measure
B1: Recommendations have been prepared for the procurement of both passenger and delivery cars. Further, a number of informative meetings have been held with local authorities and regions as well as green procurement networks. Several local au-thorities have reported that they make active use of the recommendations. B2: A certification scheme has been prepared for transport businesses and transport municipalities. The individual organisation’s fuel consumption is assessed and a reduction target is then set. More-over, the activities to be set in motion to reach the target are described. Both private businesses and lo-cal authorities have entered into agreements. B3: Campaigns have been carried through and meetings have been held with relevant operators. However, only a moderate interest has been shown. Applications for subsidies amount to a total of DKK 0.3 million. Effects are therefore lower than ex-pected when the agreement was concluded. B4: The law has been amended so that energy effi-ciency labelling of new delivery cars is now manda-tory. Energy labels must appear in marketing mate-rial etc. Further, a campaign has been carried through to increase the knowledge of energy effi-ciency labelling of cars. Also, inspections are car-ried out at car dealers to ensure compliance with the law. B5: A training concept has been developed: Driving green (Kør grønt), which is offered nationwide by a number of certified instructors. The course is based on the fact that it is possible to consume up to 20 per cent less energy through energy-efficient driving. Only a few people (approx. 100) have taken the course. B6: Subsidies are given upon application to various

- 19 -
experimental projects, partly with vehicles using al-ternative fuels (such as electricity, biogas and hy-drogen) and partly experiments with energy efficien-cies in existing vehicles and fleets of vehicles (such as city logistics). B7: New taxi cabs for carrying up to 5 passengers are required to be in energy efficiency class C as a minimum. Based on a replacement of approx. 1/3 of the taxi cabs in the first year, the reduction in CO2 emission has been assessed to approx. 13,000 tons.
Budget and financial source Total pool of DKK 84 million.
Implementing body The Danish Ministry for Transport
Monitoring authority The Danish Ministry for Transport
Method for monitor-ing/measuring the resulting savings
Mainly assessed results as measurements are diffi-cult to make.
Savings achieved in 2010* It is not possible to measure results as soon as for 2010; partly changes are too moderate to isolate for a specific measure and partly it will take time before the measures are fully implemented.
Expected energy savings in 2016*
Approx. 2.5 PJ in total
Expected impact on energy savings in 2020 (if available)
Approx. 3.6 PJ in total
Assumptions*
Energy savings*
Overlaps, multiplication ef-fect, synergy
Other major measures: Oil-fired boiler scrap scheme The Danish budget for 2010 included DKK 400 million for subsidies for an oil-fired boiler scrap scheme to further more energy-efficient heating in permanent dwellings. The main purpose of the scheme is to ensure a reduction of CO2 emissions from houses through the scrapping of oil-boilers and their replacement with more efficient heating systems. The oil-boiler scrap scheme provides subsidies for the purchase and installation of eligible heating systems when existing boilers are scrapped. The scheme comprises all types of permanent dwell-ings.
To be eligible for subsidies, an oil-fired boiler must either be replaced by a heat pump (geothermal heat or air to water) or solar thermal heat combined with another heating system, or the house must be connected to district heating. In areas designated for district heating, the scheme only subsidizes district heating. The size of subsidy will depend on the heating system that is installed to replace the oil-fired boiler.
- 20 -
There are different subsidies for one-dwelling houses and multi-dwelling houses. In houses used partly for business purposes, only the part of the house floorage that is used for permanent resi-dence is eligible for subsidies. Subsidies to one-dwelling houses: The purchase and installation of:
• geothermal heat (liquid water heat pump) is subsidized with DKK 20,000. • air water heat pump is subsidized with DKK 15,000. • district heating unit is subsidized with DKK 10,000. • solar heat system is subsidized with 25 per cent of the investment costs for the system.
Multi-dwelling houses:
• Subsidies for multi-dwelling houses for the purchase and installation of a district heating unit or heat pump constitute either 25 per cent of the eligible purchase and installation costs or DKK 10,000 per permanent dwelling, whichever the lower.
• Subsidies for multi-dwelling houses for the purchase and installation of a solar heat system
constitute 25 per cent of the eligible purchase and installation costs. The scheme expires on 30 June and is expected to be sufficient for scrapping approx. 13,000 – 15,000 oil-fired boilers. Energy savings effects of the scrap scheme have not been evaluated separately in this action plan as a considerable overlap is expected between the savings effects of this initiative and the energy companies’ savings obligations. Energy Saving Trust The Danish Energy Saving Trust (Center for Energibesparelser) is an independent public organisa-tion with its own board. It was established on 1 March 201013 as a replacement for the Danish Electricity Saving Trust (Elsparefonden). The trust’s purpose is to further cost-effective energy savings in businesses, households and the public sector. Among other things, this is undertaken by supporting other operators’ activities – especially those of the energy companies. The trust is financed by the energy savings charge, which amounts to approx. DKK 90 million a year. In addition to the energy savings charge, the trust manages resources provided in the budget for campaigns to further energy savings in buildings and the Knowledge Centre for Energy Savings in Buildings (Videncenter for Energibesparelser i Bygninger) of DKK 20 million a year until 2011 (incl.), of which DKK 10 million a year is for the Knowledge Centre. After 2011, DKK 5-10 mil-lion is provided annually.
13 https://www.retsinformation.dk/Forms/R0710.aspx?id=129379
- 21 -
3.3 Achieved savings The national objectives for savings in the end-consumption of energy under the ESD are described in section 1.3 and in table 3 above. This section presents the results of the energy savings programme, partly assessed using the na-tional bottom-up method (BU), party using the top-down method recommended by the Commis-sion (TD). The national BU method is used exclusively to assess the effect of the network and dis-tribution companies’ energy savings contribution (measure 1 in section 3.2), which comprises ac-tivities in all sectors except the transport sector. TD is used for making an assessment per sector of the effect of the total energy savings contribution, but savings in industry’s energy consumption is not assessed using the TD method. As savings assessed with the national BU method and those assessed with the TD method overlap, it is not possible to add up the two values to obtain an overall value for the energy savings achieved. It appears from Annex 1 that approx. 25 per cent of the savings assessed using the BU method for 2010 was realised in industry; these savings are not reflected in the TD assessment. For details on assessments, please refer to section 3.4.
- 22 -
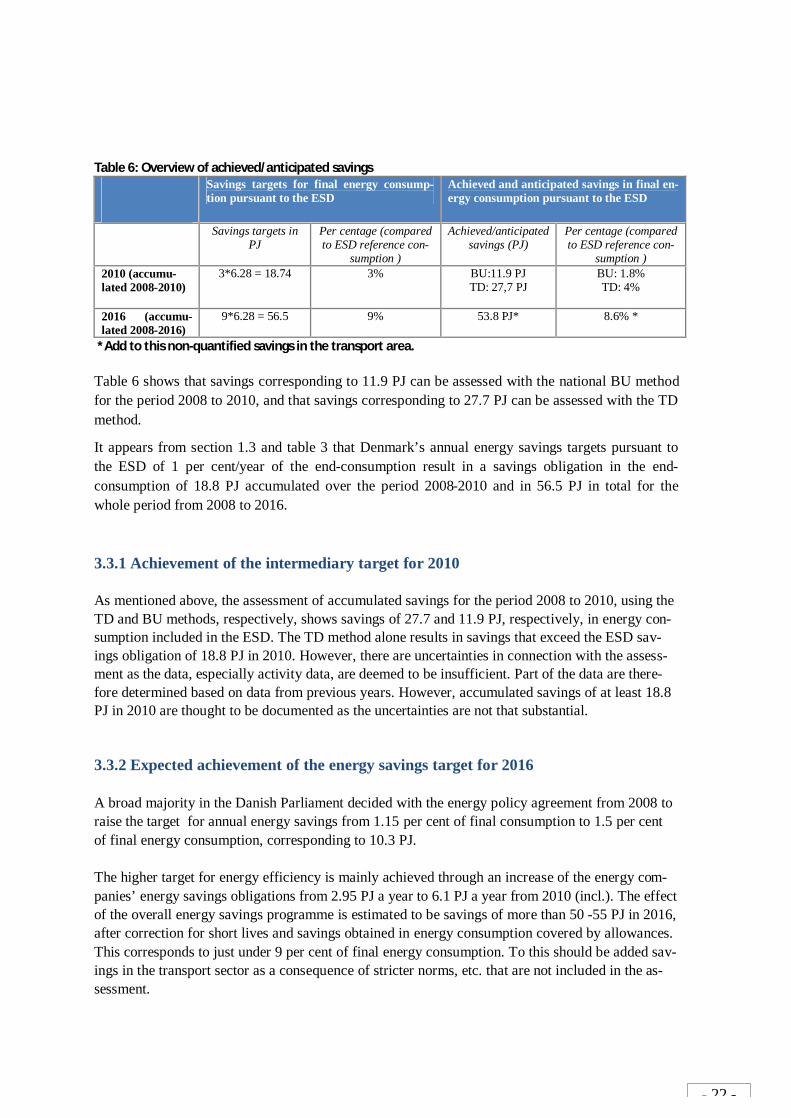
Table 6: Overview of achieved/anticipated savings
Savings targets for final energy consump-tion pursuant to the ESD
Achieved and anticipated savings in final en-ergy consumption pursuant to the ESD
Savings targets in PJ
Per centage (compared to ESD reference con-
sumption )
Achieved/anticipated savings (PJ)
Per centage (compared to ESD reference con-
sumption ) 2010 (accumu-lated 2008-2010)
3*6.28 = 18.74
3% BU:11.9 PJ TD: 27,7 PJ
BU: 1.8% TD: 4%
2016 (accumu-lated 2008-2016)
9*6.28 = 56.5 9% 53.8 PJ* 8.6% *
*Add to this non-quantified savings in the transport area. Table 6 shows that savings corresponding to 11.9 PJ can be assessed with the national BU method for the period 2008 to 2010, and that savings corresponding to 27.7 PJ can be assessed with the TD method.
It appears from section 1.3 and table 3 that Denmark’s annual energy savings targets pursuant to the ESD of 1 per cent/year of the end-consumption result in a savings obligation in the end-consumption of 18.8 PJ accumulated over the period 2008-2010 and in 56.5 PJ in total for the whole period from 2008 to 2016. 3.3.1 Achievement of the intermediary target for 2010 As mentioned above, the assessment of accumulated savings for the period 2008 to 2010, using the TD and BU methods, respectively, shows savings of 27.7 and 11.9 PJ, respectively, in energy con-sumption included in the ESD. The TD method alone results in savings that exceed the ESD sav-ings obligation of 18.8 PJ in 2010. However, there are uncertainties in connection with the assess-ment as the data, especially activity data, are deemed to be insufficient. Part of the data are there-fore determined based on data from previous years. However, accumulated savings of at least 18.8 PJ in 2010 are thought to be documented as the uncertainties are not that substantial. 3.3.2 Expected achievement of the energy savings target for 2016 A broad majority in the Danish Parliament decided with the energy policy agreement from 2008 to raise the target for annual energy savings from 1.15 per cent of final consumption to 1.5 per cent of final energy consumption, corresponding to 10.3 PJ. The higher target for energy efficiency is mainly achieved through an increase of the energy com-panies’ energy savings obligations from 2.95 PJ a year to 6.1 PJ a year from 2010 (incl.). The effect of the overall energy savings programme is estimated to be savings of more than 50 -55 PJ in 2016, after correction for short lives and savings obtained in energy consumption covered by allowances. This corresponds to just under 9 per cent of final energy consumption. To this should be added sav-ings in the transport sector as a consequence of stricter norms, etc. that are not included in the as-sessment.

- 23 -
Table 6 states anticipated savings as regards the fulfilment of the target in the ESD for 2016 to be 53.8 PJ. This result has been obtained through a business-as-usual (BAU) projection of the effects of existing measures without effects of any future measures. For example, the expected effects of the government’s Energy Strategy 2050 and a possible future energy policy agreement for the time after 2011 are not included. Energy Strategy 2050 prepares the ground for a considerable increase of the savings target for the network and distribution companies’ energy saving activities by 50 per cent from 2013. The effect of this measure has not been incorporated in the BAU projection for 2016. The evaluation is therefore, considering the anticipated savings in the transport sector, that the energy savings target for 2016 pursuant to the ESD will be met. 3.4 Description of assessment methods used for evaluating Denmark’s saving meas-ures in the period 2008 to 2010 This section explains the main principles of the national BU method and the TD method recom-mended by the Commission. 3.4.1 National bottom-up method The effect of the energy companies’ energy savings activities in the period 2008 to 2010 is assessed based on a national BU method. As mentioned earlier, the major part of the savings in end-consumption of energy is realised via the energy network and distribution companies’ obligations to realise verifiable savings in end-consumption of energy, excluding transport, that is, in busi-nesses, households and the public sector. Individual companies report the number of savings they have contributed to realising to their indus-try organisations. Once a year (twice a year for the period 2006-2009), the industry organisations submit overviews of their members’ total contributions to the Danish Energy Agency. The compa-nies involved are under an obligation to make an annual audit of whether the reported savings are the actual savings. Every second year, this audit must be an external audit. The Danish Energy Agency also makes annual spot checks of whether the reported savings comply with the require-ments laid down in the agreement on the energy companies’ energy savings contributions from 2009, including that the savings are actual, verifiable savings. In the reports, savings are categorised according to assessment method/activity type. There are three categories: (1) specific assessment (used mainly for large industrial energy efficiency pro-jects), (2) assessment by means of default values established in advance (typically used where sev-eral minor and individual initiatives have been realised) and (3) as the category market impact. Fur-thermore, savings are categorised according to the sectors in which they have been realised, that is, households, businesses or the public sector. Finally, savings are categorised according to energy type, that is, oil, gas, electricity, district heating and renewable energy. These categories are used for determining lives and whether the savings have been made in allowance-covered energy. Annex 1 contains the savings reported for the years 2008-2010 specified according to the above catego-ries. Adjustment of the energy companies’ realised savings to make them consistent with savings allowed to be included in the NEEAP evaluation In the assessment of energy companies’ energy savings activities, the reported savings have been adjusted pursuant to the requirements for savings to be included in the fulfilment of Member States’ targets under the ESD, cf. below.
- 24 -
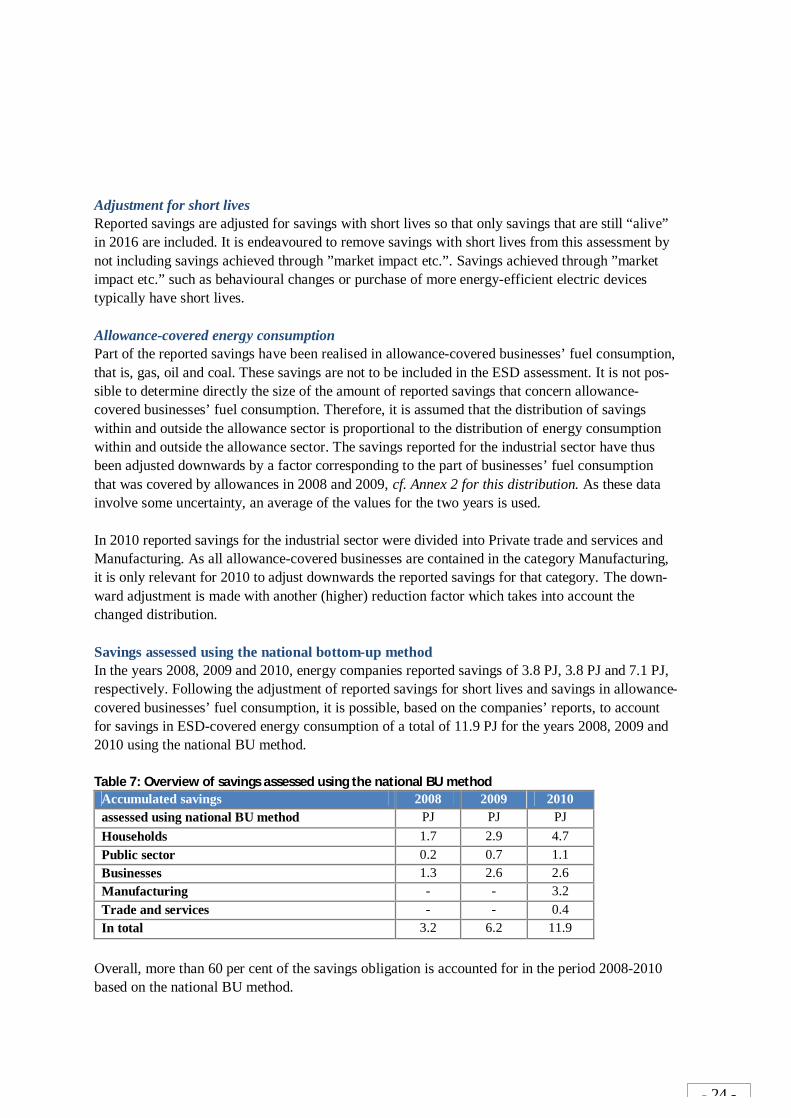
Adjustment for short lives Reported savings are adjusted for savings with short lives so that only savings that are still “alive” in 2016 are included. It is endeavoured to remove savings with short lives from this assessment by not including savings achieved through ”market impact etc.”. Savings achieved through ”market impact etc.” such as behavioural changes or purchase of more energy-efficient electric devices typically have short lives. Allowance-covered energy consumption Part of the reported savings have been realised in allowance-covered businesses’ fuel consumption, that is, gas, oil and coal. These savings are not to be included in the ESD assessment. It is not pos-sible to determine directly the size of the amount of reported savings that concern allowance-covered businesses’ fuel consumption. Therefore, it is assumed that the distribution of savings within and outside the allowance sector is proportional to the distribution of energy consumption within and outside the allowance sector. The savings reported for the industrial sector have thus been adjusted downwards by a factor corresponding to the part of businesses’ fuel consumption that was covered by allowances in 2008 and 2009, cf. Annex 2 for this distribution. As these data involve some uncertainty, an average of the values for the two years is used. In 2010 reported savings for the industrial sector were divided into Private trade and services and Manufacturing. As all allowance-covered businesses are contained in the category Manufacturing, it is only relevant for 2010 to adjust downwards the reported savings for that category. The down-ward adjustment is made with another (higher) reduction factor which takes into account the changed distribution. Savings assessed using the national bottom-up method In the years 2008, 2009 and 2010, energy companies reported savings of 3.8 PJ, 3.8 PJ and 7.1 PJ, respectively. Following the adjustment of reported savings for short lives and savings in allowance-covered businesses’ fuel consumption, it is possible, based on the companies’ reports, to account for savings in ESD-covered energy consumption of a total of 11.9 PJ for the years 2008, 2009 and 2010 using the national BU method. Table 7: Overview of savings assessed using the national BU method
Accumulated savings 2008 2009 2010 assessed using national BU method PJ PJ PJ Households 1.7 2.9 4.7 Public sector 0.2 0.7 1.1 Businesses 1.3 2.6 2.6 Manufacturing - - 3.2 Trade and services - - 0.4 In total 3.2 6.2 11.9
Overall, more than 60 per cent of the savings obligation is accounted for in the period 2008-2010 based on the national BU method.

- 25 -
Energy companies’ energy savings activities are targeted at energy consumption in all sectors ex-cept the transport sector; that sector’s energy consumption constitutes approx. a third of final en-ergy consumption. So the analysed measure has a potential effect in approx. two thirds of the total final energy consumption. Thus, the requirement for an analysis, based on BU or a national method, of measures that are active in sectors constituting at least 20-30 per cent of energy con-sumption has been met. Double counting By using the national method and by assessing only the effect of the most important measure, en-ergy companies’ energy saving activities, it is ensured that no double counting takes place as a re-sult of overlaps between different measures. It is possible to assess the effect of the building regulations’ requirements for new buildings ac-cording to the method recommended by the Commission without any risk of double counting. However, the effect of this initiative is limited, in the order of 0.16 PJ a year from 2009 onwards, as new buildings constitute only a small part of the overall building stock. Therefore, this initiative has not been included. 3.4.2 Description of top-down method The TD method is used in accordance with the principles recommended by the Commission. The method is used for assessing savings in households, trade and services (including public services) and the transport sector. The assessment partly includes energy consumption data from Denmark’s national energy statistics for 2009 and partly energy consumption and activity data from the Odyssee database. The national statistics are updated and adjusted on a continuous basis, whereas the Odyssee database does not contain quality-assured figures for 2009 at the moment, just as data are not yet available for all types of consumption. Even though Odyssee offers an ESD module, it is found appropriate partly to base the assessment on national statistics for energy consumption in order to have as accurate data as possible. It should be noted that the data from the national statistics are climate-adjusted. Accumulated savings have been assessed partly using minimum indicators and partly using pre-ferred indicators. The selection of indicators for the individual sectors and/or subsectors has to a large extent been determined by the availability of the necessary data. In cases where no activity data are available for 2009 yet, or in a few cases 2008, savings have been assessed based on activ-ity data from previous years. This has typically been done only where there have been no great changes in activity data. No consumption or activity data have been prepared for 2010. So accumulated savings in 2010 have been determined as the sum of savings achieved in 2008 and 2009 and the average of savings in 2008 and 2009. This simple assumption has been chosen because it has been found that there is no basis for making a more qualified assessment of activity data and energy consumption for 2010. No savings have been assessed for industry as no activity data are available for 2009 or 2010. Moreover, it has been estimated that it would entail too much uncertainty to extrapolate industry’s activity levels for 2009 and 2010 based on historical data as the financial crisis is found to have
- 26 -
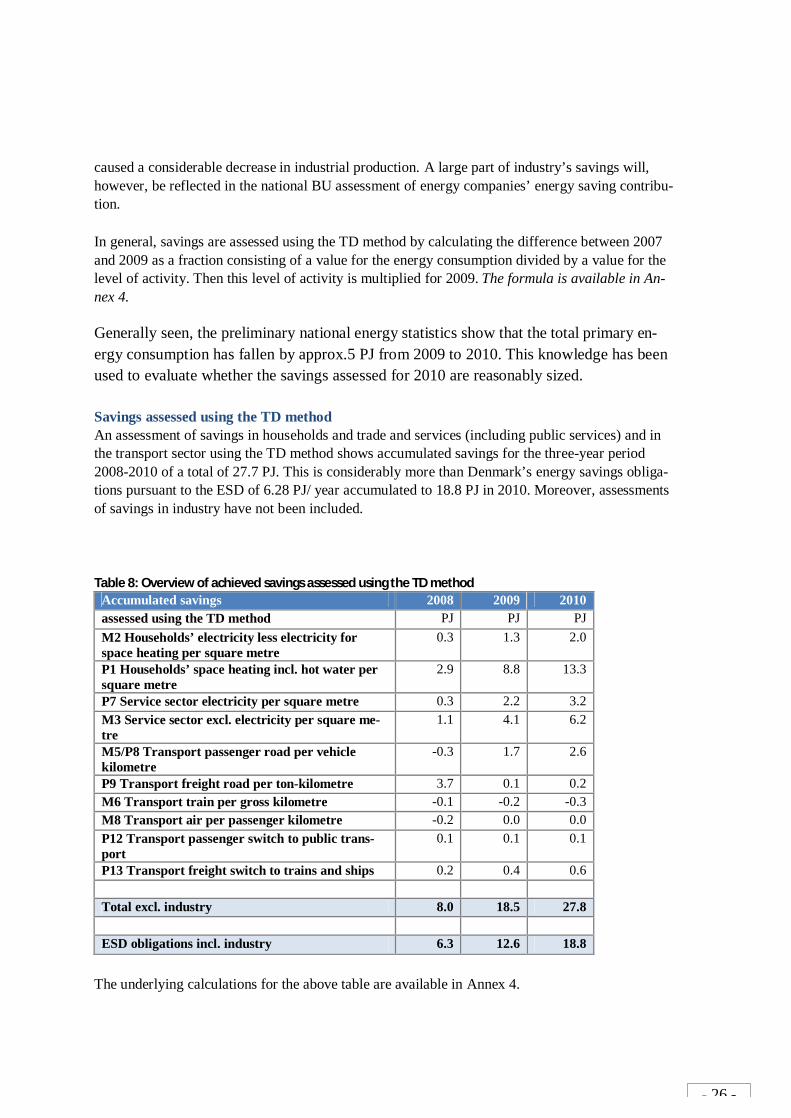
caused a considerable decrease in industrial production. A large part of industry’s savings will, however, be reflected in the national BU assessment of energy companies’ energy saving contribu-tion. In general, savings are assessed using the TD method by calculating the difference between 2007 and 2009 as a fraction consisting of a value for the energy consumption divided by a value for the level of activity. Then this level of activity is multiplied for 2009. The formula is available in An-nex 4. Generally seen, the preliminary national energy statistics show that the total primary en-ergy consumption has fallen by approx.5 PJ from 2009 to 2010. This knowledge has been used to evaluate whether the savings assessed for 2010 are reasonably sized. Savings assessed using the TD method An assessment of savings in households and trade and services (including public services) and in the transport sector using the TD method shows accumulated savings for the three-year period 2008-2010 of a total of 27.7 PJ. This is considerably more than Denmark’s energy savings obliga-tions pursuant to the ESD of 6.28 PJ/ year accumulated to 18.8 PJ in 2010. Moreover, assessments of savings in industry have not been included. Table 8: Overview of achieved savings assessed using the TD method
Accumulated savings 2008 2009 2010 assessed using the TD method PJ PJ PJ M2 Households’ electricity less electricity for space heating per square metre
0.3 1.3 2.0
P1 Households’ space heating incl. hot water per square metre
2.9 8.8 13.3
P7 Service sector electricity per square metre 0.3 2.2 3.2 M3 Service sector excl. electricity per square me-tre
1.1 4.1 6.2
M5/P8 Transport passenger road per vehicle kilometre
-0.3 1.7 2.6
P9 Transport freight road per ton-kilometre 3.7 0.1 0.2 M6 Transport train per gross kilometre -0.1 -0.2 -0.3 M8 Transport air per passenger kilometre -0.2 0.0 0.0 P12 Transport passenger switch to public trans-port
0.1 0.1 0.1
P13 Transport freight switch to trains and ships 0.2 0.4 0.6 Total excl. industry 8.0 18.5 27.8 ESD obligations incl. industry 6.3 12.6 18.8
The underlying calculations for the above table are available in Annex 4.
- 27 -
It should be noted that there are uncertainties in the assessment as the data basis, especially regard-ing activity data, is inadequate. Part of the data have therefore been extrapolated based on data from previous years or historical developments. And 2010 data have been assessed based on sav-ings from 2007 to 2009. However, uncertainties are estimated to be so insignificant that the cumu-lative savings target of at least 18.8 PJ in 2010 is found to have been met. As it can be seen, the major part of the savings has been achieved in households and trade and ser-vices (including public services).
PART 4 – Special areas
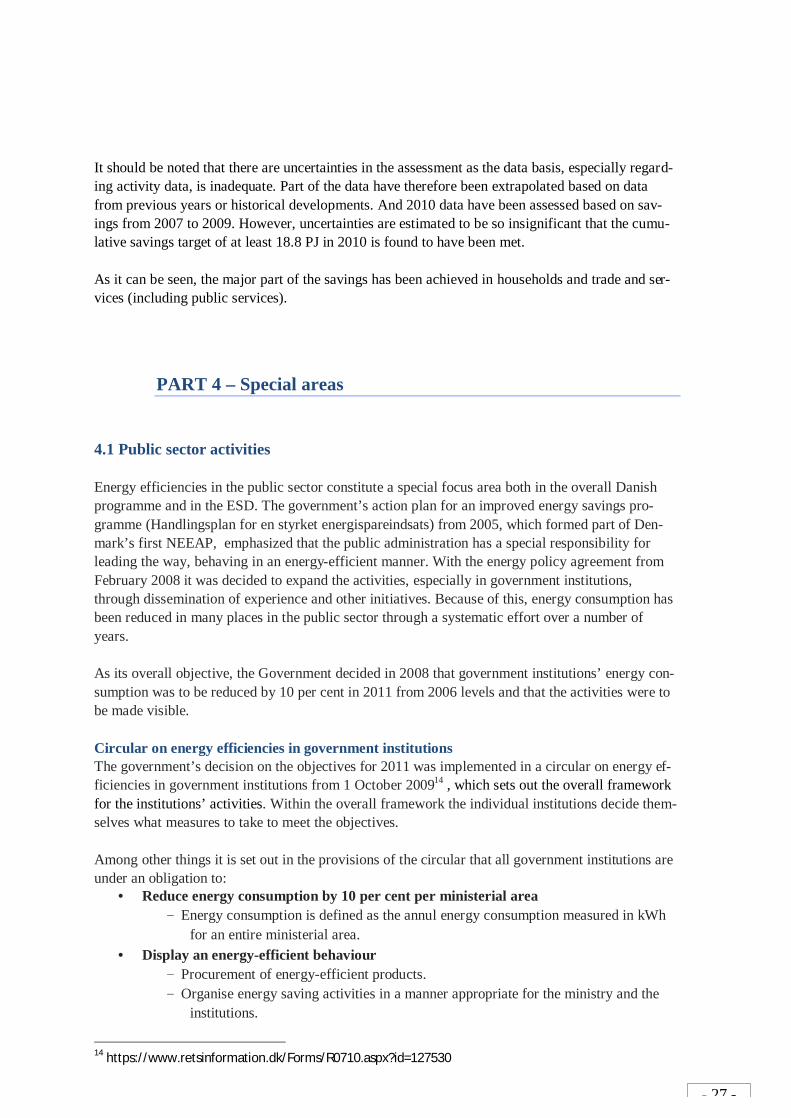
4.1 Public sector activities Energy efficiencies in the public sector constitute a special focus area both in the overall Danish programme and in the ESD. The government’s action plan for an improved energy savings pro-gramme (Handlingsplan for en styrket energispareindsats) from 2005, which formed part of Den-mark’s first NEEAP, emphasized that the public administration has a special responsibility for leading the way, behaving in an energy-efficient manner. With the energy policy agreement from February 2008 it was decided to expand the activities, especially in government institutions, through dissemination of experience and other initiatives. Because of this, energy consumption has been reduced in many places in the public sector through a systematic effort over a number of years. As its overall objective, the Government decided in 2008 that government institutions’ energy con-sumption was to be reduced by 10 per cent in 2011 from 2006 levels and that the activities were to be made visible. Circular on energy efficiencies in government institutions The government’s decision on the objectives for 2011 was implemented in a circular on energy ef-ficiencies in government institutions from 1 October 200914 , which sets out the overall framework for the institutions’ activities. Within the overall framework the individual institutions decide them-selves what measures to take to meet the objectives. Among other things it is set out in the provisions of the circular that all government institutions are under an obligation to:
• Reduce energy consumption by 10 per cent per ministerial area - Energy consumption is defined as the annul energy consumption measured in kWh
for an entire ministerial area. • Display an energy-efficient behaviour
- Procurement of energy-efficient products. - Organise energy saving activities in a manner appropriate for the ministry and the
institutions.
14 https://www.retsinformation.dk/Forms/R0710.aspx?id=127530

- 28 -
• Report energy consumption
- Institutions must install remote reading meters for electricity, heat and water. - Consumption must be reported through remote reading meters or manually at least
once a year to a new database for the energy consumption of government institu-tions.
• Ensure energy-efficient buildings - Ensure that state-owned buildings are constructed and operated as efficiently as pos-
sible in terms of energy consumption. - Ensure that buildings have energy efficiency labels. - Implement cost-effective energy efficiencies. - Ensure that buildings, for which leasing arrangements have been made with private
individuals, have a high level of energy performance. - Initiate cooperation on energy efficiencies with private owners or tenants where a
building is shared by several owners or leases. • Make energy and water consumption public and visible
- On their websites, Government institutions must publish the initiatives they imple-ment to meet the 10 per cent target reduction of their energy consumption.
- Energy efficiency labelling of buildings and guidance reports from electricity net-work, natural gas and district heating companies must be published on the institu-tions’ websites.
- Once a year, the Danish Energy Agency will assess and publish the government in-stitutions’ energy consumption and present it to the energy committee of the Dan-ish Parliament.
Dissemination of experience To ensure that activities are made visible and that results are disseminated, the actual initiatives taken to achieve the target must be published on the websites of the individual ministries15. Anyone may copy the initiatives free of charge – including non-governmental institutions and businesses that wish to get inspiration for reducing their energy consumption. Monitoring To make it possible to follow the development in the overall energy consumption of government institutions and the consumption of the individual ministries, a new database had been developed to which all government institutions must report their energy and water consumption. Energy savings at regional and local level Based on the political agreement about future energy saving initiatives from 10 June 2005, volun-tary energy efficiency agreements have been made with the Danish Association of Local Authori-ties and with Danish Regions.
15 A list of the individual websites can be found here: Energistyrelsen (the Danish Energy Agency): Energibe-sparelser i staten (Public sector energy savings)

- 29 -
Local activities According to the agreement with the Association of Local Authorities, local authorities must im-plement energy-efficient behaviour and procurement and have special focus on energy-efficient buildings. An energy-efficient behaviour is to be ensured through the local authorities’ systematic implementation of energy management and organisation of internal decision-making processes in a manner encouraging individual financially responsible institutions to further energy savings. The focus on energy-efficient buildings must result in the following:
• Energy savings projects recommended in energy efficiency labelling with pay-back periods of up to five years must be implemented within a period of five years.
• The operation and maintenance of local government buildings must take place in an en-ergy-efficient manner.
• New technical plants and installations with a considerable energy consumption must be made as energy-efficient as possible and be provided with energy meters.
• In connection with leases (new or extended) of buildings, local authorities must ensure that implementation of energy savings projects and energy-efficient operation and maintenance are included as part of the contract.
Regional activities According to the agreement with Danish Regions, they must, just like the local authorities, imple-ment energy-efficient behaviour and procurement and ensure energy-efficient buildings. The re-gions have special focus on the hospital sector where large investments will be made during the next decade in new buildings and expansions in connection with the new hospital structure. The parties agree that ambitious targets must be set in order for both buildings and investments to be as energy-efficient as possible and that this consideration must be included as early as possible in the planning process. Also, according to both agreements, the contracting parties must discuss once a year the progress in the energy savings programme, and in 2012 they will make an evaluation of the results of the en-ergy savings programme in municipalities and regions, respectively. On the basis of the evalua-tions, the parties must discuss a continuation of the agreements before the end of 2012. Implementation of Article 5(1) (use of at least two measures from Annex VI) Based on the description of energy saving activities in the public sector, the requirement for use of at least two measures from Annex VI of the Directive has been met. With the government’s decision to establish the energy reduction target for 2011 and the specific implementation in a circular on energy efficiencies in government institutions from 1 October 200916 as well as the voluntary agreements on energy saving activities with local authorities and regions, the following measures have been used:
c) requirements to purchase equipment that has efficient energy consumption in all modes, including in standby mode, using, where applicable, minimised life-cycle cost analysis or comparable methods to ensure cost-effectiveness.
16 https://www.retsinformation.dk/Forms/R0710.aspx?id=127530

- 30 -
e) requirements to use energy audits and implement the resulting cost-effective recommen-dations.
f) requirements to purchase or rent energy-efficient buildings or parts thereof, or require-ments to replace or retrofit purchased or rented buildings or parts thereof in order to render them more energy-efficient.
4.2 Guidance and information on energy efficiency and savings Pursuant to Article 7 of the ESD measures must be taken to ensure that information on relevant en-ergy efficiency mechanisms are disseminated and that end users of energy are informed and ad-vised on efficient use of energy. Information on the various initiatives to further energy savings is available on the Danish Energy Agency’s website. Generally, there are two essential measures whose purpose is to ensure dissemi-nation of information and advice on energy savings to end-users of energy. Energy companies’ obligations The first measure comes under the energy companies’ obligations. In addition to contributing to the actual realisation of the energy savings targets, the electricity network, natural gas and district heat-ing companies must fulfil the obligations following from the supply regulations regarding informa-tion to consumers. Pursuant to the supply regulations, energy companies are under an obligation to ensure that all consumers within their supply area are informed of the possibilities of energy sav-ings and that the individual end-user is given information once a year on his or her energy con-sumption. This information must include the past year’s consumption, a comparison of the con-sumption in the three previous years (historical information) and a comparison of the customer’s consumption with that of a corresponding consumer category (grading on a relative scale). Moreover, the energy companies must establish the total consumption in the supply area and pub-lish data from the process or make these data available on demand. Energy Saving Trust In addition to the energy companies’ obligations, the establishment of the Energy Saving Trust (Center for Energibesparelser) focuses on furthering efficient use of energy in households, the pub-lic sector and in businesses. The purpose of the Energy Saving Trust, which is described under other measures in section 3.2, is to further cost-effective energy savings in businesses, households and the public sector, through campaign activities and other initiatives.

- 31 -
PART 5 – Responsible authority
Table 9: Overview of responsible authority
Task Body: Overseeing ESD target The Danish Energy Agency
Public sector integration control (ESD) The Danish Energy Agency

- 32 -
ANNEXES
Annex 1: Energy savings reported by network and distribution companies Realised energy savings 2008 - diagram 1
TJ District heating Natural gas Oil Electricity Other In total Households Specific assessment 320 34 26 82 5 466 Default values 223 329 411 243 5 1,210 Market impact etc. Public sector Specific assessment 86 60 12 44 0 202 Default values 17 5 1 2 - 24 Market impact etc. Businesses Specific assessment 240 420 115 394 11 1,180 Default values 48 8 10 25 0 91 Market impact etc. In total 933 856 575 789 20 3,173
Table 1: Savings for 2008 adjusted for lives and savings achieved in allowance-covered energy consump-tion; the yellow fields show where data have been adjusted as regards allowance-covered energy con-sumption.
Realised energy savings 2009 - diagram 1
TJ District heating Natural gas Oil Electricity Other In total Households Specific assessment 89 22 37 32 12 191 Default values 306 273 271 189 18 1,058 Market impact etc. Public sector Specific assessment 304 42 13 38 2 399 Default values 25 2 2 2 - 31 Market impact etc. Businesses Specific assessment 325 274 119 554 7 1,280 Default values 62 4 3 4 0 72 Market impact etc. In total 1,110 617 445 819 40 3,031

- 33 -
Table 2 Savings for 2009 adjusted for lives and savings achieved in allowance-covered energy consump-tion; the yellow fields show where data have been adjusted as regards allowance-covered energy con-sumption.
Realised savings 2010 - diagram 1 distributed on sectors and types of energy
TJ District heating Natural gas Oil Electricity Coal etc. Biomass Other Total
Households
Specific assessment 149 23 28 92 0 2 21 315
Default values 471 356 375 196 7 4 4 1413
Market impact
Public sector
Specific assessment 208 97 11 96 0 2 7 420
Default values 17 2 1 3 0 0 0 23
Market impact
Manufacturing
Specific assessment 208 629 200 531 16 159 152 3097
Default values 25 6 9 13 0 0 0 67
Market impact
Trade and services
Specific assessment 163 30 7 148 0 0 21 370
Default values 19 1 2 1 0 0 0 23
Market impact
Grid optimisation
Collective solar plants
Conversions, cf. diagram 4
In total 1,259 1,144 633 1,079 23 168 206 5728
Table 3: Savings for 2009 adjusted for lives and savings achieved in allowance-covered energy consump-tion; the yellow fields show where data have been adjusted as regards allowance-covered energy con-sumption.
Realised energy savings 2008 - diagram 1
TJ District heating
Natural gas Oil Electricity Other In total
Households 569 366 437 492 9 1872 Specific assessment 320 34 26 82 5 466 Default values 223 329 411 243 5 1210 Market impact etc. 26 2 0 168 0 196 Public sector 105 77 13 48 0 244 Specific assessment 86 60 12 44 0 202 Default values 17 5 1 2 0 24 Market impact etc. 2 13 0 2 0 17 Businesses 289 665 233 427 82 1696

- 34 -
Specific assessment 240 649 214 394 77 1574 Default values 48 13 19 25 0 104 Market impact etc. 2 3 1 8 5 18 In total 963 1108 683 967 91 3812
Table 4: Savings realised in 2008 and not adjusted for lives and savings achieved in allowance-covered energy consumption.
Realised energy savings 2009 - diagram 1
TJ District heat-
ing Natural
gas Oil Electricity Other In total Households 432 306 312 467 114 1631 Specific assessment 89 22 37 32 12 191 Default values 306 273 271 189 18 1058 Market impact etc. 38 11 4 246 84 383 Public sector 332 58 15 47 2 454 Specific assessment 304 42 13 38 2 399 Default values 25 2 2 2 0 31 Market impact etc. 4 13 0 7 0 24 Businesses 394 435 230 561 55 1675 Specific assessment 325 423 221 554 54 1578 Default values 62 6 5 4 0 77 Market impact etc. 7 6 4 3 1 20 In total 1159 799 557 1074 171 3760
Table 5: Savings realised in 2009 and not adjusted for lives and savings achieved in allowance-covered energy consumption.
Realised savings 2010 - diagram 1 distributed on sectors and types of energy
TJ District heating
Natural gas Oil Electricity
Coal etc. Biomass Other Total
Households
Specific assessment 149 23 28 92 0 2 21 315 Default values 471 356 375 196 7 4 4 1413 Market impact 26 3 2 85 0 0 1 118 Public sector Specific assessment 208 97 11 96 0 2 7 420 Default values 17 2 1 3 0 0 0 23 Market impact 4 3 0 1 0 0 0 7 Manufacturing Specific assessment 625 1111 403 531 115 159 152 3097 Default values 25 11 19 13 0 0 0 67 Market impact 4 0 0 0 0 0 2 6 Trade and services Specific assessment 163 30 7 148 0 0 21 370 Default values 19 1 2 1 0 0 0 23 Market impact 2 0 0 0 0 0 0 2

- 35 -
Grid optimisation 318 2 1 23 0 0 0 345 Collective solar plants 98 3 3 1 0 0 1 106 Conversions, cf. diagram 4 71 53 528 126 0 1 10 789 In total 2200 1693 1380 1314 123 169 220 7100
Figure 6: Savings realised in 2010 and not adjusted for lives and savings achieved in allowance-covered energy consumption.
- 36 -
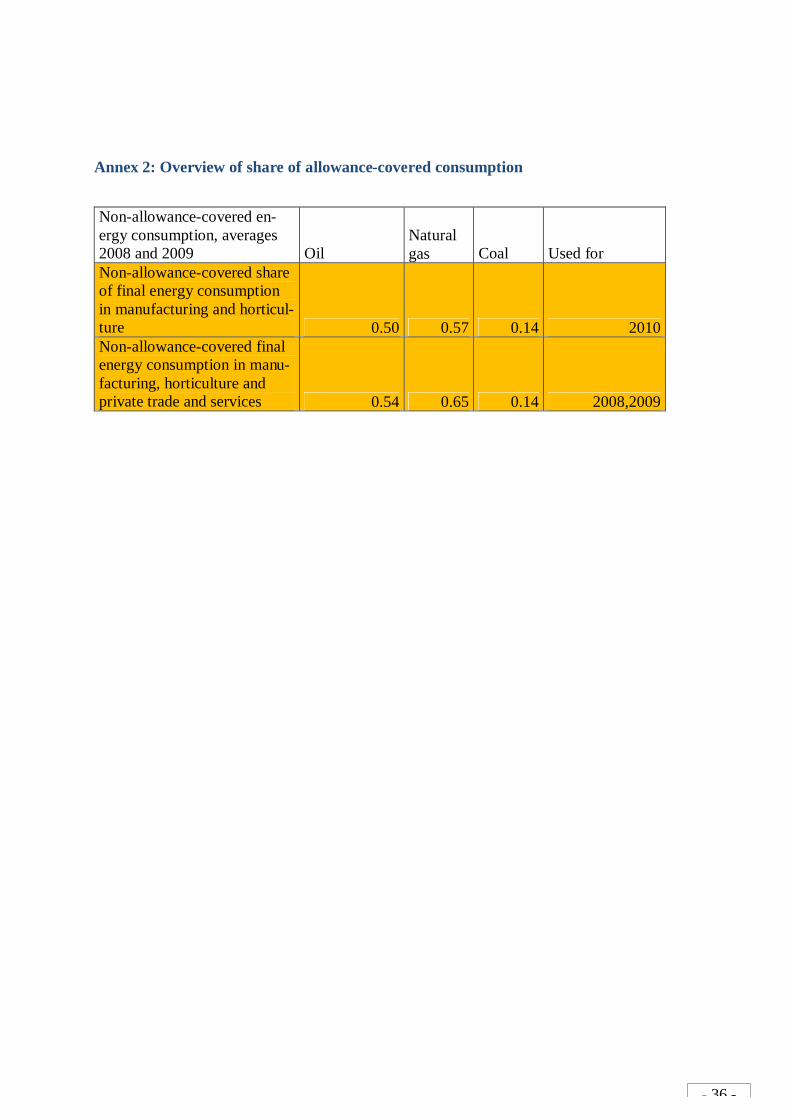
Annex 2: Overview of share of allowance-covered consumption
Non-allowance-covered en-ergy consumption, averages 2008 and 2009 Oil
Natural gas Coal Used for
Non-allowance-covered share of final energy consumption in manufacturing and horticul-ture 0.50 0.57 0.14 2010 Non-allowance-covered final energy consumption in manu-facturing, horticulture and private trade and services 0.54 0.65 0.14 2008,2009
- 37 -
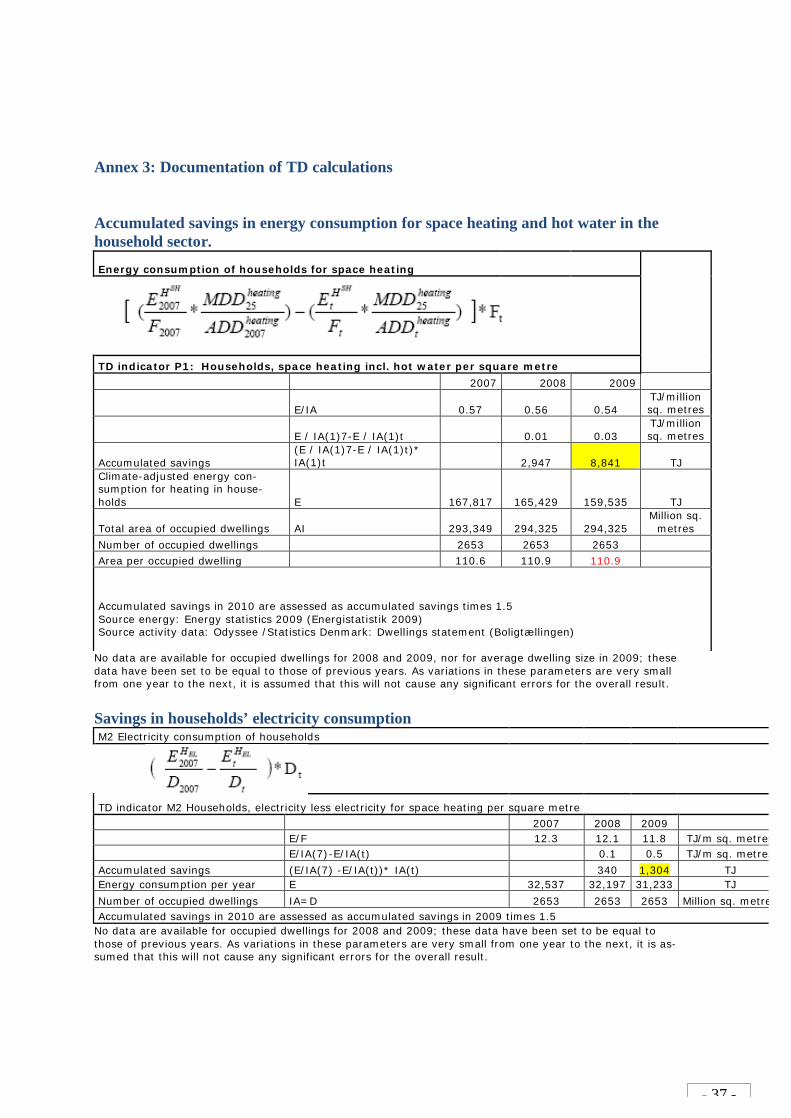
Annex 3: Documentation of TD calculations Accumulated savings in energy consumption for space heating and hot water in the household sector. Energy consumption of households for space heating
TD indicator P1: Households, space heating incl. hot water per square metre 2007 2008 2009
E/IA 0.57 0.56 0.54 TJ/million sq. metres
E / IA(1)7-E / IA(1)t 0.01 0.03 TJ/million sq. metres
Accumulated savings (E / IA(1)7-E / IA(1)t)* IA(1)t 2,947 8,841 TJ
Climate-adjusted energy con-sumption for heating in house-holds E 167,817 165,429 159,535 TJ
Total area of occupied dwellings AI 293,349 294,325 294,325 Million sq.
metres Number of occupied dwellings 2653 2653 2653 Area per occupied dwelling 110.6 110.9 110.9
Accumulated savings in 2010 are assessed as accumulated savings times 1.5 Source energy: Energy statistics 2009 (Energistatistik 2009) Source activity data: Odyssee /Statistics Denmark: Dwellings statement (Boligtællingen)
No data are available for occupied dwellings for 2008 and 2009, nor for average dwelling size in 2009; these data have been set to be equal to those of previous years. As variations in these parameters are very small from one year to the next, it is assumed that this will not cause any significant errors for the overall result.
Savings in households’ electricity consumption M2 Electricity consumption of households
TD indicator M2 Households, electricity less electricity for space heating per square metre 2007 2008 2009 E/F 12.3 12.1 11.8 TJ/m sq. metres E/IA(7)-E/IA(t) 0.1 0.5 TJ/m sq. metresAccumulated savings (E/IA(7) -E/IA(t))* IA(t) 340 1,304 TJ Energy consumption per year E 32,537 32,197 31,233 TJ Number of occupied dwellings IA=D 2653 2653 2653 Million sq. metresAccumulated savings in 2010 are assessed as accumulated savings in 2009 times 1.5
No data are available for occupied dwellings for 2008 and 2009; these data have been set to be equal to those of previous years. As variations in these parameters are very small from one year to the next, it is as-sumed that this will not cause any significant errors for the overall result.
- 38 -
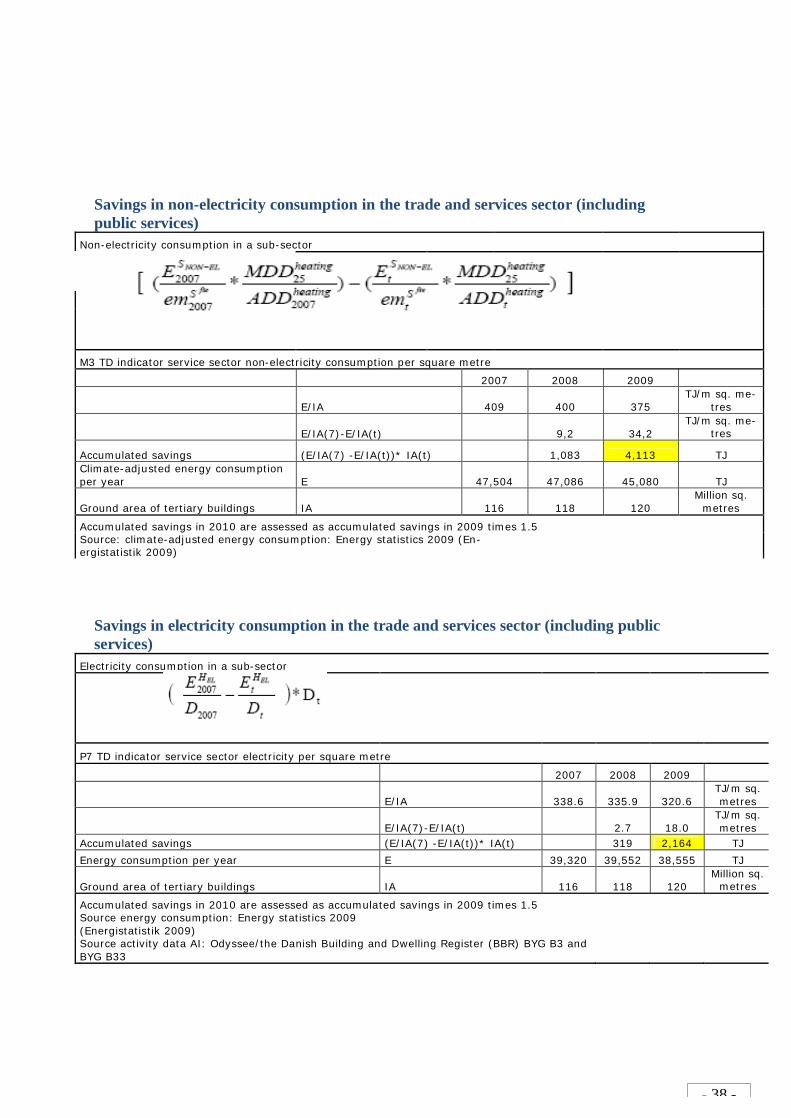
Savings in non-electricity consumption in the trade and services sector (including public services)
Non-electricity consumption in a sub-sector
M3 TD indicator service sector non-electricity consumption per square metre
2007 2008 2009
E/IA 409 400 375 TJ/m sq. me-
tres
E/IA(7)-E/IA(t) 9,2 34,2 TJ/m sq. me-
tres
Accumulated savings (E/IA(7) -E/IA(t))* IA(t) 1,083 4,113 TJ Climate-adjusted energy consumption per year E 47,504 47,086 45,080 TJ
Ground area of tertiary buildings IA 116 118 120 Million sq.
metres
Accumulated savings in 2010 are assessed as accumulated savings in 2009 times 1.5 Source: climate-adjusted energy consumption: Energy statistics 2009 (En-ergistatistik 2009)
Savings in electricity consumption in the trade and services sector (including public services)
Electricity consumption in a sub-sector
P7 TD indicator service sector electricity per square metre
2007 2008 2009
E/IA 338.6 335.9 320.6 TJ/m sq. metres
E/IA(7)-E/IA(t) 2.7 18.0 TJ/m sq. metres
Accumulated savings (E/IA(7) -E/IA(t))* IA(t) 319 2,164 TJ Energy consumption per year E 39,320 39,552 38,555 TJ
Ground area of tertiary buildings IA 116 118 120 Million sq.
metres
Accumulated savings in 2010 are assessed as accumulated savings in 2009 times 1.5 Source energy consumption: Energy statistics 2009 (Energistatistik 2009) Source activity data AI: Odyssee/the Danish Building and Dwelling Register (BBR) BYG B3 and BYG B33
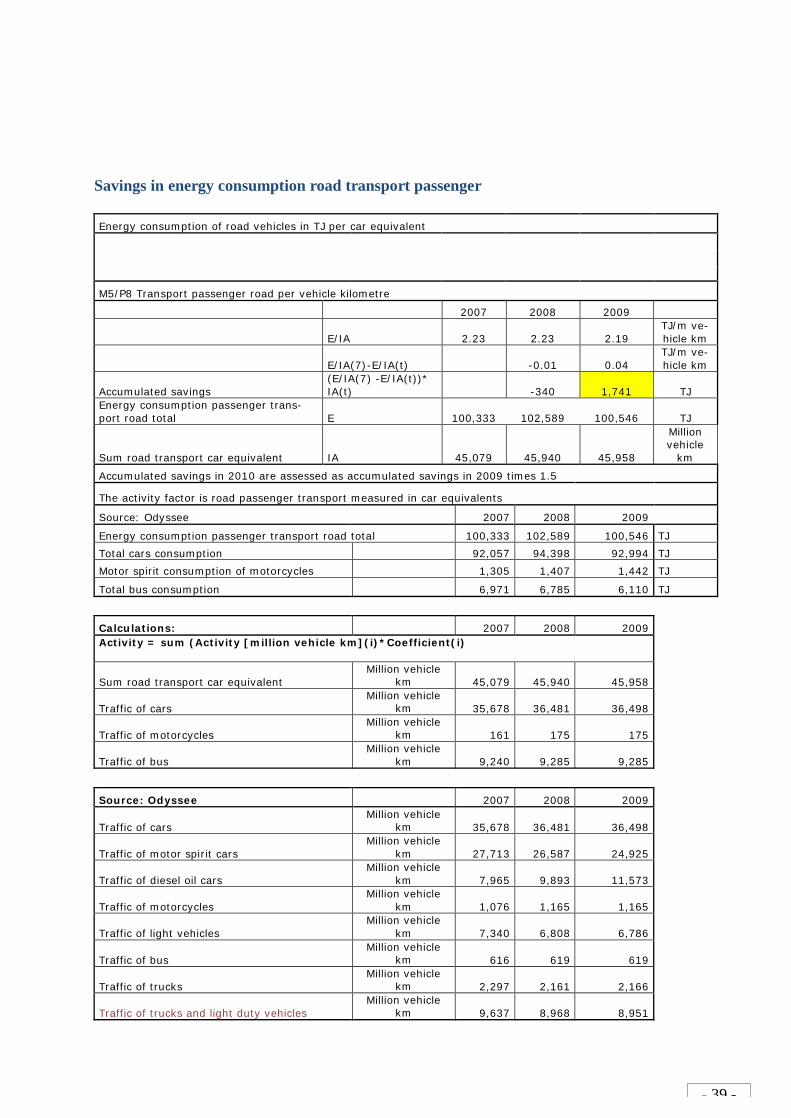
- 39 -
Savings in energy consumption road transport passenger Energy consumption of road vehicles in TJ per car equivalent
M5/P8 Transport passenger road per vehicle kilometre
2007 2008 2009
E/IA 2.23 2.23 2.19 TJ/m ve-hicle km
E/IA(7)-E/IA(t) -0.01 0.04 TJ/m ve-hicle km
Accumulated savings (E/IA(7) -E/IA(t))* IA(t) -340 1,741 TJ
Energy consumption passenger trans-port road total E 100,333 102,589 100,546 TJ
Sum road transport car equivalent IA 45,079 45,940 45,958
Million vehicle
km
Accumulated savings in 2010 are assessed as accumulated savings in 2009 times 1.5
The activity factor is road passenger transport measured in car equivalents
Source: Odyssee 2007 2008 2009
Energy consumption passenger transport road total 100,333 102,589 100,546 TJ
Total cars consumption 92,057 94,398 92,994 TJ
Motor spirit consumption of motorcycles 1,305 1,407 1,442 TJ
Total bus consumption 6,971 6,785 6,110 TJ
Calculations: 2007 2008 2009 Activity = sum (Activity [million vehicle km](i)*Coefficient(i)
Sum road transport car equivalent Million vehicle
km 45,079 45,940 45,958
Traffic of cars Million vehicle
km 35,678 36,481 36,498
Traffic of motorcycles Million vehicle
km 161 175 175
Traffic of bus Million vehicle
km 9,240 9,285 9,285
Source: Odyssee 2007 2008 2009
Traffic of cars Million vehicle
km 35,678 36,481 36,498
Traffic of motor spirit cars Million vehicle
km 27,713 26,587 24,925
Traffic of diesel oil cars Million vehicle
km 7,965 9,893 11,573
Traffic of motorcycles Million vehicle
km 1,076 1,165 1,165
Traffic of light vehicles Million vehicle
km 7,340 6,808 6,786
Traffic of bus Million vehicle
km 616 619 619
Traffic of trucks Million vehicle
km 2,297 2,161 2,166
Traffic of trucks and light duty vehicles Million vehicle
km 9,637 8,968 8,951
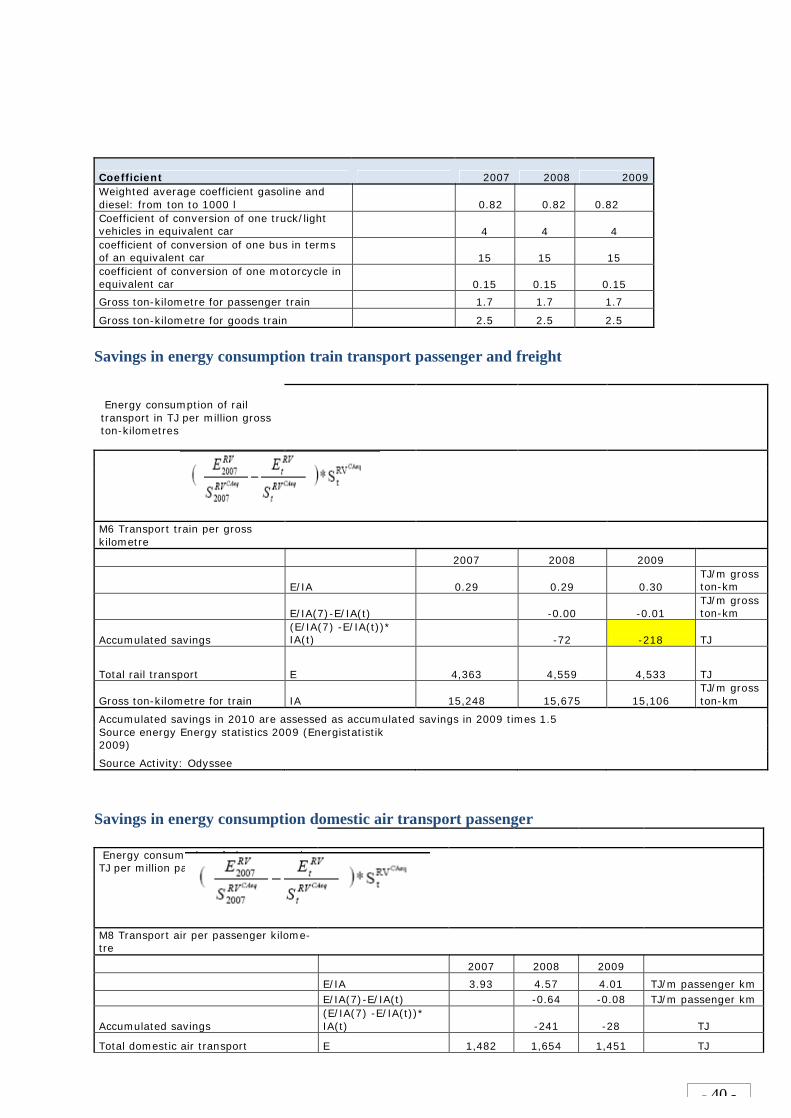
- 40 -
Coefficient 2007 2008 2009 Weighted average coefficient gasoline and diesel: from ton to 1000 l 0.82 0.82 0.82 Coefficient of conversion of one truck/light vehicles in equivalent car 4 4 4 coefficient of conversion of one bus in terms of an equivalent car 15 15 15 coefficient of conversion of one motorcycle in equivalent car 0.15 0.15 0.15
Gross ton-kilometre for passenger train 1.7 1.7 1.7
Gross ton-kilometre for goods train 2.5 2.5 2.5
Savings in energy consumption train transport passenger and freight Energy consumption of rail transport in TJ per million gross ton-kilometres
M6 Transport train per gross kilometre
2007 2008 2009
E/IA 0.29 0.29 0.30 TJ/m gross ton-km
E/IA(7)-E/IA(t) -0.00 -0.01 TJ/m gross ton-km
Accumulated savings (E/IA(7) -E/IA(t))* IA(t) -72 -218 TJ
Total rail transport E 4,363 4,559 4,533 TJ
Gross ton-kilometre for train IA 15,248 15,675 15,106 TJ/m gross ton-km
Accumulated savings in 2010 are assessed as accumulated savings in 2009 times 1.5 Source energy Energy statistics 2009 (Energistatistik 2009)
Source Activity: Odyssee
Savings in energy consumption domestic air transport passenger Energy consumption of air transport in TJ per million passenger kilometres
M8 Transport air per passenger kilome-tre
2007 2008 2009
E/IA 3.93 4.57 4.01 TJ/m passenger km E/IA(7)-E/IA(t) -0.64 -0.08 TJ/m passenger km
Accumulated savings (E/IA(7) -E/IA(t))* IA(t) -241 -28 TJ
Total domestic air transport E 1,482 1,654 1,451 TJ

- 41 -
Passenger traffic in domestic air (pas-senger km) IA 377 362 362
Million passenger km
Accumulated savings in 2010 are assessed as accumulated savings in 2009 times 1.5 Source energy Energy statistics 2009 (Energistatistik 2009)
Source Activity: Odyssee
P12 Transport passenger switch to public transport and P13 Transport freight switch to train and ship have
been copied directly from Odyssee ESD.