The scope for low-cost connecting services in Europe – … paper LCC connecting potential... ·...
22
1 The scope for low-cost connecting services in Europe – Is self-hubbing only the beginning? Sven Maertens, Holger Pabst, Wolfgang Grimme German Aerospace Center (DLR), Air Transport and Airport Research, Linder Höhe, Cologne, Germany Phone: ++49-2203-601-2596 Fax: ++49-2203-601-12594 Email: [email protected] Abstract To comply with the simplicity principle of the archetypical low-cost carrier (LCC) business model, most LCC do not (yet) offer connecting flights. Nevertheless, due to the overall growth of the sector, more and more transfer opportunities between LCC flights have emerged – albeit mostly as “self- hubbing” under the radar of airlines and airports. In an exploratory approach, we assess the transfer potential between LCC services in Europe over time, relative to the network offered by the full service network carriers (FSNC). After a short review of air transport connectivity indicators and previous work on LCC transfer opportunities, we present an SQL-based approach for the identification of marketable one-stop connections from OAG schedules, considering pre-defined restrictions such as for connecting times and detour factors. We find that the European LCC network now allows for about 162k weekly one-stop connections, which is a big rise since 2006 but still far below the almost 725k connections offered by the network carriers. At airport-pair level, though, the low-cost sector already comes relatively close to the network carriers (15.9k vs. 25.3k). We also identify the largest transfer airports for low-cost, one-stop connections, and provide an overview of the most frequently served indirect origin-destination (OD) markets. We close the paper in identifying the most fundamental operational and commercial restrictions that should be overcome to fully exploit the identified potential of flight connections between LCC. This includes the questions of missed connections and baggage through-handling. Keywords: LCC, low-cost carrier, airline networks, connectivity, self-hubbing, connecting flights
Transcript of The scope for low-cost connecting services in Europe – … paper LCC connecting potential... ·...

1
The scope for low-cost connecting services in Europe – Is self-hubbing only the beginning?
Sven Maertens, Holger Pabst, Wolfgang Grimme
German Aerospace Center (DLR), Air Transport and Airport Research, Linder Höhe, Cologne, Germany
Phone: ++49-2203-601-2596 Fax: ++49-2203-601-12594
Email: [email protected]
Abstract
To comply with the simplicity principle of the archetypical low-cost carrier (LCC) business model, most LCC do not (yet) offer connecting flights. Nevertheless, due to the overall growth of the sector, more and more transfer opportunities between LCC flights have emerged – albeit mostly as “self-hubbing” under the radar of airlines and airports.
In an exploratory approach, we assess the transfer potential between LCC services in Europe over time, relative to the network offered by the full service network carriers (FSNC). After a short review of air transport connectivity indicators and previous work on LCC transfer opportunities, we present an SQL-based approach for the identification of marketable one-stop connections from OAG schedules, considering pre-defined restrictions such as for connecting times and detour factors. We find that the European LCC network now allows for about 162k weekly one-stop connections, which is a big rise since 2006 but still far below the almost 725k connections offered by the network carriers. At airport-pair level, though, the low-cost sector already comes relatively close to the network carriers (15.9k vs. 25.3k). We also identify the largest transfer airports for low-cost, one-stop connections, and provide an overview of the most frequently served indirect origin-destination (OD) markets.
We close the paper in identifying the most fundamental operational and commercial restrictions that should be overcome to fully exploit the identified potential of flight connections between LCC. This includes the questions of missed connections and baggage through-handling.
Keywords: LCC, low-cost carrier, airline networks, connectivity, self-hubbing, connecting flights

2
1 Introduction and objective
Low-cost carriers (LCC) have grown tremendously. The emergence of this business model in Europe was pushed by the introduction of a common air transport market in the late 1990s, and met with many inefficient full service network carriers (FSNC)1 that felt save at their fortress hubs, and an airport landscape otherwise full of underutilized airports deliberately waiting for traffic. Consequently, the movement share of the LCC sector grew from about 19% in 2006 to 30% in 2015, which translates into some 45k movements in the first week of June (Figure 1).
Figure 1: Weekly departures by carrier type – 1st week of June 2006 vs. 2015
Data source: OAG; for airline group definitions see Section 4.
Despite increasingly large networks, connecting flights have not yet been systematically offered by most LCC – in order to avoid increased complexity and cost (Fageda et al, 2015). In the meantime, however, this categorical rejection of transfer services seems to crumble: Carriers like Norwegian, Vueling or Eurowings are already offering connections at their main bases, and even Ryanair has started a trial phase for transfer services at its Stansted and El Prat bases in summer 2016 (Air Transport World, 2016). According to Fageda et al (2015), underlying drivers might be at least threefold: a maturing market with increasingly limited scope for organic growth; capturing travelers that are already doing self-hubbing; and the possibility to offer long(er)-distance ODs. What is more, transferring even between different LCC seems to be on the verge of becoming institutionalized, albeit still niche: be it in form of airport-led transfer schemes or, lately, also by advances in search engine technologies applied by online travel agencies and meta-searchers.
The objective of this paper is to apply a suitable connectivity measure in order to exploratively assess the potential for LCC one-stop connections and airport-pairs in Europe, and to compare this to the FSNC. In other words: We aim at finding out which maximum one-stop network could be generated from the schedules of the LCC sector if transfer opportunities were actively marketed. We apply an SQL-based connectivity query to the OAG schedules database to identify the number of different one-stop airport-pairs and unique connections (frequencies). This exercise is run both for 2015 and
1 We apply the terms “full service network carriers”, “network carriers” and the American term “legacy carriers” synonymously.
68,245 (51%)
64,025 (43%)
24,974 (19%)
45,078 (30%)
39,636 (30%)
41,295 (27%)
-
20,000
40,000
60,000
80,000
100,000
120,000
140,000
160,000
2006 2015
Others
LCC
FSNC

3
2006, to get an impression of how the one-stop connectivity provided by these two groups has developed. Given the strong increase in movements, we expect that the LCC sector has been able to increase the number of potential one-stop connections and airport-pairs relatively stronger than the FSNC. An increasingly high (market) potential for indirect LCC services could be of business relevance for several stakeholders like travel distributors, (potential transfer) airports, and the LCC themselves that could benefit from additional demand and higher load factors, reducing the “route density problem” (de Wit and Zuidberg, 2012).
The idea behind our work builds up on Malighetti et al. (2008) wo found that about 2/3 of the fastest indirect connections in Europe in 2007 were not provided by the alliance system and hence could be exploited by self-hubbing or innovative forms of carrier-independent transfer schemes. This observation confirmed their hypothesis that the “sheer concentration of [LCC] flights can provide room for indirect connectivity” (Malighetti et al., 2008, p. 54). This aspect shall be even more relevant nowadays.
The paper is structured as follows: Section 2 provides an overview of connectivity indicators and Section 3 of the evolution of low-cost transfer offerings and self-hubbing trends in Europe. In Chapter 4, we introduce our dataset, main assumptions and definitions, as well as the actual modelling approach. The results for the years 2015 and the comparison year 2006 are presented in section 5. Section 6 concludes with some additional remarks e.g. on operational and commercial restrictions that shall be overcome to successfully implement a LCC interlining network, as well as ideas for future research. This includes the questions of liability for missed connections, and of baggage through handling.

4
2 Air transport connectivity and its measurement To generate economies of scale, density and scope and hence to offer competitive fares, most airlines consolidate their supply in offering fixed networks of pre-defined routes and frequencies, which translates into a certain level of connectivity. Archetypical network types that are applied by air transport providers are point-to-point networks, where less focus is put on connecting traffic, and hub&spoke networks, in which all or most of the routes start or end at certain nodes where connections are provided (see e.g. Berechman and de Wit, 1996, Berechman et al, 1998, and Burghouwt and de Wit, 2005).
Connectivity is, however, a rather abstract term for which several different measures and indicators have emerged.Connectivity measures usually refer to either a certain location or to a whole network, and are hence applied to centrality- and accessibility-related questions such as “How well is airport A connected with e.g. the rest of the world?”, “How many connections are offered in the network of airline X or region Y?”, or “What is the centrality / hub potential of airport H?”.
An early connectivity indicator was developed by IATA (Smyth and Pearce, 2007). It aims at quantifying the degree to which an airport (or e.g. a city, region or country through several airports) is integrated within the global air transport network and considers the number and size of the destinations as well as the seat capacities and frequencies on each route. The indicator is relatively easy to handle but neglects the additional benefit stemming from flights to hubs where connecting services are offered.
A connectivity indicator that aims at overcoming this lack of indirect connectivity value is the “Airport Connectivity Index” developed by Dutch SEO Economisch Onderzoek. It measures the number of direct and indirect frequencies from an airport, weighted by a quality factor which represents the fastness of the connection. It can be calculated using the Netscan Connectivity Model which has been applied in various studies, e.g. ACI (2014). Other indicators that consider indirect connectivity include the “Doganis and Dennis” (Doganis and Dennis, 1989; Dennis, 1994), “Bootsma” (Bootsma, 1997) and “WNX” (weighted number of connections; Burghouwt, 2007) indicators. Unlike the IATA indicator, these indicators do however not consider capacities and hence may underestimate the actual value of routes served with larger than average aircraft which c. p. provide more capacity (at possibly more attractive fares).
In an attempt to model not only the value of non- and one-stop connections, Malighetti et al (2008) have introduced a connectivity index based on the shortest path length. To compare the connectivity of e.g. different airports or regions, the averages of the minimum path lengths between each airport and all other airports in the network are estimated. The authors also introduced a new measure named “Essential Betweenness” which describes to what extend an airport is “unavoidable” on minimal paths. In one of the later papers, Niesse and Grimme (2015) have added the dimensions travel time and frequencies to the shortest path length approach. They present two new indicators, “average shortest travel time (ASTT)” and “average highest path velocity (AHPV)”, which consider the shortest travel time depending on the time of departure, hence merging both frequencies and travel time into one indicator value. Generally, it is however questionable to what extent a multi-, say 3-, 4 or 5-stop, connection shall (still) be counted and hence regarded as beneficial for a location.
An empirically founded connectivity metric was introduced by Allroggen et al (2015). It is the first model to consider the quality and quantity of non- and one-stop connections – as already introduced

5
by Burghouwt and de Wit (2005) – from the passengers’ empirical perspective instead of generic assumptions for e.g. maximum detours.
A comprehensive overview over some of these and other connectivity indicators was provided by Burghouwt and Redondi (2013) who identified a high correlation between most of the indicators.
In this paper, we aim at assessing the indirect connectivity potential of the European low-cost carrier network, compared to that of the network carriers. Hence, we apply a connectivity measure at the total network level, and here focus on indirect one-stop connections.

6
3 Towards connections between low -cost carriers
Low-cost air travel has been a hot topic in research, policy and practice since the US (1978) and European (1997) market deregulation. Work that deals with the architecture of the archetypical LCC business model include e.g. Lawton (2002) and Forsyth (2003). To operate at the lowest possible costs, the “pure” LCC employs a standardized fleet of single-class aircraft on point-to-point routes under a simple, one-way based pricing scheme from smaller airports. It further avoids frills from free catering over lounge access to frequent flyer schemes, and distributes directly to save CRS fees.
This approach turned out to be successful: Dobruszkes (2013) provides a comprehensive spatial analysis of the development of the European low-cost airline sector.. He shows that the intra-European market share of LCC in terms of seats has increased from about 5% in 2000 and 20% in 2005 to 31% in 2012. At the same time, new destinations e.g. in Eastern Europe, Morocco and the Canary Islands have emerged and average stage lengths increased. The findings also confirm earlier observations by e.g. Derudder and Witlox (2009) that LCC are the main drivers of new routes and deconcentration of air travel in Europe as he finds that 51% of all 1,777 new intra-European routes between 1995 and 2012 were exclusively inaugurated by LCC.
Lately, many LCC have changed their business models into more hybrid ones, introducing elements known from the network carriers. Papers that deal with this evolution of the LCC business model include Francis et al (2007), Mason and Morrison (2008) and Fageda et al (2015). Klophaus et al (2012) group those airlines that are widely perceived as LCC within an index based on the individual fulfillment of a list of archetypical “LCC criteria”. They find that only 5 of 20 European carriers, led by Ryanair and Wizz Air, could actually still be labelled as pure LCC, while the others are rather part of the groups “hybrid carriers with dominant LCC characteristics”, “hybrid carriers with dominant full service airline characteristics” and “full service airlines”. Lohmann and Koo (2013) perform a similar study for a sample of nine US carriers. They show that, due to hybridization, airlines can no longer be easily attributed to pre-defined, discrete groups. Instead, there is now a continuum of different business models in play.
One of the first papers to tackle the issue of connections between LCC is Malighetti et al (2008). The authors found that about two thirds of the fastest indirect connections within Europe in 2007 were not operated by the alliance system and might hence be exploited by new forms of e.g. self-hubbing. Grimme (2008) had a more disaggregated look at the actual implementation of the first airport-led LCC transfer schemes (viaberlin.com and cologne-bonn-connect.com) that had appeared some 10 years ago. On the one hand, he sees some benefits, such as the possibility to offer airport-pairs not yet served directly or indirectly by any network carrier, which might help generating some new demand, and – from the airport’s perspective – additional aviation and non-aviation revenue. On the other hand, the author identified two major obstacles for success, the “unidirectionality” and “awareness” problems:
• In many cases, good LCC connections via a particular airport can only be generated for either the outbound or the inbound trip, due to the unidirectionality of routes that are only served once per day or even less often;
• The target group – wishing to fly from O to D – will usually not be aware of a booking platform made available on the website of a potential intermediate airport H. Or – to give an example: How should someone wishing to travel from Pisa to Gdansk come up with the idea of searching for a suitable flight on the website of Cologne/Bonn airport?

7
As figure 1 showed, both LCC supply and market share rose strongly in the last years, with the sector now accounting for about 30% of all intra-European flights. We assume that this sheer growth alone may have brought the LCC network closer to suitability for connecting services.
Furthermore, LCC usually price their flights on a one-way basis, i.e. no fare penalties occur if only a one-way segment is booked and not a round trip. This shall make combinations of different LCC legs more affordable than itineraries which would include one-way segments of legacy carriers. This is because the latter usually charge high fares for one-ways and for returns with short stays, while they usually discount return fares provided that e.g. the so-called “Saturday night rule” is met. This way, they aim at establishing so-called rate fences between inexpensive fares targeted at leisure travelers (who usually want to stay over the weekend) and more expensive tickets for business travelers (who usually prefer mid-week day returns) (Bischoff et al, 2011).
Also, the combination of different low-cost flights is increasingly facilitated by recent developments in the travel distribution industry: Meta-search engines and online travel agents have grown in importance and proven to be capable of instantly combining different travel products. Some new players, such as Kiwi.com (see screenshot in Figure 2 for a “Ryanair-on-Norwegian” connection from Cologne/Bonn to Oslo via Berlin), already combine flights from different LCC and even provide the traveler with a connection guarantee (insurance). If, as long as no baggage through check is provided, no additional production costs occur at the airline level, additional transfer passengers generated this way could be attractive for LCC in terms of increasing economies of density.
Figure 2: Sample LCC one-stop connection CGN-SXF-OSL on Ryanair and Norwegian as offered on Kiwi.com
Source: Kiwi.com screenshot, retrieved 22 May, 2016.
Finally, connections offered on LCC would tend to supply a larger number of seats per movement (and OD). This is because LCC operate large 150-190 seater aircraft while network carriers usually provide smaller capacities on continental flights, of which, moreover, large shares are effectively “blocked” for passengers transferring to or from long haul flights.

8
4 Definitions, data and methodology
For the years 2006 and 2015, we compare the number of possible unique, weekly one-stop connections within the intra-European LCC and FSNC networks, respectively. Our main data source is schedules data from OAG (Official Airline Guide), covering most regular passenger air services from >900 carriers at the worldwide level, including some 115 LCC.2 To scale the massive amount of data down, we have chosen the first seven days of June 2006 and 2015, respectively, as reference. The spring months are regarded as representative for the annual average as they are characterized both by solid business and leisure demand.
In times of increasing hybridization it is not trivial to group carriers by their business model. In fact, Mason and Morrison (2008) state that a range of somehow “low-cost” business models now coexist. We define all carriers as LCC that meet all or most of the following “LCC criteria” that are repeatedly named in the literature3: only one service class on intra-European flights; simple, one-way-based pricing model; LCC-style, low-fare focused PR; homogenous fleet of large narrow-body aircraft; focus on intra-European flights; no alliance membership (see Figure 3).
Figure 3: Airlines defined as LCC, 2006 and 2015 (sorted by size)
*Logos taken from airline websites and Wikipedia.
Most “leisure” carriers, in the past often labelled as “charter airlines”, have been attributed to the group of LCC as these business models have converged massively. German airberlin was part of the LCC group in 2006 but is now assigned to the FSNC group as it operates a hub&spoke network in close cooperation with Etihad Airways and Oneworld partners (Figure 4). Furthermore, the carrier offers free snacks and drinks on all flights, and a FFP operating under the Oneworld scheme. Aer Lingus, in contrast, had left Oneworld in 2007 and switched to a low-cost business model. The carrier is hence assigned to the LCC group for our 2015 assessment, although it may soon re-switch groups following its acquisition by IAG and re-joining of Oneworld in 2016. Some carriers are not considered
2 2006 schedule data is available on CD („OAG MAX“) and 2015 data in *.txt format under the product name „OAG Worldwide direct flights (WDF)“ (see http://www.oag.com/schedules/wdf). 3 See e.g. Lawton (2002) and Fageda et al (2015).

9
as part of either of these two groups, for example regional airlines and those airlines operating hubs at very remote places (e.g. Turkey).
Figure 4: Airlines defined as FSNC, 2006 and 2015 (sorted by size)
*Logos taken from airline websites and Wikipedia.
To keep computing times at reasonable levels, we apply a connectivity indicator that counts only one- and not two- or more-stop connections. This restriction will not distort the overall picture as the latter two are virtually unknown within Europe (see Figure 5). What is more, we do not consider non-stop connectivity as the objective of this paper is to have an exclusive look at indirect connectivity contribution of the LCC.
Figure 5: Intra-European ODs September 2015 by routing
Data source: Sabre Market Intelligence.
We only consider connecting times between 45 minutes and 4 hours as shorter connections are hardly operational and longer waiting will hardly be marketable. For reasons of simplicity, theminimum connecting time of 45 minutes has been set as fix for all airports, although – in reality – there are airports with multiple terminals between which real connecting times will easily exceed this
93.1%
6.6% 0.3%
Intra-European ODs by routing (Sep'15)
NON-STOP
ONE-STOP
TWO- & MORE-STOPS
10
frontier. We are aware that 45 minutes might, in practice, be too quick for baggage through check between carriers. However, we stick to this lower limit as more and more passengers within Europe seem to travel with hand-luggage only.
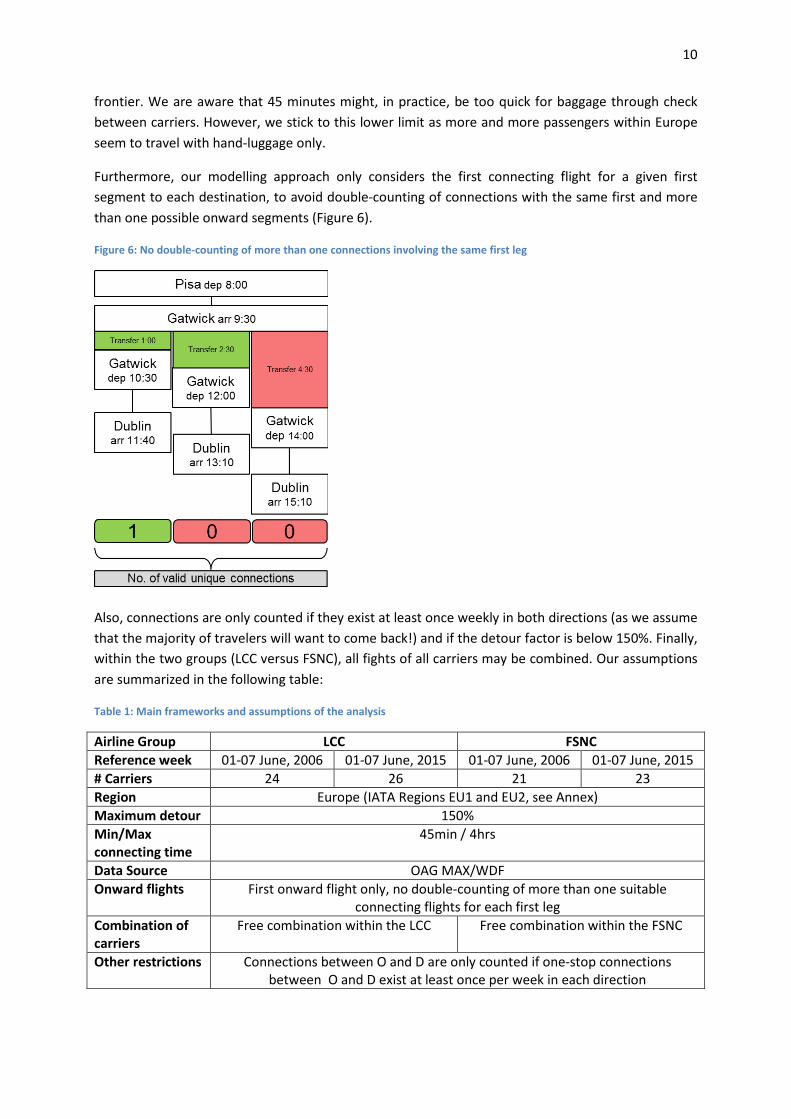
Furthermore, our modelling approach only considers the first connecting flight for a given first segment to each destination, to avoid double-counting of connections with the same first and more than one possible onward segments (Figure 6).
Figure 6: No double-counting of more than one connections involving the same first leg
Also, connections are only counted if they exist at least once weekly in both directions (as we assume that the majority of travelers will want to come back!) and if the detour factor is below 150%. Finally, within the two groups (LCC versus FSNC), all fights of all carriers may be combined. Our assumptions are summarized in the following table:
Table 1: Main frameworks and assumptions of the analysis
Airline Group LCC FSNC Reference week 01-07 June, 2006 01-07 June, 2015 01-07 June, 2006 01-07 June, 2015 # Carriers 24 26 21 23 Region Europe (IATA Regions EU1 and EU2, see Annex) Maximum detour 150% Min/Max connecting time
45min / 4hrs
Data Source OAG MAX/WDF Onward flights First onward flight only, no double-counting of more than one suitable
connecting flights for each first leg Combination of carriers
Free combination within the LCC Free combination within the FSNC
Other restrictions Connections between O and D are only counted if one-stop connections between O and D exist at least once per week in each direction

11
Methodology-wise, we have applied a multi-step analysis (filtering) of the OAG database by sql-queries. The OAG table, which just includes all non-stop flights, was connected with itself via the following “INNER JOIN” query.
Figure 7: INNER-JOIN query
The INNER JOIN keyword selects all rows from both tables as long as there is a match between the columns in both tables. Hence, for each flight’s destination, the algorithm tried to identify onward routes whose departure airport equals the first segment’s destination airport, considering the restrictions such as the 150% and 45min-4hrs rules. The resulting one-stop table contains all possible connecting flights taking into account these constraints. To reduce the size of the datasets, some of these restrictions (e.g. the selection of the carrier groups) were applied to the original OAG dataset, resulting in two different datasets “Leg” and “LCC” that were handled independently of each other.
OAG_2015
PK DepPK Arr
AirlineType Frequency LocalDepDate LocalArrDate Distance ...
SELECT OAG1.Distance AS Leg1, OAG2.Distance AS Leg2, OAG1.DepAirport AS A1, OAG1.ArrAirport AS A2, OAG2.ArrAirport AS A3, distanz_oag.DStMiles AS ShortestLeg, OAG1.Distance + OAG2.Distance AS Leg,OAG1.AirlineType,OAG2.AirlineType
FROM OAG_2015 AS OAG1 INNER JOIN
OAG_2015 AS OAG2 ON OAG1.ArrAirport = OAG2.DepAirport
INNER JOIN distanz_oag ON
OAG1.DepAirport = distanz_oag.DepAirport AND OAG2.ArrAirport = distanz_oag.ArrAirport
WHERE (OAG1.Distance + OAG2.Distance < distanz_oag.DStMiles * 1.5) AND (DATEDIFF(mi, OAG1.LocalArrDate, OAG2.LocalDepDate) >= 45) AND
(DATEDIFF(mi, OAG1.LocalArrDate, OAG2.LocalDepDate) <= 240)

12
5 Results 5.1 Airport-pairs and unique connections
In June 2015, the group of FSNC offered 724,217 different weekly one-stop connections within Europe, which is about 9.6% less than in 2006 when 801,382 connections had been made available. The LCC network, in contrast, managed to increase the number of unique connections by 150% from 64,902 in 2006 to 162,310 in 2015. These results do not come not unexpectedly as most FSNC operate at higher frequencies. At airport-pair level, however, both business models almost end up at eye level: In 2015, the geographical scope of the LCC one-stop network contained 15,932 one-stop airport-pairs (+19% compared to 2006), compared to 25,310 airport-pairs offered by the group of network carriers (+11.5%).
Figure 8: One-stop connections and airport-pairs provided by European LCC and FSNC (1st week of June)
5.2 Most important transfer airports
In a next step, we aim at identifying those airports that account for the highest shares in potential transfer connections. For this, we group the list of OiDj via Hk connections by the intermediate Hk airports. Table 2 shows the most important transfer points (hubs) for low-cost, one-stop connections for the years 2006 and 2015, and the cumulative number of connections via these airports.
Table 2: TOP 25 LCC “hubs” (1st week of June, 2006 vs. 2015)
Largest LCC “Hubs” 2006 Largest LCC “Hubs” 2015 Rank Hub # Connections share cumul. Hub # Connections share cumul.
1 STN 20400 31% 31% BCN 27313 17% 17% 2 LGW 5567 9% 40% LGW 20830 13% 30% 3 PMI 3922 6% 46% STN 11745 7% 37% 4 LTN 3730 6% 52% DUB 11165 7% 44% 5 AMS 2798 4% 56% OSL 7533 5% 48% 6 CGN 2285 4% 60% FCO 6435 4% 52% 7 OSL 1860 3% 62% AMS 4544 3% 55% 8 DUB 1700 3% 65% DUS 4358 3% 58% 9 MAN 1650 3% 68% LTN 4171 3% 60%
10 LPL 1343 2% 70% PMI 4116 3% 63%
64,902 162,310
801,382
724,217
7,612
15,932 22,690
25,310
0
5,000
10,000
15,000
20,000
25,000
30,000
0100,000200,000300,000400,000500,000600,000700,000800,000900,000
LCC 2006 LCC 2015 Legacy 2006 Legacy 2015
# of weekly one-stop connections # of airport-pairs

13
11 BCN 1268 2% 72% MXP 3721 2% 65% 12 STR 1127 2% 73% BGY 3055 2% 67% 13 BHX 1005 2% 75% CGN 2640 2% 69% 14 BRS 962 1% 76% GVA 2632 2% 70% 15 SOU 853 1% 78% CDG 2565 2% 72% 16 CDG 762 1% 79% CPH 2480 2% 74% 17 SXF 743 1% 80% MAN 2395 1% 75% 18 DUS 723 1% 81% MAD 2272 1% 76% 19 BGY 717 1% 82% STR 2212 1% 78% 20 EMA 692 1% 83% HAM 1925 1% 79% 21 BFS 602 1% 84% ARN 1771 1% 80% 22 EDI 587 1% 85% ORY 1709 1% 81% 23 MUC 575 1% 86% BRS 1527 1% 82% 24 FCO 552 1% 87% SXF 1346 1% 83% 25 GLA 449 1% 88% BSL 1190 1% 84%
Others 8030 12% 100% Others 26660 16% 100%
Today, the most important transfer point for one-stop connections between LCC is Barcelona, accounting for about 27.3k unique, weekly connections (17% “market share). This is a big jump from the 1.2k connections (2%) achieved in 2006 and results from the business decisions of IAG/Vueling, easyJet and Ryanair to massively expand operations at Barcelona’s El Prat airport. Close behind is London Gatwick with 20.8k connections (13%), managing to keep the 2nd position it already held in 2006. Gatwick is easyJet’s largest hub with more than 60 aircraft based by the end of 2015 (easyJet, 2015), and also frequently served by fellow low-cost and leisure carriers Norwegian Air Shuttle, Monarch Airways, Thomson Airways and Thomas Cook Airlines. London Stansted has seen a decline in LCC connections, from 20.4k (31%) in 2006 to 11.7k (7%) in 2015, which seems to largely result from reductions by dominant carrier Ryanair.
Other airports that could massively increase the number of LCC connections include Dublin (partly due to the swap of Aer Lingus from the FSNC to the LCC group), Oslo (where Norwegian has massively grown), Rome Fiumicino (where the “big three”, Ryanair, easyJet and Vueling, have grown strongly) and Dusseldorf (where Lufthansa has handed over most of its traffic to germanwings and Eurowings). What is more, the cumulative shares show that the connecting opportunities with LCC are now distributed a bit wider within the airport landscape than in 2006.
For comparison reasons, we also have a look at the most important transfer points for connections between network carrier flights (Table 3). Here, the biggest “winners” within the TOP 25 are Frankfurt (FRA), Amsterdam (AMS), Rome Fiumicino (FCO) and Moscow Sheremetyevo (SVO), while airports like Paris Charles de Gaulle (CDG), Munich (MUC), Madrid (MAD), London Heathrow (LHR), Milan Malpensa (MXP) or Barcelona (BCN) experienced a decline in the number of possible one-stop connections.
Table 3: TOP 25 FSNC “hubs” (1st week of June, 2006 vs. 2015)
Largest FSNC Hubs 2006 Largest FSNC Hubs 2015 Rank Hub # Connections share cumul. Hub # Connections share cumul.

14
1 FRA 102568 13% 13% FRA 111066 15% 15% 2 CDG 81872 10% 23% AMS 77589 11% 26% 3 MUC 79681 10% 33% MUC 70154 10% 36% 4 AMS 67872 8% 41% CDG 55043 8% 43% 5 MAD 67857 8% 50% MAD 42326 6% 49% 6 LHR 53971 7% 57% LHR 38701 5% 55% 7 MXP 38898 5% 61% VIE 34788 5% 59% 8 BCN 36204 5% 66% FCO 34252 5% 64% 9 VIE 35850 4% 70% ZRH 28817 4% 68%
10 ZRH 23930 3% 73% SVO 24662 3% 71% 11 FCO 23870 3% 76% CPH 20805 3% 74% 12 CPH 20504 3% 79% BRU 19133 3% 77% 13 PRG 16193 2% 81% ARN 17738 2% 79% 14 OSL 13753 2% 83% HEL 17377 2% 82% 15 DUS 12067 2% 84% OSL 13598 2% 84% 16 LYS 10515 1% 86% TXL 11806 2% 85% 17 HEL 10453 1% 87% ATH 10424 1% 87% 18 WAW 9835 1% 88% WAW 9423 1% 88% 19 ARN 8689 1% 89% DUS 8425 1% 89% 20 ORY 8646 1% 90% PMI 7848 1% 90% 21 LGW 7714 1% 91% LIN 5380 1% 91% 22 BRU 7708 1% 92% LIS 5338 1% 92% 23 MAN 6491 1% 93% DME 4730 1% 92% 24 GVA 3923 0% 93% PRG 4369 1% 93% 25 STR 3894 0% 94% LED 3831 1% 94%
Others 48424 6% 100% Others 46594 6% 100%
Not surprisingly, the comparison of the TOP25 results for the groups of LCC and FSNC also reveals that the latter’s services are more concentrated: 13 transfer airports account for about 80% of all one-stop connections offered by the legacy carriers, compared to 21 airports with the LCC. The results also reveal that – with Amsterdam and Rome Fiumicino being the main exceptions – the largest transfer airports for LCC and FSNC groups are not identical.
5.3 Largest airport (OD) pairs
The following figures show those airport-pairs accounting for the largest number of weekly one-stop connections between LCC, along with the respective numbers of direct flights. Unlike 2006, each of the TOP30 one-stop ODs is now also served by at least a few weekly direct flights (Figure 9, Figure 10).

15
Figure 9: Most frequently served low-cost, one-stop ODs and competition by direct flights (1st week of June, 2015)
Figure 10: Most frequently served low-cost, one-stop ODs and competition by direct flights (1st week of June, 2006)
We assume that especially those routes with high one-stop supply but low numbers of direct flights could provide good business opportunities for one-stop offerings. This might e.g. apply to ODs such as from Barcelona to East Midlands, Edinburgh, Glasgow, Leeds/Bradford, Catania and Belfast, from Mahon, Stuttgart and Hamburg to Dublin, or from Dublin to Ibiza, Milan Malpensa and Geneva, which all end up among the largest 100 airport-pairs in terms of weekly one-stop connections between LCC and at the same time contested by a maximum of 10 direct flights per week only.
Figure 11: 30 largest airport-pairs in terms of one-stop LCC connections with less than 10 weekly direct flights (1st week of June, 2015)
0
100
200
300
400
500
600
700
BCN
-DU
BDU
B-BC
NPM
I-DU
BBC
N-L
GW
AGP-
DUB
LGW
-BCN
FCO
-DU
BBC
N-M
ANSX
F-BC
NBC
N-S
XFAL
C-DU
BBC
N-C
PHFC
O-L
GW
PMI-L
GWBC
N-O
SLDU
B-AG
PM
AD-D
UB
CPH-
BCN
HAM
-BCN
DUB-
ALC
FAO
-DU
BDU
S-BC
NBC
N-H
AMBC
N-E
DIDU
B-PM
IBC
N-A
MS
MXP
-DU
BBC
N-A
RNLG
W-F
COCP
H-DU
B
# weekly one-stop connections # weekly direct flights
0
20
40
60
80
100
120
140
160
AGP-
DUB
AMS-
DUB
AGP-
EDI
AGP-
AMS
DUB-
AGP
AGP-
BFS
ALC-
DUB
AMS-
BFS
ALC-
EDI
DUB-
ALC
BGO
-TRD
STN
-PM
ITR
D-BG
OAG
P-G
LACI
A-DU
BTX
L-PM
IBH
D-AG
PED
I-AGP
DUB-
AMS
ALC-
BFS
ALC-
AMS
GCI
-EDI
BFS-
AGP
ALC-
GLA
DUB-
BCN
AGP-
BHD
PMI-B
FSTR
D-SV
GDU
B-CI
AAM
S-G
LA
# weekly one-stop connections # weekly direct flights

16
119
163 140
127 121 142 134
148
192
163
119
181 160
147 122 115
198 185
131 129
0 3 3 3 3 4 4 5 6 6 6 7 7 7 7 7 8 8 9 9 0
50
100
150
200
250
# weekly one-stop connections # weekly direct flights

17
6 Conclusion and further issues
Using SQL queries, we have applied a connectivity measure to the OAG schedules database to assess the potential of one-stop connecting services between LCC in Europe. The European LCC network now offers about 162kweekly, unique one-stop connections. This is much more than the 64.9k connections in 2006 but still far below the almost 725k one-stop frequencies offered by the FSNC. At the airport-pair level, though, the LCC sector already provides a choice that comes relatively close to the network carriers (15.9k vs. 25.3k airport-pairs, compared to 7.6k and 22.7k in 2006).
Barcelona, London Gatwick, London Stansted, Dublin and Oslo would make the largest transfer points between LCC, together accounting for almost 50% of all identified connections. Especially Barcelona and Oslo have made big steps forward since 2006, which goes back to business decisions by airlines like Vueling, easyJet and Ryanair to expand their Barcelona operations, and by Norwegian to expand massively from Oslo.
Not unexpectedly, though, the LCC one-stop network is less concentrated as the FSNC’s network: 21 transfer airports account for about 80% of all one-stop connections offered by the LCC, compared to 13 airports with the FSNC. Operational facilities to improve connections between LCC would hence have to be implemented at a larger number of airports. However, with Amsterdam and Rome Fiumicino being the main exceptions, the largest transfer airports for LCC and FSNC groups are not identical. This might be a good starting point for airports with a large share of LCC when it comes to necessary investments for LCC-connecting services as it will not be necessary to take into account the concerns of the network carriers.
Unlike 2006, all of those 30 ODs with most one-stop LCC connections are now also served directly, albeit not always at high frequencies. Especially those ODs with high one-stop supply but low numbers of direct flights might provide good business opportunities for indirect low-cost offerings. Examples are the relations Barcelona to East Midlands, Edinburgh, Glasgow, Leeds/Bradford, Catania and Belfast, from Mahon, Stuttgart and Hamburg to Dublin, or from Dublin to Ibiza, Milan Malpensa and Geneva, which are all among the largest 100 airport-pairs in terms of weekly one-stop connections between LCC and at the same time contested by a maximum of 10 direct flights per week only.
The identified potential for one-stop, low-cost connections will, however, only provide benefits for the stakeholders if eventually translated into actual bookings. Some airlines (like Vueling, Norwegian and Eurowings) have already started to sell connecting flights, and even Ryanair started a trial phase at two selected airports in summer 2016. Nevertheless, a LCC transfer scheme across all carriers would be needed to fully exploit the identified potential.
Based on the (scarce) literature and feedback from stakeholder talks, we close the paper in discussing some operational issues regarding the implementation of a successful low-cost connect regime:
• Given the “unidirectionality” and “awareness” problems” of any low-cost-connect scheme at the airport level only, the most promising operator of such tools would have to come from the travel distribution and search engine sectors. It can hence be expected that other ventures will follow the footsteps of Kiwi.com and the likes.

18
• The missed connection problem is not supposed to make a major obstacle as liability can be – and is – absorbed by insurance premiums. The “early birds” viaberlin and cologne-bonn-connect charged insurance fees of about 7.5-8 € per connection and passenger, which would cover about 450-500€ of additional rebooking costs if a connection is missed, and if necessary, expenses for hotel accommodation up to certain limits (Grimme, 2008). The offers on Kiwi.com also include a mandatory insurance component.
• The “baggage and through-check” problem does not only occur at the (potential) transfer airports (not all airports with a large number of LCC services are experienced in baggage transfers) but is also of relevance at the trip origins where the check-in systems (as currently in operation by many LCC) do not always have access on the onward flight, which might even be performed by a different carrier. Solutions at the IATA level – e.g. in the context of IATA’s Travel Information Manual (TIM) – might be an option here, although many LCC are (not yet) members of IATA.
If these remaining issues were solved, many stakeholders could benefit from increased LCC connection possibilities. Low-cost carriers could increase their economies of density; passengers would find more choice, more competition and lower fares on indirect routes; and even legacy carriers could possibly benefit if they relied on LCC as feeders and concentrated on more profitable long hauls instead, as suggested e.g. by Ryanair and easyJet (Financial Times, 2016). In addition, high one-stop demand may be an indicator for routes that should potentially become non-stop (Grimme, 2008).
Finally, airports (and here not only the established hubs) could benefit from higher aviation and non-aviation revenues (Grimme, 2008), and from increased slot productivity if conventional feeder flights are – in the long run – replaced by LCC services operated by larger aircraft. In this regard, we support the argumentation of Fageda et al (2015) that the hybridization of the LCC business model will require airports to leave well-worn paths: Traditional non-hub, low-cost airports will have to find solutions how to ensure smart connections between LCC services, while established airports that so far mainly worked with legacies will have to evaluate how they can establish connections between LCC, that may even be split over different terminals. An important step was taken by Dusseldorf airport where the introduction of new air-side pathways between the three terminal areas A, B and C now allows for air-side connections also between the different airline groups.
We close this paper in providing some ideas for further research. Apart from a more detailed look at the technical and operational feasibility of LCC transfers, and possible solutions, the quantitative approach as presented in this paper should be enhanced in (a) considering online and code-share connections between FSNC only (currently, we also consider inter-alliance transfers, which are unlikely to be available at attractive fares) and (b) implementing more realistic, airport-specific minimum connecting times depending from actual airport and terminal layouts. Furthermore, it will be interesting to translate the identified connections in actual market potentials.

19
7 References
Air Transport World, 2016. Ryanair to test connecting flights. Apr 20, 2016. Available online at:
http://atwonline.com/airports-routes/ryanair-test-connecting-flights [as of 1 June, 2016}].
ACI, 2014. Airport Industry Connectivity Report. In partnership with seo aviation economics. Brussels
and Amsterdam.
Allroggen, F., Wittmann, M.D., Malina, R., 2015. How Air Transport Connects the World - A New
Metric of Air Connectivity and Its Evolution between 1990 and 2012. Transportation Research Part E:
Logistics and Transportation Review 80. 184-201.
Berechman, J., de Wit, J., 1996. An analysis of the effects of European aviation deregulation on an
airline’s network structure and choice of a primary West European hub airport. Journal of Transport
Economics and Policy 30 (3). 251-269.
Berechman, J., Poddar, S., Shy, O., 1998. Network structure and entry in the deregulated airline
industry. Keio Economic Studies 35 (2). 71-82.
Bischoff, G., Maertens, S., Grimme, W., 2011. Airline pricing strategies versus consumer rights.
Transportation Journal 50, No. 3, 232-250.
Bootsma, P., 1997. Airline Flight Schedule Development. Doctoral thesis. Utrecht.
Burghouwt, G., 2007. Airline Network Development in Europe and its Implications for Airport
Planning. Aldershot.
Burghouwt, G., de Wit, J., 2005. Temporal configurations of European airline networks. Journal of Air
Transport Management 11. 185-198.
Burghouwt G., Redondi, R., 2013. Connectivity in air transport networks: an assessment of models
and applications. J. Transp. Econ. Policy 41 (1) 35–53.
Dennis, N., 1994. Airline hub operations in Europe. Journal of Transport Geography 2 (4). 219-233.
Derudder, B., Witlox, F., 2009. The impact of progressive liberalization on the spatiality of airline
networks: a measurement framework based on the assessment of hierarchical differentiation.
Journal of Transport Geography 17, 276-284.
De Wit, J., Zuidberg, J., 2012. The growth limits of the low cost carrier model. Journal of Air Transport
Management 21 17–23.

20
Dobruszkes, F., 2013. The geography of European low-cost airline networks: a contemporary analysis.
Journal of Transport Geography 28, 75-88.
Doganis, R., Dennis, N., 1989. R. Lessons in hubbing. Airline Business, pp. 42–47
easyJet, 2015. Full year results analyst and investor presentation. Tuesday 17 November 2015.
Available online at: http://corporate.easyjet.com/~/media/Files/E/Easyjet-Plc-
V2/pdf/investors/results-centre/2015/2015-full-year-results-presentation.pdf [as of 01 June, 2016].
Fageda, X., Suau-Sanchez, P., Mason, K.J., 2015. The evolving low-cost business model: Network implications of fare bundling and connecting flights in Europe. Journal of Air Transport Management 42. 289–296.
Financial Times, 2016. Ryanair and easyJet eye work with rivals. Financial Times online. January 12,
2016. Available online at: https://next.ft.com/content/2d2e6ec0-b39e-11e5-b147-e5e5bba42e51 [as
of 01 June, 2016].
Forsyth, P., 2003: Low-cost carriers in Australia: experiences and impacts. Journal of Air Transport
Management 9 (5). 277-284.
Francis, G., Dennis, N., Ison, S., Humphreys, I., 2007. The transferability of the low cost model to long-
haul airline operations. Tourism Management 28. 391-398.
Grimme, W., 2008: Low Cost Carrier Connecting Flights and Interlining - A conundrum finally solved?
Proceedings of the 12th Annual Conference of the Air Transport Research Society. Athens, Greece.
Klophaus, R., Conrady, R., Fichert, F., 2012. Low cost carriers going hybrid: evidence from Europe.
Journal of Air Transport Management 23, 54-58.
Lawton, T., 2002. Cleared for Take-Off: Structure and Strategy in the Low-fare Airline Business.
Aldershot.
Lohmann, G., Koo, T.T.R., 2013. The airline business model spectrum. Journal of Air Transport
Management 31, 7-9.
Malighetti, P.; Paleari, S.; Redondi, R., 2008. Connectivty of the European airport network: “Self-help
hubbing” and business implications. Journal of Air Transport Management 14 (2008), 53-65.
Mason, K.J., Morrison, W.G., 2008. Towards a means of consistently comparing airline business
models with an application to the ‘low-cost’ airline sector. Research in Transportation Economics 24,
75-84.

21
Niesse, H.; Grimme, W., 2015. How to measure airport connectivity? - Average shortest travel time
and average highest path velocity as indicator. International Journal of Aviation Management 2. 226-
240.
Smyth, M., Pearce, B., 2007. Aviation Economic Benefits. IATA Economic Briefings N° 8. July 2007.

22
8 Annex
IATA Regions EU1 and EU2
Code Country Code Country
AL Albania IE Ireland, Republic of
AM Armenia IS Iceland
AT Austria IT Italy
AZ Azerbaijan LT Lithuania
BA Bosnia-Herzegovina LU Luxembourg
BE Belgium LV Latvia
BG Bulgaria MC Monaco
BY Belarus MD Moldova
CH Switzerland ME Montenegro
CY Cyprus MK Macedonia
CZ Czech Republic MT Malta
DE Germany NL Netherlands
DK Denmark NO Norway
EE Estonia PL Poland
ES Spain PT Portugal
FI Finland RO Romania
FO Faeroe Islands RS Serbia
FR France RU Russia
GB Great Britain SE Sweden
GE Georgia, Republic of SI Slovenia
GI Gibraltar SK Slovak Republic
GR Greece TR Turkey
HR Croatia UA Ukraine
HU Hungary