The Scientist's Guide to Effectively Communicating Results ......The Scientist's Guide to...
46
The Scientist's Guide to Effectively Communicating Results Using Graphs and Other Visuals Jacqui Fenner | Graphic Designer Office of Science & Technology June 2017
Transcript of The Scientist's Guide to Effectively Communicating Results ......The Scientist's Guide to...

The Scientist's Guide to
Effectively Communicating
Results Using Graphs
and Other Visuals
Jacqui Fenner | Graphic Designer
Office of Science
& Technology
June 2017

U.S. Department of Commerce | National Oceanic and Atmospheric Administration | NOAA Fisheries | Page 2
“Above all else show the data — Edward Tufte
The Visual Display of
Quantitative Information
“Above all elseshow the data.”
— Edward Tufte
The Visual Display ofQuantitative Information

Talk Overview
U.S. Department of Commerce | National Oceanic and Atmospheric Administration | NOAA Fisheries | Page 3
• Why are Visuals Important?
• Where to Begin?
• Types of Communications MaterialsGetting Started
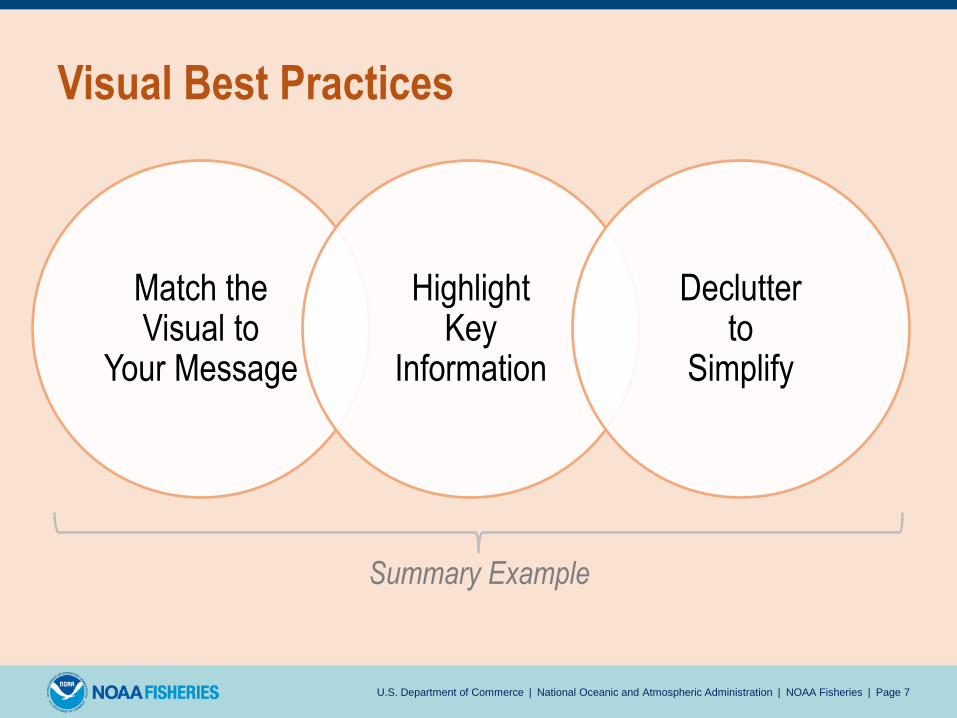
• Match the Visual to the Message
• Highlight Key Information
• Declutter to Simplify
• Summary Example
VisualBest Practices
• Programs + Workflow
• Resources
• Q+ASummary

A well
designed
product…
Why are Visuals Important?
Communicates better
Engages the audience
Gives a professional, cohesive look
U.S. Department of Commerce | National Oceanic and Atmospheric Administration | NOAA Fisheries | Page 4
Not just “dressing up” data
Where to Begin?
Craft Written Content First
• Know your key messages(1-3 main)
Use Existing Resources
• Brand Guide
• Templates
• Color palettes
Build Timeinto Process
• Plan up front
• 1+ week at end
• Iterative
U.S. Department of Commerce | National Oceanic and Atmospheric Administration | NOAA Fisheries | Page 5
Help Your Data Go Farther
Keep in mind…
• Only covering a few topics
• Modified examples
• Rules are not rigid

Communications Materials
Websites /Web tools
Infographics /Maps / Graphs
Reports /Tech Memos
Fact Sheets / Brochures / Flyers
Posters Presentations
U.S. Department of Commerce | National Oceanic and Atmospheric Administration | NOAA Fisheries | Page 6
Match the Visual to
Your Message
HighlightKey
Information
Declutterto
Simplify
Visual Best Practices
U.S. Department of Commerce | National Oceanic and Atmospheric Administration | NOAA Fisheries | Page 7
Summary Example
Match theVisual to
Your Message
HighlightKey
Information
Declutterto
Simplify
Visual Best Practices
U.S. Department of Commerce | National Oceanic and Atmospheric Administration | NOAA Fisheries | Page 8

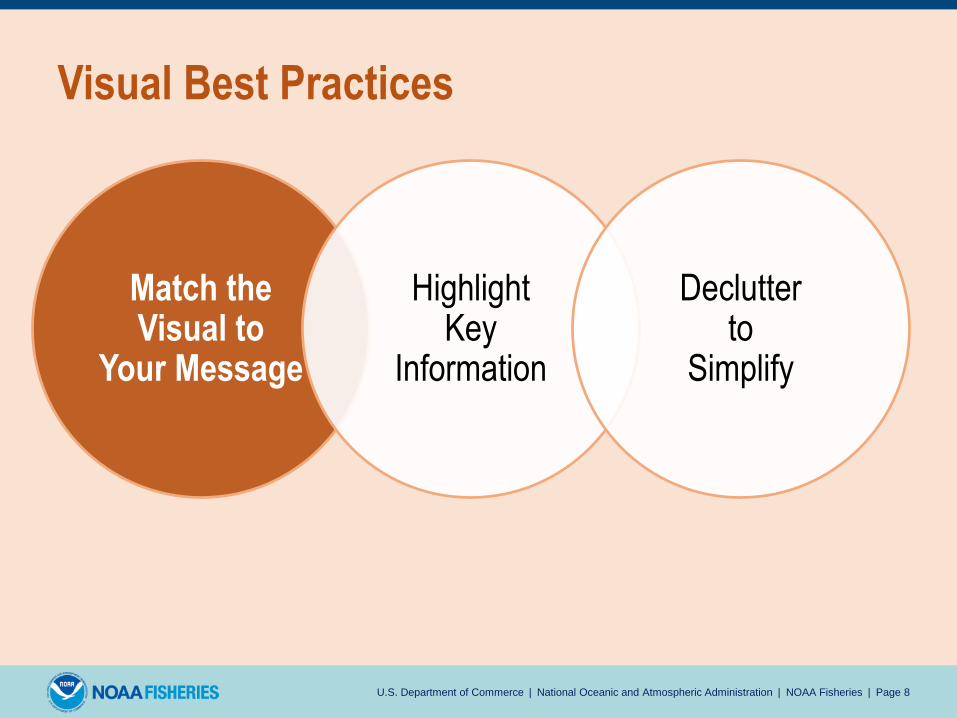
Match the Visual to Your Message
ConsiderContext
• Audience
• Key messages
• Product type
• Web or print
ConsiderOptions
• Graph / table
• Infographic
• Photo + text
• Callout box
U.S. Department of Commerce | National Oceanic and Atmospheric Administration | NOAA Fisheries | Page 9

Types of Graphs to Consider
U.S. Department of Commerce | National Oceanic and Atmospheric Administration | NOAA Fisheries | Page 10
Tables
• PROCan fit a lot of info, often already done
• CONMakes viewer work harder
Circlegraphs
• PROGood for parts of a whole
• CONLess effective w/many groups, multi series, similar values
Visual
indicator
Bargraphs
• PROGood for trends, comparison, multi series(lg changes)
• CONLess effectiveacross series
Linegraphs
• PROGood for trends, comparison, multi series(sm changes)
• CONLess effectivew/in category

Avoid Data Distortion
U.S. Department of Commerce | National Oceanic and Atmospheric Administration | NOAA Fisheries | Page 11
1
2
3
1 2 3?
?
?
??
It Can Muddy Up Your Message

Does a Photo + Text Work Just as Well?
U.S. Department of Commerce | National Oceanic and Atmospheric Administration | NOAA Fisheries | Page 12
15% increase
in U.S. jobsgenerated by marine
fisheries 2011 to 2014

Photo Tips
1-3 photos – high-quality, well chosen, relevant
Consider photo direction
Avoid cheesy photos + clipart
Background photo = text must be readable
Credit properly + complete file metadata as needed
U.S. Department of Commerce | National Oceanic and Atmospheric Administration | NOAA Fisheries | Page 13

Make Sure Content Can Breathe
U.S. Department of Commerce | National Oceanic and Atmospheric Administration | NOAA Fisheries | Page 14

Consider
Photo Direction
U.S. Department of Commerce | National Oceanic and Atmospheric Administration | NOAA Fisheries | Page 15
Species
People
Boats
• Photos should face content.
• Flipping photos? Avoid distortion
of words / other.

Match the Visual to
Your Message
HighlightKey
Information
Declutterto
Simplify
Visual Best Practices
U.S. Department of Commerce | National Oceanic and Atmospheric Administration | NOAA Fisheries | Page 16

Before You Begin, Make things Consistent
U.S. Department of Commerce | National Oceanic and Atmospheric Administration | NOAA Fisheries | Page 17
1. What are the defaults? Make everything consistent (layout, fonts, colors)
2. Add visual interest with meaning to highlight key information
Tip: Left-justify text as default to simplify line of sight

Give Focal Points using Visual Indicators
U.S. Department of Commerce | National Oceanic and Atmospheric Administration | NOAA Fisheries | Page 18
15% increase in U.S. jobsgenerated by marine fisheries from 2011-2014
1.8M
jobs

• Start with premade palette
(Your org brand? Online?)
• Choose 2-3 main colors
(1 neutral and/or 1 cool, 1
warm/accent color)
• Use saturation levels of
same color for variety
• Use primary colors sparingly
Color is a Powerful Tool
U.S. Department of Commerce | National Oceanic and Atmospheric Administration | NOAA Fisheries | Page 19
1 2
Main Colors
• Come forward
Warm colors
• Fallback
Cool colors
Template Colors

Color Sets the Mood
Color + emotion: Can improve
viewer’s memory of key information
U.S. Department of Commerce | National Oceanic and Atmospheric Administration | NOAA Fisheries | Page 20
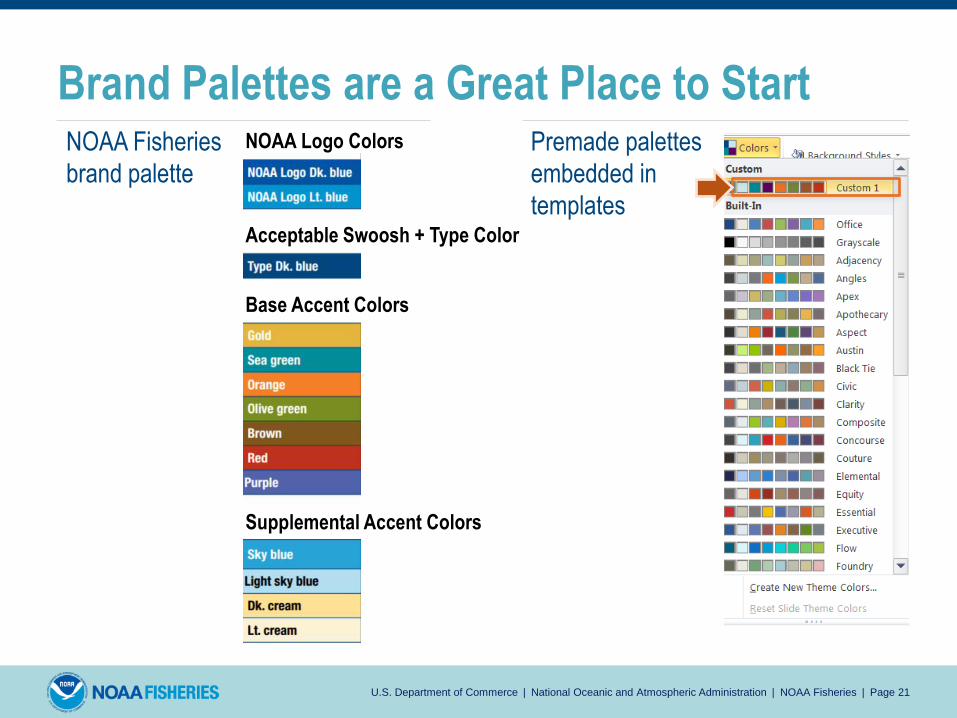
Brand Palettes are a Great Place to Start
U.S. Department of Commerce | National Oceanic and Atmospheric Administration | NOAA Fisheries | Page 21
NOAA Fisheries
brand palette
NOAA Logo Colors
Acceptable Swoosh + Type Color
Base Accent Colors
Supplemental Accent Colors
Premade palettes
embedded in
templates

Terms to know:• Color = hue
• Saturation level = value
How to achieve more contrast:• Use complimentary colors
• Use colors with greater saturation
level differences
Let Color Theory Basics Inform Your Choices
U.S. Department of Commerce | National Oceanic and Atmospheric Administration | NOAA Fisheries | Page 22
Greater contrastcan make things stand out,
highlighting key messages.

Highlight Key Information in a Graphusing Color, Saturation, and Visual Indicators
U.S. Department of Commerce | National Oceanic and Atmospheric Administration | NOAA Fisheries | Page 23
Back-
ground
Data
Emphasis
2011 2012 2013 2014 2015
-X%

Insert PPT Shapes to Highlight Information
U.S. Department of Commerce | National Oceanic and Atmospheric Administration | NOAA Fisheries | Page 24
Can be used for:• Call out boxes
• Backgrounds
• Simple infographics
• Visual indicators
U.S. Department of Commerce | National Oceanic and Atmospheric Administration | NOAA Fisheries | Page 25
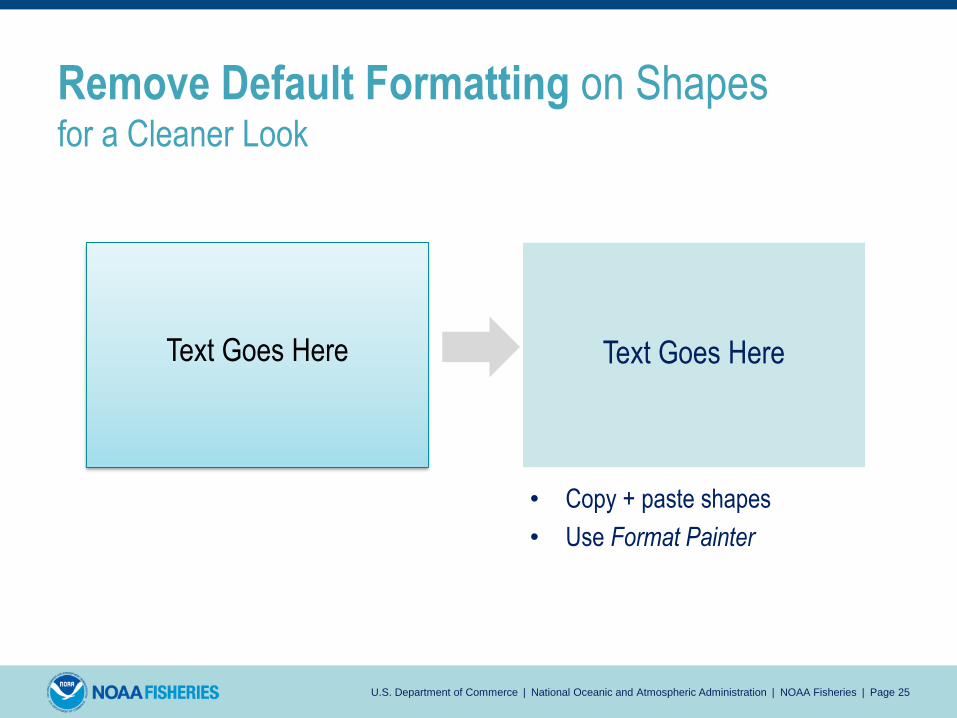
Remove Default Formatting on Shapesfor a Cleaner Look
Text Goes Here Text Goes Here
• Copy + paste shapes
• Use Format Painter

Create Simple Infographics (PPT SmartArt)
U.S. Department of Commerce | National Oceanic and Atmospheric Administration | NOAA Fisheries | Page 26
Item 1
Item 2
Item 3
• Item 1
• Item 2
• Item 3
Right-click on bulleted list > Convert to SmartArt > More SmartArt Graphics…

Adjust Styling to Refine the Effect
U.S. Department of Commerce | National Oceanic and Atmospheric Administration | NOAA Fisheries | Page 27
Item 1
Item 2
Item 3
Double-click on SmartArt graphic > Change Colors (etc.) on ‘Design’ tab
(or right-click on SmartArt, convert to shapes, adjust properties for individual elements)
Item 1
Item 2
Item 3

Match the Visual to
Your Message
HighlightKey
Information
Declutterto
Simplify
Visual Best Practices
U.S. Department of Commerce | National Oceanic and Atmospheric Administration | NOAA Fisheries | Page 28

Why Declutter?
U.S. Department of Commerce | National Oceanic and Atmospheric Administration | NOAA Fisheries | Page 29
Benefits
Creates white space
Highlights key messages
Frees up viewer’s attention
To remove / lessen excess information

Make Sure Content Can Breathe
U.S. Department of Commerce | National Oceanic and Atmospheric Administration | NOAA Fisheries | Page 30
Tips: Avoid moving written content into
the margins (leave a buffer).
Images can bleed fully to the edge if desired,
but avoid no-man’s land (as pictured on left).

Remove Visual Clutter from Graphs
U.S. Department of Commerce | National Oceanic and Atmospheric Administration | NOAA Fisheries | Page 31
Lorem ipsum dolor sit amet, consectetur adipiscing elit, sed do eiusmod
tempor incididunt ut labore et. consectetur adipiscing elit, sedLorem ipsum dolor sit amet, consectetur adipiscing elit
X%

Remove Visual Clutter from GraphsUse Color, Saturation, and Visual Indicators Meaningfully
U.S. Department of Commerce | National Oceanic and Atmospheric Administration | NOAA Fisheries | Page 32
Lorem ipsum dolor sit amet, consectetur adipiscing elit, sed
do eiusmod tempor incididunt ut labore et. consectetur sed Lorem ipsum dolor sit amet, consectetur adipiscing elit
X%
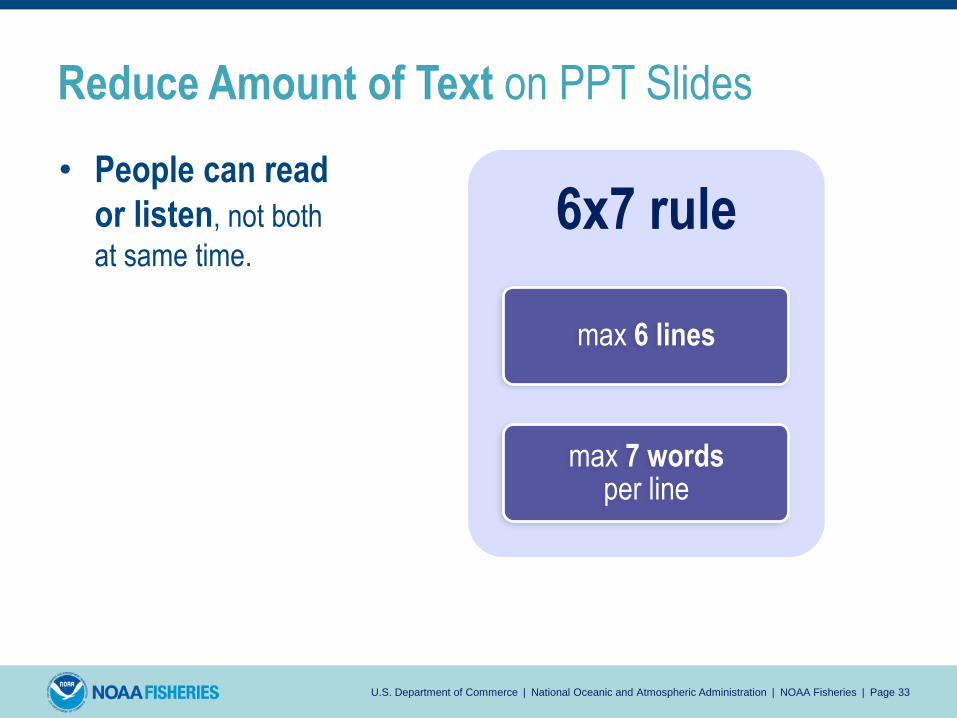
6x7 rule
max 6 lines
max 7 wordsper line
Reduce Amount of Text on PPT Slides
U.S. Department of Commerce | National Oceanic and Atmospheric Administration | NOAA Fisheries | Page 33
• People can read
or listen, not both
at same time.
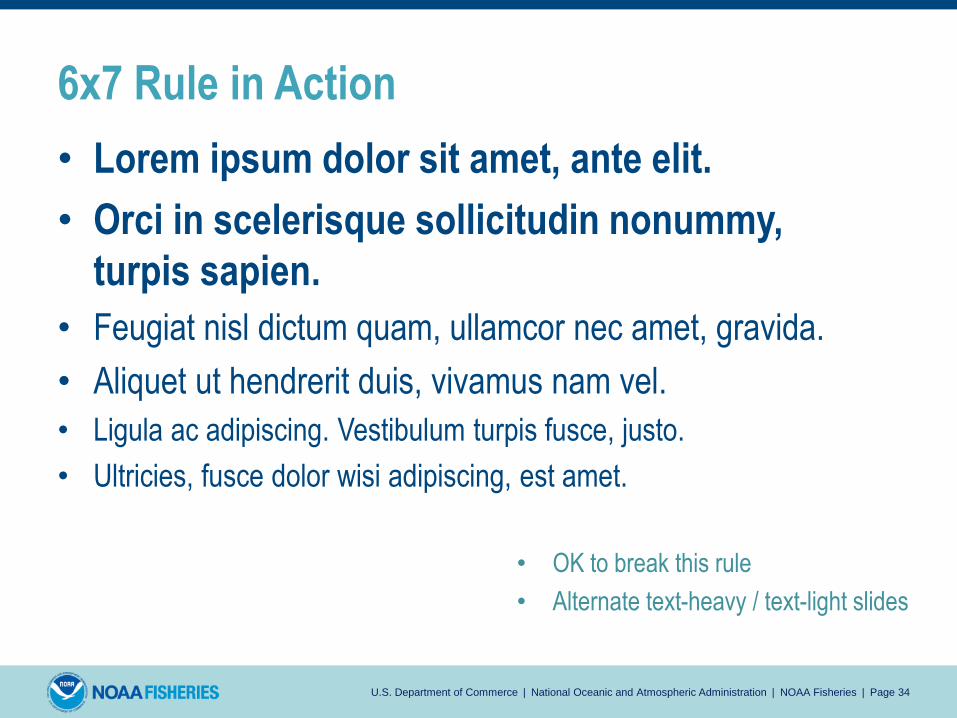
6x7 Rule in Action
• Lorem ipsum dolor sit amet, ante elit.
• Orci in scelerisque sollicitudin nonummy,
turpis sapien.
• Feugiat nisl dictum quam, ullamcor nec amet, gravida.
• Aliquet ut hendrerit duis, vivamus nam vel.
• Ligula ac adipiscing. Vestibulum turpis fusce, justo.
• Ultricies, fusce dolor wisi adipiscing, est amet.
U.S. Department of Commerce | National Oceanic and Atmospheric Administration | NOAA Fisheries | Page 34
• OK to break this rule
• Alternate text-heavy / text-light slides

Example: Reducing PPT Text
U.S. Department of Commerce | National Oceanic and Atmospheric Administration | NOAA Fisheries | Page 35
greater than

Example: Reducing PPT Text
U.S. Department of Commerce | National Oceanic and Atmospheric Administration | NOAA Fisheries | Page 36
Detailed info:
• Say out loud
• Move to…
1) PowerPoint notes
2) Appendix slides
3) Reference docs

Match the Visual to
Your Message
HighlightKey
Information
Declutterto
Simplify
Summary Example
U.S. Department of Commerce | National Oceanic and Atmospheric Administration | NOAA Fisheries | Page 37

U.S. Department of Commerce | National Oceanic and Atmospheric Administration | NOAA Fisheries | Page 38
Low 61%
Medium 14%
Medium High 9%
High 15%
Low 65%
Medium 14%
Medium High 9%
High 13%
Low 47%Medium 22%
Medium High16%
High 14%
Low 59%
Medium 18%
Medium High10%
High 13%
Low 61%
Medium 16%
Medium High10%
High 13%
G1 (Group 1)
Indicator 3
Indicator 2
Indicator 1
Indicator 5
Indicator 4
Low 56%
Medium 16%
Medium High 11%
High 17%
Low 43%
Medium 22%
Medium High 14%
High 22%
Low 22%Medium 20%Medium High 33%
High 25%
Low 52%
Medium 24%
Medium High 13%
High 10%
Low 44%
Medium 22%
Medium High 13%
High 21%
G2 (Group 2)
Indicator 3
Indicator 2
Indicator 1
Indicator 5
Indicator 4
Graph Title Goes Here
Example: Original (modified)

U.S. Department of Commerce | National Oceanic and Atmospheric Administration | NOAA Fisheries | Page 39
Example: Draft 1 (modified)
Graph Title Goes Here
HIGH
MED-
HIGH
MED
LOW
Rankings
G1 G2 G1 G2 G1 G2 G1 G2 G1 G2
Indicator 1 Indicator 2 Indicator 3 Indicator 4 Indicator 5
16%
22%
14% 25% 13% 22% 13% 21% 15% 17% 13% 10%
33%
20%
9%
14%14%
22%
10%
16% 13%
22%
9%
14%
11%
16%
10%
18%
13%
24%
U.S. Department of Commerce | National Oceanic and Atmospheric Administration | NOAA Fisheries | Page 40
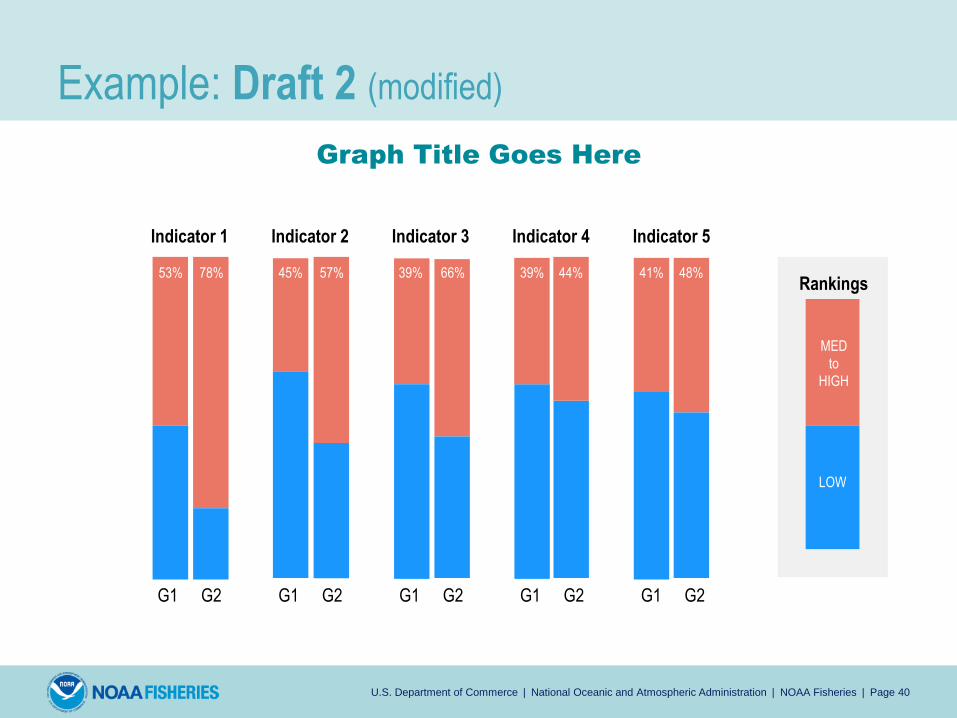
Example: Draft 2 (modified)
Graph Title Goes Here
MED
to
HIGH
LOW
Rankings
G1 G2 G1 G2 G1 G2 G1 G2 G1 G2
Indicator 1 Indicator 2 Indicator 3 Indicator 4 Indicator 5
53% 78% 45% 57% 39% 66% 39% 44% 41% 48%
U.S. Department of Commerce | National Oceanic and Atmospheric Administration | NOAA Fisheries | Page 41
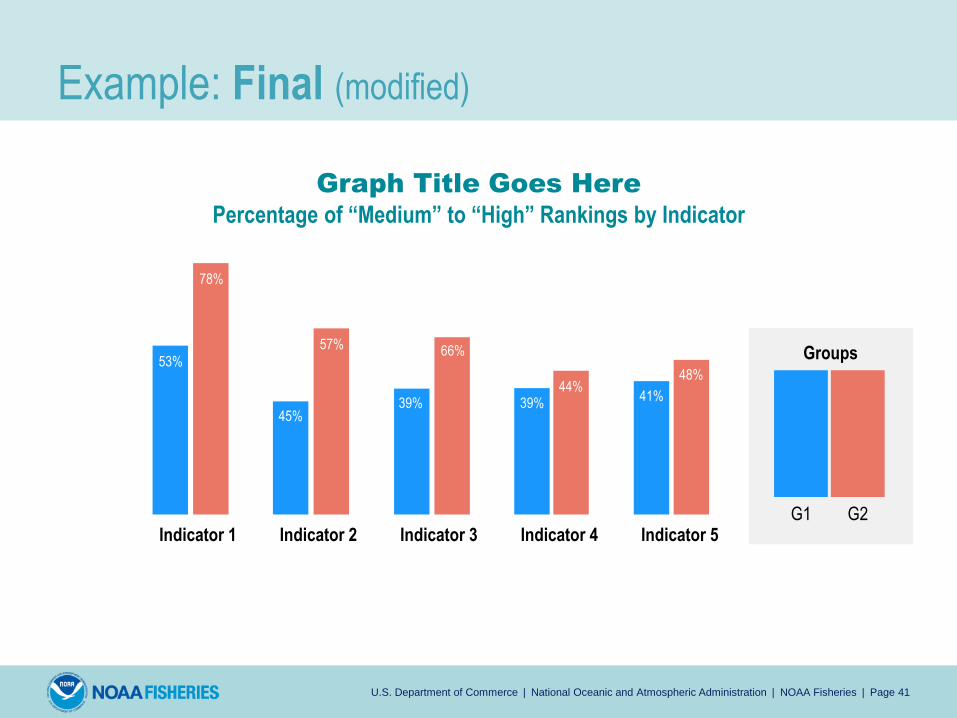
Example: Final (modified)
Graph Title Goes Here
Percentage of “Medium” to “High” Rankings by Indicator
Groups
G1 G2
53%
78%
45%
57%
39%
66%
39%44%
41%
48%
Indicator 1 Indicator 2 Indicator 3 Indicator 4 Indicator 5

U.S. Department of Commerce | National Oceanic and Atmospheric Administration | NOAA Fisheries | Page 42
Low 61%
Medium 14%
Medium High 9%
High 15%
Low 65%
Medium 14%
Medium High 9%
High 13%
Low 47%Medium 22%
Medium High16%
High 14%
Low 59%
Medium 18%
Medium High10%
High 13%
Low 61%
Medium 16%
Medium High10%
High 13%
G1 (Group 1)
Indicator 3
Indicator 2
Indicator 1
Indicator 5
Indicator 4
Low 56%
Medium 16%
Medium High 11%
High 17%
Low 43%
Medium 22%
Medium High 14%
High 22%
Low 22%Medium 20%Medium High 33%
High 25%
Low 52%
Medium 24%
Medium High 13%
High 10%
Low 44%
Medium 22%
Medium High 13%
High 21%
G2 (Group 2)
Indicator 3
Indicator 2
Indicator 1
Indicator 5
Indicator 4
Graph Title Goes Here
Graph Title Goes Here
Percentage of “Medium” to “High” Rankings by Indicator
Groups
G1 G2
53%
78%
45%
57%
39%
66%
39%44%
41%
48%
Indicator 1 Indicator 2 Indicator 3 Indicator 4 Indicator 5
Example: Before + After

Programs + Workflow
• Not only one workflow. Find one to suit your needs.
• If graph produced in analysis software, consider styling elsewhere.
• Don’t have strong visual skills? Consider training 1-2 visual point people in
your office in basic visuals skills/programs.
U.S. Department of Commerce | National Oceanic and Atmospheric Administration | NOAA Fisheries | Page 43
MicrosoftOffice Suite
AdobeCreative Suite
(InDesign, Illustrator, Photoshop)
GoogleSuite
Common Programs

NOAA Fisheries Resources
• Intranet Brand Guide + Templates
• Plain Language Guidance
• NOAA Photos on Flickr
Reading Materials
• Slideologyby Nancy Duarte
• Resonatby Nancy Duarte
• The Visual Display of Quantitative Information by Edward Tufte
Web + PowerPoint Resources
• Lynda.com (paid) or YouTube (free)
• PowerPoint:
• SmartArt graphics
• Add or Format shapes
• Change order of objects
• Edit or Crop images
• Shorten links
Resources
U.S. Department of Commerce | National Oceanic and Atmospheric Administration | NOAA Fisheries | Page 44
• Communications Office
• Office of Science and Technology (ST)
• ST Communications Teamesp. Avi Litwack, Laura Oremland, Cara Mayo
Rita Curtis, John Thibodeau
• ST Staff who provided examples
Acknowledgements
U.S. Department of Commerce | National Oceanic and Atmospheric Administration | NOAA Fisheries | Page 45

U.S. Department of Commerce | National Oceanic and Atmospheric Administration | NOAA Fisheries | Page 46
Q+AContact [email protected]