The School District of Philadelphia Long Range Facilities ... · The School District of...
46
The School District of Philadelphia Long Range Facilities Plan DRAFT November 2011
-
Upload
nguyendung -
Category
Documents
-
view
219 -
download
0
Transcript of The School District of Philadelphia Long Range Facilities ... · The School District of...

The School District of Philadelphia
Long Range Facilities Plan
DRAFT
November 2011

DRAFT- NOT A FINAL APPROVED DOCUMENT
November 2011 Page 1
Table Of Contents Page Executive Summary 2 Introduction 4 Analysis Process 5
-Educational Framework 7 -District Planning Areas 13 -Demographics 20
Census Block Group 22 Enrollment Projections 30
-Facilities-Condition 32 -Review of District Capacity 34 -Review of District Utilization 35 -Community Engagement 38
Overall Recommendations 42

DRAFT- NOT A FINAL APPROVED DOCUMENT
November 2011 Page 2
Executive Summary
One of the major initiatives under the School District of
Philadelphia’s strategic plan, Imagine 2014, is the creation of a
Facilities Master Plan (FMP) which will be a comprehensive,
expandable, and adaptable five-year facilities planning model for
the District. The FMP will align with the Imagine 2014 academic
priorities and strategies for PreK-12 instructional delivery. The
purpose of the FMP will be to allow the District to continuously
review its current real property portfolio, to determine necessary
rightsizing adjustments, and assist in the development of a
comprehensive long range capital plan.
Beginning September 2010, the School District of Philadelphia, with
the guidance of the URS Corporation Team of Consultants has been
working on the development of a long range facilities master plan.
The plan relies on various data relationships to determine which
buildings should be retained, which should be replaced, which
should be renovated/modernized, and which should be
discontinued. The plan also allows for parameters for phasing
implementation of the plan over the course of five [5] years.
The following are some of the key points that should be taken from
the four major sections of this report: Demographics, Educational
Framework, Capacity/Utilization, and Community Engagement.
Demographics
There are currently 1.44 million people living in the school
district boundaries, this is expected to decline to 1.40 mil
people by 2015.
The male/female ratio is 46.5% to 53.5% and is not
expected to change
With regard to racial make-up Caucasians non-Hispanic, and
to a lesser extent, African Americans are expected to
decrease in population
People with Hispanic ethnicity are expected to have the
largest increase in population at 1.6% points by 2015.
Projections
Projected enrollment anticipates a drop of approximately
10,000 students in the next 10 years in District operated
public school enrollment.
This drop is due to declining birth rates and expansion of
school choice in the District.
Overall enrollment for school age children is anticipated to
decrease only slightly. Parochial and Private school
enrollment will slightly decline as well.
Capacity & Enrollment
The district has capacity to serve slightly more than 227,000
students
The district currently serves approximately 154,000
students in district operated schools which leaves over
70,000 excess seats in the District
Elementary (K-5) Utilization is approximately 80%
Middle & High School Utilization is approximately 60%

DRAFT- NOT A FINAL APPROVED DOCUMENT
November 2011 Page 3
Charter School enrollment is expected to increase by about
9,000 between 2010 and 2015
Educational Framework
Capacity/School Size: The goal will be to define the appropriate capacity for schools.
Grade Configuration: The District houses approximately 25 grade configurations, one goal in this plan should be to simplify this while not prohibiting choice and opportunity.
Charter: Charter school enrollment will continue to grow an anticipated 9,000 students over the next 10 years. This plan will address how to manage a Charter School District of almost 50,000 students within the boundary of the District.
Program Equity: Programs distributed for equal access will be a major factor when making facility decisions. Special Education, Magnet, Career and Technical Education and other program distribution will be part of the planning process.
Utilization
The current average utilization across all District buildings is 67%
The amount of excess capacity is approximately 75,000 seats
Increasing the District’s utilization to 75%, 85% or 95%
(from the current 67%) requires the following approximate
reduction of seats in the District:
o To achieve 75% Utilization, reduce 33,800 seats
o To achieve 85% Utilization, reduce 41,500 seats
o To achieve 95% Utilization, reduce 60,300 seats
Community Engagement
Throughout the process, numerous community meetings have been
conducted to gain input on what the public thinks the District
should be doing to achieve equity across the District’s educational
facilities and to inform the public about the process. In the first
round of meetings, the public was provided with insight on the
process that would be used to form the master plan and the public
was asked to prepare a list of “Must Haves”; capturing the view of
the public on what every school in Philadelphia should have. The
responses fell into three general categories, Education related,
Facilities, Safety related and, Comfort and Cleanliness.
The second round of meetings focused on clarifying the FMP
process, gaining feedback on the decision factors and their use in
the process, and determining what the public would consider as
successful implementation of the project.
The third round of meetings met in a series of six stakeholder
community workshops. Philadelphia School District staff solicited
public input via question and answer forums on the Facilities Master
Plan’s Adaptive Reuse and Right-Sizing policies. A presentation was
provided to outline right-sizing criteria and options as well as facility
reutilization components. The summary below highlights
stakeholder questions pertaining to the four key themes listed. A
total of 30 questions were recorded during these meetings but were
compiled to avoid redundancy for this report. The key themes
were: Facility Capacity/Utilization, Increased Civic Engagement,
Special Needs Education and School Safety

DRAFT- NOT A FINAL APPROVED DOCUMENT
November 2011 Page 4
Introduction
The School District of Philadelphia (SDP) is committed to providing the greatest educational experience for all students enrolled in its schools. To ensure this commitment, the School District realizes that school
facilities need to be maintained and reflect environments conducive for learning and teaching. SDP also realizes that the highest level of efficiency needs to be maintained for the school district’s entire facility inventory. This facility study is more than just an examination of building conditions. It will also take into consideration enrollments, capacities, the desired educational framework, programmatic vision and finances. This process was entered as a proactive approach for exploring long-term facility options of determining which schools to build new, renovate, consolidate, and discontinue. Today, the School District of Philadelphia has 257 District operated schools, including 61 high schools, 25 middle schools and 171 elementary schools. Enrollment in Philadelphia schools for the 2010-2011 school year was 154,357 students. That number is expected to decline to 146,289 in the next five years. Operating with 25 grade configurations and significant variations in edcuational quality, equity and cost effectiveness, the District now sees a need to “right-size” the District in order to provide the best learning options for the students of Philadelphia. The objective of the the School District of Philadelphia is clear; to move to a system of quality schools that promote high student achievement in the most equitable and cost effective manner. The District expects to achieve that through this Facilities Master Plan.
The purpose of creating a long range facilities plan is to create appropriate, quality learning environments for the students and all users of school facilities in a District. A facilities plan, however is not only about buildings and condition improvement, it is a combination of those combined with
program/curriculum visioning, appropriate utilization for those facilities, community use, and neighborhood impacts. Though many Districts across the country engage in long range facilities planning processes, each District brings its own unique influences and local priorities and visions when it comes to shaping the short and long term dispositions of buildings, as is the case in the School District of Philadelphia. The School District of Philadelphia experiences many challenges faced in an urban environment, therefore the process will require multiple phases in a systematic approach to create a successful long term plan. This plan acknowledges, first of all, the importance of curriculum and programs that are served within the school facilities. The ultimate goal will be to provide facilities shaped around the functions for which they are intended. However, it is a priority in this process to address the excess capacity and empty seats in the District. Analysis indicates 70,000+ empty seats exist within the District. This amount of excess capacity leads to inefficiencies such as distribution of teachers and resources, curricular program alignment, and spending on utilities and maintenance.

DRAFT- NOT A FINAL APPROVED DOCUMENT
November 2011 Page 5
Analysis Process
Phase 1- Seat Reduction Strategy The District, along with the URS Team of consultants set out to create a plan that promotes efficiencies of utilization within its facilities. Current status indicates approximately 70,000+ empty seats in the District. Corrective action for seat reduction must occur to determine the next stages of planning. Once the number of empty seats was determined and a plan for seat reductions was determined, the following actions/decisions needed to be prioritized in order to make final determinations of where schools would fall in the Long Range Master Plan:
what programs will exist in buildings;
alignment of feeder schools and programs;
what standardization of grade configuration will occur;
what corrective condition and/or adequacy improvements will be made to remaining facilities;
what are the cost savings for implementing this plan;
what are the cost investments for implementing this plan? In Phase 1 the District and the School Reform Commission (SRC) were asked to provide input on the following:
1. Are there strategies to reduce capacities without impacting existing school facilities, i.e. annexes, leased spaces, surplus properties?
2. What will be the mandates for school closure including criteria, community input, and timeline?
3. Are the capacity ranges of school size identified in this report appropriate for the District?
Phase 2- Long Range Facility Planning
Phase 2 of the process implemented the direction from the District
and SRC regarding seat reduction strategies. This stage of the
process included high public visibility and allowed an open process
in which the input of stakeholders assisted in shaping the long term
facility vision of the District.
The process proceeded as follows:
Community Presentation of Prioritization and Process
Prioritization of strategies to reduce number of seats in the
District to include (but not limited to):
o Building conditions and adequacy;
o Enrollment and demographic trends;
o Educational Framework;
o Program alignment and accessibility including:
Special Education
Early Childhood
Career and Technical Education
Accelerated or Magnet programs
Empowerment Schools;
o Charter School Capacity;
o Transportation;
o Boundary impacts;
o Cost Impacts- both savings and investment
Development of Recommendations based on strategies
and community input

DRAFT- NOT A FINAL APPROVED DOCUMENT
November 2011 Page 6
Phase 2 is meant to create the vision for both short and long term
facility goals of the District. The end goals being:
GOALS:
Address seat reduction strategy;
Improve the condition and educational adequacy of
facilities;
Create strategies that make corrective actions to facilities as
conditions, enrollments, programs, and demographics
change;
Create both short and long term strategies for Charter
School presence in the District;
Create a standardized approach to grade configuration
without jeopardizing opportunities and multi-pathways for
learning;
Create an alignment of school feeder patterns and program
alignment;
Provide a plan for the multiple programs that are
implemented in schools, i.e. Special Education, early
childhood, career/technical education;
Provide timelines and milestones for implementation;
Engage the community in an open process that invites their
input
Phase 3- Implementation
Phase 3 involves sharing the Options determined for schools,
gaining buy-in and approval from the School Reform Commission
and implementing the approved changes. This Phase is
theoretically ongoing since ultimately the decisions made will
require continuous review of process and input as well as dialogue
with the community.

DRAFT- NOT A FINAL APPROVED DOCUMENT
November 2011 Page 7
Educational Framework
The educational framework is the basis from which the District’s facility needs will be addressed and provides direction for the development of the facility plan options regarding future building actions of the School District of Philadelphia. It will be this document that provides the guiding principles as the District moves into the future of the long range plan. Based on experiences from other large districts across the country, it has been learned that collaboration between all of the structures within a district is key to the success of a plan. A plan, to be successful, needs to have a life beyond the tenure of the individual administrator. This requires collaboration and a collective buy-in to the development of the plan and the final plan itself. The framework determined by the School District of Philadelphia includes programmatic recommendations critical to its Educational and facility master plan. The following pages identify board policies that impact these plans and processes. Each issue has been reviewed and approved by the District and has provided the planning team with direction in determining solutions for future facility needs.
Grade Configuration Grade configuration is an important and often difficult decision that school districts must confront. There are several components involved in this discussion. For example, should there be a uniform grade configuration throughout the entire district or several configurations that are acceptable? What grade configuration most supports the curriculum and extra-curriculums the district is promoting? Should pre-kindergarten programs be housed in a separate, dedicated facility or be distributed at each elementary school? How do we best deal with the two grade levels that are most often problematic; grades six and nine?
Uniformity in grade configurations can be challenging as there are numerous supporters of the varied configurations that exist. Urban environments tend to have even more challenges. Currently PSD has twenty-five (25) grade configurations. Though this offers a variety of learning opportunities, it also creates a complicated system to navigate. The number of transitions that students must make as they progress from grade to grade is also a factor in determining the grade configuration. Students in districts that opt to have “paired” elementary schools where, for example, only two grades are housed per building [example: K-1, 2-3, 4-5, 6-8, 9-12] have many more transitions than students in a K-8, 9-12 district. Recommendations for grade configuration will state a move to a more standardized approach that perhaps allow for the same learning opportunities in a less complicated system. Whether to include pre-kindergarten programs in each elementary school or group the students in a separate, dedicated facility is another issue relating to grade configuration. Proponents of the dedicated facility will cite facility design and ease of program as advantages, but parents often prefer having all or some of their children in the same school for several years. Programs in each elementary school also provide pre-kindergarten students early exposure to the elementary program they will enter the following year. The middle school, on the other hand, was conceived as more a child centered institution with “responsive practices” such as interdisciplinary team teaching, advisory programs, and flexible scheduling. The middle school also offers a more varied curriculum and more elective or exploratory classes that are usually available at junior high schools or K-8 schools. The trend shift to the middle school concept also reflected a change of the placement of where 6th and 9th graders were placed.

DRAFT- NOT A FINAL APPROVED DOCUMENT
November 2011 Page 8
Districts most often struggle with how best to respond to grades 6 and 9. Discussions center around whether grade 6 belongs with the younger elementary students or the older middle school students. It is a time of great change in a student’s life and can be extremely difficult as the students are dealing with changes physically, emotionally, and academically. The same discussion could be applied to students in grade 9.
IMPLEMENTATION
The School District of Philadelphia has determined that a K-5, 6-8, 9-12 model is best for them with some variations to accommodate parent and student choice, as well as special programming opportunities. As a result of this determination, many schools will be impacted with grade configuration changes.

DRAFT- NOT A FINAL APPROVED DOCUMENT
November 2011 Page 9
School Capacity
The capacity of a school reflects how many students the school’s physical facility can serve effectively. There are several methods used to calculate a school’s capacity. The following methods are a couple of such approaches: core capacity and program capacity. Core capacity is defined as the number of students that can be served by the dining area in a reasonable number of lunch shifts (3). It is not how many students will fit into those spaces at one time; such as the capacity limit posted near the door of each dining room and media center. Instead, core capacity indicates the total enrollment that can be served by those facilities. Core capacity is calculated by dividing the square footage of the school’s dining room by a state-determined factor. This calculation is somewhat isolated and may not be the best formula to use for planning purposes. Program capacity is set by the district and reflects an ideal class size for each program. These numbers are based on a pupil/teacher ratio that is desirable for producing optimum levels of student achievement. Program Capacity does not take into consideration the square footage of a specific classroom, only the recommended pupil/teacher ratio for the program being delivered in that classroom. A kindergarten classroom’s program capacity is 18, no matter how many square feet the room has. There are three types of program capacity -- Permanent Program Capacity, Area Adjusted Capacity, and Gross Program Capacity.
Permanent Program Capacity (or Room Count Capacity) represents the number of students who can be served in the permanent facility based on the programs offered – spaces designed for instruction. (Modular classrooms and “quads” are counted as permanent structures).
Area Adjusted Capacity represents the number of students who can be served in the permanent capacity space but has been adjusted based on the size of the classroom. If a room that has a capacity of 25 is supposed to be 900 square feet and the room is 600 square feet, then the capacity is less 1/3 making it have a capacity of 18.5 students.
Gross Program Capacity represents the number of students who can be served both in the permanent facility and temporary portables and annexes based on the programs offered – spaces designed for instruction.
IMPLEMENTATION
For the purposes of this study, capacity will utilize a modified approach to program capacity to determine the number of seats in the District. With data received by the District, the number of learning spaces was calculated for both primary (K-5) and secondary (6-12) facilities. It was determined that one of two assignments of class size could be used at each level:
PSD Teacher contract numbers which allow up to 33 students per classroom at each grade level, or;
Adjusted lower class-size in alignment with recent ‘stimulus’ dollar implementation which lowers Primary to 26.5 per classroom and Secondary to 28 per classroom
After this capacity was determined it was then adjusted to 75% of that capacity to account for other uses of space that occurs in the school facilities such as (but not always limited to):
Adjustments for lower class size in Special Education
Special programs implemented on a local school level
Creation of space not provided in original design of facility such as: teacher work spaces, technology/server rooms, etc.

DRAFT- NOT A FINAL APPROVED DOCUMENT
November 2011 Page 10
School Size
School size is a highly charged issue on the educational landscape. It is often cited that small schools offer several benefits, such as increased relationship quality among teachers and students, better discipline control, and superior student performance. However, there are concerns that smaller schools limit program offerings, result in budgetary problems, and require an increased number of already limited school sites. The “school-within-a-school” model has been cited as a possible strategy to allow for the benefits of a small school within a larger environment.
IMPLEMENTATION
This report lends no favor in this debate, but takes an objective approach to determining appropriate sizes of schools based on factors that most benefit students. This determination is just one of many factors that were used to decide both how to reduce the number of empty seats in the District (phase 1 of the planning process) and then apply the appropriate actions to take on the seats that still remain. As part of the development of the schools sizes, District personnel specializing in curriculum at each grade level were interviewed to create a practical approach to school size in Philadelphia. It is clear that school size is not a ‘boiler plate’ answer in this District. It is also clear through conclusive research that schools that house students that are in impoverished or lower socio-economic conditions will benefit more in smaller school environments. Recognizing that smaller school sizes may offer less program offerings, but understanding that program offering is not limited or confined by walls. Discussion occurred within the District over several days as to what is the appropriate school size for each grade level. The following are the results of those meetings.
Elementary Effective grade level teaming will be important to the success of each child. As students enter elementary schools there is a wide spectrum of knowledge or learning levels, and the increasing practice of differentiated teaching delivery adds to the level of resources needed to deliver an effective program. Therefore it is important to provide a variety of teacher resources and skill sets for each grade level. The appropriate number of teachers at each grade level will lead to the overall staffing of the school, ultimately determining the size of the school. Middle Schools The middle school model is shaped around the ability for team teaching allowing for multiple subject areas to be housed in smaller learning communities centered on grade groupings of 100 to 150 students. Size of middle schools will be determined by the effective number of teams located in a specific building. In order to meet the objectives stated here, the School District of Philadelphia has determined that the optimal size for middle schools in the region is approximately 600 to 800 students. K-8 Schools The implementation of K-8 schools in urban centers around the country has caused much debate with the focus on the impact of middle grades students at the center of this debate. Research (and debate) indicates that there are benefits and challenges provided by a K-8 configuration. For Philadelphia specifically the K-8 model has provided a ‘long-term’ home for students and parents in which the student generally is able to remain in the same environment for up to nine (9) years. This has allowed parents and students to become more engaged in their specific building as long lasting relationships are built. However, the challenge has been at the middle school level, because of the number of students enrolled, access to certain

DRAFT- NOT A FINAL APPROVED DOCUMENT
November 2011 Page 11
programs and space types are more limited than a traditional middle school program, possibly limiting students access to exploratory or elective classes normally offered with larger enrollments. Although the District understands that the K-8 model presents some challenges, it has also seen the advantages of this model in certain settings and thus has considered it in its final grade configurations. In order to meet the objectives stated here, the School District of Philadelphia has determined that the optimal size for K-8 schools in the region is approximately 450 to 800 students. High Schools High school size will vary in a district as large as Philadelphia. There are many debates in favor of small high schools and certainly resources can be better allocated within certain ranges of sizes. For the smaller school structures, this may mean that some schools house more students, but the school-within-a-school approach should be implemented. In order to meet the objectives stated here, the School District of Philadelphia has determined that the optimal size for High Schools in the region is approximately 1,000 to 1,200 students.

DRAFT- NOT A FINAL APPROVED DOCUMENT
November 2011 Page 12
Charter Schools
In developing a facility plan, charter student enrollment will have a major impact regarding building new schools or adding to existing facilities. It was important to determine where charter school students were coming from and how many students will ultimately be taken from the public school population. Additionally, it was vital to determine where the charter schools might exist within the District.
Although charter school location and enrollment create major district facility planning challenges, additional considerations further exacerbate the entire process. The number of charter schools within the district is not an absolute. Local authority could increase the number of allowable charters throughout the District. Lack of a dedicated revenue stream for capital outlay and increasing costs associated with operating a school could conceivably compel some charter schools to close, forcing a return of their students to district schools. The inability of a charter school to meet the performance goals of their charter school agreement would necessitate termination of the charter, again forcing a return of their student population to district schools.
Implementation
The growth of Charter Schools in Philadelphia is as large as any urban district in the country. As population shifts, enrollments decline and the demand for multiple learning opportunities increase, this trend will continue. The unique challenge for Philadelphia will be “what is the point of either ‘saturation’ of charter schools or the ability to provide effect charter programs?” Though it is understood that the charter network would like to grow, there are limitations such as availability of learning environments, charter initiatives that do not want to grow, and possible limited availability of new quality/effective charters.
Charter schools are beginning to be more selective in the facilities that will be offered to them through consolidation. Many of the schools that are closed are either too large for the charter purpose or in a condition that is felt not suitable for the program. Also, charter programs may not want to expand, explained by the fact that their effectiveness comes in the limited enrollment allowing for a more focused approach. Finally, the Charter initiative in Philadelphia has been provided enough background to realize the importance of quality charter offerings and will become more selective as to what new charter programs will come into the District. Charter grade configurations are just as complex as the School District of Philadelphia. Last year, the School Reform Commission (SRC) granted one year grade and enrollment modifications. Because of the small number, some schools chose to add students to their current population, rather than expand grades. The current charter program capacity is approximately 39,700 for K-12 with enrollment at approximately 36,000 students.

DRAFT- NOT A FINAL APPROVED DOCUMENT
November 2011 Page 13
District Planning Areas Due to the number of schools and the large enrollment of the School District of Philadelphia the planning process will divide the District into six smaller manageable planning areas. These planning areas were determined by the City of Philadelphia’s eighteen *18+ city planning areas. The eighteen planning areas were then grouped in to larger planning areas to create a greater number of options for long and short term facility decisions. The six planning areas are: North-Central, Northeast, Northwest, South-Central, Southwest, and West.
This will provide the opportunity to examine the facility needs of a geographic area and work collaboratively with community members to formulate options and recommendations for schools.
The six planning areas are outlined in the adjacent map and defined on the next several pages.

DRAFT- NOT A FINAL APPROVED DOCUMENT
November 2011 Page 14
North-Central Planning Area City Planning Areas 1, 7, & 9
Area 1 Area 7 Area 9 Elementary Schools Elementary Schools Elementary Schools Barton, Clara Allen, Ethel D. Adaire, Alexander Bethune, Mary McLeod Blaine, James G. Bridesburg Cayuga Dick, William Brown, Henry A. Cleveland, Grover Duckrey, Tanner Hackett, Horatio B.
Clymer, George Dunbar, Paul Laurence Richmond Cramp, William Ferguson, Joseph Webster, John H. deBurgos, Julia Gideon, Edward Willard (replacement) Elkin, Lewis Harrison, William Willard (old, closed) Fairhill Hartranft, John F. Feltonville Hunter, William H. Feltonville Int. School Kelley, William D. Hopkinson, Francis Ludlow, James R. Juniata Park Academy McKinley, William Kenderton Meade, General George G. McClure, Alexander K. Moffet, John Munoz-Marin, Luis Morris, Robert Peirce, Thomas M. Pratt, Anna Potter-Thomas Reynolds, General John Sheppard, Isaac Stanton, M. Hall Sheridan, Philip H. Welsh, John Steel, Edward Wright, Richard Taylor, Bayard Whittier, John Middle Schools Middle Schools Middle Schools Alternative Ed. Regional Ctr. FitzSimons, Thomas AMY at James Martin Clemente, Roberto Walton, Rudolph S. Conwell, James Feltonville SAS (Closed) Jones, John Paul Gillespie, Elizabeth Duane (CLOSED)
Penn Treaty
Muhr, Simon Sheridan West Rhodes, E. Washington . High Schools Boone, Daniel High Schools Carver, George Washington High Schools Edison, Thomas A. Dobbins, Murrell (AVTS) Carroll, Charles Gratz, Simon Elverson, James Douglas, Stephen A. Randolph Skills Center Kensington (CAPA) Kensington HS Penn, William Kensington for Culinary Arts Strawberry Mansion Kensington Urban Ed Acad Vaux, Roberts Mastbaum, Jules E. (AVTS)
DRAFT- NOT A FINAL APPROVED DOCUMENT
November 2011 Page 15
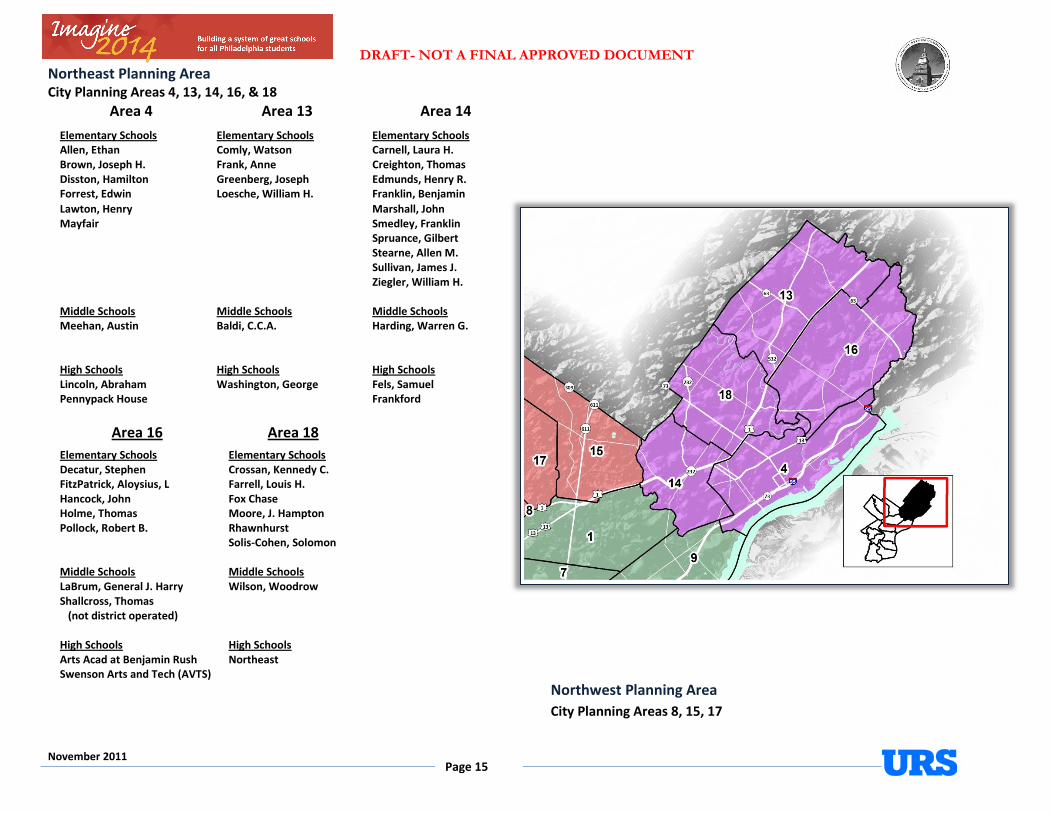
Northeast Planning Area City Planning Areas 4, 13, 14, 16, & 18
Area 4 Area 13 Area 14
Elementary Schools Elementary Schools Elementary Schools Allen, Ethan Comly, Watson Carnell, Laura H. Brown, Joseph H. Frank, Anne Creighton, Thomas Disston, Hamilton Greenberg, Joseph Edmunds, Henry R. Forrest, Edwin Loesche, William H. Franklin, Benjamin
Lawton, Henry Marshall, John Mayfair Smedley, Franklin Spruance, Gilbert Stearne, Allen M. Sullivan, James J. Ziegler, William H. Middle Schools Middle Schools Middle Schools Meehan, Austin Baldi, C.C.A. Harding, Warren G. High Schools High Schools High Schools Lincoln, Abraham Washington, George Fels, Samuel Pennypack House Frankford
Area 16 Area 18
Elementary Schools Elementary Schools Decatur, Stephen Crossan, Kennedy C. FitzPatrick, Aloysius, L Farrell, Louis H. Hancock, John Fox Chase Holme, Thomas Moore, J. Hampton Pollock, Robert B. Rhawnhurst Solis-Cohen, Solomon Middle Schools Middle Schools LaBrum, General J. Harry Wilson, Woodrow Shallcross, Thomas (not district operated) High Schools High Schools Arts Acad at Benjamin Rush Northeast Swenson Arts and Tech (AVTS)
Northwest Planning Area
City Planning Areas 8, 15, 17

DRAFT- NOT A FINAL APPROVED DOCUMENT
November 2011 Page 16
Area 8 Area 15 Area 17
Elementary Schools Elementary Schools Elementary Schools Cook-Wissahickon Birney, General David B. Day, Anna Blakiston Dobson, James Cooke, Jay Emlen, Eleanor C. Levering, William Edmonds, Franklin S. Fitler, Edwin H. Mifflin, Thomas Ellwood Fulton, Robert
Shawmont Finletter, Thomas K. Henry, Charles W. Howe, Julia Ward Houston, Henry W. Kinsey, John L. Jenks, John S. Logan, James Kelly, John B. Lowell, James R. Lingelbach, Anna L. Marshall, Thurgood Pastorius, Francis McCloskey, John F. Wistor, John Morrison, Andrew J. Olney Pennell, Joseph Pennypacker, Samuel Prince Hall Rowen, William Widener Memorial Middle Schools Middle Schools Middle Schools Leeds, Morris E. Amy Northwest Wagner, General Louis Hill, J.E./Sampson Freedman Washington Jr., Grover Lewis, Ada H
(closed). Roosevelt, Theodore High Schools High Schools High Schools Lankenau Central King, Martin Luther Roxborough Girls HS Germantown Saul, Walter B. (AVTS) Olney East Parkway Northwest Olney West

DRAFT- NOT A FINAL APPROVED DOCUMENT
November 2011 Page 17
South-Central Planning Area City Planning Areas 3, 5, 12
Area 3 Area 5 Area 12
Elementary Schools Elementary Schools Elementary Schools Arthur, Chester A. Alcorn, James Bache/Martin Bregy, F. Amedee Greenfield, Albert M. Childs, George W. Kearny, General Philip Fell, D. Newlin
McCall, General George A. Girard, Stephen Meredith, William M. Jackson, Andrew Spring Garden Jenks, Abram Stanton, Edwin M. Key, Francis Scott Waring, Laura W. Kirkbride, Elizabeth B. McDaniel, Delaplaine Nebinger, George W. PLA South (King of Peace) Sharswood, George Smith, Walter George Southwark Taggart, John H. Vare, Abigail Washington, George Middle Schools Middle Schools Middle Schools Masterman, Julia R Barratt, Norris S. Girard Academic Music Thomas, George C. Vare, Edwin H. High Schools High Schools High Schools Academy at Palumbo Audenried, Charles Y. Bodine, William W. Bok, Edward (AVTS) Constitution Creative and Performing Arts Franklin Learning Center Furness, Horace Franklin, Benjamin South Philadelphia Peirce, William S. Science Leadership Academy Stoddart-Fleisher
2 schools HSBT & PCC
DRAFT- NOT A FINAL APPROVED DOCUMENT
November 2011 Page 18
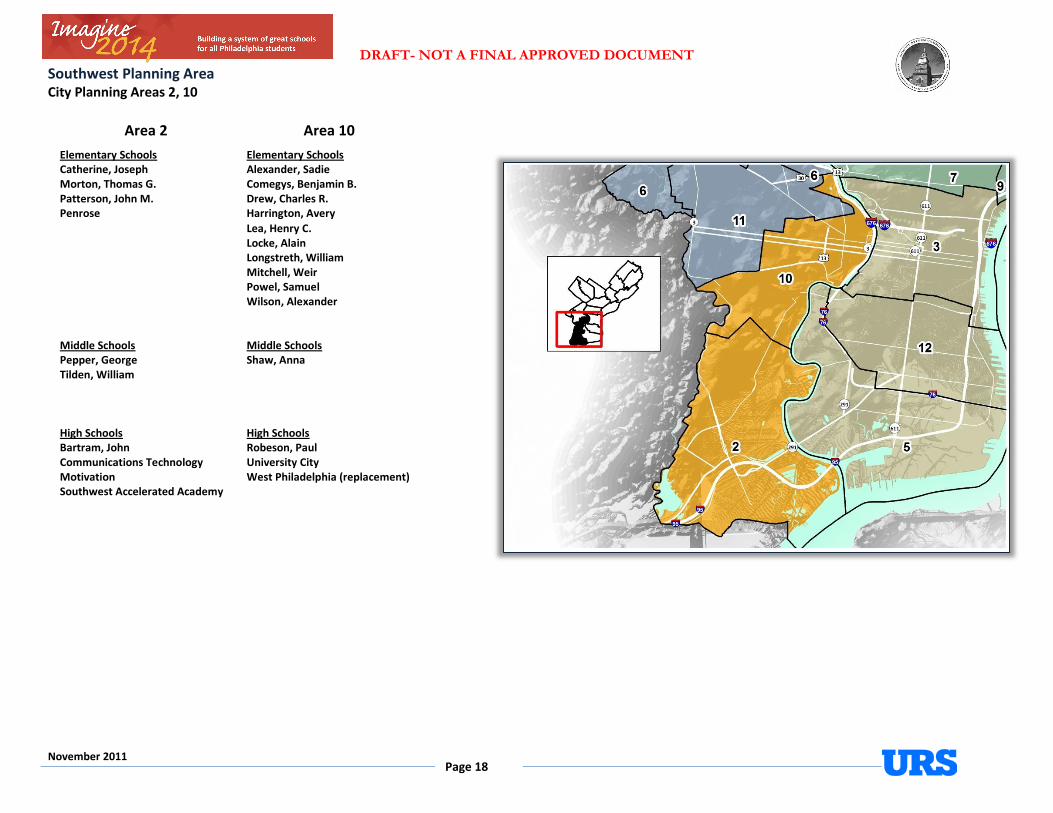
Southwest Planning Area City Planning Areas 2, 10
Area 2 Area 10
Elementary Schools Elementary Schools Catherine, Joseph Alexander, Sadie Morton, Thomas G. Comegys, Benjamin B. Patterson, John M. Drew, Charles R. Penrose Harrington, Avery
Lea, Henry C. Locke, Alain Longstreth, William Mitchell, Weir Powel, Samuel Wilson, Alexander Middle Schools Middle Schools Pepper, George Shaw, Anna Tilden, William High Schools High Schools Bartram, John Robeson, Paul Communications Technology University City Motivation West Philadelphia (replacement) Southwest Accelerated Academy
DRAFT- NOT A FINAL APPROVED DOCUMENT
November 2011 Page 19
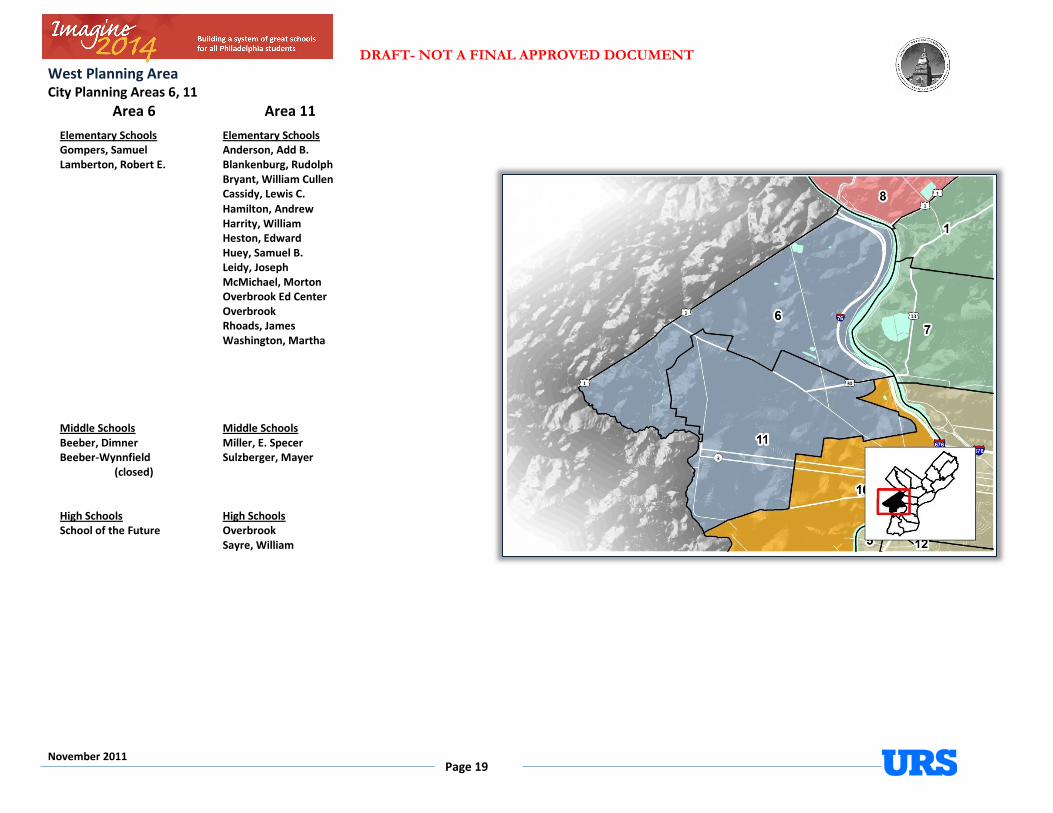
West Planning Area City Planning Areas 6, 11
Area 6 Area 11
Elementary Schools Elementary Schools Gompers, Samuel Anderson, Add B. Lamberton, Robert E. Blankenburg, Rudolph Bryant, William Cullen Cassidy, Lewis C.
Hamilton, Andrew Harrity, William Heston, Edward Huey, Samuel B. Leidy, Joseph McMichael, Morton Overbrook Ed Center Overbrook Rhoads, James Washington, Martha Middle Schools Middle Schools Beeber, Dimner Miller, E. Specer Beeber-Wynnfield Sulzberger, Mayer
(closed) High Schools High Schools School of the Future Overbrook Sayre, William

DRAFT- NOT A FINAL APPROVED DOCUMENT
November 2011 Page 20
Demographics - Block Group Projections
Included are block group estimates and projections provided by ESRI Business Information Solutions (ESRI BIS). ESRI BIS uses a time series of estimates from the U.S. Census Bureau that includes the latest estimates and intercensal estimates adjusted for error of closure. The Census Bureau’s time series is consistent, but testing has revealed improved accuracy by using a variety of sources to track county population trends. ESRI BIS also employs a time series of building permits and housing starts plus residential deliveries. Finally, local data sources that tested well against Census 2000 are reviewed. Data sources are integrated and then analyzed by Census Block Groups. Sources of data include:
Supplementary Surveys of the Census Bureau
Bureau of Labor Statistics’ (BLS) Local Area Unemployment Statistics
BLS Occupational Employment Statistics
InfoUSA
U.S. Bureau of the Census’ Current Population Survey
National Planning Association Data Service Below is a list of definitions as they appear on the U.S. Census Bureau website, to aid in interpretation of the following tables and maps. Household: A household includes all the people who occupy a housing unit as their usual place of residence. Average family size: A measure obtained by dividing the number of members of families by the total number of families (or family householders).
Family household (Family): A family includes a householder and one or more people living in the same household who are related to the householder by birth, marriage, or adoption. All people who are related to the householder are regarded as members of his or her family. A family household may contain people not related to the householder, but those people are not included as part of the householder’s family in census tabulations. Thus, the number of family households is equal to the number of families, but family households may include more members than do families. A household can contain only one family for purposes of census tabulations. Not all households contain families since a household may comprise a group of unrelated people or one person living alone. Householder: The person, or one of the people, in whose name the home is owned, being bought, or rented. If there is no such person present, any household member 15 years old and over can serve as the householder for the purposes of the census. Two types of householders are distinguished: a family householder and a nonfamily householder. A family householder is a householder living with one or more people related to him or her by birth, marriage, or adoption. The householder and all people in the household related to him are family members. A nonfamily householder is a householder living alone or with nonrelatives only.

DRAFT- NOT A FINAL APPROVED DOCUMENT
November 2011 Page 21
The following tables illustrate the current estimates and 5 year population projections based on block groups that comprise the School District and meeting area, indicating areas of current and projected growth. The tables have been developed to determine selected age group projections and projections for household income, family size, and family income. The total population in the School District of Philadelphia is 1,440,119. This population is projected to decrease by 38,773 people, or approximately 3% over a 5-year period. The 0-18 year-old population in the District currently totals 364,078. This population is projected to decrease by 16,398 children, or approximately 5 percent.
School District of Philadelphia2010 Population
Estimate
2015 Population
Projection
Total Population 1,440,119 1,401,346
Ages 0-4 94,528 91,562
ES Ages (5-10) 115,253 113,114
MS Ages (11-13) 54,013 55,951
HS Ages (14-18) 100,284 87,054
Total Ages 0-18 364,078 347,680
Average Age 36 37
Source: ESRI BIS
0
20,000
40,000
60,000
80,000
100,000
120,000
140,000
Ages 0-4 ES Ages (5-10) MS Ages (11-13) HS Ages (14-18)
School District of Philadelphia Population Estimates & Projections by Age Group
2010 Population Estimate 2015 Population Projection

DRAFT- NOT A FINAL APPROVED DOCUMENT
November 2011 Page 22
Demographics- Block Group Data
Average Age; Block Information The data below outlines average age within each census block group for 2010.
This map illustrates the same data using projections for 2015.

DRAFT- NOT A FINAL APPROVED DOCUMENT
November 2011 Page 23
Median Income; Block Information The data below outlines median income within each census block group for 2010.
The Map below illustrates the same data but with estimates for 2015.

DRAFT- NOT A FINAL APPROVED DOCUMENT
November 2011 Page 24
Population Growth (Decline)
In most areas we are projecting declines in population growth with exceptions in several specific areas of the City.

DRAFT- NOT A FINAL APPROVED DOCUMENT
November 2011 Page 25
Age and Demographic Distribution Data regarding school age children and their demographic distribution shows slight declines in most categories with a few notable exceptions.
Slight increases in the categories: Asian, Hispanic, and Other
Flat projection for Middle School age students.
0
50,000
100,000
150,000
Ages 0-4 ES Ages (5-10) MS Ages (11-13) HS Ages (14-18)
School District of Philadelphia Population Estimates & Projections
by Age Group
2010 Population Estimate 2015 Population Projection
YEAR WHITE BLACK AMER IND ASIAN PACIFIC ISLANDER OTHER MULTIPLE Total HISPANIC
2010 583,773 631,267 5,744 83,928 982 96,547 37,879 1,440,119 173,679
2015 549,754 608,327 6,100 89,921 997 107,390 38,856 1,401,346 192,087
YEAR WHITE BLACK AMER IND ASIAN PACIFIC ISLANDER OTHER MULTIPLE Total HISPANIC
2010 40.5% 43.8% 0.4% 5.8% 0.1% 6.7% 2.6% 100.0% 12.1%
2015 39.2% 43.4% 0.4% 6.4% 0.1% 7.7% 2.8% 100.0% 13.7%
Year Male Female Total
2010 669,984 770,135 1,440,119
2015 652,189 749,157 1,401,346
Year Male Female Total
2010 46.5% 53.5% 100.0%
2015 46.5% 53.5% 100.0%

DRAFT- NOT A FINAL APPROVED DOCUMENT
November 2011 Page 26
Demographics- Enrollment The next several pages provide a brief overview of the enrollment projections and block group projected demographics. Accurately forecasting the future enrollment is a critical component to the development of a long range facilities plan.
HISTORICAL ENROLLMENT Over the past five years, student enrollment in the School District of Philadelphia has decreased by 11,207 students in grades K – 12. Total enrollment for the 2010-11 school year is 154,357 students. The following graph illustrates the District’s K – 12 enrollment history from 2006-07 through 2010-11.
The following tables illustrate the District’s enrollment history from 2006-07 through 2010-11.
Grade 2006-07 2007-08 2008-09 2009-10 2010-11
K 12,586 12,252 12,430 13,039 12,496
1 13,341 13,074 12,991 13,444 13,069
2 13,099 12,571 12,607 12,574 12,428
3 12,579 12,645 12,271 12,432 11,872
4 12,747 12,376 12,493 12,263 11,770
5 12,683 12,328 12,027 12,306 11,264
6 12,867 11,964 11,799 11,753 11,268
7 13,154 12,058 11,330 11,377 10,753
8 13,843 13,167 11,960 11,447 10,804
9 15,431 14,774 13,746 13,572 13,373
10 12,495 13,210 12,492 13,016 13,028
11 9,960 9,593 10,242 10,858 11,366
12 10,779 10,961 10,143 11,180 10,866
K - 12 Total 165,564 160,973 156,531 159,261 154,357
Grade 2006-07 2007-08 2008-09 2009-10 2010-11
K - 5 77,035 75,246 74,819 76,058 72,899
6 - 8 39,864 37,189 35,089 34,577 32,825
9 - 12 48,665 48,538 46,623 48,626 48,633
K - 12 Total 165,564 160,973 156,531 159,261 154,357
School District of Philadelphia
Historical Enrollment
Source: School District of Philadelphia
School District of Philadelphia
Historical Enrollment by Grade Group
Source: School District of Philadelphia

DRAFT- NOT A FINAL APPROVED DOCUMENT
November 2011 Page 27
CHARTER SCHOOL ENROLLMENT
Since 2001-02, the number of School District of Philadelphia students attending charter schools has increased from 27,305 to 35,488 students. Enrollment of School District of Philadelphia students attending charter schools should be closely monitored as it may have a significant impact on District enrollment in the future.
Renaissance Charter School was implemented in 2010-11 and enrollment totaled 5,244 students.
Grade 2006-07 2007-08 2008-09 2009-10 2010-11
K 1,856 1,998 2,180 2,242 2,406
1 1,984 2,166 2,276 2,388 2,472
2 1,940 2,078 2,262 2,252 2,474
3 1,967 1,982 2,135 2,259 2,303
4 1,802 1,962 2,083 2,172 2,314
5 2,095 2,100 2,259 2,355 2,512
6 2,184 2,361 2,519 2,478 2,708
7 2,467 2,750 2,828 2,909 3,053
8 2,345 2,523 2,650 2,685 2,934
9 2,506 3,051 3,272 3,357 3,584
10 2,268 2,293 2,767 2,985 3,172
11 2,113 2,003 2,033 2,575 2,880
12 1,716 2,077 2,038 2,125 2,657
Pr* 0 0 54 55 0
Pre 62 48 0 0 0
UG 0 0 0 0 19
Grand Total 27,305 29,392 31,356 32,837 35,488
Source: School District of Philadelphia
School District of Philadelphia
Charter School Enrollment
Grade 2010-11
K 630
1 602
2 611
3 632
4 686
5 759
6 507
7 361
8 351
9 105
10 0
11 0
12 0
Grand Total 5,244
School District of Philadelphia
Renaissance Charter
School Enrollment
Source: School District of Philadelphia

DRAFT- NOT A FINAL APPROVED DOCUMENT
November 2011 Page 28
PRIVATE & NON-PUBLIC ENROLLMENT
Since 2005-06, the number of private and non-public students in the Commonwealth of Pennsylvania has decreased from 324,902 to 287,902 students in the 2009-10 school year. Significant changes in the number of private and non-public students may impact enrollment projections and should be monitored.
2005-06 2006-07 2007-08 2008-09 2009-10
Elementary - Resident 205,301 198,466 192,422 185,174 176,541
Secondary - Resident 82,279 82,463 80,207 78,904 76,906
Other - Resident 30,634 30,422 30,300 29,997 27,753
Elementary - Non-Resident 1,532 1,415 1,419 1,163 1,110
Secondary - Non-Resident 5,103 5,212 4,945 4,767 4,713
Other - Non-Resident 53 60 67 83 69
Grand Total 324,902 318,038 309,360 300,088 287,092
Pennsylvania
Private & Non-Public School Enrollment
Source: Pennsylvania Department of Education
0
50,000
100,000
150,000
200,000
250,000
300,000
350,000
2005-06 2006-07 2007-08 2008-09 2009-10
PennsylvaniaStudents Attending Private & Non-Public Schools
Elementary - Resident Secondary - Resident Other - Resident
Elementary - Non-Resident Secondary - Non-Resident Other - Non-Resident

DRAFT- NOT A FINAL APPROVED DOCUMENT
November 2011 Page 29
LIVE BIRTH DATA
Utilization of live birth data is recommended when projecting future kindergarten enrollments as it provides a helpful overall trend. The live birth counts are used in determining a birth-to-kindergarten survival ratio. This ratio identifies the percentage of children born in a representative area who attend kindergarten in the District five years later. The survival ratios for birth-to-kindergarten as well as grades 1-12 can be found later in this report. Data is arranged by the residence of the mother. For example, if a mother lives in Phoenixville, Chester County but delivers her baby in Philadelphia City, Philadelphia County, the birth is counted in Phoenixville, Chester County. The number of live births is recorded by:
State County City/Town Census Tract Zip Code Address[not available
to the public] Live birth counts are different from live birth rates. The live birth count is the actual number of live births. A birth rate is the number of births per 1,000 women in a specified population group. Birth rates are provided for counties only and for 9 age groups from 10-14 years to 45+ years.
Pennsylvania has experienced the same trend in live births as seen around the country. Live birth counts increased for the first time in several years in 1998 and again in 2000. However, a descending pattern resumed in 2001 and reached an all-time low of 142,380 in 2002. Since 2002, births increase through 2007 and declined in 2008 and 2009.
The following chart and graph include the live birth count for the City of Philadelphia.
Year Philadelphia City
1994 25,946
1995 23,932
1996 22,753
1997 22,038
1998 22,063
1999 21,667
2000 21,849
2001 21,190
2002 21,380
2003 22,103
2004 21,659
2005 22,053
2006 22,925
2007 23,570
2008 23,689
2009* 23,379
Live Birth Count
1994-2009
Source: Pennsylvania Department of Health, Health Statistics
* preliminary

DRAFT- NOT A FINAL APPROVED DOCUMENT
November 2011 Page 30
ENROLLMENT PROJECTIONS- PUBLIC SCHOOLS, NON-CHARTER
Enrollment projections were developed after analyzing the data collected in this report. The projections indicate a decrease of 8,068 students in grades K through 12 from the 2010-11 to the 2020-21 school year. High School enrollment will experience the most significant decline over the next 5 to 10 years. The following tables illustrate projected enrollments by grade and by grade group through the 2020-21 school year.
Grade 2011-12 2012-13 2013-14 2014-15 2015-16 2016-17 2017-18 2018-19 2019-20 2020-21
K 13,044 13,413 13,481 13,301 13,015 13,043 13,075 13,104 13,132 13,164
1 12,996 13,514 13,894 13,965 13,780 13,480 13,512 13,542 13,573 13,605
2 12,326 12,297 12,770 13,127 13,195 13,022 12,738 12,767 12,798 12,828
3 11,953 11,874 11,851 12,293 12,640 12,701 12,535 12,263 12,293 12,322
4 11,621 11,689 11,610 11,594 12,017 12,357 12,417 12,255 11,989 12,017
5 11,232 11,115 11,185 11,117 11,109 11,496 11,820 11,878 11,722 11,468
6 10,623 10,600 10,500 10,562 10,499 10,494 10,849 11,158 11,214 11,066
7 10,565 9,948 9,937 9,851 9,919 9,855 9,868 10,181 10,471 10,523
8 10,546 10,398 9,794 9,783 9,697 9,766 9,706 9,728 10,025 10,311
9 12,124 11,828 11,661 10,980 10,969 10,872 10,951 10,875 10,904 11,241
10 12,458 11,261 10,988 10,825 10,185 10,176 10,082 10,144 10,078 10,090
11 11,121 10,667 9,635 9,411 9,295 8,734 8,733 8,650 8,705 8,656
12 11,802 11,525 11,046 9,979 9,745 9,612 9,035 9,030 8,947 8,998
Total 152,411 150,129 148,352 146,788 146,065 145,608 145,321 145,575 145,851 146,289
Grade 2011-12 2012-13 2013-14 2014-15 2015-16 2016-17 2017-18 2018-19 2019-20 2020-21
K - 5 73,172 73,902 74,791 75,397 75,756 76,099 76,097 75,809 75,507 75,404
6-8 31,734 30,946 30,231 30,196 30,115 30,115 30,423 31,067 31,710 31,900
9-12 47,505 45,281 43,330 41,195 40,194 39,394 38,801 38,699 38,634 38,985
Total 152,411 150,129 148,352 146,788 146,065 145,608 145,321 145,575 145,851 146,289
School District of Philadelphia
Projected Enrollment
School District of Philadelphia
Projected Enrollment

DRAFT- NOT A FINAL APPROVED DOCUMENT
November 2011 Page 31
ENROLLMENT PROJECTIONS- CHARTER
Charter school enrollment projections were also developed. The projections indicate an increase of 9,012 students in grades K through 12 from the 2010-11 to the 2020-21 school year. The following tables illustrate projected enrollments by grade and by grade group through the 2020-21 school year.
Grade2010-11
Actual2011-12 2012-13 2013-14 2014-15 2015-16 2016-17 2017-18 2018-19 2019-20 2020-21
K 2,406 2,430 2,498 2,511 2,478 2,424 2,430 2,435 2,441 2,447 2,452
1 2,472 2,644 2,671 2,746 2,760 2,724 2,664 2,670 2,677 2,683 2,689
2 2,474 2,504 2,679 2,705 2,781 2,796 2,759 2,699 2,705 2,711 2,718
3 2,303 2,501 2,532 2,708 2,735 2,812 2,826 2,789 2,729 2,735 2,741
4 2,314 2,343 2,544 2,575 2,755 2,782 2,861 2,875 2,838 2,776 2,782
5 2,512 2,638 2,671 2,901 2,936 3,141 3,172 3,261 3,278 3,235 3,164
6 2,708 2,763 2,902 2,938 3,191 3,230 3,455 3,489 3,587 3,605 3,558
7 3,053 2,979 3,040 3,192 3,232 3,510 3,553 3,800 3,838 3,946 3,966
8 2,934 2,974 2,901 2,960 3,109 3,148 3,419 3,460 3,701 3,738 3,843
9 3,584 3,811 3,863 3,769 3,846 4,038 4,089 4,441 4,495 4,808 4,856
10 3,172 3,266 3,474 3,520 3,435 3,505 3,681 3,726 4,047 4,097 4,382
11 2,880 2,855 2,940 3,127 3,169 3,092 3,155 3,313 3,354 3,643 3,687
12 2,657 2,880 2,855 2,940 3,127 3,169 3,092 3,155 3,313 3,354 3,643
K - 12 Total 35,469 36,588 37,570 38,592 39,554 40,371 41,156 42,113 43,003 43,778 44,481
Grade
2010-11
Actual2011-12 2012-13 2013-14 2014-15 2015-16 2016-17 2017-18 2018-19 2019-20 2020-21
K - 5 14,481 15,060 15,595 16,146 16,445 16,679 16,712 16,729 16,668 16,587 16,546
6 - 8 8,695 8,716 8,843 9,090 9,532 9,888 10,427 10,749 11,126 11,289 11,367
9 - 12 12,293 12,812 13,132 13,356 13,577 13,804 14,017 14,635 15,209 15,902 16,568
K - 12 Total 35,469 36,588 37,570 38,592 39,554 40,371 41,156 42,113 43,003 43,778 44,481
School District of Philadelphia
Projected Charter School Enrollment
Source: DeJONG-HEALY
School District of Philadelphia
Projected Charter School Enrollment by Grade Group
Source: DeJONG-HEALY
DRAFT- NOT A FINAL APPROVED DOCUMENT
November 2011 Page 32
Facilities- Condition Building Condition must be evaluated periodically to note system deficiencies. Every building, regardless of type, has multiple systems and each of these systems has a life expectancy (or estimated years of service). Life expectancy can vary with usage, weather, regular maintenance and material quality but there are industry standards for major systems. Average life expectancies should be used as a guideline but not a guarantee of when a system will fail. Examples of average life expectancies based on School District experience are as follows: Boilers - approximately 30 years Typical Roof Structure – approximately 20 years Windows – approximately 20 years The Facility Condition Index (FCI) is used throughout the facilities management industry as a general indicator of a building’s health as related to the various building systems. It is ultimately used to foster decision-making related to a building’s disposition or to compare the conditions of a group of buildings. The FCI is calculated by dividing a building’s Facility Condition Cost, or in this case, a Revised Renovation Cost, by the cost to replace (Replacement Value). Calculating the FCI In 2005, the School District of Philadelphia used a group of experts to conduct an inspection of its schools and determine the low, medium and high priority needs in the building. A dollar value was determined to establish the Original Assessment value. The URS Team was asked to utilize the School District of Philadelphia’s 2005 Facilities Condition Assessment as the foundation for the current master planning effort. The costs identified in this assessment were then escalated to 2010 dollars to account for the increase in the costs for materials and labor. Work completed under the District’s Capital Improvement Program over the last 6 years was deducted from the 2010 Assessment Costs. This final number became what we are calling the Revised Renovation Cost. In order to calculate an FCI (Facilities Condition Index) for each school it is necessary to have a Repair Cost (Revised Renovation Cost) as well as a Replacement Cost. The Replacement Cost is calculated by taking a cost per
square foot value based on building type and multiplying that cost per square foot by the overall square footage of the building. The cost per square foot used for this calculation was formulated by taking 2010 RS Means Square Foot Costs per Building Type and applying Local and Regional cost adjustments based on historical school construction costs in the Philadelphia area. Other fees typically associated in the construction of these building were also considered, such as architectural and engineering fees. Once the Replacement Costs were calculated, the FCI was calculated by dividing the Revised Renovation Cost by the Replacement Costs and multiplying by 100. The theoretical values and should be considered budgetary numbers for today’s construction market. A further explanation of FCI Levels follows. It should be noted that the Facility Condition Indices do not take into account educational adequacies of the buildings. Educational Adequacy of a space encompasses a review of the schools ability to deliver the curriculum, i.e. “Is the design of the space adequate for the type of program being delivered?”

DRAFT- NOT A FINAL APPROVED DOCUMENT
November 2011 Page 33
FCI Levels For the sake of initial planning exercises, the established condition range values for FCIs are as follows:
Buildings falling in the low FCI range are considered to have a low repair value and thus would benefit from moderate repairs with manageable costs associated with those repairs. Medium FCI values represent modernization value and thus would benefit from systems upgrades and renovation of existing spaces. High FCI values often represent a need for either replacement of the existing facility or extensive renovation and reconfiguration of spaces to meet programmatic needs. The reasoning behind using the 75% value as a planning threshold is based on a standard accounting principle known as “the rule of 2/3rds”. “The rule of 2/3rds” indicates that when the cost to renovate a facility approaches 2/3rds the estimated cost to replace it, thorough evaluations should be made to determine whether or not renovating the building would be as wise a use of capital as perhaps replacing the facility. Though 2/3rds would be around 65%, the value 75% was used in our evaluation to ensure that buildings with historical significance can be maintained, as well as to accommodate issues that are typical in urban environments that limit the opportunity to build new. For many public sector organizations, such as school districts, it is often necessary to adjust the threshold above 65% to perhaps as much as 80% so the facility portfolio as a whole can be managed effectively with available resources. By raising the threshold, the building managers can avoid or defer extremely large capital construction programs by simply renovating these buildings to keep them functional until further decisions and/or investments can be made. The overall status of the District relative to the Facility Condition Indices is represented in Tables B and C (to follow). Essentially the tables show that
there are 24 schools that have a poor condition based on the 75% threshold and how they align with school types and the meeting areas in which they appear. Reading the FCI Summary Sheet In the pages that follow are the FCI data of each District operated school; organized by meeting area. For an explanation of terms, please see the Glossary of Terms included with this document. The Summary Sheet is established strictly to provide a quick glance of the school conditions. The Meeting Area is an area established by the School District and the URS Team based on the City Planning Commissions 18 Planning Districts. The objective is to use these areas to disseminate information to the community in a concise manner.
Building Condition by FCI Levels
FCI Assessment
<33% Good Condition (Low)
33-75% Fair Condition (Medium)
>75% Poor Condition (High)
FCI Range Count by School Type District Summary
< 0.33* 0.33 > and < 0.75 > 0.75 1 2 3
EC 0 0 1
ES 58 101 19
MS 17 13 1
Middle Secondary 5 2 0
HS 33 23 1
Other 4 0 0
Remedial Disc. 5 0 2
Special Center 0 1 0
Totals: 122 140 24 *46 Schools with 0.00 FCI - Indicates no renovation and/or replacement costs
FCI Range Count by Meeting Area
District Summary
< 0.33* 0.33 > and < 0.75 > 0.75 1 2 3
North-Central 53 28 7
Northeast 16 21 9
Northwest 21 27 4
South-Central 14 30 1
Southwest 7 18 1
West 11 16 2
Totals: 122 140 24
*46 Schools with 0.00 FCI - Indicates no renovation and/or replacement costs

DRAFT- NOT A FINAL APPROVED DOCUMENT
November 2011 Page 34
Review of District Capacity Defining Capacity Capacity can be defined many different ways, but for consistency we will use the following definition for all school buildings. Capacity is equal to the number of students who can be accommodated in the school safely and in a manner which allows for appropriate academic instruction. To guide us in this calculation we used the classroom count provided by the District and then multiplied the number of classrooms in each building times the number of students which could be accommodated per classroom. Per “stimulus funding”: Maximum students per classroom (MS and HS) = 28 Maximum students per classroom (ES) = 26.5 For our calculations these maximums are then adjusted downward to account for classrooms which do not operate at the maximum (e.g. smaller classes), as well as the need to use some classroom space for other purposes and to allow for flexibility to accommodate yearly fluctuations in enrollment. We use 75% of the maximum capacity from the formula described above for all our work, and for all the calculations in these tables, graphs and charts.
Districtwide Rollup Complete
Planning Area
Planning Area 1 North-Central 30,422
Planning Area 2 Southwest 8,235
Planning Area 3 South-Central 11,293
Planning Area 4 Northeast 7,642
Planning Area 5 South-Central 0
Planning Area 6 West 4,845
Planning Area 7 North-Central 28,081
Planning Area 8 Northwest 6,087
Planning Area 9 North-Central 13,976
Planning Area 10 Southwest 13,779
Planning Area 11 West 15,576
Planning Area 12 South-Central 21,651
Planning Area 13 Northeast 7,223
Planning Area 14 Northeast 13,259
Planning Area 15 Northwest 21,655
Planning Area 16 Northeast 6,280
Planning Area 17 Northwest 14,482
Planning Area 18 Northeast 7,914
Totals 232,400
Meeting Area Rollup Complete
Meeting Area
North-Central 72,479
Northeast 42,317
Northwest 42,224
South-Central 32,945
Southwest 22,014
West 20,421
Totals 232,400
Capacity

DRAFT- NOT A FINAL APPROVED DOCUMENT
November 2011 Page 35
Review of District Utilization Defining Utilization Utilization is defined as the number of students (a.k.a. Enrollment) in each school divided by Capacity of that school. For an entire planning area we can also define the Utilization as the sum of all the Capacities of schools within that area divided by the Enrollment in those same schools. Below we have a table and a chart which outline the Utilization for the six meeting areas across the District.
Empty Seats The chart to the right shows the quantity of empty seats in each of the six meeting areas as defined above. This type of analysis shows the differing amounts of excess Capacity in each of the meeting areas. A more detailed breakdown of excess Capacity (a.k.a Empty Seats) is shown on the following page. The data on the following page shows this same analysis but split into the 18 planning areas as defined by the City.
District-Wide
Planning Areas
Including
Annex
ES MS HS Total ES MS HS Total Annex Complete ES MS HS Total Complete
South-Central 8,412 4,181 8,396 20,989 10,749 7,054 14,230 32,033 1,003 33,035 78% 59% 59% 66% 64%
South-West 6,210 2,079 3,607 11,896 8,055 5,029 8,043 21,126 623 21,749 77% 41% 45% 56% 55%
West 5,467 2,878 3,193 11,538 7,783 5,083 5,268 18,134 398 18,531 70% 57% 61% 64% 62%
North-West 13,105 6,149 9,348 28,602 16,550 10,256 15,086 41,892 398 42,289 79% 60% 62% 68% 68%
North-East 19,036 8,746 12,069 39,851 16,413 9,762 12,474 38,649 1,029 39,678 116% 90% 97% 103% 100%
North Central 20,965 8,690 9,645 39,300 29,948 17,803 20,901 68,652 1,429 70,081 70% 49% 46% 57% 56%
Meeting Area Total 73,195 32,723 46,258 152,176 89,497 54,987 76,001 220,485 4,879 225,363
Empty Seats 16,302 22,264 29,743 68,309 73,187
Enrollment Capacity (Parent) Utilization
30
,78
1
13
,68
7
12
,04
6
9,8
53
6,9
93
-17
3
0%
20%
40%
60%
80%
100%
120%
-5,000
0
5,000
10,000
15,000
20,000
25,000
30,000
35,000
North Central North-West South-Central South-West West North-East
Philadelphia Empty Seats by Meeting Area
Empty Seats
Cumm. % of Empty Seats

DRAFT- NOT A FINAL APPROVED DOCUMENT
November 2011 Page 36
PLANNING AREA CHART- BY GRADE LEVEL ENROLLEMENT, CAPACITY & UTILIZATION
13
,94
1
11
,68
9
8,8
96
7,3
44
5,7
27
5,1
51
4,9
86
4,8
27
3,1
50
3,1
33
2,5
09
2,0
07
1,7
45
77
2
0 -37
3
-59
0
-1,7
29
-25%
0%
25%
50%
75%
100%
125%
-2,000
0
2,000
4,000
6,000
8,000
10,000
12,000
14,000
16,000
School District of Philadelphia Empty Seats by Planning Area
Empty Seats
Cumm. % of Empty Seats
Including
Annex
ES MS HS Total ES MS HS Total Annex Complete ES MS HS Total Complete
Planning Area 1 10,762 3,836 3,484 18,082 14,594 7,741 6,822 29,157 614 29,771 75.1% 50.7% 51.1% 62.6% 61.4%
Planning Area 2 2,542 1,045 1,857 5,444 2,937 2,318 2,499 7,754 199 7,953 77.9% 43.7% 71.9% 66.1% 64.5%
Planning Area 3 2,481 1,588 3,582 7,651 3,168 1,853 5,600 10,621 180 10,801 81.0% 88.2% 64.0% 73.1% 71.9%
Planning Area 4 3,998 1,814 1,800 7,612 3,017 2,451 1,554 7,022 0 7,022 131.4% 74.2% 115.8% 108.1% 108.1%
Planning Area 5 (no facilities) 0 0 0 0 0 0 0 0 0 0 0.0% 0.0% 0.0% 0.0% 0.0%
Planning Area 6 635 726 661 2,022 1,029 1,642 1,219 3,890 140 4,029 61.2% 43.4% 52.4% 52.5% 51.0%
Planning Area 7 5,952 2,293 3,515 11,760 10,604 6,119 8,934 25,656 45 25,701 61.8% 40.3% 38.9% 48.5% 48.4%
Planning Area 8 1,130 566 1,494 3,190 2,200 1,100 3,024 6,323 0 6,323 65.1% 65.2% 49.4% 56.7% 56.7%
Planning Area 9 4,251 2,561 2,646 9,458 4,750 3,944 5,145 13,839 770 14,609 89.0% 63.2% 51.4% 67.7% 65.0%
Planning Area 10 3,668 1,034 1,750 6,452 5,117 2,711 5,544 13,373 424 13,796 67.7% 36.8% 32.6% 46.8% 45.4%
Planning Area 11 4,832 2,152 2,532 9,516 6,754 3,441 4,049 14,244 258 14,502 83.7% 69.3% 61.6% 74.4% 73.1%
Planning Area 12 5,931 2,593 4,814 13,338 7,581 5,201 8,630 21,411 823 22,234 83.7% 54.5% 57.0% 65.7% 63.1%
Planning Area 13 2,617 1,423 2,021 6,061 2,571 1,554 2,709 6,833 0 6,833 99.0% 93.6% 74.6% 88.2% 88.2%
Planning Area 14 5,682 2,881 3,484 12,047 4,428 2,731 3,486 10,646 1,029 11,675 119.0% 99.9% 99.9% 108.6% 99.7%
Planning Area 15 7,925 3,375 5,521 16,821 9,789 4,776 6,686 21,251 398 21,648 86.6% 71.5% 82.6% 81.8% 80.3%
Planning Area 16 2,730 947 1,398 5,075 3,051 1,396 2,373 6,820 0 6,820 91.9% 68.7% 58.9% 75.5% 75.5%
Planning Area 17 4,050 2,208 2,333 8,591 4,562 4,380 5,376 14,318 0 14,318 89.6% 50.4% 43.4% 60.2% 60.2%
Planning Area 18 4,009 1,681 3,366 9,056 3,346 1,630 2,352 7,328 0 7,328 123.7% 106.7% 143.1% 126.3% 126.3%
Total 73,195 32,723 46,258 152,176 89,497 54,987 76,001 220,485 4,879 225,363 81.8% 59.5% 60.9% 69.0% 67.5%
District-wide RollupEnrollment Capacity (Parent) Utilization

DRAFT- NOT A FINAL APPROVED DOCUMENT
November 2011 Page 37
Options Development Decision Matrix A decision matrix can be created to evaluate each planning area (or group of planning areas) to highlight those buildings which have both LOW utilization and HIGH FCI. These building would be evaluated first for consolidation discussions. Each planning area would have a matrix for evaluating ES; MS (including Middle/High combinations) and HS buildings. The largest bubbles represent the greatest number of empty seats. The location of the bubbles reflects the Utilization and FCI of each building. Using this approach we can prioritize the discussion and focus on development of options that most effectively address the issues. In this example you would first consider any large bubbles in the top left portion of the graph.

DRAFT- NOT A FINAL APPROVED DOCUMENT
November 2011 Page 38
Community Engagement
This process is intended to engage the community in an open process that
allows stakeholders input into decisions regarding the long range facilties
plan. To initiate this process, a series of community meetings was held in
November 2010.
Phase 1 Community Engagements
The purpose of these meetings was to provide an overview of what a long
range facilty plan will include. During the meeting attendees were asked to
provide input as to what they felt were priorities when developing this type
of plan.
Please note that these results are preliminary based on the following:
Participants were asked to be visionary. In doing so, many participants spoke more about "ideal" programming than about "critical" programming. For example, you will see that more breakout groups cited "Foreign Language" as a priority than "Math". The fact that participants responded in this manner does not necessarily mean that they would choose foreign language over math if they had to pick one over another. It will be critical to get a stronger sense of actual priorities, as opposed to visioning, in the second meeting phase.
The raw data source for this report includes more than 750 "must haves". These have been categorized into the roughly 60 labels seen in this table. The final version on this report, will include defining statements beneath each label for clarification. For example, "Cafeteria" is listed as a priority "must have" for Facilities.
Some labels are far broader than others. For example, some breakout groups identified "Technology" as a priority while others were more specific and identified "Computers" or "Interactive White Boards". Technology is a far broader category, but since many participants cited this as a priority we have included
"Technology" as well as "Computers" and "Interactive White Boards" in this report.
Many of the "labels" used for the "must haves" will be refined to more accurately capture the data that they represent. For example "air conditioning" is listed as a priority in Safety, Comfort and Cleanliness. In the final version of this report, this will likely be renamed "Heating, Cooling and Ventilation".
RESULTS: Source: Portfolio Associates

DRAFT- NOT A FINAL APPROVED DOCUMENT
November 2011 Page 39
The above report summarizes input solicited through a series of stakeholder workshops associated with the School District of Philadelphia’s Imagine Great Schools initiative. These workshops featured a 45‐minute presentation that highlighted the data sources and decision points included in the facility master planning process. At the conclusion of this presentation, School District of Philadelphia staff gathered public feedback on three key issues:
Information about the planning process that stakeholders believed needed clarification
Factors that stakeholders believed should be considered as the plan is developed
Indicators that stakeholders believed would evidence success after the plan is implemented
Phase 2 Community Engagements This series of civic engagement included 10 workshops held throughout Philadelphia, which were attended by a total of 554 people. Participants interacted in facilitated break‐out tables staffed by a moderator and note taker. The analysis summarized below stems from 59 break‐out conversations, which were organized to yield comments on three key issues:
Information needing clarification
Factors that should be considered in FMP planning process and;
Evidence that would be needed to prove that the FMP process resulted in a higher quality educational environment for all students.
The break‐out conversations yielded 907 comments. This table summarizes the most frequently expressed themes these comments addressed, and organizes them against the three key conversation topics. Analysis identified 17 themes, which have been organized into three tiers based on priority level. Top tier themes were expressed by at least 10
percent of all comments in any of the three key issues. Middle tier themes were expressed by between 5 and 9 percent of all comments. Bottom tier themes were expressed by fewer than 5 percent of all comments.

DRAFT- NOT A FINAL APPROVED DOCUMENT
November 2011 Page 40

DRAFT- NOT A FINAL APPROVED DOCUMENT
November 2011 Page 41
District Wide
Grade Level ES MS HS ES MS HS ES MS HS
Required Capacity 97,593 43,631 61,677 86,112 38,498 54,421 77,047 34,445 48,693
Total
Seat Impact -8,096 -11,356 -14,323 -3,386 -16,489 -21,580 -12,450 -20,541 -27,308
Total
202,901 179,031 160,185
-33,775 -41,454 -60,299
Desired Utilization
75% 85% 95%
Utilization Goals & Seat Impact
Currently the District’s average Utilization is around 67%. This means that for every three students the District is actually paying for enough space to accommodate four students. Guidance from the SRC is required to determine what level of increased utilization is most desirable. We have outlined the impact (i.e. the required reduction in seats) required to reach three different levels of utilization. Those levels are 75%, 85% and 95% average utilization. To achieve these higher levels of utilization requires increasingly larger reductions in the number of empty seats (excess Capacity).
District wide
Within the District we have outlined the necessary reductions related to each of the three different utilization objectives. Please note: In addition to the reductions outlined below the annex capacity of 4,690 would also have to be either eliminated or offset by additional reductions within the main buildings in order to meet the specific 75%, 85% or 95% targets.

DRAFT- NOT A FINAL APPROVED DOCUMENT
November 2011 Page 42
Overall Recommendations
1. It is recommended the School Reform Commission reduce the overall capacity of the District.
This study has identified an excess of over 70,000 seats in the District. This abundance of capacity has led to inefficient use of school facilities by spreading personnel resources and programs across too many facilities which allow facilities to be underutilized. Closing/consolidating these schools will substantially reduce operating cost. Many of the schools recommended for consolidation/closure are in need of major renovation or replacement. Schools that are of significant age and/or schools that are considered to be educationally inadequate should be considered as priority candidates for consolidation. Discontinuing these schools will also defer the need for future capital costs. It is also recommended that the District set a goal of 85% utilization across the entire District. This allows the District to operate more efficiently, but will also allow for demographic fluctuations that are likely to occur.
2. It is recommended the School Reform Commission reduce the number
of grade configurations in the District. The District currently operates a system that has more than 20 different grade configurations. It is recommended that the District reduce the number of grade configurations to four [4]: K-5, 6-8, K-8, and 9-12. The number of grade configurations, while providing choice, is believed to be confusing and causes disruption, in that students often enter schools at different levels. Best practices also state that the reduction of facility transitions for students in an academic career is most desirable. Grade configurations for the School District of Philadelphia are often times neighborhood specific, and though communities should have voice in their local schools, the District should weigh the academic, social, and financial benefits when making a grade configuration decision.
This plan recognizes that there are schools that will remain outside those parameters and believes that is beneficial to the District and to the community in which these schools serve.
3. It is recommended the School Reform Commission balance utilization
of facilities across the District. This plan recognizes though a facility that is underutilized does not always mean that the building should be closed or consolidated. The plan also recognizes that gross overutilization of a facility can lead to shorter life expectancy of systems and programs may be jeopardized due to lack of space. It is recommended that the District utilize various strategies to balance enrollment. These strategies are as follows:
Grade configuration change
Boundary changes and realignment
Feeder pattern change and realignment
Academic program realignment, relocation, and/or expansion
Career and Technical Special Education Pre-Kindergarten and Early Childhood
4. It is recommended the School Reform Commission implement school
capacity standards. The size of schools is a sensitive and potentially controversial topic across the country. This plan does not choose sides regarding the small school vs. big school debate, but recommends that schools be sized appropriately to offer all academic benefits to students. Appropriate levels and types of staffing, programmatic diversity and accessibility, safety and security, and parent access to school are just a few of the factors to consider when making decisions on the size of schools.

DRAFT- NOT A FINAL APPROVED DOCUMENT
November 2011 Page 43
Schools should not be so large as to create a sense of anonymity for the student or create an atmosphere that is perceived to be unsafe. However, schools should not be so small as to limit program and resource offerings for students.
5. It is recommended the School Reform Commission implement this
plan in phases. This plan recognizes that the implementation of any long range facilities plan will likely cause some level of student disruption. Because this plan is not just about seat reduction, but also centered on making decisions that best programmatically and academically benefit students while minimizing disruption to the learning process, it is recommended that the implementation of this plan be completed in phases. Actions within the phases should be as follows:
Year 1 Focus on seat reduction through closure and consolidations.
Closure and consolidation should occur at schools that can go to a receiving school that has been renovated and can accommodate the entire student population.
A parallel planning process should occur that identifies where new facilities can be constructed that will accommodate two or three schools to one new facility.
An additional parallel planning process should occur that creates an efficient academic model, providing for linear alignment of programs, feeder patterns, and grade configurations that will be implemented in Phase 3.
Year 2 Balancing capacity through grade configuration changes and boundary changes.
The District should conduct a boundary analysis, utilizing geographic information systems applications that allow for comprehensive planning of boundary changes and the demographic implications of each change.
Grade configuration changes that comply with the recommendation as previously stated should occur.
Year 3 Balance capacity and utilization at the high school level through academic realignment/relocation/expansion, closures, and feeder pattern realignment.
6. It is recommended that the School Reform Commission aggressively
dispose of surplus properties. There are potentially 15 properties that are owned or used by the School District of Philadelphia that are surplus. It will not be possible to eliminate all of the buildings since some will be needed for temporary housing of students or other District purposes. However many of the buildings could and should be sold or razed. The District is not in the business of real-estate and/or property development. Consideration should be given to developing an Request for Proposal (RFP) to hire a firm or firms to dispose of these properties. Some of these properties have high potential for redevelopment. Other properties have little value and the buildings should be sold or razed. Continuing to own surplus properties causes a financial drain on the operating budget of the District. Continuing to own and not maintain them allows for further decay and negative community relations. At the same time, care needs to be taken in the process of disposing surplus properties since these are publicly owned buildings and sites.

DRAFT- NOT A FINAL APPROVED DOCUMENT
November 2011 Page 44
7. It is recommended the School Reform Commission continue to work in collaboration with the Charter School network.
This plan recognizes that school choice is part of the landscape within the City of Philadelphia. The rise of charter school enrollment has had and will continue to have a significant impact on the District. This plan recommends that charter schools should be considered where it is both academically and geographically most beneficial to the District. Where the District struggles to meet the demands of enrollment with little or no capacity, charter schools should be considered. However, where the District can meet the demands for choice and capacity, charter schools should not be a part of the solution.
8. It is recommended the School Reform Commission acquire additional sites for future schools.
Based on demographic considerations the District should secure sites or engage a process of identifying future sites that would appropriately fit school facilities, with a priority toward elementary, middle or K-8 schools.
9. It is recommended the School Reform Commission update this plan a minimum of every five years.
To keep current, it is suggested that the plan be reviewed every year and be fully updated every five years. This will allow the plan to be adjusted based on unanticipated changes in demographics and building conditions.
10. It is recommended the School Reform Commission pursue community
based partnerships. Throughout this study it was evident that through public, private, and non-profit partnerships the educational program could be enhanced and financial and other resources could be maximized. These partnerships might include collaboration with area colleges and universities, private developers, corporations, the military and other community resources.
11. It is recommended that the School Reform Commission implement projects as funds become available.
This study will provide an updated listing of priority needs in the District. At the same time this study recognizes that finances to support capital projects are limited and it may take longer than desired to implement many of the projects. However, there should be an overall prioritization of projects that are followed to the extent possible.
12. It is recommended the School Reform Commission seek appropriate
funding for projects. This plan addresses the economic setting that currently exists. It also takes into account that it may take longer than desired to implement this plan. At the same time, it is important to have a plan and priorities Financing projects, where necessary, will require significant collaboration between the City, the State and the School District of Philadelphia. Part of the financial plan should include conventional financing such as construction bonds. At the same time, the reduced cost of operating fewer schools and the proceeds from the sale of surplus property should be factored in.

DRAFT- NOT A FINAL APPROVED DOCUMENT
November 2011 Page 45
13. It is recommended the School Reform Commission continue to involve the community throughout the implementation of this plan.
The community has shown great interest in this process by offering important input at the community meetings and should continue to be informed and included in future phases of implementation.
14. It is recommended that the School Reform Commission authorize the administration to seek professional services needed in the implementation of this plan.
To implement this plan, project planners, program managers, architects and engineers will need to be hired, as well as financial and other consultants. Although the District has qualified staff to provide oversight for this long range facilities plan, it lacks the internal capacity to manage capital projects, boundary analysis, and geographic information systems analysis of this magnitude. The School Reform Commission is advised to authorize the selection and contracting with appropriate firms per District policy for selection of services.


![[DRAFT] Mitigating Physical Risks Facing Canadian Natural Gas Processing Facilities](https://static.fdocuments.net/doc/165x107/577d1f591a28ab4e1e906b3c/draft-mitigating-physical-risks-facing-canadian-natural-gas-processing-facilities.jpg)