The S-Cycle Model Laura Hay Alex Duffy Department of Design, Manufacture and Engineering Management...
23
The S-Cycle Model Laura Hay Alex Duffy Department of Design, Manufacture and Engineering Management University of Strathclyde e: [email protected] t: +44(0)141 574 5293 Knowledge, Understanding and Competence in SE and Sustainability Copyright © 2015 by Laura Hay
Transcript of The S-Cycle Model Laura Hay Alex Duffy Department of Design, Manufacture and Engineering Management...

The S-Cycle Model
Laura HayAlex Duffy
Department of Design, Manufacture and Engineering ManagementUniversity of Strathclyde
e: [email protected]: +44(0)141 574 5293
Knowledge, Understanding andCompetence in SE and Sustainability
Copyright © 2015 by Laura Hay

Overview
1. Definitions and applications of sustainability.
2. Introduction to the S-Cycle model.
3. Case studies undertaken to test/demonstrate the model.
4. Questions.

What is sustainability?
sustainable development
sustainable consumption & production
sustainable business/ corporate sustainability
sustainable product developmentSustainable technical systems?

• the ability to be maintained by something
What is sustainability?
• the ability to sustain
• the ability to continue
• the ability to maintain something
literal interpretation
closely related
• behaviour for sustainability
• behaviour meets sustainability performance criteria
• the ability to maintain something, with respect to these criteria
our research

Research in DMEM at the University of Strathclyde
sustainability in engineering design focus area
different domains
different targets to be maintained
sustainable engineering
sustainability of consumerism
sustainable design
design activity & design output
system function/ system output
product value
Applications of sustainability

The S-Cycle model - overview
• systems exhibit behaviour for sustainability
• the S-Cycle describes the material and energetic aspects of behaviour that affect technical system sustainability (i.e. that we should measure)
• generic applicable to different technical systems
• general concepts of activity and system form the foundation of the model…

...technical systems produce waste (W) as well as their intended output
mechanisms
compress refrigeran
t
activity
e.g. flow of refrigerant to a condenser (O)
e.g. electricity, refrigerant, oil
Activity
goals
outputinputs
...use inputs to produce an intended output (O) that satisfies the goal of the activity
e.g. compressor & oil system, human operators
e.g. pressure & flow rate of refrigerant
e.g. heat energy (W)
W
Provides a way to represent the behaviour of a technical system, e.g. a compressor…
mechanisms

e.g. direct inputs + indirect inputs of fossil-derived energy for extraction, manufacturing & recycling
e.g. direct inputs + indirect inputs of biomass-derived energy for extraction, manufacturing & recycling
non-renewable resources (NR)
e.g. components produced using renewable energy
e.g. components produced using fossil fuels
renewable resources (R)
e.g. human operators
e.g. obosolete components
Across the life cycle:
Activity
...resources may be renewable (R) or non-renewable (NR)
renewable resources (R)
non-renewable resources (NR)
e.g. direct inputs of fossil-derived energy
e.g. direct inputs of biomass-derived energy
system goals
(R)
(R)
(NR)
(NR)
e.g. flow of refrigerant to a condenser (O)
e.g. heat energy (W)
compress refrigeran
t
mechanisms
goals
outputinputs
Operation phase:
e.g. waste materials & energy from extraction, manufacturing & recycling

system goals + sustainability goals
...should not be produced faster than it can be processed
...should not be used faster than stocks can regenerate
Activity...additional goals for system sustainability
system goals
(R)
(R)
(NR)
(NR)
...should not be used
e.g. flow of refrigerant to a condenser (O)
e.g. heat energy (W)
compress refrigeran
t
mechanisms
goals
outputinputs
...the technical system may also produce its own resources (intended resources, IR)
e.g. oil re-injected to compressor (IR)
IR
e.g. obosolete components
e.g. human operators
e.g. direct inputs of biomass-derived energy
e.g. direct inputs of fossil-derived energy

natural NRR stocks e.g. crude oil, coal & natural gas deposits
e.g. the stock of equipment on board the ship
e.g. stocks of oil & refrigerant on board, the sea & atmosphere
natural RR stocks e.g. forests, oceans, the atmosphere
All technical systems operate within a wider system of interest…
activity
NRR
system goals + sustainability goals
System
non-renewable resource stocks
IR
W
O
RR
RR
NRR
system of interest
renewable resource stocks
…that provides resources…
compress refrigerant
the global ecosystema ship at sea
…and receives intended output and waste.
mechanisms
goals
outputinputs
For example…
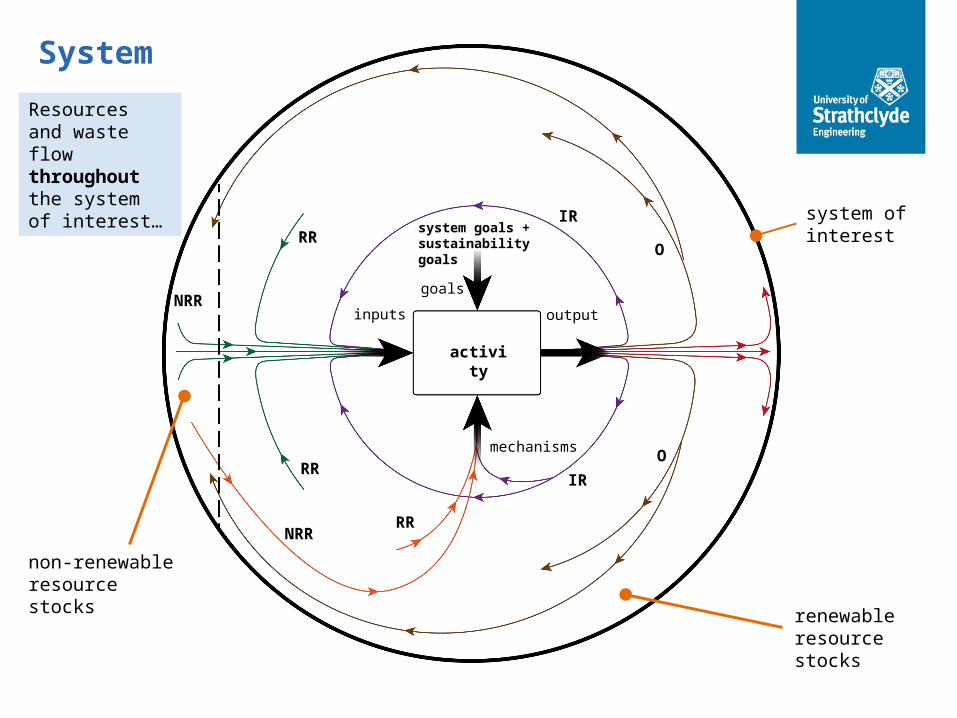
System
activity
non-renewable resource stocks
renewable resource stocks
system of interest
Resources and waste flow throughout the system of interest…
system goals + sustainability goalsRR
RR
NRR
NRRRR
O
O
IR
IR
mechanisms
goals
outputinputs
activity
system goals + sustainability goalsRR
RR
NRR
NRRRR
O
O
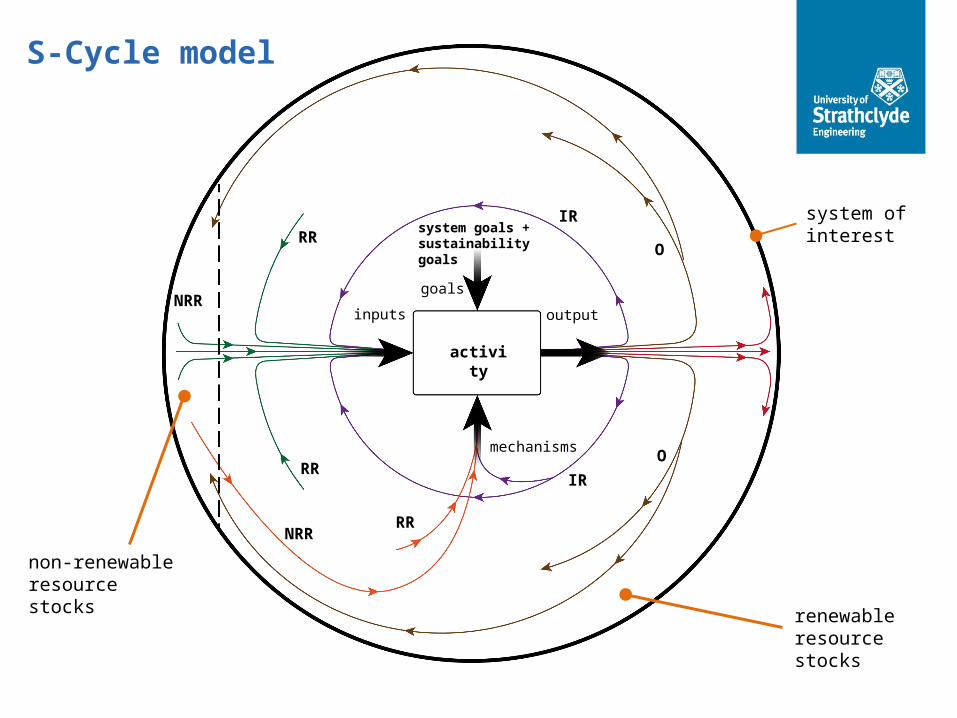
S-Cycle model
non-renewable resource stocks
renewable resource stocks
system of interest
IR
IR
mechanisms
goals
outputinputs

…what resources are produced for self-support (intended resources, IR)?
…and what waste (W) must be mitigated?
…within the boundary of a particular system of interest…
…from a sustainability perspective.
To sustain the production of intended output (O) over time…
…what renewable (RR) and non-renewable (NRR) resources are required?
The S-Cycle supports the modelling & assessment of a technical system’s behaviour…
The S-Cycle model - recap

modelling
action
S-Cycle Performance Improvement Process
performance assessment & analysis
review
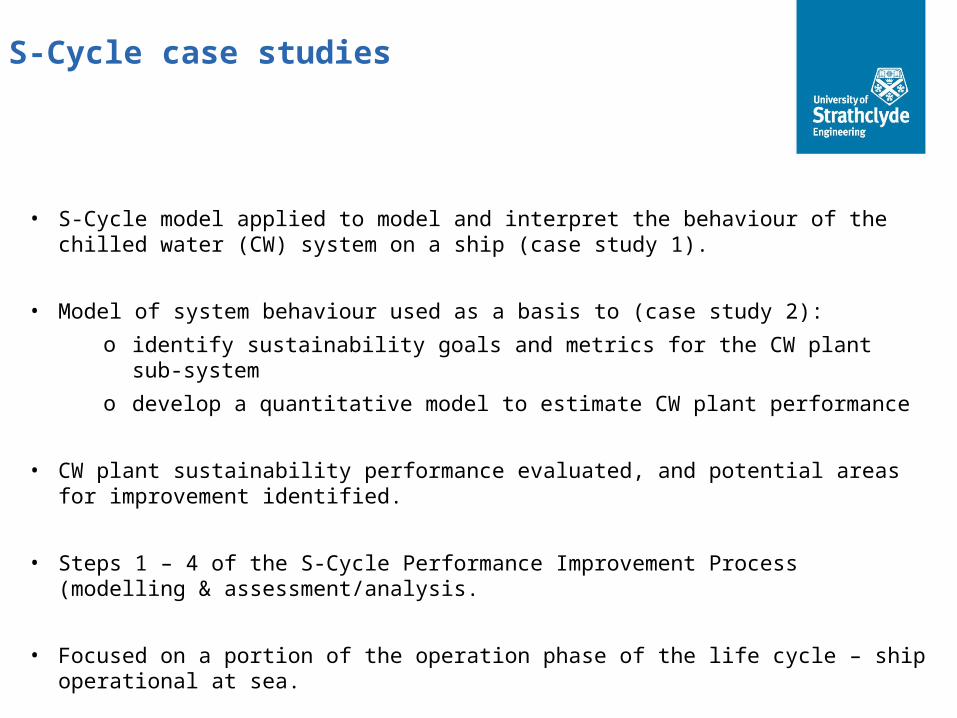
S-Cycle case studies
• S-Cycle model applied to model and interpret the behaviour of the chilled water (CW) system on a ship (case study 1).
• Model of system behaviour used as a basis to (case study 2):o identify sustainability goals and metrics for the CW plant sub-system o develop a quantitative model to estimate CW plant performance
• CW plant sustainability performance evaluated, and potential areas for improvement identified.
• Steps 1 – 4 of the S-Cycle Performance Improvement Process (modelling & assessment/analysis.
• Focused on a portion of the operation phase of the life cycle – ship operational at sea.
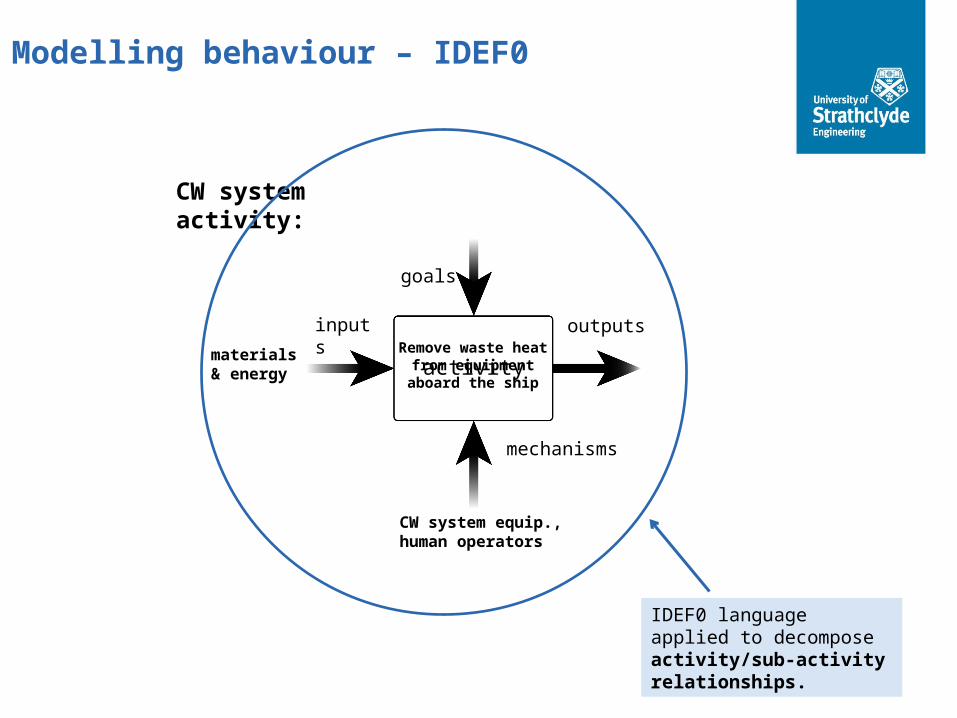
activityRemove waste
heat from equipment aboard
the ship
goals
outputsinputs
mechanisms
CW system activity:
IDEF0 language applied to decompose activity/sub-activity relationships.
materials & energy
CW system equip., human operators
Modelling behaviour – IDEF0

Inputs
Mechanisms
Controls (conditions that govern the outputs)
Outputs
Activity
Sub-activities
Coupling relationships
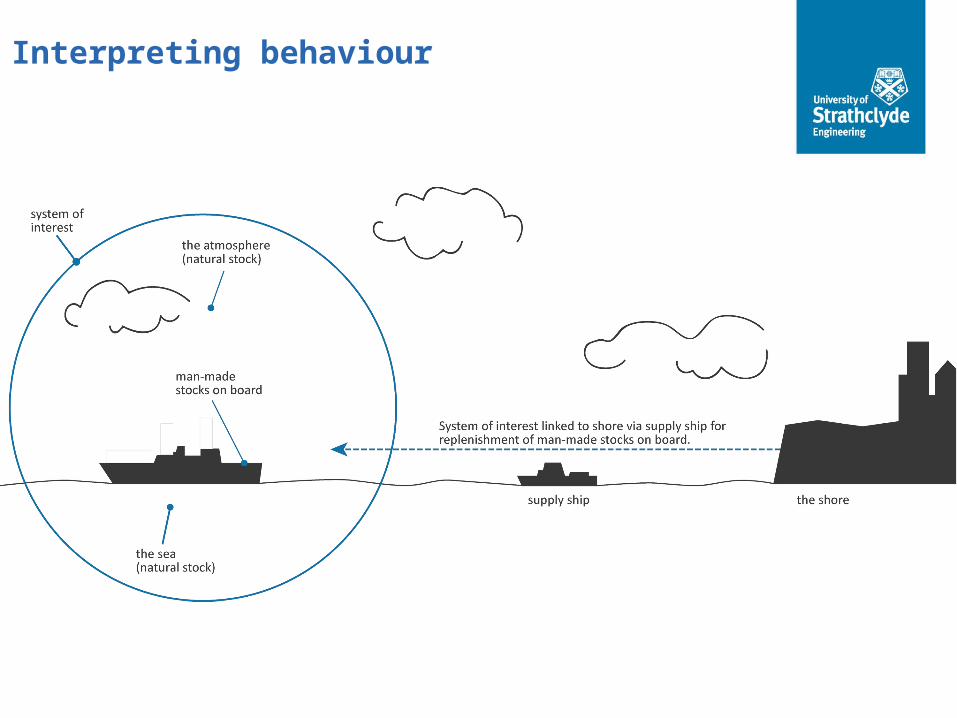
Interpreting behaviour

Resource stocks = the sea & atmosphere (natural), and stocks on board the ship (man-made)…
The S-Cycle was applied to each activity in the CW system model…
ship at sea…i.e. the stocks
available whilst the ship is at sea.
…to classify the inputs, outputs & mechanisms as renewable, non-renewable & intended resources, intended outputs, or waste.
Interpreting behaviour
Remove waste heat

Interpreting behaviour
IDEF0 Diagram Activity Renewable resources
Non-renewable resources
Intended resources
Intended outputs
Waste
A0 Absorb waste heat from users
CW flow & supply temp. (Ia)
CW users/CWS heat exchange mechs. (Mb)
----------------------- CW flow & return temp. (Oc)
-----------------------
A0 Control & configure CWS
Electricity to CWS control sys. (I)
Human control interface (I)
----------------------- Informational excluded
-----------------------
Humans (M) Local control mechs. (I)CWS control sys. (M)Controllable CWP equip. (M)Controllable CW circ. sys. equip. (M)
A0 Accumulate & store cooling medium
Air (I) H-tank equip. (M) ----------------------- Flow of water between H-tanks & CW circ. sys.
-----------------------Water for storage in H-tanks (I)
A0 Circulate cooling medium in CWS
CW flow & return temp. (I)
CW circ. sys. equip. (M)
----------------------- CW flow & return temp. (O)
Air from vacuum degassers (O)
Electricity to CW circ. sys. equip. (I)
Water losses from CW circ. sys. (O)Energy losses in CW circ. sys. (O)
A0 Chill cooling medium CW flow & return temp. (I)
CWP equip. (M) ----------------------- CW flow & supply temp. (O)
Refrig. losses from CWP equip. (O)
Electricity to CWP equip. (I)
Energy losses in CWP equip. (O)
Oil in compressors (I)
SW flow & reject temp. (O)
SW flow & supply temp. (I)Refrig. in CWPs (I)
A511 Compress flow of refrigerant from evaporator
Flow of refrig. in suction line (I)
Compressor & oil circuit (M)
Oil re-injected to compressor
Flow of refrig. from compressor (O)
Energy losses in compressor (O)
Electricity to compressor (I)Oil in CWP 1 compressor (I)
Excerpt from interpretation…
• operation phase direct inputs and outputs only
• majority of material and energetic inputs interpreted as renewable since replenishable at sea
• majority of physical equipment comprising the system interpreted as non-renewable since not fully replenishable at sea (partially owing to spares)
• a single example of intended resources identified, i.e. oil re-injected to compressor crankcase inside CW plants
• waste – mainly due to material leaks (e.g. refrigerant and water), and energy losses (e.g. heat and vibration)
• identified an additional type of input not included in the first version of the model – contaminants, inputs detrimental to sustained production of intended output
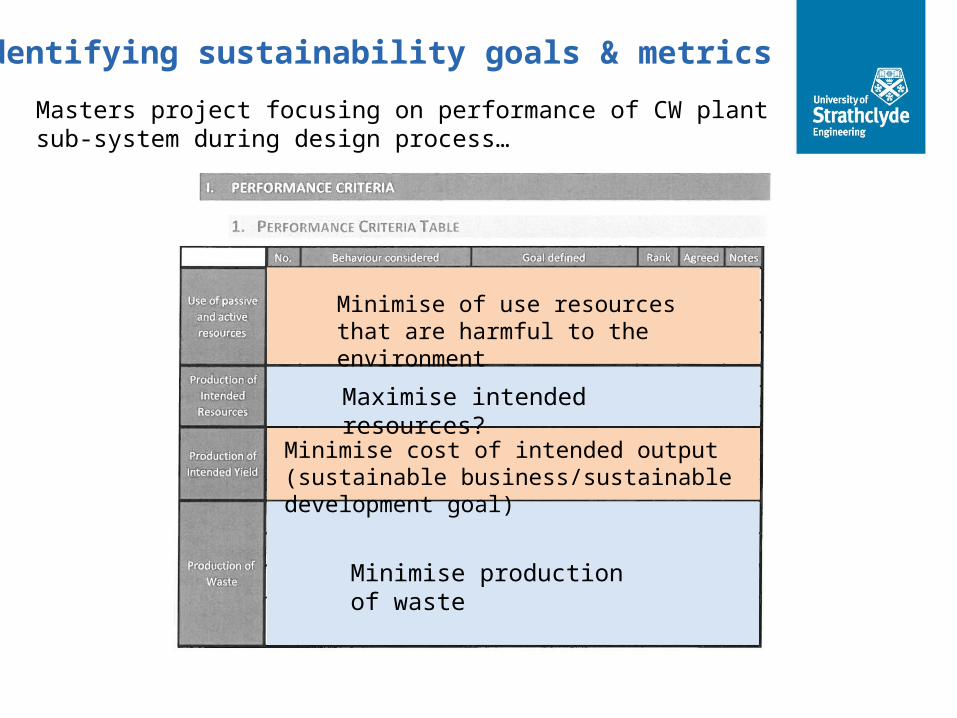
Identifying sustainability goals & metrics
Masters project focusing on performance of CW plant sub-system during design process…
Minimise of use resources that are harmful to the environment
Minimise cost of intended output (sustainable business/sustainable development goal)
Minimise production of waste
Maximise intended resources?

Assessing sustainability performance
Metrics and measures defined to assess system performance against each goal…
Test data, data from quantitative model, and benchmarking used to evaluate metrics & measures…
…metric values analysed to identify areas for improvement (primarily reduction in diesel consumption associated with electrical input).