The Rural Non-Farm Economy in Armenia (Max pop. 300,000) Population density < per km sq. Rural town...
38
NATURAL RESOURCES INSTITUTE NRI Report No: 2728 Rural Non-Farm Economy Project The Rural Non-Farm Economy in Armenia: Overview of Findings Dirk Bezemer and Junior Davis This document is an output from a project funded by the UK Department for International Development (DFID) and the Worldbank for the benefit of developing countries. The views expressed are not necessarily those of DFID or the Worldbank. World Bank
Transcript of The Rural Non-Farm Economy in Armenia (Max pop. 300,000) Population density < per km sq. Rural town...

N A T U R A L R E S O U R C E S I N S T I T U T E
NRI Report No: 2728
Rural Non-Farm Economy Project
The Rural Non-Farm Economyin Armenia: Overview
of Findings
Dirk Bezemer and Junior Davis
This document is an output from a project funded by the UK Departmentfor International Development (DFID) and the Worldbank for the benefitof developing countries. The views expressed are not necessarily those of
DFID or the Worldbank.
World Bank

Contents
1 INTRODUCTION..............................................................................................................1
1.1 BACKGROUND TO THE STUDY.......................................................................................1 1.2 CONCEPTUAL FRAMEWORK...........................................................................................2 1.3 AIMS AND RATIONALE OF APPROACH ..........................................................................2
2 COUNTRY BACKGROUND ..........................................................................................5
2.1 ARMENIAN MACROECONOMIC AND AGRICULTURAL SECTOR DEVELOPMENTS.....6 2.1.1 Macroeconomic conditions ...................................................................................6 2.1.2 Agriculture................................................................................................................7 2.1.3 Employment.............................................................................................................8 2.1.4 Poverty ......................................................................................................................8
2.2 MAIN ISSUES/PROBLEMS FOR THE RURAL ECONOMY IN ARMENIA ...................... 10
3 THE SURVEY................................................................................................................... 11
4 OVERVIEW OF FINDINGS........................................................................................ 13
5 ANALYSIS: ASSETS, ACTIVITIES, AND POVERTY........................................... 19
6 RECOMMENDATIONS................................................................................................ 25
6.1 STRATEGIES FOR THE DEVELOPMENT OF RURAL AREAS........................................ 25 6.2 ACTIVE MEASURES TO PROMOTE NON-FARM RURAL EMPLOYMENT .................... 28 6.3 POLICY & INSTITUTIONAL ENVIRONMENT .............................................................. 28
6.3.1 Decentralisation of Government ....................................................................... 29 6.3.2 Support to the private sector .............................................................................. 30
6.4 SUPPORTING MSMES.................................................................................................. 30 6.5 STRENGTHENING CIVIL SOCIETY AND PROMOTING COMMUNITY PARTICIPATION ....................................................................................................................... 31
7 REFERENCES.................................................................................................................. 33
Tables
TABLE 1 MACROECONOMIC INDICATORS 1995-2001 ...............................................................7 TABLE 2. DISTRIBUTION OF THE SURVEYED HOUSEHOLDS BY MARZES AND TYPES OF
HOUSEHOLDS ...................................................................................................................... 12 TABLE 3 SAMPLE SIZES BY REGION, DEVELOPMENT LEVEL, AND RURALITY (COUNTS)... 12 TABLE 4. RURALITY AND HOUSEHOLD TYPES BY REGIONAL DEVELOPMENT LEVEL
(COUNTS) ............................................................................................................................. 12 TABLE 5. 'CAPITALS' BY REGIONAL TYPES, REGIONAL DEVELOPMENT, & POVERTY
INCIDENCE .......................................................................................................................... 13 TABLE 6 ECONOMIC ACTIVITY INDICATORS BY REGION, DEVELOPMENT LEVEL, AND
POVERTY INCIDENCE........................................................................................................ 16 TABLE 7 FACTORS IN HOUSEHOLDS’ INVOLVEMENT IN NON-AGRICULTURAL ACTIVITIES
.............................................................................................................................................. 21 TABLE 8. FACTORS AFFECTING THE RISK OF POVERTY......................................................... 23
i

Figures
FIGURE 1: SCHEMATIC DIAGRAM OF THE PROPOSED FIELDWORK CRITERIA/STRUCTURE .3 FIGURE 2 IMPOVERISHED POPULATION (%) BY MARZ, 2000...................................................9 FIGURE 3 EARNED INCOME NON-FARM SHARES IN RURAL ARMENIA.............................. 17 FIGURE 4. SECTORAL COMPOSITION OF THE RNFE IN ARMENIA ..................................... 18
ii

Abbreviations & Acronyms AMD Armenian Dram, currency introduced in 1993 CEE Central and Eastern Europe CIS Commonwealth of Independent Countries DFID Department for International Development, UK EBRD European Bank for Reconstruction and Development FAO UN Food and Agriculture Organisation FTF Full-time farming households FTNFA Full-time non-farm activity households FDI Foreign Direct Investment GDP Gross Domestic Product GOA Government of Armenia HH Household HHH Head of Household IGA Income generating activity IHS Integrated Household Survey LFA Less favoured area MFA More favoured area MSME Micro, small and – medium sized enterprise NGO Non-governmental organisation PTFHM Part-time farming household with hired members PTFSEM Part-time farming households with self-employed members NRI Natural Resources Institute NSS GoA National Statistical Service PRSP Poverty Reduction Strategy Paper RNF Rural non-farm RNFE Rural non-farm economy SME Small and medium sized enterprise UN United Nations UNDP United Nations Development Programme WB World Bank
iii

1 Introduction The literature on transition economies devotes relatively little attention to agriculture and the rural non-farm economy, despite the importance of the sector and its relevance to the livelihoods of the majority of the world’s poor. This report is part of a growing volume of empirical work on agriculture in transition countries and especially on the topic of the rural non-farm economy and livelihood diversification among the poor. The empirical work presented in this report is primarily based on a large (nation-wide) rural household survey and other field-related research projects representing a broad range of methodologies borrowed from economics, sociology and social anthropology. The report has been a collaborative endeavour involving significant contributions from the following individuals: Ms Astghik Mirzakhanian (UNDP) who organised and implemented the survey in Georgia; Ms Gayane Minasyan (World Bank), Nairuhi Jrbashyan, Paruir Asatryan, Ruben Yeganyan, Nelson Shahnazaryan, Dr Marc Duponcel (FAO) and Mr Patrick Tateossian (formerly EU). The authors’ gratefully acknowledge the support of the DFID/World Bank Collaborative Program for Rural Development. However, the views in this report are solely those of the authors and do not necessarily represent the official view of the agencies or individuals concerned. 1.1 Background to the study The focus of this paper is on rural non-farm livelihoods in Armenia. It was prepared as part of the Natural Resources Institute project entitled ‘Characterisation and Analysis of the Non-Farm Rural Sector in Transition Economies’, undertaken for the World Bank and the Department for International Development (DFID). This programme of applied policy research began in March 2000 as a result of the Rural Non-Farm Economy (RNFE) workshop held within the World Bank in Washington in June 1999. This document is intended to summarise the key findings from a national survey of the RNFE in Armenia conducted during November 2001 to January 2002. The intended outputs of this study are (1) to improve understanding of the dynamics of the RNFE in providing employment and income diversification opportunities in Armenia, and (2) to promote mechanisms for integrating research results into relevant policy processes. Improved policy-making in this context may involve: • A focus on improving the well-being and livelihoods of the rural population in
Armenia, through developing their capacity to access resources and actively participate in non-farm rural enterprise and employment opportunities;
• An emphasis on the diversity and diversification of income sources in the face of vulnerability to shocks and stresses - particularly on the part of the poorest members of society; and
• An acceptance of the need for an in-depth understanding of the context (socio-cultural, economic, agronomic) in which non-farm rural livelihood options are currently pursued and in which new options can be developed.
The paper contributes to the above NRI project which aims to identify the institutional and policy deficiencies constraining non-farm rural livelihoods in Central and Eastern Europe (CEE) and the Commonwealth of Independent States (CIS), to analyse the factors determining infrastructural and policy factors and to work with policy-makers to improve non-farm rural economy opportunities.
1
1.2 Conceptual framework This paper is structured around the concepts of livelihood and diversity. ‘A livelihood comprises the assets (natural, physical, human, financial and social capital), the activities, and the access gained to these … that together determine the living gained by … the household’ (Ellis, 2000:10). Assets form households’ endowment of resources with which to gain their living. In this definition, the conventional meaning of assets is expanded to include, besides material and financial resources, also household members’ skills and experience (human capital) and their relations within wider communities (social capital). This inclusive definition, as well as use of the term ‘capital’ in these senses, is not uncontroversial (Davis & Bezemer, 2003), but it serves to highlight several unifying features of diverse resources. They require investment, in terms of time or money, in order to be obtained or formed. They can (but need not) be used in an economically productive way. And in doing so, they are (imperfectly) substitutable and complement household labour. Activities comprise all the ways in which household members utilise their non-leisure time to support their livelihoods. This broad definition includes work and care, employment and entrepreneurship, agricultural production and trade, and a range of other dichotomies (some of these are depicted in Davis & Bezemer, 2003). Engagement in activities both requires assets and may increase households’ stock of assets. Households’ endowment of assets and involvement in activities jointly support their level of well-being. The second central term in this report is diversity, which follows naturally from the idea of livelihood. Diversity in a household’s activities and income (which is one measure for a household’s living standard) ‘refers to the existence, at a point in time, of … different household income sources…’ (Ellis, 2000:14). Given heterogeneity in assets, diversity in income is almost implied. Indeed, both individual and household income normally derives from more than one source: income diversification is the norm, specialisation the exception (Barrett et al, 2001). Typically, household income diversity is especially large in rural areas. Rural households are more often producers as well as consumers, which implies the presence of profit (from sold output) or in-kind income (if output is consumed) as income components in addition to, for instance, wages. Several other factors make it less likely that any single source of income is sufficient to meet rural household needs: larger household sizes, relatively lower remuneration of capital and labour, seasonality of agricultural revenues, and the more limited market development that often characterises rural areas 1.3 Aims and rationale of approach In recent years there has been growing recognition of the role of the non-farm sector for employment and income smoothing and generation in rural areas in the developing countries as well as in the European Union (EU), CIS and CEE. However, there has been relatively little focus on the factors that determine people’s capacity to take advantage of or to generate these opportunities. It is hypothesised that two processes are apparent: demand-pull, where rural people respond to new opportunities; and distress-push, where the poorest are driven to seek non-farm employment as a survival strategy. Sometimes these processes work together. The non-farm sector is thus vital for rural employment and incomes in situations of both stagnant and buoyant agricultural sectors and rural
2

economy as a whole. It is also important for Armenia's economic growth, as the development of remunerative and sustainable non-farm employment opportunities will have important effects in terms of poverty reduction and the use of government and donor structural funds in the context of the Poverty Reduction Strategy Paper (PRSP). This research aims to identify the key socio-economic factors, resources, activities and constraints to rural households and enterprises in the non-farm rural economy. Data were collected at the micro-level and analysed in the context of farm systems theory and contemporary econometric methodologies. The aim is to derive policy conclusions conducive to the development of sustainable rural livelihoods. Figure 1 provides a schematic diagram of the survey fieldwork criteria/structure. Certain secondary data and conceptual problems were encountered. Armenia has municipal (unofficially NUTS)1 and regional data. There is no standardised definition of rural in the transition economies. Therefore, we have used a definition of 'rural' based on the following criteria2: • A population density of = 60 persons per km2. • The largest city in the municipality must have a population of = 30,000. • Share of agricultural output at least = 20% higher than the country average. • Share of people employed in the agricultural sector at least 20% higher than the
country average. Figure 1: Schematic diagram of the proposed fieldwork criteria/structure
Potential for job Different areas of potential
NUTS 4 Not special (ethnicity,
1 hour bus
Sample: households Less favoured areas
Sample: householdsMore favoured areas
PERI-URBAN (Max pop. 300,000)
Population density < per km sq.
Rural town pop < 30,000
> 20% above national averageof the agricultural labour
> 20% above national averageof agricultural output at NUTS
Different areas of potential
Sample: householdsLFA
Sample: householdsMFA
RURAL
DEMAND PULL /DISTRESS SDriving NFA
The survey structure has two tiers. The regional tier is where we disaggregate according to peri-urban and rural regions. Variability at this level is important statistically and the local knowledge of the project team was crucial, as they made the final decisions
1 The NUTS nomenclature (Nomenclature of Territorial Units for Statistics) is a five-level hierarchical classification (three regional levels and two local levels) drawn up by Eurostat to provide a single uniform breakdown of territorial units for the production of Community regional statistics, for socio-economic analyses of the regions and for the framing of Community regional policies. 2 Rural and urban regions are defined by the OECD (1996) as follows: (1) in a mainly rural area more than 50% of the population inhabit rural municipalities; (2) in an area with essentially rural features between 15% and 50% of the population live in rural municipalities and (3) in mainly urban areas fewer than 15% of the population live in rural municipalities. A rural municipality is classified as such if it has a population density of fewer than 150 persons per square kilometre. The idea of 'rural' also includes municipalities with fewer than 5,000 inhabitants (Lanjouw and Lanjouw, 1997).
3

concerning less favoured areas (LFA) and more favoured area (MFA) designations. For complementarity reasons the project followed the EU definition of less favoured regions as closely as possible. The second tier is comprised of less favoured and more favoured areas, within which 900 households were selected in Armenia. The survey focused on 4 types of households. • Full-time farm household • Part-time with dependent/wage employment • Part-time with self-employment • Non-farm household In order to ensure that there was consistency in the approach and methodology in the different field sites where micro-level data were collected, and to ensure that the micro-level data collection and the modelling work is well-integrated, NRI organized in-country meetings and workshops with relevant research and government agencies.
4

2 Country background The territory of Armenia is administratively divided into 11 marzes, including the capital city Yerevan, which has also been granted the marz status. As territorial-administrative units, marzes were formed on 4 December 1995, by the Territorial-Administrative Division Act. Marzes are divided into rural (871) and urban (47) communities, while the city of Yerevan is divided into 12 districts (communities). An overview of the socio-economic conditions and the level of development of institutions in Armenia is presented below.
Box 1: Republic of Armenia – Key facts
The Declaration of Independence of the Republic of Armenia was adopted on 21 September 1991. The country is situated in south-western Asia. It borders Georgia from the north, Iran from the south, Azerbaijan form the east and Turkey from the west. Administrative-territorial division The Republic of Armenia covers an area of 29 743 sq km. The Administrative-territorial Division Act (11 December 1995) divides the country into 11 marzes, including the capital city Yerevan, which was granted the status of a separate marz. The country has 47 urban communities and 871 rural communities, which include 952 rural settlements. Demographic features The population is 3 802 400* (as of 1 January 2001), including: Urban 2 532 300 or 66.6 percent Rural 1 270 100 or 33.4 percent Males constitute 48.6 percent of the population, and females 51.4 percent. The population is highly homogenous, with 96 percent ethnic Armenians. The remaining 4 percent are Azeri's Yezidis, Kurds, Assyrians, Greeks and other ethnic minorities. * The actual population figure is smaller, since the migration over the last 10 years has not been taken into account in the official figure. According to the records of the Armenian Department of Civil Aviation, in 1992-2000 the number of people leaving the country has exceeded those entering the country by 644,000. Land resources The Republic of Armenia is a mountainous country, about 90 percent of the territory is located at more than 1000 m above sea level. Land resources amount to 2 974 300 ha, including 1 391 400 ha of agricultural land, or 46.8 percent. The distribution of agricultural lands is as follows: Arable lands 494 300 ha (35.5 percent) Orchards and vineyards 63 800 ha (4.6 percent) Grasslands 138 900 ha (10 percent) Pastures 694 000 (49.9 percent) Virgin lands 400 ha (0.0 percent) Source: Davis, J and Asatrian, P. (2002) Constraints and Potential to the Development of Rural Non-Farm Activities in Armenia. Joint Endeavour European Commission and UN-FAO/SEUR GCP/ INT/ 758/ EC-ARM.
5

2.1 Armenian macroeconomic and agricultural sector developments The beginning of Armenia’s transition to a market economy coincided with a sharp economic recession. This was further exacerbated by the conflict in Nagorno-Karabagh, the continuing economic blockade imposed by Turkey and Azerbaijan, as well as the disruption of economic links with other transition economies developed over the previous 50 years. As a result of the collapse of industry and widespread unemployment, the population’s standard of living declined sharply and more than half of the population fell below the national poverty line. Despite the unfavourable political and economic conditions, a policy of economic liberalisation was adopted. Land (1991), trade, public food, services (1991-1992) and industries (1995) were privatised. Prices were gradually liberalised, a national currency was introduced, foreign currency markets and stock markets were formed. A land privatisation programme was initiated in Armenia in 1991, and in a short time numerous farms were formed on the basis of previous collective and state farms. Currently there are more than 335,000 private farms in the country. Small subsistence farms dominate the rural landscape. Most farms in Armenia lack diversified rural livelihoods or access to credit on affordable terms to develop agriculture and alternative non-farm incomes. The rural areas lack decent infrastructure (road, rail, telecommunications) and have no access to reliable municipal and other commercial services (taxation advice, extension services etc.). Development of non-farm activities in rural areas can have a significant role in the formation of larger farms, which is a very important factor for further development of the agricultural sector. Non-farm activities will also decrease the seasonal unemployment and surplus of labour in rural areas, will contribute to the full use of local resources and will enhance the living standard of the rural population. Non-farm activities could provide an alternative for those not involved in commercial agricultural production. This may free up their land, thus contributing to the formation of a more active land market. 2.1.1 Macroeconomic conditions Armenia launched a major structural reform programme shortly after independence in 1991. Land and other agricultural means were privatized. The prices of most goods and services, including agriculture and food prices, were liberalized. A liberal trade and foreign exchange regime was installed. Small-scale privatization started in 1991 while large-scale privatization started in 1995. By the end of 1997, over 80 percent of small enterprises and 65 percent of medium and large enterprises had been privatized. The share of the private sector in GDP increased from 12 percent in 1990 to 75 percent in 1998 (NSS, 2000). Substantial progress has also been made in reforming budget management, tax administration, regulation of the Central Bank of Armenia and various sectoral reforms. The uneven growth of the GDP in recent years is mainly due to the large share of agricultural production, which in turn largely depends on natural and climatic conditions. However, the agrarian nature of the country’s economy has changed in the past few years (the share of agriculture in the GDP has decreased by 15.2 percentage points over the last seven years) (see Table 1).
6
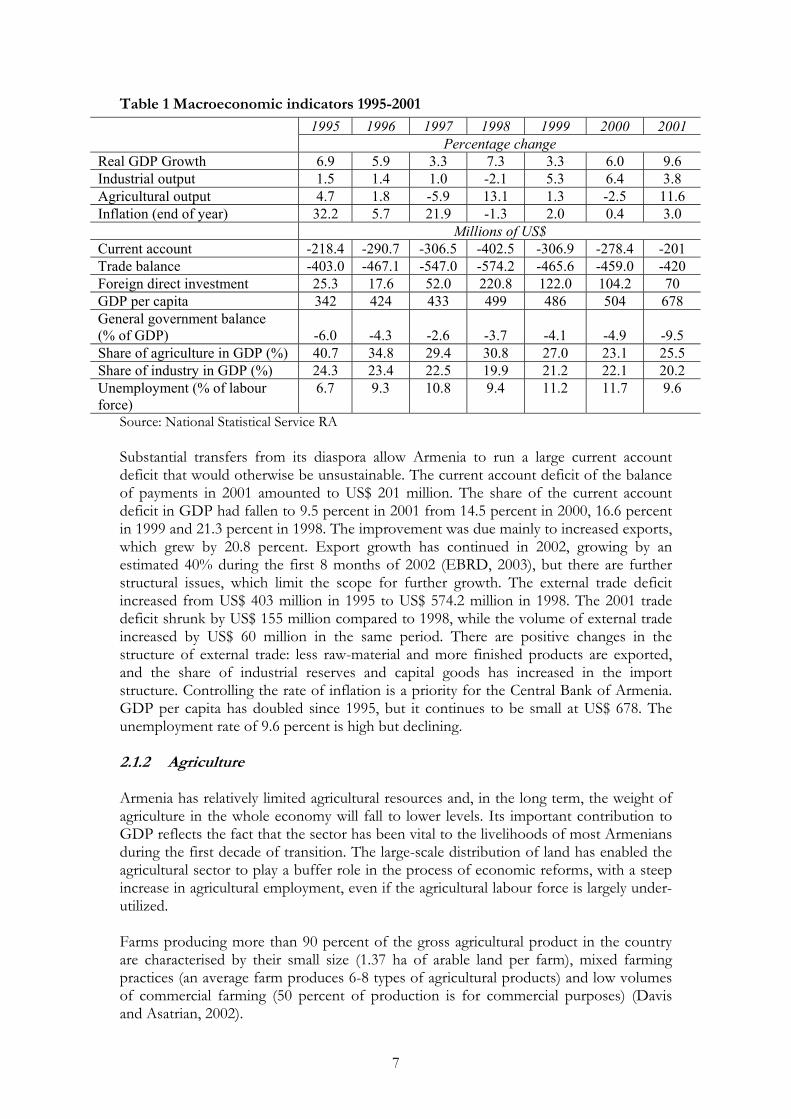
Table 1 Macroeconomic indicators 1995-2001
1995 1996 1997 1998 1999 2000 2001 Percentage change
Real GDP Growth 6.9 5.9 3.3 7.3 3.3 6.0 9.6 Industrial output 1.5 1.4 1.0 -2.1 5.3 6.4 3.8 Agricultural output 4.7 1.8 -5.9 13.1 1.3 -2.5 11.6 Inflation (end of year) 32.2 5.7 21.9 -1.3 2.0 0.4 3.0 Millions of US$ Current account -218.4 -290.7 -306.5 -402.5 -306.9 -278.4 -201 Trade balance -403.0 -467.1 -547.0 -574.2 -465.6 -459.0 -420 Foreign direct investment 25.3 17.6 52.0 220.8 122.0 104.2 70 GDP per capita 342 424 433 499 486 504 678 General government balance (% of GDP)
-6.0
-4.3
-2.6
-3.7
-4.1
-4.9
-9.5
Share of agriculture in GDP (%) 40.7 34.8 29.4 30.8 27.0 23.1 25.5 Share of industry in GDP (%) 24.3 23.4 22.5 19.9 21.2 22.1 20.2 Unemployment (% of labour force)
6.7 9.3 10.8 9.4 11.2 11.7 9.6
Source: National Statistical Service RA Substantial transfers from its diaspora allow Armenia to run a large current account deficit that would otherwise be unsustainable. The current account deficit of the balance of payments in 2001 amounted to US$ 201 million. The share of the current account deficit in GDP had fallen to 9.5 percent in 2001 from 14.5 percent in 2000, 16.6 percent in 1999 and 21.3 percent in 1998. The improvement was due mainly to increased exports, which grew by 20.8 percent. Export growth has continued in 2002, growing by an estimated 40% during the first 8 months of 2002 (EBRD, 2003), but there are further structural issues, which limit the scope for further growth. The external trade deficit increased from US$ 403 million in 1995 to US$ 574.2 million in 1998. The 2001 trade deficit shrunk by US$ 155 million compared to 1998, while the volume of external trade increased by US$ 60 million in the same period. There are positive changes in the structure of external trade: less raw-material and more finished products are exported, and the share of industrial reserves and capital goods has increased in the import structure. Controlling the rate of inflation is a priority for the Central Bank of Armenia. GDP per capita has doubled since 1995, but it continues to be small at US$ 678. The unemployment rate of 9.6 percent is high but declining. 2.1.2 Agriculture Armenia has relatively limited agricultural resources and, in the long term, the weight of agriculture in the whole economy will fall to lower levels. Its important contribution to GDP reflects the fact that the sector has been vital to the livelihoods of most Armenians during the first decade of transition. The large-scale distribution of land has enabled the agricultural sector to play a buffer role in the process of economic reforms, with a steep increase in agricultural employment, even if the agricultural labour force is largely under-utilized. Farms producing more than 90 percent of the gross agricultural product in the country are characterised by their small size (1.37 ha of arable land per farm), mixed farming practices (an average farm produces 6-8 types of agricultural products) and low volumes of commercial farming (50 percent of production is for commercial purposes) (Davis and Asatrian, 2002).
7

The respective contributions of the livestock and crops sub-sectors to agricultural GDP have changed noticeably over the transitional decade: while livestock made up 55 percent and the crop sub-sector 45 percent at the end of the 1980s, in the second half of the 1990s, the livestock sector had shrunk to 40-45 percent and the crop sector increased to 55-60 percent. This is partly a result of the decrease in forage cultivation, combined with the difficulties in importing animal feed. The production of cereal crops and potato increased at the expense of forage crops, which was a result of difficulties in providing the population with basic foodstuffs. 2.1.3 Employment According to the estimates of the National Statistical Service (NSS), the economically active population3 in the country in 2000 was 1,452,500, 11.7 percent of whom were unemployed. 72.3 percent of the employed were in the private sector, 26.9 percent in the public sector, 0.8 percent in non-governmental, religious and other organisations. During the transition to a market economy, changes occurred in the sectoral composition of employment. The share of agricultural employment increased from 17.7 percent in 1990 to 44.2 percent in 2000, while the share of employment in industry and construction decreased from 42 percent to 20 percent during the same period. According to the NSS workforce survey of 1999, 18.4 percent of the employed had informal/non-contractual employment (based on verbal agreements). The share of such employment is the highest in wholesale and retail trade at 66.7 percent, as well as agriculture at 64.7 percent. According to the survey, hidden employment amounted to 18 percent of the economically active population. There is also hidden unemployment, which is mainly the result of keeping all employees on the payroll – for various reasons – in non-operational or partially operational enterprises. According to the NSS survey the share of hidden unemployment in the economically active population is 14.5 percent. As previously noted, according to the NSS and UNDP farm survey, conducted in 1999 and financed by the World Bank, 36.6 percent of family members surveyed were employed in their own farm, 2 percent were paid workers in other farms, 2.7 percent were employed in manufacturing, trade and services, 6.6 percent were in the public and social sectors, 5.3 percent were home workers or involved in other activities. The remaining 46.8 percent were pensioners (12 percent), children of pre-school age (10.8 percent) and students (24 percent). Agricultural employment is highly seasonal. According to the farm survey, conducted among 3,400 farms by NSS and UNDP in 1997-98, the seasonal distribution of agricultural activities is as follows: Whole year 36.1 percent 3-6 months 19.4 percent 7-9 months 39.8 percent Up to 3 months 4 percent 2.1.4 Poverty Although poverty is endemic in rural Armenia, it is not spread equally throughout the population. There are measurable gaps between villages (depending on size and quality of land) and between households, with those that obtained the best quality land, most livestock, and heavy farm machinery, now occupying the upper 10% of the incomes spectrum, while households whose members received land during the second round of 3 Active population = employed + officially unemployed.
8

privatisation, did not obtain livestock, and/or lack able-bodied adults are now among the poorest households (Dudwick, 1995). By the standards of 1990, a majority of rural households could be considered “poor”, since they no longer have access to the plethora of subsidised services guaranteed under socialism. Also families are vulnerable to natural catastrophes and illness, either of which can catapult them into sudden poverty. According to the “Integrated Household Survey” conducted by the NSS in 1998-99, 54.7 percent of the total population were poor, 27.7 percent of whom were extremely poor. Poverty risk groups were defined as follows:
a) Poor: income per capita is less than the minimum consumer basket; b) Very poor: income per capita is less than the minimum food basket.
According to the NSS the value of the minimum consumer basket at the end of 2000 was AMD4 13,335, and the value of minimum food basket AMD 8,176 (providing 2,100 Kcal per day). Figure 2 Impoverished population (%) by marz, 2000
30.1
21.1
28.3
25.9
23.5
14.6
25.3
22.7
30.7
20.8
31.6
30.8
2637
.128
.618
.522
.838
.720
.835
.427
.330
.9
0
5
10
15
20
25
30
35
40
Ara
gatso
tn
Ara
rat
Arm
avir
Geg
hark
unik
Lori
Kot
ayk
Shira
k
Sjun
ick
Vay
ots D
zor
Tavo
ush
Yer
evan
Poor Very poor
According to the same survey, the rural population is less prone to the risk of poverty, which is due to their capacity to provide for basic foodstuff on a more or less stable basis. However, the living standards of the rural population appear to be correlated with their location, particularly altitude above sea level. The poorest communities in Armenia reside in mountainous regions. The share of households below the poverty line, on altitudes of up to 1,300 m is 42.4 percent, while this figure increases to 58 percent for households above 1,700 m. According to the survey, the income of the richest 20 percent of the Armenia population is 32.2 times higher than those of the poorest 20 percent.
4 AMD denotes the Armenian currency, the Dram, which was introduced in 1993. After initial hyperinflation, the Dram value had been quite stable since 1995. Its value is about 500 dram to the US dollar (in 1998).
9

2.2 Main issues/problems for the rural economy in Armenia The key problems and constraints to non-farm employment include the following factors: Excessive rural labour market stress due to: • The slow expansion of the private sector which could absorb the excess labour • The low formal qualifications and high average age of the agricultural labour force • The high market transaction costs for goods, services and production factors • High levels of hidden unemployment and unskilled middle-aged workers Under-investment since transition in rural infrastructure: • A gap between rural and urban areas in terms of the quality and utility of
infrastructure, markets, institutional and informational facilities make it harder for certain IGAs and types of employment or enterprise to be developed in rural areas.
• However, a minimum level of infrastructure is necessary for RNFE activities to develop and thrive (roads, electricity, gas etc.) (FAO, 2002).
• Central government transfers and external donor support could still play a key role in less favoured rural municipalities.
• The privatisation of Armenia’s four state owned electricity distribution companies could help improve the situation of under-investment in utilities and improve service provision to rural populations
Lack of opportunities on-farm: • Increasing scarcity of arable land and decreasing access to fertile land • Declining farm productivity (FAO, 2002) • Declining returns to farming • Lack of access to farm input markets • Decline of the natural resource base (UNDP, 2000) • Temporary events and shocks such as droughts and earthquakes (UNDP, 2000) • Absence or lack of access to rural financial markets (FAO, 2002) Significant constraints on rural non-farm SME and MSME development • A lack of capital to start a small business • Corruption and informal market entry barriers (Dudwick, 2003) • Weak informal networks of kinship and influence important in accessing resources
and markets for the rural poor. However, social capital is vital in accessing employment opportunities in Armenia (Dudwick, 2003).
• A lack of informational infrastructure – limited information on regional prices, markets etc. (FAO, 2002).
• Lack of MSME managerial know-how or training • Lack of land market • Economic blockade – lack of long-term resolution of Nagorno-Karabakh dispute.
10
3 The survey The study is based on a stratified sample of 900 households (comprising 4,511 members) selected across rural Armenia (see Figure 1). The survey was conducted during February to March 2002 in six marzes: Ararat, Armavir, Gegharkunik, Shirak, Syunik and Tavush. There were three stratification criteria: (i) location of the commune to the closest city (thus a categorisation of peri-urban or rural)5; (ii) regional characteristics (six marzes), community development (poor-rich), depth of poverty 6); and (iii) whether the area was of low or high economic, natural resource and agricultural potential, i.e. a less favoured area (LFA) or more favoured area (MFA). The survey data was collated and analysed using the software packages SPSS and STATA. A total of 900 households were included in the sample and this number was equally distributed over the six marzes. The sampling was also divided into More Favoured Areas (MFA) and Less Favoured Areas (LFA). The criteria for MFA and LFA selection were: a) size of agricultural land per capita; b) the ratio of irrigated land. We also aimed to have equal numbers of households in each type of area, thus 446 households in MFAs and 454 households in LFAs. The households surveyed in each marz were divided into peri-urban and rural groups. Of all the surveyed households 294 (32.7%) were peri-urban and 606 (67.3 %) were rural households. Finally, all households were divided into 4 types, with specific quotas for each group: • 50 percent of the sample is full time farms (FTF). The actual number surveyed was
496 households or 52.1 percent of the total sample. • 20 percent of the sample is part-time farms with hired members (PTFHM). The
actual number surveyed was 151 households or 22 percent of the sample. • 20 percent of the sample is part-time farms with self-employed members (PTFSEM).
The actual number of surveyed households is 151 or 16.8 percent. • 10 percent of the sample is comprised of households with full-time non-farm
activities (FTNFA). The actual number of households is 82 or 9.1 percent. It should be noted that in our pre-study based on three marzes in Armenia (Davis and Asatrian, 2002), it was clear that identifying FTNFA and PTFSEM households would be extremely difficult for the following reasons: respondents were typically reluctant to describe themselves as being FTNFA household to avoid taxation and potential corruption; and the low rural population density combined with widespread land ownership meant that there were very few identifiable FTNFA households and micro-enterprises. Thus, the stratified sample and defined quotas/distribution reflects the results of our initial pre-survey, and a consensus regarding approach from in-country meetings with UNDP and UN World Food Programme survey design consultants and practitioners in Armenia.
5 Peri-urban communes were defined according to the distance to the closest city (<10 km for 30-100K inhabitants; cities, 10-20 km for 100-200K inhabitants; and 20-30 km for >200K inhabitants). 6 This data was collected by marz divisions of the social monitoring and analysis system published in December 2001 and June 2002 issues of the informational-analytical bulletin “Social Trends in Armenia” http://www.gov.am/em/gov/iprsp
11

As the settlements were pre-determined based on the aforementioned meetings and above methodological guidelines, the individual households to be interviewed were selected by field interviewers in consultation with the head of a community (local mayor, school teacher etc.). The structure of the final sample is presented in Table 2. Table 3 and Table 4 show the distribution of the surveyed households by: (i) MFAs and LFAs; (ii) peri-urban and rural settlements; (iii) type of household according to employment/activity; and (iv) development level. Table 2. Distribution of the surveyed households by marzes and types of households
FTF PTFHM PTFSEM FTNFA Total
Marz HH Member HH Member HH Member HH Member HH Member Ararat 84 400 35 185 24 120 38 7 150 743 Armavir 73 350 30 141 144 30 80 17 150 715 Gegharkunik 82 396 31 162 24 120 13 52 150 730 Shirak 83 429 28 143 24 119 15 78 150 769 Syunik 69 334 46 253 19 110 16 60 150 757 Tavush 78 424 28 140 30 168 14 65 150 797 Total 469 2333 198 1024 151 781 82 373 900 4511
Table 3 Sample sizes by region, development level, and rurality (counts)
Region Development levela 'Rurality' Total
Low High (peri-)urban rural Ararat 81 69 30 120 150 Armavir 69 81 46 104 150 Gegarkounik 71 79 39 111 150 Shirak 75 75 30 120 150 Siunik 75 75 90 60 150 Tavush 75 75 59 91 150 Total 446 454 294 606 900 Notes: a. Development level: In order to rank communes by the level of development, a statistical index – level98 – is a composed measure of community capital using demographic, human capital, physical infrastructure and regional statistical indicators. Source: survey findings Table 4. Rurality and household types by regional development level (counts)
Regional type Household types Development level (peri-)urban rural 1 2 3 4 Total Low 165 281 234 97 78 37 446 High 129 325 235 101 73 45 454 Total 294 606 469 198 151 82 900 Note: Household of 4 types were sampled: 1: household is involved only in agricultural production. 2: household is involved in agricultural production and wage employment. 3: household is involved in agricultural production and independent non-farm enterprise. 4: household is not involved in agricultural production. Source: survey findings
12

3 Overview of findings In this section the survey findings will be presented following the Sustainable Livelihoods approach of structuring livelihoods into capitals (or assets), activities, and outcomes in terms of household incomes. Table 5 presents the human, physical and financial capital of households in the survey, for different levels of natural and man-made capital (regional development and rurality) and by incidence of poverty. Table 5. 'Capitals' by regional types, regional development, & poverty incidence
'Capitals' By 'Rurality' (mean)
By development level (mean)
By poverty incidenceee
(mean) Total sample (mean, S.D.)
peri-urban Rural low High non-poor Poor Human capital Hh size (persons)a 5.1 5.0 5.0 5.1 5.0 5.2 5.0 1.7 Dependency ratiob 0.35 0.36 0.34 0.37 0.36 0.36 0.36 0.25 Average age (yrs) 34.1 31.8 32.9 32.2 33.3 29.5 32.6 11.1 Max. education levelc 6.9 6.6 6.9 6.5 6.7 6.5 6.7 1.7 % women-headed hhd 2.0 4.1 3.4 3.5 3.3 4.0 3.6 Physical capital Access to land (%) 100 100 100 100 100 100 100 Land cultivated (ha) 2.3 2.9 3.5 1.9 2.6 3.2 2.7 7.9 Cattle (head) 2.7 2.9 2.3 3.4 3.1 1.8 2.8 3.7 Pigs (head) 1.1 1.8 1.1 2.1 1.6 1.6 1.6 4.6 Sheep, goats (head) 2.3 1.7 1.1 2.6 2.0 1.3 1.9 5.0 Poultry (head) 10.7 8.5 9.0 9.5 9.9 6.6 9.2 8.7 equipment (Euro) 399 493 459 466 464 455 462 513 Financial capital Loan uptake (%) 30 40 38 36 34 50 37 48 Average loan (Euro) 118 116 120 113 113 132 117 282 Notes: a. Hh stands for household. b. The dependency ratio is defined as (1 - (number of household members aged over 15 and under 66) /household size)). c. The education level is defined on a 9-point scale: No studies and cannot read or write………………….. 0 No studies but can read or write………………………. 1 Elementary school………………………………………. 2 Vocational school……………………………………….. 3 Secondary school, gymnasium………...……………… 4 College…………………………………………………… 5 Graduate studies (university B.S.)…………………….. 6 M.Sc. studies (university)………………………………. 7 Ph.D. studies (university)………………………………. 8 Other occupation-specific higher education………... 9
d. Female-headed households are defined as households without male members aged over 18. e. Poverty is defined relatively, with those households in poverty, which are in the lowest population quintile. Source: Survey findings
13

As to human capital, Table 5 shows remarkable similarities over regional conditions and poverty status. Poor and rural households are younger on average, and more of them are women-headed households, although these are still rare. We note that reported education levels are remarkably high, which would appear to cast some doubt on their reliability. The data show that access to land is universal. Households in rural or less-developed areas and those in poverty tend to have more land (though overall plot size is very limited), and they have fewer, or less often have, animals. It is interesting that poor households or those in less developed regions do not have significantly smaller stocks of equipment. Rural households do have more assets than peri-urban households. Loan uptake is quite high, particularly in rural areas and among poor households. Loan amounts are small – the average of 117 Euro is 14 % of annual household incomes. This suggests an active informal market of small-scale, private credit providers, aimed at satisfaction of household consumption needs, for instance through households pooling their financial resources. These findings should however be interpreted with caution since standard deviations of loan data are large. This is also more generally true of all differences in means over groups in Table 5 above, and Table 6 below. In order to preserve legibility, no results of t-tests for statistical significance of differences are included, and the figures should be taken as indicative rather than the basis for definite conclusions. An advanced statistical analysis follows below. Overall, the picture is one of great equality in capital endowments. This is best understood in the light of the dramatic impoverishment that has struck most Armenian households during the last decade (Dudwick, 2003). Table 6 displays indicators for households' involvement in economic activities, again categorized by different levels of regional development and rurality and by incidence of poverty. The most striking finding is that agriculture accounts for 69% of income on average. This is extremely high, higher for instance than he typical 50-60% found for poor sub-Saharan African countries. If we accept the figure as valid, an explanation could be the combination of two developments unique to Armenia: rapid and serious impoverishment due to natural disaster, systemic disruption of economy and society, and violent territorial conflict, combined with a highly effective land distribution. If most sources of income and security are taken away from households, and they are simultaneously given a plot of land in the same few years, there is indeed little else they can do to support themselves than to grow food. Another important finding is that poor households are less often involved in all economic activities, supply less household labour to economic activities, and derive less of their income from activities and relatively more from social transfers. Particularly non-farm activities (wage employment and non-farm enterprise) are hardly accessed by the poor. Smaller diversity in household incomes, as reflected in the diversity index, is clearly associated with poverty. This suggests that access to gainful activities, and particularly to non-farm activities, is crucial to escaping poverty.
14

Regionally, there are higher levels of economic activities in peri-urban areas, both in terms of access to activities and labour employed. This suggests underemployment of the rural labour force. Other farm-based activities in particular are more often located in peri-urban areas, plausibly since secondary activities (such as processing and vending of food products) depend on sufficient local demand. There are no large differences in the patterns of economic activities and income structures in terms of the level of regional development. Despite universal access to land, poor households are less involved in agriculture. The reason may well be households’ inability to mobilize resources needed to obtain productive inputs and capitals goods. Also, land distribution polices resulted in small areas per households; and particularly poor households were found to have very small plots. A third of poor households have less than one hectare of land, and half of them have less than two hectares, compared to a quarter and a third of non-poor household with less than one and two hectares, respectively. Another finding is that migration labour is rare and relatively unimportant for total incomes. This seems puzzling in view of Armenia’s large diaspora and ongoing, large-scale emigration during transition. One explanation may be that migration occurs largely from the cities, and remittances are mainly received by urban Armenians. Indeed, in this sample migration labour per household is nearly twice as high in peri-urban areas compared to rural areas. It may also seem surprising that, while dependence on social payments is usually associated with lower-income households, we find that poor households have less often access to social payments. Again, this finding can be interpreted to point to the extent of economic collapse and impoverishment in rural Armenia. Rather than constituting a safety net accessed mainly by the poor, such transfers actually appear to be important for escaping poverty. This is evidence of the precarious livelihood status also of many non-poor households, half of whom rely on transfers.
15

Table 6 Economic Activity Indicators By Region, Development Level, And Poverty Incidence
Rurality (means)
Regional development (means)
income poverty (means)
Total sample (mean, S.D.)
Peri-urban rural low high non-poor poor N Involvement in …(%) Agriculture 81 77 81 75 82 62 78 Other farm-based 24 11 18 13 16 11 15 Non-farm enterprise 19 18 19 18 22 2 18 Wage employment 23 20 22 20 24 9 21 Migration labour 4 4 4 4 5 0 4 Social transfers 47 43 43 45 47 33 44 Labour allocation (hours per year per household) Agriculture 4,389 3,817 3,967 4,040 4,196 3,189 4,003 (2,870) Non-farm enterprise 428 408 383 447 506 21 415 (1,090) Wage employment 539 465 468 511 572 147 489 (1,198( Migration labour 316 177 200 245 235 168 222 (702) All active hh labour 5,672 4,867 5,018 5,243 5,509 3,525 5,145 (3,092) Share of household income from different sources (%)1
Agriculture 66 66 65 67 65 81 69 (34) Other farm-based 0 0 0 0 0 0 0 (1) Non-farm enterprise 10 10 11 9 11 2 9 (24) Wage employment 9 11 11 10 11 0 9 (22) Migration labour2 1 1 1 1 1 0 2 (10) Social transfers 12 11 12 11 11 18 10 (20) # Income sources 2.0 1.7 1.9 1.8 2.0 1.2 1.8 (0.9) Diversity index3 0.23 0.24 0.24 0.23 0.25 0.07 0.23 (0.21)
Notes: 1. Agricultural income is calculated on the basis of reported revenues and costs (including
depreciation) associated with crop and livestock products. Agricultural income includes both marketed and non-marketed produce, and can take negative values. This was the case for 21 % of households in the sample. Such households are more often poor: of 173 poor households, only 55 had non-negative agricultural incomes. The poor/non-poor comparison is therefore biased towards larger income shares from agriculture, since the negative values were excluded.. There is no such bias in regional comparisons.
2. Income from migration includes remittances in money, food, and other goods sent by household members resident in other parts of the country or abroad.
3. Diversity of income is measured as 1 - Σ(income share j)2 , with j=1,2,…,i. With one source of income, the index equals zero, approaching 1as i increases. It is based on non-negative income shares.
Source: Survey findings Figure 3 shows the income distributional aspect of the RNFE in Armenia in more detail. Access to the RNFE is best for the richer households, i.e. those in the upper three income quintiles. Within the RNFE, this pattern is repeated for non-farm enterprises: the
16

share of this activity is higher for higher-income households. The opposite is true for wage employment, which is more important for middle-income households. Figure 3 Earned Income Non-Farm Shares in Rural Armenia
0%
20%
40%
60%
80%
100%
poorest 2 3 4 richest
p.c. income population quintile
share in earned household income
migration
job
non-farm enterprise
other farm-based
agriculture
Source: Survey findings The bottom two rows of Table 6, presenting two measures for income diversity, emphasize this aspect. The number of income sources is shown to be slightly larger in rural and well-developed areas than in peri-urban and less developed areas, in line with the possible benefits of non-agricultural income for the regional economy noted above. Also unsurprising in view of our discussion so far is that poor households have fewer sources of income, on average, than non-poor households. The diversity index reflects both the number of income sources (it is larger for households with more income sources) and the equality of their contributions to total household income. With more equal income shares, the index would be larger. Thus, the poor typically depend more heavily on one source than the non-poor, and are more vulnerable to changes in income sources. Figure 4 provides an impression of the activities found within the RNFE, as reported for non-farm enterprises and wage employment (no such information was reported for migration labour). Trade is the most important activity in non-farm enterprises, followed by services (e.g. tourism, communications, restaurants, health care, sales, tailoring, security services, car repairs). The state sector appears to play a large role in rural employment, by employing teachers, administrators, and other public service workers. Overall, small-scale activities in trade and services appear to dominate the RNFE in Armenia.
17

Figure 4. Sectoral Composition of the RNFE in Armenia
0%20%40%60%80%
100%
non-fa
rm en
terpri
se
wage em
ploymen
t
sector incidence
unspecified
industry
other services
state sector,professionstrade
Source: survey findings
18

4 Analysis: assets, activities, and poverty The previous section introduced the building blocks of rural households’ livelihoods, and the distribution of these over regions and between poor and non-poor households. The patterns observed in Table 5 and Table 6 suggest some inferences on the nature of the rural non-farm economy. These will now be taken up in a more comprehensive analysis. We will ask two questions. First, what are the determinants of households' involvement in the rural non-farm economy? Second, how, if at all, do rural non-farm activities contribute to poverty alleviation? It is useful to briefly set out some methodological decisions we made in addressing these questions. A first issue is to decide how to measure involvement in the RNFE. A number of candidates can be suggested: (a) Involvement as a binary (yes/no) variable, as indicated by deriving income from, or
allocating labour to, non-agricultural activities; (b) Income derived from non-agricultural activities, either in money units or as a share
in total income; (c) Labour allocated to non-agricultural activities, either in time units or as a share in
total household labour time. We have noted that agricultural incomes can be negative since it is calculated by subtracting costs from revenues. In these cases income shares cannot be calculated. This would exclude a fifth of the sample, with a strong bias towards excluding poor households (of 173 poor households, only 55 have non-negative agricultural incomes). This would be a disadvantage of using income shares. When choosing between labour time and income as measures of the extent of involvement, it is useful to note that this analysis aims to provide guidance to policies fostering the economic benefits to rural households from participating in the rural non-farm economy. We are not primarily interested in providing advice on how to bring households to allocate more time to rural non-farm activities. The two measures will largely, but not completely overlap. Gainful employment mostly, but not always, brings income (income can occasionally be zero). We therefore selected as the binary variable the incidence of income from specific non-agricultural activities. A further methodological choice is whether to use a binary of continuous measure for non-agricultural income (options (a) or (b) above). The latter is more informative since it reflects not only participation itself but also the extent in income terms; but further exploration showed that the information in the data allows us to estimate with some significance participation in non-agricultural activities, but not its extent, as measured in a continuous income variable. Hence option (a) above was selected. The logistic specification, appropriate for binary dependent variables, was then employed (the 'probit' specification yielded very similar results). The variables reflecting natural, human, physical, and financial capitals, presented in Table 5 and Table 6, were used as independents. Locational variables included dummies for development level and for rural or peri-urban location (DEVELOPED and RURAL). Independent variables representing human capital included household size (HHSIZE), dependency ratio and male/female ratios (DEPRATIO and M_F_RATIO), average age (AGE), highest level of education (MAXEDU) and a dummy denoting
19

households without adult men (WOMENHEAD). Variables representing wealth included the area of land (LAND), the value of equipment (ASSETS), the number of livestock (ANIMALS) and amount of credit taken up in 2001 (LOAN). Possible synergies or trade-offs between agricultural and other activities were taken into account by including farm size in revenue terms (AGREV), and labour allocated to other activities (MIGLABOUR, ENTLABOUR, JOBLABOUR and AGLABOUR). Dependent binary variables are the incidence of income from farm-based non-agricultural activities, from non-farm wage employment, from non-farm enterprise, and from migration labour. Table 7 presents the results of the four logistic regressions. Estimations were based on over 90% of the sample observations; missing values were not imputed. Multicollinearity was tested for by regressing each independent variable on the others; with adjusted R2 values below .38 multicollinearity appears not to be a concern. Estimations were performed with backward stepwise selection based on a level of statistical significance of 10 %. In interpreting the findings, it is useful to note that coefficient estimates reflect the statistical association between independent factors and households’ involvement in the three non-agricultural activities analysed. Since there are scale unit differences between independent factors, comparisons between coefficient values are not meaningful. The discussion is therefore in terms of comparisons between the signs of the various coefficients7.
7 It is possible, based on these coefficients, to compute marginal effects of changes in independent factors, as point estimates at their sample mean values. But since such marginal effects would be associated with variables of different units, the interpretation would still be problematic. One could then compare, say, the magnitude of effects on the probability of wage employment of an extra hectare of land, an extra hundred hours per year worked in agricultural production, and a one unit higher education level in this sample. But in the absence of a feasibility and cost analysis of policies that would bring about such changes, such a comparison would have little added policy relevance. In order not to complicate presentation and discussion, we will here focus on the direction of effects, which can be straightforwardly compared, rather than on coefficient magnitudes.
20

Table 7 Factors in households’ involvement in non-agricultural activities independent variables: coefficient estimates and standard
errors Regression statistics
farm-based non-agricultural activities
AGLABOUR 0,000** 0,000 ANIMALS 0,108*** 0,028 DEVELOPED 0,577*** 0,205 FARMSIZE -0,001*** 0,000 MIGLABOUR 0* 0 RURAL -0,976*** 0,203 CONSTANT -1,77*** 0,248
Number of obs = 813 LR chi2(6) = 8.83 prob > chi2 = 0.0000 Log likelihood = -332.83806 Pseudo R2 = 0.0812
waged employment
AGLABOUR 0,000*** 0,000 DEPRATIO -1,125** 0,446 DEVELOPED 0,475** 0,201 ENTLABOUR -0,001*** 0,000 LAND 0,067* 0,038 M_F_RATIO 0,238** 0,118 MAXEDU 0,579*** 0,067 CONSTANT -4,917*** 0,591
Number of obs = 815 LR chi2(7) =171.97 Prob > chi2 =0.0000 Log likelihood = -330.02349 Pseudo R2 = 0.2067
non-farm enterprise
AGE -0,02* 0,011 AGLABOUR 0,000*** 0,000 ANIMALS -0,064* 0,035 ASSETS 0,001*** 0,000 DEPRATIO -0,733* 0,436 JOBLABOUR -0,002*** 0,000 LAND -0,139** 0,061 MAXEDU 0,193*** 0,065 CONSTANT -1,014 0,637
Number of obs = 803 LR chi2(8) = 106.58 Prob > chi2 = 0.0000 Log likelihood = -327.4426 Pseudo R2 = 0.1400
migration labour
AGE 0,025* 0,015 ANIMALS -0,158* 0,082 DEPRATIO 1,765** 0,783 FARMSIZE 0,000*** 0,000 LAND -0,23* 0,133 MAXEDU 0,222* 0,118 CONSTANT -5,691*** 1,189
Number of obs = 791 LR chi2(6) = 18.51 Prob > chi2 = 0.0051 Log likelihood = -118.33295 Pseudo R2 = 0.0725
Note: *** statistical significance, p < 0.01; ** statistically significance, p < 0.05; * statistically significance , p < 0.10 Source: survey findings and authors’ calculations There do not appear to be trade-offs between labour allocated to the various non-agricultural activities and labour allocated to agriculture. The coefficient estimates for AGLABOUR equal zero or are insignificant. This implies that households in the sample are not labour-constrained in agriculture, or, in other words, they are there underemployed. This is not true for non-agricultural activities: more labour towards jobs, for instance, is associated with less labour for non-farm enterprise. Location matters to the incidence of farm-based non-agricultural activities and wage employment, which are more frequent in better developed areas. Farm-based non-
21

agricultural activities are less prevalent in more rural areas, and are further mainly influenced by farm characteristics including livestock numbers and farm size; households with smaller farms tend to be more involved in such activities. Wage employment is associated with various human capital factors. Households with fewer children or elderly people are more likely to have a member in wage employment; so do households with higher education levels and more men. Household with more land also more often have wage employment. A plausible explanation would be that more land allows for less labour-intensive agricultural production; but the absence of an agricultural-labour effect is at odds with this link. Another possibility, not rejected by our analysis, is that better education and skills are both correlated with better farming skills and better labour market opportunities. Non-farm enterprise is also associated with higher education levels and fewer dependents; the latter factor can plausibly be specified as fewer elderly people, since the average adult age is negatively associated with non-farm enterprise. More land and more animals decrease the probability of non-farm enterprise. Again this is not so because they imply more labour towards agriculture. An alternative reason may be that better endowed farms generate more income, which would lessen the need for seeking additional non-farm income. There also seems to be a synergy between the amount of farm assets and the opportunities for non-farm enterprise, perhaps because assets are multifunctional. The incidence of migration labour is positively associated with both the age and dependency ratio. This suggests that families without children are better able to generate income from (temporary) work outside the locality, in or outside Armenia. More land and livestock bind people to their locality, decreasing the probability of migration; better education makes migration more likely. Overall, the general importance of education for non-farm activities is clear. Those with higher education levels more often engage in all three types of off-farm activities, plausibly because education is better rewarded off-farm. The analysis also serves to underline the differences, over non-farm activities, in conditioning factors. Location is important for wage employment and farm-based activities, but not for non-farm enterprise. The nature of the farm as indicated by land, animals, and assets, is relevant to non-farm enterprise, but hardly to wage employment. It is instructive to also briefly note which variables do not appear to play a role in understanding non-agricultural activities. Most conspicuously absent is financial capital. Revenues from farm activities are never positively associated with any of the non-agricultural activities; credit uptake is never significant, not even in the case of non-farm enterprise. This brings us to the second analytical question. How, if at all, do rural non-farm activities contribute to poverty alleviation? This possible connection, and its complex nature, has been the rationale for much recent research into the RNFE. We will analyze it by looking at the association of a household’s assets and economic activities with its risk of poverty. The appropriate analysis is again a binary logit regression, where the dependent variable reflects whether (1) or not (0) a household is in poverty, as defined by a per capita income level in the lowest quintile. The pattern of a household’s economic activities is captured by variables indicating whether (1) or not (0) they earn income from non-farm enterprise (ENTERPRISE), wage employment (JOB), and migration
22

(MIGRATE). We include the ‘capital’ variables reported on above, which plausibly also bear on the risk of poverty, and the number of income sources. Testing revealed that the male/female ratio should be excluded due to multicollinearity. Estimations were then performed both with backward stepwise selection based on a level of statistical significance of 10%. Table 8 presents the estimation results. Model fit appears to be good and the number of missing observations is not so large as to warrant imputation. The interpretation of findings is that coefficients with a negative sign imply that the presence of (or increase in) the associated factor decreases the risk of poverty. Again, it is the sign rather than the value of the coefficients which we will discuss here (see footnote 1). Table 8. Factors affecting the risk of poverty
Variables Logit coefficient estimates (s.e.) DEVELOPED -0.400* 0.240 EDUMAX 0.138* 0.079 AGE -0.033*** 0.012 SOURCES -0.874*** 0.197 FARMBASED 0.828** 0.399 JOB -1.687*** 0.390 ENTERPRISE -3.329*** 0.647 FARMSIZE -0.007*** 0.001 ANIMALS 0.178*** 0.058 ASSETS 0.001*** 0.000 CONSTANT 1.868*** 0.704 Regression statistics: 797observations chi2(8) = 326.34 Prob > chi2 = 0.000 Log likelihood = -233.700 Pseudo R2 = 0.411 Note: *** statistical significance, p < 0.01; ** statistical significance, p < 0.05; * statistical significance , p < 0.10 Source: survey findings and authors’ calculations Unsurprisingly, households in better developed areas have a lower risk of poverty. Those with higher education levels are more at risk of poverty, but the coefficient is only weakly significant. This finding must be qualified by noting that we earlier found that education does facilitate access to non-farm activities, and thus plausibly benefits the non-poor (as defined here). While this cannot be reflected in the poverty analysis, it does show that education, either directly or as a proxy for other attributes such as social capital, brings benefits. Higher average age, related to fewer or no young children in the household, decreases the risk of poverty, reflecting a general feature of poverty studies. The findings on economic activities are in line with the pattern presented in Figure 3. More sources of income are associated with lower poverty risk. This is particularly due to the effects of wage employment and enterprise employment. Migration, as we have seen in Figure 3, is also concentrated among the better-off households, but its incidence is too low for it to appear statistically significantly in this analysis. Households engaged in farm-based non-agricultural activities have higher risks of poverty. Also other farm-connected variables such as the number of livestock and stock of assets have this effect. The interpretation may that these bind household members to farm work, excluding
23

opportunities for more remunerative activities. It is only high farm revenues, not larger farms in other terms (such as land or animals), which decrease poverty risk.
24

5 Recommendations 5.1 Strategies for the development of rural areas Clearly, agricultural growth (particularly in terms of generating higher farm revenues) has an important role to play in the effort to reduce poverty in rural areas, all the more so as it is by far the most important activity present in rural areas, at the level of 80 percent. Three is little employment in agriculture and other activities in rural areas. It is therefore important to increase the use of labour by enhancing production in the agriculture sector and in off-farm activities in rural areas; particularly non-farm “motors” of growth. An (economic) “motor” is an economic activity that creates growing demand for other economic activities, by two routes: (1) it raises incomes which then are the source of growing consumer demand for the products of the other activities; (2) it creates derived demand on the input (upstream) side for inputs to it from other activities, and creates derived demand for processing and commerce downstream from it. In Armenia, the key motors of RNFE growth are the agricultural sector (agri-food processing) and Lake Sevan (fishing industry, processing, marketing etc.). Our findings suggest that in order to be most effective in reducing poverty in rural areas, agricultural development should not be confined to medium-sized or large farms only, which are a minority. On the contrary, the strategy needs to target the majority of the farms, large and smaller ones, promote the development of their productivity and seek better market access. While the country has in recent years experienced high GDP growth rates, there is an uneven distribution of income, with growth benefiting mainly selected segments of society, mainly located in urban areas and around the capital. In addition, agricultural growth in recent years has only partially been transferred into higher agricultural incomes due to low farm-gate prices. In this context, it is not only necessary to improve the income generated by agricultural activities but also to promote activities that generate higher value added in the rural areas. Therefore the development of small-scale food processing should be seen as an opportunity to be seized. On the basis of the data analysed above and earlier studies (Davis and Asatrian, 2002; Bezemer, Davis, 2001), we can propose at least three broad rural employment and non-farm development strategies: • The development of the agricultural sector through the enlargement of peasant
farms (i.e. land consolidation programmes or through the future development of a vibrant land market);
• The restoration of the rural farm up and downstream industries serving agriculture
and the non-farm economy (processing, rural finance, produce distribution, transportation, marketing, provision of veterinary, seed-breeding, cattle-breeding services); and
• The development of alternative non-agricultural activities such as agri-processing,
industrial goods production, light manufacturing (textiles production), restaurants, tourism, retail trade and the service sector.
25

For agricultural production to develop along more commercial lines will also require the development of agri-processing, distribution, and marketing enterprises. Both upstream and downstream direct investment in the agricultural sector will be necessary if broader multiplier effects are to be achieved. For example, Davis and Asatrian (2002) observed that in Ararat marz as a result of the increased purchase of locally produced grapes by a number of companies (producing wine, cognac, and other alcoholic beverages), the destruction of vineyards and vine gardens, which was widespread four-five years ago, has ceased. Local grape producers have responded to the demand of local companies. Davis and Asatrian (2002) found other examples. For example, the same tendency has occurred in the case of vegetable and soft-fruit (especially apricot) production. Over the last 5 years, there has been increased production of processed/canned food, including: tomato paste, canned fruit, and vegetables and fruit juice. The same is true for an increase in tobacco processing, which has grown in response to demand from a large local tobacco producer – “Grand Tobacco”. Similarly, dairy production has increased due to milk supply agreements between the “Ashtarak Kat” dairy enterprise and farmers. The development of the agricultural sector will to some extent depend on the availability of a reasonably skilled labour force. During the last ten years, the share of the population employed in the agricultural sector has increased from 17.7% (1990) to 43.3% (1999), or 2.4 times. However, NSS surveys show that only 36% of those who are employed in this sector are employed throughout the whole year, 24% of them are employed up to 6 months, while 40% are employed for 7-8 months. Thus, it could be argued that agriculture as a seasonal production sector cannot guarantee a sustainable income or regular employment for those engaged in it all year. This makes those households dependent on agriculture as their main source of income insecure and at risk of deeper poverty. One of the Government of Armenia’s (GoAs) key rural development priorities of promoting employment needs to focus on investment in non-agricultural spheres of the rural economy. A concerted programme of investment (in public infrastructure: roads, railways, telecommunications, information technology) will contribute to the overall development of the rural areas, create jobs, raise skill levels, reduce emigration from rural areas and raise the living standards of the rural population. Greenfield development zones could also be established. A related issue concerns taxation and utility service cost recovery schemes to improve the level of investment in existing infrastructure from income generated from the consumer. As part of the urgent development (in some communities reintroduction) and improvement of utility services to rural communities the GoA will need to consider rationalising existing utility service tariff structures and make tax collection more effective. The issue of introducing tariffs for village-level services (where they have been provided) such as water distribution, water for irrigation, medical assistance services, and other social services is of great importance. The provision of communal, transport and other services, which were formerly provided through public funds, has almost completely disappeared from rural areas. The next issue concerns the development of upstream and downstream firms which support the agricultural sector such as animal breeding – veterinary, plant protection, seeds, fertilizers production, and renovation of machinery for agricultural purposes.
26

In some rural communities RNF employment activities such as tourism (including eco-tourism) could be effectively developed, since it is mainly in the rural and adjacent areas, where Armenia’s main historical-cultural monuments, recreational resources, mineral springs, forestry, outdoor sports, health resorts etc., are located. On the face of it, there should be some potential for the development of tourism in Armenia. The development of the agri-food system may be viewed as a potential area for FDI in the development of non-agricultural employment. Low-cost fruits, tobacco, alcoholic beverages, cheap labour, limited “red-tape” in establishing an SME, tax-free profit repatriation from investment (including foreign investment), and other factors may help make Armenia a more attractive place to invest, especially in the agri-food sector where there is still scope for growth. However, some of the firms we interviewed noted that the tax regime and level of taxation was excessive for existing micro and small-medium sized firms. In addition, on a cautious note, to date the potential for FDI from the Armenian diaspora in rural activities appears to have been limited. As the results of our survey and the NSS research conducted over recent years show, in addition to hidden employment (informal sector) and hidden unemployment (agricultural sector) present throughout the economy, Armenia also has seasonal unemployment in the agricultural sector. The rural population faces a lower risk of poverty, but there is a tendency towards greater polarisation, depending on altitude above sea level. The proportion of privatised agricultural land in the total available territory is low (35.7 percent), which is the result of a low level of privatisation of pastures, constituting 50 percent of Armenia’s total agricultural area. With regard to migration, most migrants are men between the ages of 30-40 years migrating for seasonal employment, usually during peak farming periods, leaving the entire on-farm workload to women and children. The destination country for most seasonal workers is Russia, due to previous ties, knowledge of the Russian language and an absence of visa requirements. Generally more women are self-employed or hired as employees in the agricultural sector, while in non-farm activities men are prevalent. In Armenia, the structure of the farm sector may constrain the formation of non-farm enterprises. Similarly, the future demand for RNFE activity products and services depends on the degree of participation of local communities, regional authorities and GoA in the organisation of non-farm work and services. In Armenia, the lack of available skilled labour (particularly in “traditional” rural areas), as well as capital appears to be a constraint on their RNFE entrepreneurial activities. Those RNF activities which may have a good chance of commercial survival include agro-tourism, agri-food processing, fish processing, (increasingly) and direct marketing. Access to land for sale (and to a lesser extent lease) is significantly lower in Syunik marz compared to other marzes, because of the lower share of privatised land. Generally, in the entire surveyed rural communities, infrastructure – particularly road, rail, information technology systems and telecommunications – are poorly developed. In order to attract investment for the development of rural non-farm activities and employment in rural areas, it may be necessary to: • Take measures that promote land consolidation, a key element of which is the
stimulation of the land market. In order to mitigate the effects of the low level of
27

affordability on the side of the rural population, payments for the purchased land could be arranged in 3-5 year instalments. Land as a means of collateral to secure loans for investment in both on and off-farm activities are vital. The lack of an active land market inhibits this process.
• Encourage large processing factories to open branches in rural areas. This would enable the development of marketing, procurement and distribution chains through firms from the core to the peripheral areas of Armenia. Although such a development would be useful, to date there is limited evidence of this process and thus we would anticipate more dynamism from new SME entries into the processing sector rather than former state entities or existing large processing firms decentralising their activities in the short-term.
• Improve community infrastructure, particularly roads, railways, information technology systems and telecommunications.
• Promote the establishment of farmers’ associations, co-operatives and credit clubs to conduct consultations in farms regarding marketing, purchase of various services, using extension services, receiving credits and other matters relating to the development of co-operatives or farming/producer associations.
5.2 Active measures to promote non-farm rural employment For most transition economies, including Armenia, a top priority will be to implement measures which carry a low cost of implementation, but could have significant overheads. We would propose the following: • Greater labour market information (at a regional level) leading to counselling (e.g.
Job Clubs) • Work experience (particularly targeted at school-leavers) • Vocational training especially in computing, tourism and services – also in terms of
improved job-hunting skills, transferable skills and skills training or the long-term unemployed
• SME training especially in self-employment • Paid public works • Support for seasonal work • Encouraging geographical mobility (computerisation will help) • Create credit schemes appropriate to individual communities, with an emphasis on
low-cost operations managed by local stakeholders. • Develop local leadership skills as a key aspect of RNFE programmes. • Build on existing social and community networks. • Support for marketing training and market development, including market research 5.3 Policy & institutional environment The permanent settlement of the Nagorno-Karabakh dispute is an important hindrance to trade and investment, and progress in resolving this dispute could lead to an opening of Armenia’s borders and significantly improve the country’s prospects for economic growth. It is also important that biases at the economic policy level be removed (i.e. distortions in capital markets caused by government intervention in interest rates). Effectively functioning markets will provide the correct signals to encourage investment
28

and specialisation in areas of comparative advantage, will stimulate the development of the private farm and non-farm sectors, and will encourage the efficient and realistic allocation of financial resources. With respect to the remoter rural areas, policy reforms are needed to encourage mobility, promote efficient rural markets, and better target social assistance. The lack of adequate social safety nets and suitable education opportunities in remote rural areas are clearly areas in which increased investment and attention is needed. This will help promote the development of the RNFE and the private sector, and over time redress the imbalance between urban and rural areas. Also, attention should be paid to the type of employment creation being promoted in the rural non-farm economy. Constraints to the development of the private farm sector, such as poorly developed or inefficiently functioning financial markets and lack of marketing information, should be recognised as also affecting the growth of the non-farm sector. Rural financial service provision is key to both the farm and non-farm sector, and it may be that a healthy non-farm sector attracts financial service providers who would otherwise have been put off by the increased risks and expense of agricultural credit. Barriers to entry to employment in the RNFE need to be addressed. Davis and Asatrian (2002) found that access to social and political networks were vital in accessing jobs or starting a SME. Improved vocational training would assist those within agriculture to shift to other jobs or, in the case of children from farms, to have sufficient skills to avoid having to enter the agricultural sector. Equity considerations logically imply the full participation of poorer people in rural policy formulation processes. They need to be consulted on the priorities for public investments from which they are expected to benefit or through taxation help finance. It is therefore important that methods are used or developed whereby this participation is facilitated both prior to a non-farm rural development project and through subsequent evaluations of it. Institutional reconstruction to mitigate market and government failures, and complement opportunities offered by the market and the state, is needed. However it should be noted that institutional change takes time and cannot be implemented in an abrupt way. RNFE development strategies should not only provide incentives for the rural population to engage in profitable non-farm rural employment activities but should also be based on a consensus among interest groups involved in or by the reform process. Consensus and credibility help form a strong base for successful reforms. 5.3.1 Decentralisation of Government
Decentralisation of government functions to the district level is key to facilitating responsiveness in decision-making to specific local conditions, and thereby helping ensure better distributional characteristics. Decentralised decision-making may indeed be necessary due to the heterogeneity of the rural non-farm sector providing little scope for general broad policy descriptions. However, in Armenia this process must be accompanied by capacity building of local government, local-level democratisation, and the transfer of fund-raising powers from the centre. In Armenia, local governments are still vulnerable to capture, do not have access to adequate local financing sources and there are no inter-jurisdictional externalities in service provision. A potential entry point
29

here may be that donors such as the World Bank, UNDP or IMF set-up municipal debt markets or finance municipal authorities for a fixed period of time to improve local capacity building and better direct local resources to address development needs. 5.3.2 Support to the private sector We highlight the need for an enabling environment/framework comprising at least four strategic considerations: • The main thrust for rural poverty alleviation is broad-based growth led by the private
sector in a manner in which the poor are the main beneficiaries in their capacities as consumers, farmers, workers and small entrepreneurs.
• The rural non-farm economy can, in interaction with agriculture, significantly contribute to growth and poverty alleviation.
• Non-farm private-sector activity requires a supportive business environment, a catalytic public sector and the participation of stakeholders in decision-making, if it is to realise its potential.
Proposed interventions should focus on: 1. Improving conditions for private investment and better functioning of markets by
helping to overcome market failure caused by lack of public goods, externalities, market power and economies of scale, asymmetric information and costs of establishing and enforcing agreements;
2. Promoting market solutions where it is efficient and effective for poverty alleviation; 3. Providing assets to the poor, empowering them to participate in the RNFE and
markets in ways gainful to them, and helping them to manage their risks. 5.4 Supporting MSMEs On the basis of our assessment through the commissioned fieldwork and surveys, microfinance should be recognized as a powerful tool to fight poverty and should be incorporated into the Armenian PRSP. We have found that take-up of small-loan credit, plausibly for consumption rather than productive purposes, is widespread. These experiences in the population could be built on in order to create enterprise-oriented micro-credit markets. Armenia’s microfinance system lacks a strategic framework for development, since donors are the main source of funds for the existing MFIs, which tend to follow an “occasional” rather than long-term approach. Several of the microfinance institutions Davis and Asatrian (2002) interviewed (including Shen NGO and Development Alternatives Inc. - USAID) proposed the creation of a National Program on Microfinance Development (NPMD), which would complement the PRSP and other national poverty reduction initiatives in the country. It would: i) determine sectoral and other priorities for microfinance; ii) introduce clear differentiation between credit programs where government support is justified and conventional commercial oriented programs; iii) incorporate necessary amendments to the existing legislation; iv) set out long-term social targets for donor-funded non-commercial projects; v) introduce tax and other privileges for social-oriented microfinance programs; and vi) promote creation of privately-owned microfinance and their integration into donor-supported microfinance
30
society etc. Adopting and adhering to the NPMD will significantly increase effectiveness of donor efforts in reduction of poverty and the promotion of rural non-farm employment in Armenia. Once again, the legal constraints for the development of MSME microfinance services should be examined and analyzed, and a package of facilitating amendments should be proposed for the NPMD. Also, we were struck by the proliferation of microfinance schemes and players across Armenia. Deeper cooperation between different players/microfinance institutions should be promoted on both formal and informal levels. A registry of microfinance institutions and database of clients (credit bureau) should be established for the non-bank financial sector to avoid problems provoked by lack of information on the client’s credit history. Ideally, the credit bureau for microfinance institutions should be incorporated into the one currently established for commercial banks, with reciprocal access of commercial banks and microfinance institutions to the database. The government needs to enhance and develop a broad range of measures to strengthen the environment for private investment, especially in SMEs and MSMEs. Our surveys show that the GoA’s state institutions remain weak both in juridical and administrative procedures regarding corruption and legal safety through sound contract law enforcement. The RNF entrepreneurs in our survey complained about the predominance of legal “red-tape”, cumbersome administrative regulations, unclear regulation and their exposure to corrupt state and private individuals. An improved legal and regulatory environment for enterprise creation and growth will be essential for future job creation in Armenia. Also a more focused and determined effort to encourage FDI, which will improve the business environment, needs to be implemented. 5.5 Strengthening Civil Society and Promoting Community Participation Programs attempting to address rural poverty, encourage local participation in the rural non-farm economy, engage women, and have a sustainable impact, should consider the following points: • The promotion of an active civil society • Involvement of community representatives and civil society groups in the design and
management of projects • Promotion of women’s involvement in community based organizations (CBOs) and
projects promoting RNF employment • Participatory methodologies should take into account the power differential and
competing interests among villagers and between men and women • Since extensive kinship networks constitute an important resource, lack thereof (for
example, in villages with large refugee populations) is one cause of poverty • Limited access to information contributes to and results from poverty and isolation;
it will be important to practice information-sharing and transparency as an example of what (ideally) takes place in a civil society
To engage women, it may be necessary to focus certain projects on women (for example, micro-credit for traditionally gender-specific income-generating activities) with women setting priorities, proposing solutions, and controlling the project, or to actively
31

encourage women to participate in agricultural extension courses or training to work in credit unions. Any program designed to improve agricultural practice, raise the standard of living, and most important, encourage participation in long-term as well as short-term activities benefiting the entire community will confront decades of socialization, in which Armenians learned that initiative comes from the top, and that activism carries political risks. Programs which encourage information-sharing and transparency have to overcome the long-standing perception of knowledge as a valuable resource to be husbanded rather than shared. Efforts to encourage open procurement and hiring practices will confront a long-standing political preference for working through networks, a preference buttressed by the strong cultural belief that duty to kin takes moral precedence over duty to an abstract “community”. Consistency, patience, sensitivity to genuine cultural difference, and long-term commitment will determine the success or failure of community development in Armenia.
32

33
6 References Bezemer, D., and Davis, J.R. (2002) The Rural Non-Agricultural Economy in Transition
Countries: Findings from Armenia, in: M. Spoor (ed.) ‘Transition, Institutions, and the Rural Sector’, series ‘Rural Economies in Transition’, Z. Lerman, C. Csaki, and J.Swinnen (eds.), Lexington Books, Lanham, MD, USA.
Davis, J and Asatrian, P. (2002) Constraints and Potential to the Development of Rural Non-Farm Activities in Armenia. Joint Endeavour European Commission and UN-FAO/SEUR GCP/ INT/ 758/ EC-ARM.
Davis, J.R. and Bezemer, D. (2003) Key emerging and conceptual issues in the development of the rural non-farm economy in developing countries and transition economies. DFID, unpublished mimeo.
Dudwick, N. (2003) When The Lights Went Out: Poverty in Armenia. In: Dudwick N., Gomart E, Marc A and Keuhnast K (ed.) When Things Fall Apart: Qualitative Studies of Poverty in the Former Soviet Union. Washington, DC: World Bank
Dudwick, N. (1996) Armenia: north-west agricultural services project: A socio-economic portrait of target communities. Institute for European, Russian and Eurasian Studies, George Washington University.
FAO (2002) Armenia: A strategy for sustainable agricultural development. TCP/ARM/0065. Unpublished mimeo. UN Food & Agriculture Organisation.
National Statistical Service – Socio-economic Situation in Armenia 1999, Yerevan 2000. National Statistical Service – Socio-economic Situation in Armenia 2000, Yerevan 2001. National Statistical Service – Social Panorama and Poverty in Armenia, Yerevan 2001. National Statistical Service – Hidden unemployment and hidden employment in
Armenia, Yerevan 1996. National Statistical Service – Farm Survey, Yerevan 1998. National Statistical Service – Marzes of Armenia in Figures, Statistical Bulletin, 1999. UNDP (2000) Social Indicators of Poverty, Yerevan 2000.

Enterprise Trade and Finance Group Natural Resources Institute
University of Greenwich at Medway Central Avenue
Chatham Maritime Kent ME4 4TB Unted Kingdom
Tel: +44 (0)1634 883199Fax: +44 (0)1634 883706
Email: [email protected]://www.nri.org/rnfe/index.html
FS 54723ISO 9001