THE ROYAL BANK OF SCOTLAND N.V. (Incorporated in · PDF fileTHE ROYAL BANK OF SCOTLAND N.V....
28
THE ROYAL BANK OF SCOTLAND N.V. (Incorporated in the Netherlands with Limited Liability) INDIAN BRANCHES 1 INDEPENDENT AUDITOR’S REPORT TO THE MANAGEMENT TEAM COMMITTEE OF THE ROYAL BANK OF SCOTLAND N.V. – INDIAN BRANCHES Report on the Financial Statements We have audited the accompanying financial statements of THE ROYAL BANK OF SCOTLAND N.V. – INDIAN BRANCHES (“the Bank”), which comprise the Balance Sheet as at 31 March, 2015, the Profit and Loss Account, the Cash Flow Statement for the year then ended, and a summary of the significant accounting policies and other explanatory information. Management’s Responsibility for the Financial Statements The Bank’s Management is responsible for the preparation of these financial statements that give a true and fair view of the financial position, financial performance and cash flows of the Bank in accordance with the provisions of Section 29 of the Banking Regulation Act, 1949, accounting principles generally accepted in India, including the Accounting Standards specified under Section 133 of the Companies Act, 2013 (“the Act”), read with Rule 7 of the Companies (Accounts) Rules, 2014 in so far as they apply to banks and the Guidelines issued by the Reserve Bank of India. This responsibility also includes maintenance of adequate accounting records in accordance with the provisions of the Act for safeguarding the assets of the Bank and for preventing and detecting frauds and other irregularities; selection and application of appropriate accounting policies; making judgments and estimates that are reasonable and prudent; and design, implementation and maintenance of adequate internal financial controls, that are operating effectively for ensuring the accuracy and completeness of the accounting records, relevant to the preparation and presentation of the financial statements that give a true and fair view and are free from material misstatement, whether due to fraud or error. Auditor’s Responsibility Our responsibility is to express an opinion on these financial statements based on our audit. We have taken into account the provisions of the Act, the accounting and auditing standards, and matters which are required to be included in the audit report under the provisions of the Act and the Rules made thereunder. We conducted our audit in accordance with the Standards on Auditing specified under Section 143(10) of the Act. Those Standards require that we comply with ethical requirements and plan and perform the audit to obtain reasonable assurance about whether the financial statements are free from material misstatement. An audit involves performing procedures to obtain audit evidence about the amounts and the disclosures in the financial statements. The procedures selected depend on the auditor’s judgment, including the assessment of the risks of material misstatement of the financial statements, whether due to fraud or error. In making those risk assessments, the auditor considers internal financial control relevant to the Bank’s preparation of the financial statements that give a true and fair view in order to design audit procedures that are appropriate in the circumstances, but not for the purpose of expressing an opinion on whether the Bank has in place an adequate internal financial controls system over financial reporting and the operating effectiveness of such controls. An audit also includes evaluating the appropriateness of the accounting policies used and the reasonableness of the accounting estimates made by the Bank’s Management, as well as evaluating the overall presentation of the financial statements. We believe that the audit evidence we have obtained is sufficient and appropriate to provide a basis for our audit opinion on the financial statements. Opinion In our opinion and to the best of our information and according to the explanations given to us, the aforesaid financial statements give the information required by the Banking Regulation Act, 1949; the Companies Act, 2013 in the manner so required for banking companies and the Guidelines issued by the Reserve Bank of India from time to time and give a true and fair view in conformity with the accounting principles generally accepted in India, of the state of affairs of the Bank as at 31 March, 2015, and its profit and its cash flows for the year ended on that date. Other Matter The audit of financial statements of the Bank for the year ended 31 March, 2014 was carried out by the previous auditors of the Bank. Our opinion is not modified in respect of this matter. Report on Other Legal and Regulatory Requirements 1. As required by Section 143 (3) of the Companies Act, 2013 and Section 30 of the Banking Regulation Act, 1949 we report that: (a) We have sought and obtained all the information and explanations which to the best of our knowledge and belief were necessary for the purposes of our audit and found them to be satisfactory. (b) In our opinion, the transactions of the Bank which have come to our notice have been within the powers of the Bank. (c) As explained in paragraph 2 below, the financial accounting systems of the Bank are centralised and, therefore, accounting returns are not required to be submitted by the Branches. (d) In our opinion, proper books of account as required by law have been kept by the Bank so far as it appears from our examination of those books. (e) The Balance Sheet, the Profit and Loss Account, and the Cash Flow Statement dealt with by this Report are in agreement with the books of account. (f) In our opinion, the aforesaid financial statements comply with the Accounting Standards specified under Section 133 of the Act, read with Rule 7 of the Companies (Accounts)Rules, 2014 in so far as they apply to banks. (g) With respect to the other matters to be included in the Auditor’s Report in accordance with Rule 11 of the Companies (Audit and Auditors) Rules, 2014, in our opinion and to the best of our information and according to the explanations given to us: i. The Bank has disclosed the impact of pending litigations on its financial position in its financial statements – Refer Schedule 12, Schedule 17 - Note 4.11 and Schedule 18 - Note 2.10 to the financial statements; ii. The Bank has made provision, as required under the applicable law or accounting standards, for material foreseeable losses, if any, on long-term contracts including derivative contracts – Refer Schedule 17 - Note 4.11 and Schedule 18 - Note 1.19 to the financial statements; iii. There were no amounts which were required to be transferred to the Investor Education and Protection Fund by the Bank. 2. We report that during the course of our audit we have visited and performed select relevant audit procedures at 7 branches. Since the Bank considers its key operations to be automated, with the key applications largely integrated to the core banking systems, it does not require its branches to submit any financial returns. Accordingly our audit is carried out centrally at the Head Office based on the necessary records and data required for the purposes of our audit being made available to us. For DELOITTE HASKINS & SELLS Chartered Accountants (Firm’s Registration No. 117365W) Rukshad N. Daruvala Partner (Membership No.111188) Mumbai, 29 th June, 2015
Transcript of THE ROYAL BANK OF SCOTLAND N.V. (Incorporated in · PDF fileTHE ROYAL BANK OF SCOTLAND N.V....

THE ROYAL BANK OF SCOTLAND N.V. (Incorporated in the Netherlands with Limited Liability)
INDIAN BRANCHES
1
INDEPENDENT AUDITOR’S REPORT TO THE MANAGEMENT TEAM COMMITTEE OF THE ROYAL BANK OF SCOTLAND N.V. – INDIAN BRANCHESReport on the Financial StatementsWe have audited the accompanying financial statements of THE ROYAL BANK OF SCOTLAND N.V. – INDIAN BRANCHES (“the Bank”), which comprise the Balance Sheet as at 31 March, 2015, the Profit and Loss Account, the Cash Flow Statement for the year then ended, and a summary of the significant accounting policies and other explanatory information.
Management’s Responsibility for the Financial StatementsThe Bank’s Management is responsible for the preparation of these financial statements that give a true and fair view of the financial position, financial performance and cash flows of the Bank in accordance with the provisions of Section 29 of the Banking Regulation Act, 1949, accounting principles generally accepted in India, including the Accounting Standards specified under Section 133 of the Companies Act, 2013 (“the Act”), read with Rule 7 of the Companies (Accounts) Rules, 2014 in so far as they apply to banks and the Guidelines issued by the Reserve Bank of India. This responsibility also includes maintenance of adequate accounting records in accordance with the provisions of the Act for safeguarding the assets of the Bank and for preventing and detecting frauds and other irregularities; selection and application of appropriate accounting policies; making judgments and estimates that are reasonable and prudent; and design, implementation and maintenance of adequate internal financial controls, that are operating effectively for ensuring the accuracy and completeness of the accounting records, relevant to the preparation and presentation of the financial statements that give a true and fair view and are free from material misstatement, whether due to fraud or error.
Auditor’s ResponsibilityOur responsibility is to express an opinion on these financial statements based on our audit.We have taken into account the provisions of the Act, the accounting and auditing standards, and matters which are required to be included in the audit report under the provisions of the Act and the Rules made thereunder.We conducted our audit in accordance with the Standards on Auditing specified under Section 143(10) of the Act. Those Standards require that we comply with ethical requirements and plan and perform the audit to obtain reasonable assurance about whether the financial statements are free from material misstatement.An audit involves performing procedures to obtain audit evidence about the amounts and the disclosures in the financial statements. The procedures selected depend on the auditor’s judgment, including the assessment of the risks of material misstatement of the financial statements, whether due to fraud or error. In making those risk assessments, the auditor considers internal financial control relevant to the Bank’s preparation of the financial statements that give a true and fair view in order to design audit procedures that are appropriate in the circumstances, but not for the purpose of expressing an opinion on whether the Bank has in place an adequate internal financial controls system over financial reporting and the operating effectiveness of such controls. An audit also includes evaluating the appropriateness of the accounting policies used and the reasonableness of the accounting estimates made by the Bank’s Management, as well as evaluating the overall presentation of the financial statements.We believe that the audit evidence we have obtained is sufficient and appropriate to provide a basis for our audit opinion on the financial statements.
OpinionIn our opinion and to the best of our information and according to the explanations given to us, theaforesaid financial statements give the information required by the Banking Regulation Act, 1949; the Companies Act, 2013 in the manner so required for banking companies and the Guidelines issued by the Reserve Bank of India from time to time and give a true and fair view in conformity with the accounting principles generally accepted in India, of the state of affairs of the Bank as at 31 March, 2015, and its profit and its cash flows for the year ended on that date.
Other MatterThe audit of financial statements of the Bank for the year ended 31 March, 2014 was carried out by the previous auditors of the Bank.Our opinion is not modified in respect of this matter.
Report on Other Legal and Regulatory Requirements1. As required by Section 143 (3) of the Companies Act, 2013 and Section 30 of the Banking Regulation Act, 1949 we report that: (a) We have sought and obtained all the information and explanations which to the best of our knowledge and belief were necessary for the purposes of our audit
and found them to be satisfactory. (b) In our opinion, the transactions of the Bank which have come to our notice have been within the powers of the Bank. (c) As explained in paragraph 2 below, the financial accounting systems of the Bank are centralised and, therefore, accounting returns are not required to be
submitted by the Branches. (d) In our opinion, proper books of account as required by law have been kept by the Bank so far as it appears from our examination of those books. (e) The Balance Sheet, the Profit and Loss Account, and the Cash Flow Statement dealt with by this Report are in agreement with the books of account. (f) In our opinion, the aforesaid financial statements comply with the Accounting Standards specified under Section 133 of the Act, read with Rule 7 of the
Companies (Accounts)Rules, 2014 in so far as they apply to banks. (g) With respect to the other matters to be included in the Auditor’s Report in accordance with Rule 11 of the Companies (Audit and Auditors) Rules, 2014, in our
opinion and to the best of our information and according to the explanations given to us: i. The Bank has disclosed the impact of pending litigations on its financial position in its financial statements – Refer Schedule 12, Schedule 17 - Note 4.11
and Schedule 18 - Note 2.10 to the financial statements; ii. The Bank has made provision, as required under the applicable law or accounting standards, for material foreseeable losses, if any, on long-term contracts
including derivative contracts – Refer Schedule 17 - Note 4.11 and Schedule 18 - Note 1.19 to the financial statements; iii. There were no amounts which were required to be transferred to the Investor Education and Protection Fund by the Bank.2. We report that during the course of our audit we have visited and performed select relevant audit procedures at 7 branches. Since the Bank considers its key
operations to be automated, with the key applications largely integrated to the core banking systems, it does not require its branches to submit any financial returns. Accordingly our audit is carried out centrally at the Head Office based on the necessary records and data required for the purposes of our audit being made available to us.
For DELOITTE HASKINS & SELLSChartered Accountants(Firm’s Registration No. 117365W)
Rukshad N. DaruvalaPartner(Membership No.111188)
Mumbai, 29th June, 2015

THE ROYAL BANK OF SCOTLAND N.V. (Incorporated in the Netherlands with Limited Liability)
INDIAN BRANCHES
2
BALANCE SHEET AS AT 31 MARCH 2015
Schedules As at31 March 2015
Rs. in 000's
As at 31 March 2014 Rs. in 000's
CAPITAL AND LIABILITIESCAPITAL 1 1,690,151 1,690,151 RESERVES AND SURPLUS 2 27,033,332 28,518,092 DEPOSITS 3 105,127,392 116,256,487 BORROWINGS 4 26,266,924 21,083,422 OTHER LIABILITIES AND PROVISIONS
5 30,075,378 36,114,706
TOTAL 190,193,177 203,662,858 ASSETSCASH AND BALANCES WITH THE RESERVE BANK OF INDIA 6 9,969,020 9,205,380 BALANCES WITH BANKS AND MONEYAT CALL AND SHORT NOTICE 7 1,100,851 2,155,554 INVESTMENTS 8 46,463,221 54,377,678 ADVANCES 9 111,507,405 111,351,659 FIXED ASSETS 10 623,882 728,062 OTHER ASSETS 11 20,528,798 25,844,525 TOTAL 190,193,177 203,662,858 CONTINGENT LIABILITIES 12 1,249,079,666 1,191,875,311 BILLS FOR COLLECTION 77,682,625 134,973,135
SIGNIFICANT ACCOUNTING POLICIES & NOTES TO ACCOUNTS
17 / 18
Schedules referred to herein form an integral part of the Balance SheetThe Balance Sheet has been prepared in conformity with Form ‘A’ of the Third Schedule to the Banking Regulation Act, 1949.
As per our report of even date attached.
PROFIT AND LOSS ACCOUNT FOR THE YEAR ENDED 31 MARCH 2015
SCHEDULES For the year ended
31 March 2015Rs. in 000's
For the year ended
31 March 2014Rs. in 000's
I INCOMEINTEREST EARNED 13 14,306,477 17,437,905 OTHER INCOME 14 3,346,450 6,549,541
TOTAL 17,652,927 23,987,446 II EXPENDITURE
INTEREST EXPENDED 15 6,794,711 7,852,733 OPERATING EXPENSES 16 7,880,514 9,318,005 PROVISIONS AND CONTINGENCIES (Refer Schedule 18-1.19) 1,805,909 3,264,466
TOTAL 16,481,134 20,435,204 III PROFIT
NET PROFIT FOR THE YEAR (Refer Schedule 18-2.11) 1,171,793 3,552,242
TOTAL 1,171,793 3,552,242 IV APPROPRIATIONS
TRANSFER TO STATUTORY RESERVE 292,948 888,061 INVESTMENT RESERVE (Refer Schedule 18-2.14) 33,269 7,628 BALANCE CARRIED FORWARD TO BALANCE SHEET 845,576 2,656,553
TOTAL 1,171,793 3,552,242
SIGNIFICANT ACCOUNTING POLICIES & NOTES TO ACCOUNTS
17 / 18
Schedules referred to herein form an integral part of the Profit and Loss AccountThe Profit and Loss Account has been prepared in conformity with Form ‘B’ of the Third Schedule to the Banking Regulation Act, 1949.As per our report of even date attached.
For Deloitte Haskins & Sells For The Royal Bank of Scotland N.V. - Indian Branches
Chartered Accountants Brijesh Mehra Jaykumar Shah Rukshad N. Daruvala Country Executive - India Chief Financial Officer - India Partner
Mumbai, 29 June 2015 Mumbai, 29 June 2015 Mumbai, 29 June 2015

THE ROYAL BANK OF SCOTLAND N.V. (Incorporated in the Netherlands with Limited Liability)
INDIAN BRANCHES
3
CASH FLOW STATEMENT
Year ended 31 March 2015 (Rs. in 000's)
Year ended 31 March 2014 (Rs. in 000's)
Cash flows from Operating ActivitiesNet Profit before taxes 2,926,013 6,621,173 Adjustment forDepreciation on Bank's property 304,655 369,148 Provision for Depreciation/(Write back) on Investments (78,179) 60,255 Amortisation of premium on HTM Investments 12,753 8,044 Interest on Sub-ordinated Debt / Innovative Perpetual Debt / Hybrid Capital 532,106 603,293 Provision towards NPAs (net of write backs) (431,394) (1,237,654)Bad Debts written off 337,896 1,372,934 Provision on standard assets including Unhedged Foreign Currency Exposure 223,366 - (Profit)/Loss on sale of Fixed Assets 4,860 (36,228)Net Unrealised Exchange Loss/(Gain) on Innovative Perpetual Debt / Hybrid Capital (1,522,757) 692,974 Operating Profit before changes in working capital 2,309,319 8,453,939 Changes in working capitalDecrease in Other Liabilities and Provisions (6,260,536) (283,745)Decrease in Deposits (11,129,095) (11,237,654)Decrease in Investments 7,979,883 36,789,065 (Increase) / Decrease in Advances (62,248) 13,852,119 Decrease in Other Assets 5,087,499 2,194,336
(4,384,497) 41,314,121 (2,075,178) 49,768,060
Taxes paid (1,525,992) (2,065,708)Net cash from / (used in) Operating Activities (3,601,170) 47,702,352 Cash flows from Investing ActivitiesPurchase of Fixed Assets (221,481) (66,971)Proceeds from sale of Fixed Assets 16,146 49,101 Net cash from / (used in) Investing Activities (205,335) (17,870)Cash flows from Financing Activities:Profit remitted to Head office during the year (2,656,553) (1,663,221)Increase / (Decrease) in Other Borrowings 6,706,259 (50,835,099)Interest on Sub-ordinated Debt / Innovative Perpetual Debt / Hybrid Capital (534,264) (761,716)Net cash from / (used in) Financing Activities 3,515,442 (53,260,036)
Net Increase / (Decrease) in cash and cash equivalents (291,063) (5,575,554)Cash and cash equivalents as at April 1 11,360,934 16,936,488 Cash and cash equivalents as at March 31 11,069,871 11,360,934 Notes to the Cash flow statement:Cash and cash equivalents includes the following
31 March 2015 (Rs. in 000's)
31 March 2014 (Rs. in 000's)
Cash and Balances with Reserve Bank of India 9,969,020 9,205,380 Balances with Banks and Money at Call and Short Notice 1,100,851 2,155,554
11,069,871 11,360,934
As per our report of even date attached.
For Deloitte Haskins & Sells For The Royal Bank of Scotland N.V. - Indian Branches
Chartered Accountants Brijesh Mehra Jaykumar Shah Rukshad N. Daruvala Country Executive - India Chief Financial Officer - India Partner
Mumbai, 29 June 2015 Mumbai, 29 June 2015 Mumbai, 29 June 2015

THE ROYAL BANK OF SCOTLAND N.V. (Incorporated in the Netherlands with Limited Liability)
INDIAN BRANCHES
4
SCHEDULES FORMING PART OF THE BALANCE SHEET AS AT 31 MARCH 2015
As at31 March 2015
Rs. in 000's
As at31 March 2014
Rs.in 000's
SCHEDULE 1 - CAPITAL I Amount of Deposit kept with the
Reserve
Bank of India under Section 11(2)(b)of the Banking Regulation Act ,1949 8,050,000 7,150,000
II Head Office Account 1,690,151 1,690,151TOTAL 1,690,151 1,690,151
SCHEDULE 2 - RESERVES AND SURPLUS
I Statutory Reserve(Under Section 11(2)(b)(ii) of the Banking RegulationAct, 1949)Opening balance 7,987,423 7,099,362 Additions during the year 292,948 888,061 Closing balance 8,280,371 7,987,423
II Capital ReserveOpening balance 223,638 223,638 Additions during the year - - Closing balance 223,638 223,638
III Property Investment ReserveOpening balance 82,749 82,749 Additions during the year - - Closing balance 82,749 82,749
IV Special Reserve for Residential Housing Loans 60,355 60,355 (Under Section 36(i)(viii) of the Income Tax Act, 1961)
V Head Office Charges Reserve Opening balance 3,006,951 3,006,951 Additions during the year (Refer schedule 18-2.3) - - Closing balance 3,006,951 3,006,951
VI Investment ReservesOpening balance 130,859 123,231 Additions during the year (Refer Schedule 18-2.14) 33,269 7,628 Closing balance 164,128 130,859
VII Remittable Surplus Retained for CRAR Requirements Opening Balance 14,369,564 14,369,564 Additions during the Year - - Closing balance 14,369,564 14,369,564
VIII Balance of Profit and Loss AccountOpening balance 2,656,553 1,663,221 Additions during the Year 845,576 2,656,553 Profit remitted to Head Office during the year (2,656,553) (1,663,221)Closing balance 845,576 2,656,553
TOTAL 27,033,332 28,518,092
SCHEDULE 3 - DEPOSITS
A. I Demand deposits i) From banks 1,854,739 369,340 ii) From others 21,817,124 25,169,564 II Savings bank deposits 20,626,200 22,856,149 III Term Deposits i) From banks 5,143 5,143 ii) From others 60,824,186 67,856,291 TOTAL 105,127,392 116,256,487
B. i) Deposits of branches in India 105,127,392 116,256,487 ii) Deposits of branches outside India - -
TOTAL 105,127,392 116,256,487
SCHEDULE 4 - BORROWINGS
I Borrowings in India i) Reserve Bank of India 2,300,000 1,000,000 ii) Other banks 3,000,000 -
iii) Other institutions and agencies 3,445,643 - II Borrowings outside India i) From banks 4,147,439 5,186,823 ii) From others - - iii) Innovative perpetual debt 4,256,528 4,741,179 iv) Hybrid capital 9,117,314 10,155,420
TOTAL 26,266,924 21,083,422 Secured Borrowings included in I and II above is Rs. 5,745,643 thousand (Previous year: Rs.1,000,000 thousand)
SCHEDULE 5 - OTHER LIABILITIES AND PROVISIONSI Bills payable 881,834 1,112,822 II Inter-branch adjustments (net) - - III Interest accrued 1,145,275 755,965 IV Provisions on Standard Assets (Refer
Schedule 18-1.12) 2,087,301 1,863,935 V Provision for Tax (Net of Advance Tax) - - VI Others (including provisions) 25,960,968 32,381,984
TOTAL 30,075,378 36,114,706
SCHEDULE 6 - CASH AND BALANCES WITH THE RESERVE BANK OF INDIA I Cash in hand 354,337 352,966
(including foreign currency notes) II Balances with the Reserve Bank of
India i) In current accounts 9,614,683 7,052,414 ii) In other accounts - 1,800,000 TOTAL 9,969,020 9,205,380
SCHEDULE 7 - BALANCES WITH BANKS AND MONEY AT CALL AND SHORT NOTICEI In India i) Balances with banks
a) In current accounts 15,861 76,241 b) In other deposit accounts 75 75
ii) Money at call and short notice a) With banks - - b) With other institutions - -
15,936 76,316 II Outside India i) In current accounts 1,084,915 2,079,238 ii) Deposit accounts - - iii) Money at call and short notice - -
1,084,915 2,079,238
TOTAL 1,100,851 2,155,554
SCHEDULE 8 - INVESTMENTS I Investments in India i) Government Securities (Refer
Schedule 18-2.2) 46,463,221 54,377,678 ii) Other Approved Securities - - iii) Shares - - iv) Debentures and Bonds - - v) Subsidiaries and Joint Ventures - - vi) Others - -
46,463,221 54,377,678 II Investments outside India - -
TOTAL 46,463,221 54,377,678 Gross Investments 46,463,221 54,455,857 Less : Provision for dimunition in value - (78,179)
TOTAL 46,463,221 54,377,678
SCHEDULE 9 - ADVANCESA i) Bills purchased and discounted 15,993,770 22,085,288 ii) Cash credits, overdrafts and
loans repayable on demand 42,014,526 52,408,787 iii) Term loans 53,499,109 36,857,584
TOTAL 111,507,405 111,351,659 B i) Secured by tangible assets * 58,824,470 55,653,364
ii) Covered by bank / government guarantees 391,239 1,582,004
iii) Unsecured 52,291,696 54,116,291 TOTAL 111,507,405 111,351,659

THE ROYAL BANK OF SCOTLAND N.V. (Incorporated in the Netherlands with Limited Liability)
INDIAN BRANCHES
5
C I Advances in India i) Priority sector 42,425,582 53,670,421 ii) Public sector - 75 iii) Banks 12,285 1,241,065
iv) Others 69,069,538 56,440,098 TOTAL 111,507,405 111,351,659
C II Advances Outside India - - TOTAL 111,507,405 111,351,659
* Includes advances against book debts
SCHEDULE 10 - FIXED ASSETSI Premises At Book Value
Beginning of the year 313,075 313,307 Additions during the year - - Deductions during the year - (232)
313,075 313,075 Depreciation to Date
Beginning of the year 147,145 141,888 Additions during the year 5,122 5,389 Deductions during the year - (132)
152,267 147,145 160,808 165,930
II Other fixed assets (Refer Schedule 18-2.5 & 2.13) (including furniture & fixtures and software)At Book Value
Beginning of the year 3,843,468 3,966,901 Additions during the year 221,481 184,912
Deductions during the year (554,721) (308,345) 3,510,228 3,843,468
Depreciation to DateBeginning of the year 3,281,336 3,213,149 Additions during the year 299,533 363,759 Deductions during the year (533,715) (295,572)
3,047,154 3,281,336 463,074 562,132
TOTAL 623,882 728,062
SCHEDULE 11 - OTHER ASSETSI Inter-branch adjustments (net) - - II Interest accrued 1,312,661 1,546,680 III Advance tax and tax deducted at
source 2,546,759 2,487,148 (net of provision for tax)
IV Stationery and stamps - - V Non-banking assets acquired in
satisfaction - - of claims
VI Deferred tax asset (Refer Schedule 18-2.9) 2,294,645 2,582,484
VII Others 14,374,733 19,228,213 TOTAL 20,528,798 25,844,525
SCHEDULE 12 - CONTINGENT LIABILITIES
I Claims against the bank not acknowledged as debts (including tax matters) 988,341 2,183,496
II Liability on account of outstanding derivative contracts 517,389,990 533,667,428 (including Forward rate agreements, Interest rate swaps, Currency swaps and Options)
III Liability on account of outstanding foreign exchange contracts 657,689,866 582,751,652
IV Guarantees given on behalf of constituents i) In India 59,209,530 56,203,065 ii) Outside India 3,544,744 5,234,677
V Acceptances, endorsements and other obligations 6,455,413 11,066,532
VI Other items for which the Bank is contingently liable 3,801,782 768,461
TOTAL 1,249,079,666 1,191,875,311
SCHEDULES FORMING PART OF THE PROFIT AND LOSS ACCOUNT FOR THE YEAR ENDED 31 MARCH 2015
Year ended 31 March 2015 Rs.in 000's
Year ended 31 March 2014 Rs.in 000's
SCHEDULE 13 - INTEREST EARNEDI Interest / discount on advances / bills 9,514,016 9,469,885 II Income on investments 3,963,825 6,331,060 III Interest on balances with the 712,336 1,529,990
Reserve Bank of India and other inter bank funds
IV Others 116,300 106,970 TOTAL 14,306,477 17,437,905
SCHEDULE 14 - OTHER INCOME I Commission, exchange and brokerage 1,610,483 2,589,429 II Profit on sale of investments (net) 105,884 227,175 III Profit / (loss) on sale of land, buildings (4,860) 36,228
and other assets (net)IV Profit on exchange transactions (net) 1,629,618 1,838,567
(includes profit / (loss) on derivative transactions (net))
V Miscellaneous income (includes recovery from written off debts) 5,325 1,858,142
TOTAL 3,346,450 6,549,541
SCHEDULE 15 - INTEREST EXPENDEDI Interest on deposits 5,693,607 6,565,955 II Interest on Reserve Bank of India / 1,101,104 1,286,778
inter bank borrowingsIII Others - -
TOTAL 6,794,711 7,852,733
SCHEDULE 16 - OPERATING EXPENSESI Payments to and provision for employees
(Refer Schedule 18-2.1) 3,262,060 3,754,145 II Rents, taxes and lighting (Refer
Schedule 18-2.6) 756,778 904,489 III Printing and stationery 52,695 62,904 IV Advertisement and publicity 42,736 126,109 V Depreciation on bank's property 304,655 369,148 VI Auditors' fees and expenses 8,900 12,714 VII Law charges 21,870 30,717 VIII Postage, telegrams and telephones 131,406 246,650 IX Repairs and maintenance 561,144 304,095 X Insurance 147,043 81,334 XI Head Office charges 116,262 247,992 XII Other expenditure (Refer Schedule
18-2.4) 2,474,965 3,177,708 TOTAL 7,880,514 9,318,005
Schedule 17
1. Background The accompanying financial statements for the year ended 31 March 2015
comprise the Balance Sheet as at 31 March 2015, Profit and Loss Account and Cash Flow Statement for the year then ended of the Indian Branches of The Royal Bank of Scotland N.V. (‘the Bank’) which is incorporated in the Netherlands with limited liability.
2. Basis of preparation The financial statements have been prepared in accordance with requirements
prescribed under the Banking Regulation Act, 1949. The accounting and reporting policies of the Bank used in the preparation of these financial statements is the accrual method of accounting and historical cost convention (except where otherwise stated) and it confirms with Generally Accepted Accounting Principles in India (“Indian GAAP”), the Accounting Standards specified under section 133 of the Companies Act, 2013 read with Rule 7 of the Companies (Accounts) Rules, 2014 and other relevant provisions of the Companies Act, 2013 (“the 2013 Act”)/Companies Act, 1956 (“the 1956 Act”), in so far as they apply to banks and the guidelines issued by the Reserve Bank of India (“RBI”).
3. Use of estimates The preparation of the financial statements in conformity with the generally
accepted accounting principles (‘GAAP’) requires the Management to make estimates and assumptions that affect the reported amounts of assets, liabilities, revenues and expenses and disclosures of contingent liabilities as at the date

THE ROYAL BANK OF SCOTLAND N.V. (Incorporated in the Netherlands with Limited Liability)
INDIAN BRANCHES
6
of the financial statements. Management believes that the estimates used in preparation of the financial statements are prudent and reasonable. Actual results could differ from those estimates. Any revision to accounting estimates is recognised prospectively in the current and future periods.
4. Significant accounting policies4.1 Investments Recognition and Classification Investments are accounted for in accordance with the extant RBI guidelines
on investment classification and valuation. Investments are classified into the following three categories: l Held to Maturity (‘HTM’); l Held for Trading (‘HFT’); and l Available for Sale (‘AFS’) Under each classification, the investments are further categorised as (a)
Government Securities, (b) Other Approved Securities, (c) Shares, (d) Debentures and Bonds, (e) Subsidiaries and Joint Ventures and (f) Others.
For disclosure in the Balance Sheet, investments are classified under above mentioned six categories.
Recognition and Classification The Bank follows trade date method of accounting for purchase and sale of
investments, except for Government of India and State Government securities where settlement date method of accounting is followed in accordance with RBI guidelines.
Acquisition cost/carrying cost Cost of investment represents the acquisition cost and in case of discounted
instruments, the carrying cost includes the pro rata discount accreted for the holding period. Accretion on Treasury Bills is calculated on the weighted average cost method.
Brokerages, commission, broken period interest, etc. on debt instruments, paid at the time of acquisition, are charged to the Profit and Loss Account.
Disposal of Investments: l Investments classified as HFT or AFS – Profit or loss on sale/redemption
is included in the Profit and Loss Account. l Investment classified as HTM – Profit on sale/redemption of investments
is included in the Profit and Loss Account and is appropriated to Capital Reserve after adjustments for tax and transfer to Statutory Reserve. Loss on sale/redemption is charged to the Profit and Loss Account.
Transfer between categories Transfer of securities between categories of investments is carried out
in accordance with the RBI guidelines and accounted for at the lower of acquisition cost, book value and market value on the date of transfer and the depreciation, if any, on such transfer is fully provided for.
Valuation/income recognition Investments classified under the HTM category are carried at their acquisition
cost or at amortised cost, if acquired at a premium over the face value. Any premium paid on acquisition in excess of face value is amortised over the period remaining to maturity on a straight-line basis. Discount, if any, is ignored. A provision is made for other than temporary diminution in the value of the HTM security.
Investments classified under the AFS category are marked-to-market on a quarterly or at more frequent intervals and the net depreciation, if any, in each classification as mentioned in Schedule 8 – ‘Investments’ is recognised in the Profit and Loss Account. The net appreciation, if any, is ignored. The book value of the individual securities is not changed consequent to the periodical valuation of investments.
Investments classified under the HFT category are marked-to-market on a monthly or at more frequent intervals and the net depreciation, if any, in each classification as mentioned in Schedule 8 – ‘Investments’ is recognised in the Profit and Loss Account. The net appreciation, if any, is ignored. The book value of the individual securities is not changed consequent to the periodical valuation of investments.
In the event, provisions created on account of depreciation in the AFS or HFT categories are found to be in excess of the required amount in any year, the excess is credited to the Profit and Loss Account and the excess is thereafter appropriated (net of taxes, if any and net of transfer to Statutory Reserve as applicable) to Investment Reserve Account.
Profit or loss on sale of securities is computed on the basis of the weighted average cost. Market price of securities is sourced from the revaluation rates published by the Fixed Income Money Market and Derivatives Association of India (‘FIMMDA’).
Treasury Bills, Commercial Paper and Certificates of Deposit, being discounted instruments, are valued at carrying cost.
Accounting for repurchase/reverse repurchase transactions Securities sold under agreements to repurchase (Repos) and securities
purchased under agreements to resell (Reverse Repos) are accounted as
collateralised borrowing and lending transactions respectively. The difference between the consideration amount of the first leg and the second leg of the repo is recognised as interest income/interest expense over the period of transaction.
4.2. Advances and Provisions/write-offs Advances are classified as performing and non-performing advances (“NPA”)
in accordance with RBI prudential norms on classification. Further, NPAs are classified into sub-standard, doubtful and loss assets based on the criteria stipulated by RBI.
Advances are stated net of specific provisions, interest in suspense, provision for impaired assets, Export Credit Guarantee Corporation Limited (‘ECGC’) claims and bills rediscounted and provisions in lieu of diminution in the fair value of restructured assets.
Specific loan loss provisions in respect of non-performing advances are made based on the Management’s assessment of the degree of impairment of the advances after considering the prudential norms on provisioning as prescribed by the RBI.
In the case of consumer loans, provisions are made upon reaching specified stages of delinquency under each type of loan after considering the prudential norms on provisioning prescribed by the RBI.
As per the RBI guidelines, a general provision is required to be made on all standard advances based on the category of advances and additionally on Unhedged Foreign Currency Exposure of borrowers. These provisions are made in line with the RBI guidelines and are disclosed under Schedule 5 - ‘Provisions on Standard Assets’.
Provision for restructured assets is made in accordance with the applicable requirements prescribed by the RBI on restructuring of advances by banks. Necessary provision for diminution in the fair value of a restructured account is made. Restructuring of an account is done at a borrower level.
Amounts recovered against debts written-off in earlier years and provisions no longer considered necessary in the context of the current status of the borrower are recognised in the Profit and Loss Account.
Further to provisions required as per the asset classification status, provisions are held for individual country exposure as per the RBI guidelines. Exposure is classified in the seven risk categories as mentioned in the Export Credit Guarantee Corporation of India Limited. (ECGC) guidelines and provisioning is done for the respective countries (except Head Office and its Branches) if the net funded exposure is one percent or more of the Bank’s total assets based on the rates laid down by the RBI.
4.3. Transactions involving foreign exchange Monetary assets and liabilities denominated in foreign currency are translated
into Indian rupees at the year end exchange rates notified by the Foreign Exchange Dealers’ Association of India (‘FEDAI’) and the resulting profits/losses from year-end revaluation are recognised in the Profit and Loss Account.
Non-monetary items, which are measured in terms of historical cost denominated in a foreign currency, are reported using the exchange rate at the date of the transaction. Non-monetary items, which are measured at fair value or other similar valuation denominated in a foreign currency, are translated using the exchange rate at the date when such value was determined.
Hybrid capital/innovative perpetual debt capital is reported in the financial statements at the exchange rate notified by FEDAI. The resultant gain or losses are recognised in the Profit and Loss Account.
Outstanding forward exchange contracts are revalued at the exchange rates notified by FEDAI for specified maturities and at extrapolated rates for contracts of intervening maturities. The foreign exchange contracts of longer maturities where exchange rates are not notified by FEDAI are revalued at the exchange rates implied by the USD/INR Currency Swap curve. The resultant gains or losses are recognised in the Profit and Loss Account.
Income and expenditure in foreign currency are translated at the exchange rates prevailing on the date of the transaction.
Contingent liabilities denominated in foreign currencies are disclosed at the closing rates of exchange notified by FEDAI.
4.4. Derivative instruments Derivative instruments include foreign currency options, interest rate
swaps (‘IRS’), cross currency interest rate swaps (‘CCS’) and forward rate agreements (‘FRA’) which are undertaken for trading or hedging purposes. Derivatives undertaken for trading purposes are measured at their fair value and the resultant gain or loss is recognised in the Profit and Loss Account.
The Bank treats all derivatives (except for derivative transactions that are undertaken for hedging are accounted on accrual basis) which include all customer and proprietary transactions together with any associated hedges and trades done for hedging the Balance Sheet as ‘trading’ derivatives.
Derivatives are classified as assets under Schedule 11 -‘Other Assets’ when the fair value is positive (positive marked to market) or as liabilities Schedule 5 – ‘Other Liabilities’ when the fair value is negative (negative marked to market).

THE ROYAL BANK OF SCOTLAND N.V. (Incorporated in the Netherlands with Limited Liability)
INDIAN BRANCHES
7
Changes in the fair value of derivatives other than those designated as hedges are recognised in the Profit and Loss Account.
Pursuant to RBI guidelines, any receivables under derivative contracts which remain overdue for more than 90 days and mark-to-market gains on other derivative contracts with the same counter-parties are reversed through Profit and Loss Account.
4.5. Revenue recognition Income is recognised to the extent that it is probable that the economic benefits
will flow to the Bank and the income can be reliably measured. Interest income is recognised in the Profit and Loss Account on an accrual
basis except in case of interest on non-performing advances, where it is recognised on receipt basis as per the income recognition and asset classification norms of RBI and the relevant Accounting Standards.
Loan processing fee is accounted for upfront when it becomes due. Fees received on credit cards are recognised upfront in the year of issuance/renewal.
Commission on letters of credit is recognised at the inception of the transaction. Commission income on guarantees is recognised on a straight-line basis over the period of the guarantee if the commission received is greater than INR equivalent of Eur 10,000. Commission income on buyers credit is recognised on a straight-line basis over the period of the loan if the commission received is greater than INR equivalent of GBP 50,000.
Income on discounted instruments is recognised over the tenure of the instrument on a constant yield basis.
All other fees are accounted for as and when they become due.4.6. Acquisition costs for procuring consumer loans Commission paid to sales agents for acquisition of consumer loans and other
related loan acquisition costs is charged to the Profit and Loss Account in the year in which they are incurred.
4.7. Fixed assets and depreciation Fixed assets are stated at historical cost less accumulated depreciation
and provision for impairment, if any. Cost includes freight, duties, taxes and incidental expenses related to the acquisition and installation of the asset. Historical cost for this purpose includes the written down value as at 31 March 1991 for fixed assets acquired up to that date and the cost of acquisition for fixed assets acquired thereafter.
Depreciation is provided on a pro-rata basis on a Straight Line Method over the estimated useful life of the assets which is lower than useful life prescribed under Schedule II of the Companies Act, 2013 in order to reflect the actual usage of the assets. The estimates of useful lives of the assets are based on a management estimate, taking into account the nature of the asset, the estimated usage of the asset, and the operating conditions surrounding the use of the asset etc. Based on the above, the useful life of the assets has not undergone a change on account of transition to the Companies Act, 2013.
Asset Type Estimated Useful Life in YearsPremises 50
Improvement of leasehold premises Over the primary period of lease subject to maximum of 5 years
Furniture and fixtures 5Other equipment 5Vehicles (including leased assets) 3Computer Equipment (including software) 3
All fixed assets individually costing less than Rs 5,000 are fully depreciated in the year of acquisition.If the Management’s estimate of the remaining useful life on a subsequent review is shorter, then depreciation is provided at a higher rate.4.8. Leases Finance Leases Finance leases which effectively transfer substantially all the risks and benefits
incidental to ownership of the lease term are capitalised at the lower of the fair value and present value of the minimum lease payments at the inception of the lease term and disclosed as leased assets. Lease payments are apportioned between the finance charges and reduction of the lease liability based on the implicit rate of return. Finance charges are charged directly against income. Lease management fees, legal charges and other initial direct costs are capitalised.
If there is no reasonable certainty that the Bank will obtain the ownership by the end of the lease term, capitalised assets are depreciated over the shorter of the estimated useful life of the asset or the lease term.
Assets taken on lease are recognised as fixed assets at the fair market value of the assets or present value of minimum lease payments as prescribed under Accounting Standard 19- “Leases” specified under section 133 of the Companies Act, 2013 read with Rule 7 of the Companies (Accounts) Rules, 2014.
Operating Leases Leases where the lessor effectively retains substantially all the risks and
benefits of ownership over the lease term are classified as operating leases. Operating lease rentals are recognised as an expense in the Profit and Loss Account on a straight-line basis over the lease period.
4.9. Employee Benefits Provident fund The Provident Fund Plan of the Bank is a defined contribution scheme. The
Bank’s contributions paid/payable towards Provident Fund are charged to the Profit and Loss Account every year. These funds and the schemes there under are recognised by the Income-tax authorities and administered by various trustees.
Gratuity and Pension The Bank has defined benefit plans for post employment benefits in the form
of Gratuity which is funded and Pension which is partly funded. Provisions for gratuity and pension which are defined benefit schemes are made on the basis of an independent actuarial valuation carried out as per the Projected Unit Credit Method as at the year end. The fair value of plan assets are compared with the liabilities and shortfall, if any, is provided in the financial statements.
Deferred Bonus Scheme The Bank accounts for its defined benefit obligation for non-funded deferred
bonus benefits on the basis of an independent actuarial valuation as per the Projected Unit Credit Method carried out as at the year end.
Compensated absences Liability for long term compensated absences for employees is accounted on
the basis of an independent actuarial valuation as per the Projected Unit Credit Method carried out as at the year end. Unutilised short term compensated absences are provided for on an undiscounted basis.
Long Service Award Liability for long term service award for employees is accounted on the basis
of an independent actuarial valuation as per the Projected Unit Credit method carried out as at the year end
Actuarial gains/losses are immediately recognised in the Profit and Loss Account.
Other short term employee benefits are recognised on an undiscounted basis on their likely entitlement thereof.
4.10. Income taxes Income tax comprises the current tax provision and the net change in the
deferred tax asset or liability in the year. The current tax expense and deferred tax expense is determined in
accordance with the provisions of the Income Tax Act, 1961 and as per Accounting Standard 22 – Accounting for Taxes on Income specified under section 133 of the Companies Act, 2013 read with Rule 7 of the Companies (Accounts) Rules, 2014.
Deferred tax assets and liabilities arising on account of timing difference are recognised in the Profit and Loss Account and the cumulative effect thereof is reflected in the Balance Sheet. Deferred tax assets are recognised only if there is a reasonable certainty that they will be realised, except for deferred tax assets in respect of unabsorbed depreciation and carry forward losses which are only recognised to the extent that it is virtually certain that they will be realised. Deferred tax assets and liabilities are measured using the tax rates that have been enacted or substantively enacted by the Balance Sheet date. The effect on deferred tax assets and liabilities of a change in tax rates is recognised in the Profit and Loss Account in the period of change.
4.11. Provisions, contingent liabilities and contingent assets Provisions are created when there is a present obligation as a result of a past
event that probably requires an outflow of resources and a reliable estimate can be made of the amount of the obligation. A disclosure for a contingent liability is made when there is a possible obligation or a present obligation that may, but probably will not, require an outflow of resources. When there is a possible obligation or a present obligation in respect of which the likelihood of outflow of resources is remote, no provision or disclosure is made.
Provision for reward points are determined based on past redemption pattern and periodically reassessed and adjusted based on changes in redemption behaviour. Provisions are utilised when the customer actually redeems the points or when they lose their eligibility to utilise the points.
Provisions are reviewed at each Balance Sheet date and adjusted to reflect the current best estimates. If it is no longer probable that an outflow of resources would be required to settle the obligation, the provision is reversed.
Contingent assets are not recognised in the financial statements since this may result in the recognition of income that may never be realised. Such assets are assessed continually and recognised in the period in which it is virtually certain that the inflow of economic benefits will arise.

THE ROYAL BANK OF SCOTLAND N.V. (Incorporated in the Netherlands with Limited Liability)
INDIAN BRANCHES
8
4.12. Impairment The carrying amounts of assets are reviewed at each Balance Sheet date
for any indication of impairment based on internal/external factors. An impairment loss is recognised wherever the carrying amount of an asset exceeds its recoverable amount. The recoverable amount is the greater of the asset’s net selling price and “value in use”. In assessing “value in use”, the estimated future cash flows are discounted to their present value at the weighted average cost of capital. After impairment, depreciation is provided on the revised carrying amount of the asset over its remaining useful life. If at the Balance Sheet date, there is an indication that a previously assessed impairment loss no longer exists, the recoverable amount is reassessed and the asset is reflected at the recoverable amount subject to a maximum of depreciable historical cost.
4.13. Cash and cash equivalents Cash and cash equivalents include cash in hand and in ATM/in transit,
balances with RBI, balances with other banks and money at call and short notice (including the effect of changes in exchange rates of cash and cash equivalents in foreign currency).
Schedule 181. Statutory disclosures as per the RBI guidelines1.1. Capital adequacy ratio The capital adequacy ratio computed under Basel III guidelines are as under:
(Rs. in 000’s)
Particulars 31 March 2015 31 March 2014Common Equity Tier I Capital Ratio (%) 10.76% 11.54%Tier I Capital Ratio (%) 11.26% 11.94%Tier II Capital Ratio (%) 2.97% 3.38%Total Capital Ratio (CRAR) (%) 14.23% 15.31%Percentage of the shareholding of the Government of India Nil NilAmount of equity capital raised Nil NilAmount of Additional Tier I capital raised of which :PNCPS Nil NilPDI Nil NilAmount of Tier 2 capital raised of which :Debt capital instrument Nil NilPreference share capital instrument Nil Nil
1.2. Business ratios/informationThe details relating to business ratios are given below
Particulars 31 March 2015 31 March 2014i) Interest income as percentage of
working funds 7.26% 8.20%ii) Non-interest income as percentage of
working funds 1.70% 3.08%iii) Operating profits as percentage of
working funds 1.51% 3.20%iv) Return on assets (%) 0.59% 1.67%v) Business (deposits plus advances) per
employee (Rs.000s) 313,540 288,734vi) Net Profit per employee (Rs.000s) 1,711 4,514
1. For computation of ratios in (i), (ii), (iii) and (iv), working funds represent monthly average of total assets as reported to the RBI in the DSB returns.
2. For computation of ratios in (v), deposits (excluding Inter-bank deposits) plus advances as at year end have been considered.
3. For computation of ratios in (v) and (vi), number of employees as at the year end have been considered.
1.3. Derivative instruments Risk management of derivatives The Bank offers derivative products to its customers for hedging various types
of risk exposures. The Bank is also an active market maker in the derivatives market and uses derivatives to manage Balance Sheet exposures.
The Bank follows the policies and controls laid out by RBS Group for identifying, evaluating, monitoring and controlling key risks pertaining to the Bank’s derivative business in India. Key risks inherent in the derivative business carried out by the Bank in India include credit, market and operational risks for which policies, procedures and limits are established to manage them.
In terms of the organisation structure for risk management, the Bank has separate teams monitoring and managing various risks such as credit risk, market risk and operational risk. All these teams report to the Credit Risk Officer - India. The Bank also has a comprehensive Client Suitability and Appropriateness Policy, to ensure that derivative products offered to clients are in line with the size and sophistication of the client, and which meet the client’s risk management requirements. Derivatives transactions are covered under International Swap Dealers Association (ISDA) master agreements with the respective counter-parties.
Market risk, operational risk, and credit risk (counter-party risk) are monitored as follows:
Market risk The Bank has set in place Value at Risk (VaR) limits, which are based on the
Historical Simulation Method to control and monitor market risk. The Bank has also in place PV01 limits (impact of 1 basis point shift in the yield curve) and basis limits to control the exposures. Daily reports are made available through the risk management systems for monitoring these exposures. In addition to these limits, stress and scenario analysis are undertaken to evaluate shock impacts.
Operational risk The Bank has made investments in known and tested software and hardware,
which caters to the derivative activity. The Bank also has an approval and review process to manage risks arising out of new products and activities.
Collateral and credit risk mitigation The Bank has set in place counterparty limits to monitor off balance sheet
exposure as well as settlement risk. The off balance sheet exposure is calculated based on a dynamic method, which takes into account the positive replacement cost together with the potential future credit exposure for each trade. Counterparty exposures are monitored daily through a Global Counterparty Exposure management system.
Agreements with banks/financial institutions and corporates are under approved credit lines. For transactions with Banks as counter-parties, generally collateral is not taken. With respect to transactions with other counter-parties, generally collateral is not taken at the time of dealing. The Bank has collateral agreements with a few corporate clients, which are required to post collaterals, should the negative Mark to Market value at an aggregate level across all derivative and forward transactions with the client, exceed the threshold. As of 31 March, 2015, total collateral value held by the Bank was Rs.37,492 thousand. The corresponding value for 31 March, 2014 was Rs. 31,433 thousand.
Accounting for derivatives The accounting policy for recording derivative transactions is in place
which includes recognition of income and the treatment of gains/losses on cancellation/termination of contracts. Refer Schedule 17(4.4) and (4.5).
The Bank has not entered into any Credit Default Swap transactions during the year.
Disclosures in respect of Forward Rate Agreements (‘FRA’), Interest Rate Swaps (‘IRS’) and Cross Currency Swaps (‘CCS’) outstanding as at 31 March 2015 is set out below:
Forward Rate Agreements (Rs. in 000’s)
31 March 2015 31 March 2014
Sr. No Particulars Amount Amount
I Notional Principal Nil Nil
II
Losses which would be incurred if counterparties failed to fulfill their obligations under the agreements. Nil Nil
IIICollateral required by the bank upon entering into swaps. Nil
IV Concentration of credit risk arising from the swaps.
BanksNot
Applicable BanksNot
Applicable
OthersNot
Applicable OthersNot
Applicable
V The fair value of the swap [asset/(liability)]. Nil Nil

THE ROYAL BANK OF SCOTLAND N.V. (Incorporated in the Netherlands with Limited Liability)
INDIAN BRANCHES
9
Interest Rate Swaps (Rs. in 000’s)
31 March 2015 31 March 2014Sr. No Particulars Amount Amount
I Notional Principal 451,034,860 454,025,657
II
Losses which would be incurred if counterparties failed to fulfill their obligations under the agreements. 2,960,817 5,695,520
IIICollateral required by the bank upon entering into swaps.
Refer Collateral and credit risk mitigation section above.
IV Concentration of credit risk arising from the swaps.
Banks 79% Banks 91%Others 21% Others 9%
V The fair value of the swap [asset/(liability)]. 1,106,512 2,611,268
Cross Currency Swaps (Rs. in 000’s)
31 March 2015 31 March 2014Sr. No Particulars Amount Amount
I Notional Principal 66,355,130 67,115,292
II
Losses which would be incurred if counterparties failed to fulfill their obligations under the agreements.
993,350 1,129,805
IIICollateral required by the bank upon entering into swaps.
Refer Collateral and credit risk mitigation section above.
IV Concentration of credit risk arising from the swaps.
Banks 37% Banks 49%Others 63% Others 51%
V The fair value of the swap [asset/(liability)]. (8,279,199) (6,996,534)
Exchange Traded Interest Rate Derivatives
Sr. No. Particulars 31 March 2015 31 March 2014
(i) Not iona l pr inc ipa l amount o f exchange traded interest rate derivatives undertaken during the year (instrument-wise) Nil Nil
(ii) Notional principal amount of exchange traded interest rate derivatives outstanding (instrument-wise) Nil Nil
(iii) Notional principal amount of exchange traded interest rate derivatives outstanding and not “highly effective” (instrument-wise) Nil Nil
(iv) Mark-to-market value of exchange traded interest rate derivatives outstanding and not “highly effective” (instrument-wise) Nil Nil
Disclosures on risk exposure in derivatives:Year ended 31 March 2015 (Rs. in 000's)
Sr. No. Particulars
Currency Derivatives
Interest rate Derivatives
1 Derivatives (Notional Principal Amount)a) For hedging Nil Nilb) For trading 66,355,130 451,034,860
2 Marked to Market Positionsa) Asset (+) 993,350 2,960,817b) Liability (-) (9,272,549) (1,854,305)
3 Credit Exposure 6,594,992 7,281,540
4Likely impact of one percentage change in interest rate (100*PV01) (as at 31 March 2015)a) On hedging derivatives Nil Nil
b) On trading derivatives (40,647) 312,396
5Maximum and Minimum of 100*PV01 observed during the yeara) On hedgingI) Maximum Nil NilII) Minimum Nil Nilb) On Trading I) Maximum (40,647) 454,654II) Minimum (188,386) 312,396
Note: Derivatives excludes Forward exchange contracts. The maximum and minimum of 100*PV01 observed during the year represents the maximum and minimum of observations on the last day of each quarter during the year ended 31 March 2015.
Year ended 31 March 2014 (Rs. in 000’s)S r. No. Particulars Currency
DerivativesInterest rate Derivatives
1 Derivatives (Notional Principal Amount)a) For hedging Nil 9,150,000b) For trading 79,641,771 454,025,657
2 Marked to Market Positionsa) Asset (+) 1,264,729 5,695,520b) Liability (-) (8,681,301) (3,084,253)
3 Credit Exposure 8,174,315 10,123,975
4Likely impact of one percentage change in interest rate (100*PV01) (as at 31 March 2014)a) on hedging derivatives Nil 246,319b) on trading derivatives (208,773) 403,641
5Maximum and Minimum of 100*PV01 observed during the yeara) On hedgingI) Maximum Nil 327,596II) Minimum Nil 246,319b) On Trading I) Maximum (208,773) 455,596II) Minimum (341,653) 403,641
Investments (Rs. in 000’s)
Year Ended 31 March 2015 31 March 2014
(1)
Value of Investments
(i)Gross Value of Investments(a) In India 46,463,221 54,455,857(b) Outside India Nil Nil
(ii)Provision for Depreciation(a) In India Nil (78,179)(b) Outside India Nil Nil
(iii)Net Value of Investments(a) In India 46,463,221 54,377,678(b) Outside India Nil Nil
(2)
Movement of provisions held towards diminution in value of investments(i) Opening balance 78,179 17,924
(ii)
Add: Provisions made during the year (including provision made on inter-bank repo outstanding at the end of the year) Nil 78,179
(iii)Less: Write-off/write-back of excess provisions during the year (78,179) (17,924)
(iv) Closing balance Nil 78,179
THE ROYAL BANK OF SCOTLAND N.V. (Incorporated in the Netherlands with Limited Liability)
INDIAN BRANCHES
10
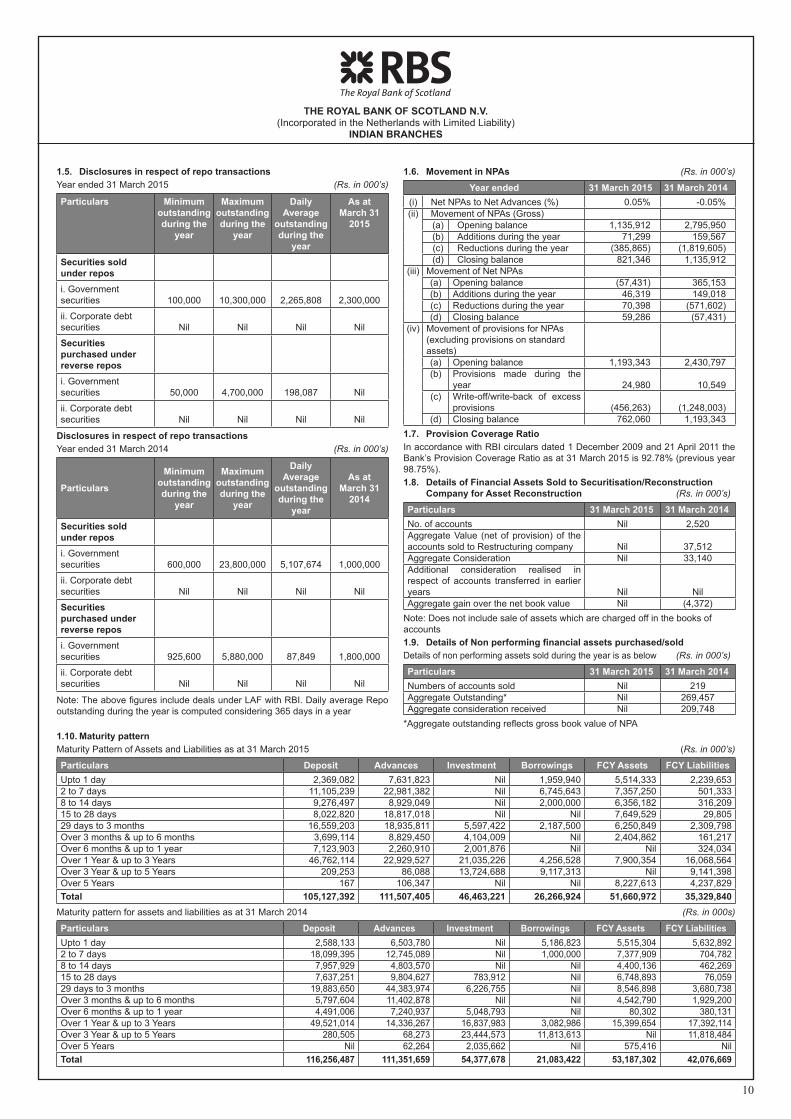
1.5. Disclosures in respect of repo transactionsYear ended 31 March 2015 (Rs. in 000’s)
Particulars Minimum outstanding during the
year
Maximum outstanding during the
year
Daily Average
outstanding during the
year
As at March 31
2015
Securities sold under reposi. Government securities 100,000 10,300,000 2,265,808 2,300,000
ii. Corporate debt securities Nil Nil Nil Nil
Securities purchased under reverse reposi. Government securities 50,000 4,700,000 198,087 Nil
ii. Corporate debt securities Nil Nil Nil Nil
Disclosures in respect of repo transactionsYear ended 31 March 2014 (Rs. in 000’s)
Particulars
Minimum outstanding during the
year
Maximum outstanding during the
year
Daily Average
outstanding during the
year
As at March 31
2014
Securities sold under reposi. Government securities 600,000 23,800,000 5,107,674 1,000,000
ii. Corporate debt securities Nil Nil Nil Nil
Securities purchased under reverse reposi. Government securities 925,600 5,880,000 87,849 1,800,000
ii. Corporate debt securities Nil Nil Nil Nil
Note: The above figures include deals under LAF with RBI. Daily average Repo outstanding during the year is computed considering 365 days in a year
1.6. Movement in NPAs (Rs. in 000’s)
Year ended 31 March 2015 31 March 2014(i) Net NPAs to Net Advances (%) 0.05% -0.05%(ii) Movement of NPAs (Gross)
(a) Opening balance 1,135,912 2,795,950(b) Additions during the year 71,299 159,567(c) Reductions during the year (385,865) (1,819,605)(d) Closing balance 821,346 1,135,912
(iii) Movement of Net NPAs(a) Opening balance (57,431) 365,153(b) Additions during the year 46,319 149,018(c) Reductions during the year 70,398 (571,602)(d) Closing balance 59,286 (57,431)
(iv) Movement of provisions for NPAs (excluding provisions on standard assets)(a) Opening balance 1,193,343 2,430,797(b) Provisions made during the
year 24,980 10,549(c) Write-off/write-back of excess
provisions (456,263) (1,248,003)(d) Closing balance 762,060 1,193,343
1.7. Provision Coverage RatioIn accordance with RBI circulars dated 1 December 2009 and 21 April 2011 the Bank’s Provision Coverage Ratio as at 31 March 2015 is 92.78% (previous year 98.75%).1.8. Details of Financial Assets Sold to Securitisation/Reconstruction
Company for Asset Reconstruction (Rs. in 000’s)
Particulars 31 March 2015 31 March 2014No. of accounts Nil 2,520Aggregate Value (net of provision) of the accounts sold to Restructuring company Nil 37,512Aggregate Consideration Nil 33,140Additional consideration realised in respect of accounts transferred in earlier years Nil NilAggregate gain over the net book value Nil (4,372)
Note: Does not include sale of assets which are charged off in the books of accounts1.9. Details of Non performing financial assets purchased/soldDetails of non performing assets sold during the year is as below (Rs. in 000’s)
Particulars 31 March 2015 31 March 2014Numbers of accounts sold Nil 219Aggregate Outstanding* Nil 269,457Aggregate consideration received Nil 209,748
*Aggregate outstanding reflects gross book value of NPA1.10. Maturity patternMaturity Pattern of Assets and Liabilities as at 31 March 2015 (Rs. in 000’s)
Particulars Deposit Advances Investment Borrowings FCY Assets FCY LiabilitiesUpto 1 day 2,369,082 7,631,823 Nil 1,959,940 5,514,333 2,239,6532 to 7 days 11,105,239 22,981,382 Nil 6,745,643 7,357,250 501,3338 to 14 days 9,276,497 8,929,049 Nil 2,000,000 6,356,182 316,20915 to 28 days 8,022,820 18,817,018 Nil Nil 7,649,529 29,80529 days to 3 months 16,559,203 18,935,811 5,597,422 2,187,500 6,250,849 2,309,798Over 3 months & up to 6 months 3,699,114 8,829,450 4,104,009 Nil 2,404,862 161,217Over 6 months & up to 1 year 7,123,903 2,260,910 2,001,876 Nil Nil 324,034Over 1 Year & up to 3 Years 46,762,114 22,929,527 21,035,226 4,256,528 7,900,354 16,068,564Over 3 Year & up to 5 Years 209,253 86,088 13,724,688 9,117,313 Nil 9,141,398Over 5 Years 167 106,347 Nil Nil 8,227,613 4,237,829Total 105,127,392 111,507,405 46,463,221 26,266,924 51,660,972 35,329,840
Maturity pattern for assets and liabilities as at 31 March 2014 (Rs. in 000s)
Particulars Deposit Advances Investment Borrowings FCY Assets FCY LiabilitiesUpto 1 day 2,588,133 6,503,780 Nil 5,186,823 5,515,304 5,632,8922 to 7 days 18,099,395 12,745,089 Nil 1,000,000 7,377,909 704,7828 to 14 days 7,957,929 4,803,570 Nil Nil 4,400,136 462,26915 to 28 days 7,637,251 9,804,627 783,912 Nil 6,748,893 76,05929 days to 3 months 19,883,650 44,383,974 6,226,755 Nil 8,546,898 3,680,738Over 3 months & up to 6 months 5,797,604 11,402,878 Nil Nil 4,542,790 1,929,200Over 6 months & up to 1 year 4,491,006 7,240,937 5,048,793 Nil 80,302 380,131Over 1 Year & up to 3 Years 49,521,014 14,336,267 16,837,983 3,082,986 15,399,654 17,392,114Over 3 Year & up to 5 Years 280,505 68,273 23,444,573 11,813,613 Nil 11,818,484Over 5 Years Nil 62,264 2,035,662 Nil 575,416 NilTotal 116,256,487 111,351,659 54,377,678 21,083,422 53,187,302 42,076,669

THE ROYAL BANK OF SCOTLAND N.V. (Incorporated in the Netherlands with Limited Liability)
INDIAN BRANCHES
11
Notes: 1. In accordance with the RBI guidelines, Management has made certain assumptions in respect of behavioral maturities of non-term assets and liabilities while
compiling their maturity profiles, which have been relied upon by the Auditors.2. Advances are gross of bills rediscounted.3. Investments are bucketed as per actual maturity, except for HFT portfolio where securities with actual maturity over 90 days have been classified under 29 days
to 3 months buckets.4. Advances have been classified in their respective maturities, except for cash credit and overdraft accounts, which have been classified as per their volatility.5. Deposits have been classified in their respective maturities, except for savings and current account deposits, which have been classified as per their volatility
1.11. Lending to sensitive sectors
Exposure to Real Estate (Rs. in 000’s)
Category 31 March 2015 31 March 2014a) Direct exposure 27,622 70,907
(i) Residential Mortgages –
Lending fully secured by mortgages on residential property that is or will be occupied by the borrower or that is rented 116 886
- Of which individual housing loans up to Rs.15 lakhs 116 886
(ii) Commercial Real Estate 27,506 70,021
(iii) Investments in Mortgage Backed Securities (MBS) and other securitised exposures –
a. Residential Nil Nil
b. Commercial Real Estate Nil Nil
b) Indirect exposure 74,620 343,769
Fund based and non-fund based exposures on National Housing Bank (NHB) and Housing Finance Companies (HFCs). 74,620 343,769
Total Exposure to Real Estate Sector 102,242 414,676
Exposure to Capital Market (Rs. in 000’s)
Category 31 March 2015 31 March 2014(i) Direct investment in equity shares, convertible bonds, convertible debentures and units of equity-oriented mutual funds the
corpus of which is not exclusively invested in corporate debt; Nil Nil
(ii) Advances against shares/bonds/debentures or other securities or on clean basis to individuals for investment in shares (including IPOs/ESOPs), convertible bonds, convertible debentures, and units of equity-oriented mutual funds; 340 340
(iii) Advances for any other purposes where shares or convertible bonds or convertible debentures or units of equity oriented mutual funds are taken as primary security; 173 171
(iv) Advances for any other purposes to the extent secured by the collateral security of shares or convertible bonds or convertible debentures or units of equity oriented mutual funds i.e. where the primary security other than shares/convertible bonds/convertible debentures/units of equity oriented mutual funds `does not fully cover the advances; Nil Nil
(v) Secured and unsecured advances to stockbrokers and guarantees issued on behalf of stockbrokers and market makers; Nil Nil
(vi) Loans sanctioned to corporates against the security of shares/bonds/debentures or other securities or on clean basis for meeting promoter’s contribution to the equity of new companies in anticipation of raising resources; Nil Nil
(vii) Bridge loans to companies against expected equity flows/issues; Nil Nil
(viii) Underwriting commitments taken up by the banks in respect of primary issue of shares or convertible bonds or convertible debentures or units of equity oriented mutual funds; Nil Nil
(ix) Financing to stockbrokers for margin trading; Nil Nil
(x) All exposures to Venture Capital Funds (both registered and unregistered) will be deemed to be on par with equity and hence will be reckoned for compliance with the capital market exposure ceilings (both direct and indirect) Nil Nil
Total Exposure to Capital Market 513 511Note: Advances includes funded and non-funded exposures for the above categories.
1.12. Provisions on Standard Assets (Rs. in 000’s)
Particulars 31 March 2015 31 March 2014Provisions on standard assets 2,087,301 1,863,935
The provisions on standard assets held by the Bank over and above required as at 31 March 2015 have not been reversed in accordance with the RBI guidelines. The above includes provision on Unhedged Foreign Currency Exposure (UFCE) of Rs 223,366 thousands.
1.13. Issuer composition of Non SLR investments The bank does not have any Non SLR investments as at 31 Mar 2015 (Previous Year – Nil).1.14. Non-performing Non-SLR investments There are no non-performing non-SLR investments as at 31 March 2015 (Previous year – Nil).
THE ROYAL BANK OF SCOTLAND N.V. (Incorporated in the Netherlands with Limited Liability)
INDIAN BRANCHES
12
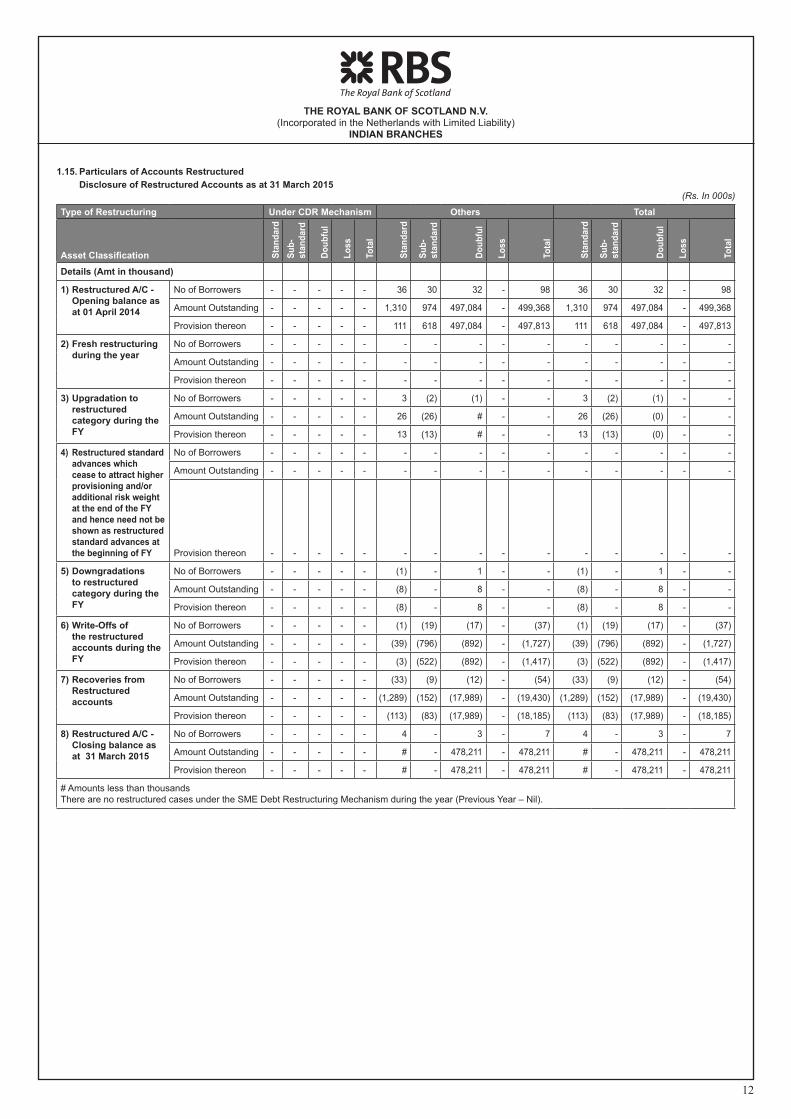
1.15. Particulars of Accounts Restructured Disclosure of Restructured Accounts as at 31 March 2015
(Rs. In 000s)
Type of Restructuring Under CDR Mechanism Others Total
Asset Classification Stan
dard
Sub-
st
anda
rd
Doub
ful
Loss
Tota
l
Stan
dard
Sub-
st
anda
rd
Doub
ful
Loss
Tota
l
Stan
dard
Sub-
st
anda
rd
Doub
ful
Loss
Tota
l
Details (Amt in thousand)
1) Restructured A/C - Opening balance as at 01 April 2014
No of Borrowers - - - - - 36 30 32 - 98 36 30 32 - 98
Amount Outstanding - - - - - 1,310 974 497,084 - 499,368 1,310 974 497,084 - 499,368
Provision thereon - - - - - 111 618 497,084 - 497,813 111 618 497,084 - 497,813
2) Fresh restructuring during the year
No of Borrowers - - - - - - - - - - - - - - -
Amount Outstanding - - - - - - - - - - - - - - -
Provision thereon - - - - - - - - - - - - - - -
3) Upgradation to restructured category during the FY
No of Borrowers - - - - - 3 (2) (1) - - 3 (2) (1) - -
Amount Outstanding - - - - - 26 (26) # - - 26 (26) (0) - -
Provision thereon - - - - - 13 (13) # - - 13 (13) (0) - -
4) Restructured standard advances which cease to attract higher provisioning and/or additional risk weight at the end of the FY and hence need not be shown as restructured standard advances at the beginning of FY
No of Borrowers - - - - - - - - - - - - - - -
Amount Outstanding - - - - - - - - - - - - - - -
Provision thereon - - - - - - - - - - - - - - -
5) Downgradations to restructured category during the FY
No of Borrowers - - - - - (1) - 1 - - (1) - 1 - -
Amount Outstanding - - - - - (8) - 8 - - (8) - 8 - -
Provision thereon - - - - - (8) - 8 - - (8) - 8 - -
6) Write-Offs of the restructured accounts during the FY
No of Borrowers - - - - - (1) (19) (17) - (37) (1) (19) (17) - (37)
Amount Outstanding - - - - - (39) (796) (892) - (1,727) (39) (796) (892) - (1,727)
Provision thereon - - - - - (3) (522) (892) - (1,417) (3) (522) (892) - (1,417)
7) Recoveries from Restructured accounts
No of Borrowers - - - - - (33) (9) (12) - (54) (33) (9) (12) - (54)
Amount Outstanding - - - - - (1,289) (152) (17,989) - (19,430) (1,289) (152) (17,989) - (19,430)
Provision thereon - - - - - (113) (83) (17,989) - (18,185) (113) (83) (17,989) - (18,185)
8) Restructured A/C - Closing balance as at 31 March 2015
No of Borrowers - - - - - 4 - 3 - 7 4 - 3 - 7
Amount Outstanding - - - - - # - 478,211 - 478,211 # - 478,211 - 478,211
Provision thereon - - - - - # - 478,211 - 478,211 # - 478,211 - 478,211
# Amounts less than thousandsThere are no restructured cases under the SME Debt Restructuring Mechanism during the year (Previous Year – Nil).

THE ROYAL BANK OF SCOTLAND N.V. (Incorporated in the Netherlands with Limited Liability)
INDIAN BRANCHES
13
Disclosure of Restructured Accounts as at 31 March 2014 (Rs. In 000s)
Type of Restructuring Under CDR Mechanism Others Total
Asset Classification Stan
dard
Sub-
stan
dard
Dou
bful
Loss
Tota
l
Stan
dard
Sub-
stan
dard
Dou
bful
Loss
Tota
l
Stan
dard
Sub-
stan
dard
Dou
bful
Loss
Tota
l
Details 1) Restructured A/C –
Opening balance @ 01-Apr 13
No of Borrowers - - 2 - 2 136 104 146 - 386 136 104 148 - 388
Amount Outstanding - - 35,700 - 35,700 11,295 4,836 504,533 - 520,664 11,295 4,836 540,233 - 556,364
Provision thereon - - 35,700 - 35,700 311 3,565 504,485 - 508,361 311 3,565 540,185 - 544,061
2) Fresh restructuring during the year
No of Borrowers - - - - - - 2 1 - 3 - 2 1 - 3
Amount Outstanding - - - - - - 26 0 - 26 - 26 0 - 26
Provision thereon - - - - - - 18 0 - 18 - 18 0 - 18
3) Upgradation to restructured category during the FY
No of Borrowers - - - - - 5 - (5) - - 5 - (5) - -
Amount Outstanding - - - - - 89 - (89) - - 89 - (89) - -
Provision thereon - - - - - - - - - - - - - - -
4) Restructured standard advances which cease to attract higher provisioning and/or additional risk weight at the end of the FY and hence need not be shown as restructured standard advances at the beginning of FY
No of Borrowers - - - - - - - - - - - - - - -
Amount Outstanding - - - - - - - - - - - - - - -
Provision thereon - - - - - - - - - - - - - - -
5) Downgradations to restructured category during the FY
No of Borrowers - - - - - (28) 24 4 - - (28) 24 4 - -
Amount Outstanding - - - - - (948) 656 292 - - (948) 656 292 - -
Provision thereon - - - - - (600) 308 292 - - (600) 308 292 - -
6) Write-Offs of the restructured accounts during the FY
No of Borrowers - - (2) - (2) (16) (96) (99) - (211) (16) (96) (101) - (213)
Amount Outstanding - - (35,700) - (35,700) (644) (3,772) (5,072) - (9,488) (644) (3,772) (40,772) - (45,188)
Provision thereon - - (35,700) - (35,700) (18) (3,031) (5,037) - (8,086) (18) (3,031) (40,737) - (43,786)
7) Recoveries of the restructured accounts during the FY
No of Borrowers - - - - - (61) (4) (15) - (80) (61) (4) (15) - (80)
Amount Outstanding - - - - - (8,482) (772) (2,580) - (11,834) (8,482) (772) (2,580) - (11,834)
Provision there on - - - - - 307 (242) (2,656) - (2,591) 307 (242) (2,656) - (2,591)
8) Restructured A/C – Closing balance as at 31 March 2014
No of Borrowers - - - - - 36 30 32 - 98 36 30 32 - 98
Amount Outstanding - - - - - 1,310 974 497,084 - 499,368 1,310 974 497,084 - 499,368
Provision there on - - - - - 111 618 497,084 - 497,813 111 618 497,084 - 497,813

THE ROYAL BANK OF SCOTLAND N.V. (Incorporated in the Netherlands with Limited Liability)
INDIAN BRANCHES
14
1.16. Securitisation Transactions There were no securitisation transactions entered during the year (Previous
year – Nil).1.17. Single and group borrower exposures During the year ended 31 March 2015, the Bank has complied with the RBI
guidelines on Single borrower limit (SBL) and Group borrower limit (GBL). As per the exposure limits permitted under the extant RBI regulation, the Bank, with the approval of the Management Team Committee (MTCo), can enhance exposure to a Single borrower or Group borrower by a further 5 % of capital funds. Additionally, for infrastructure companies, the SBL and GBL limits can be enhanced by a further 5% and 10% respectively.
During the year ended 31 March 2015 , GBL limit was enhanced from 50% to 55% for Vodafone India Group with prior MTCo approval and the exposure to the Group was well within the enhanced thresholds.
During the year ended 31 March 2015, the Banks’ Credit Exposure to all Single borrowers was within the prudential exposure limits prescribed by RBI.
During the year ended 31 March 2014 the Bank’s credit exposure to all Group borrowers was within the prudential exposure limits prescribed by RBI.
Single borrower limit was enhanced with prior MTCo approval for three companies, as below.
l 15% to 20% for Reliance Industries Ltd and Bharat Heavy Electricals Ltd. l 20% to 25% for Vodafone India Ltd as applicable for an Infrastructure
company Exposure to all the above three companies were within the enhanced
thresholds.1.18. Country Risk As per the extant RBI guidelines, the country exposure of the Bank is
categorised into various risk categories listed in the following table. As at 31 March 2015, the Bank’s exposure to any individual country did not exceed 1% of the total funded assets of the Bank. (Rs.in 000’s)
31 March 2015 31 March 2014Risk Category Exposure
(net)Provision
heldExposure
(net)Provision
heldInsignificant Nil Nil Nil NilLow 4,744,135 Nil 39,990 NilModerately Low 32,212,143 Nil 100,720 NilMedium 1,468,446 Nil 716,990 NilHigh 8,865 Nil 7,160 NilVery High Nil Nil Nil NilRestricted Nil Nil Nil NilOff-Credit Nil Nil Nil NilTotal 38,433,589 Nil 864,860 Nil
As at 31 March 2015, the exposure also includes exposure of the Bank to its Head Office and its branches. In terms of the RBI circular, the provision is made for only those countries where the net funded exposure is not less than 1 percent of total assets. While computing provisioning, the Bank excludes exposure to its Head Office and branches.1.19. Provisions and contingencies charged to the Profit and Loss Account comprises of
(Rs.in 000’s)
Year ended 31 March
201531 March
2014Provision towards NPA’s (net of write backs)* (431,283) (1,237,454)Provision towards standard assets 223,366 NilDebts written off 337,896 1,372,934Income Tax 1,466,381 2,234,173Deferred Tax 287,839 834,758Provisions/ (Write backs) for depreciation on Investments (78,179) 60,255Provisions/ (Write backs) on Restructured Standard Advances (111) (200)Total 1,805,909 3,264,466* Includes write back of excess provision of Rs. 71,614 thousands on sale of NPA in prior years (Previous Year - Nil)
1.20. Disclosure of Complaints/Unimplemented Awards of Banking OmbudsmanCustomer complaints
Particulars31 March
201531 March
2014(a) No. of Complaints pending at the beginning
of the year 211 177(b) No. of Complaints received during the year 5,649 5,601(c) No. of Complaints redressed during the
year 5,333 5,567(d) No. of Complaints pending at the end of
the year 527 211
Awards passed by the Banking Ombudsman
Particulars 31 March 2015 31 March 2014
(a) No. of unimplemented Awards at the beginning of the year Nil Nil
(b) No. of Awards passed by the Banking Ombudsmen during the year Nil Nil
(c) No. of Awards implemented during the year Nil Nil
(d) No. of unimplemented Awards at the end of the year Nil Nil
The complaints which got redressed within a day are not part of the above disclosure.The above information regarding customer complaints have been identified on the basis of the information available with the Bank and have been relied upon by the Auditors.1.21. Penalties During the year, no penalty was imposed by the RBI (Previous year Nil).1.22. Floating Provisions The Bank has not created any floating provisions during the year (Previous
year – Nil).1.23. Letter of Comforts The Bank has not issued any Letter of Comforts (LOCs) during the year and
there are no LOCs outstanding as at the year end. (Previous Year – Nil).1.24. Depositor Education and Awareness Fund (DEAF) (Rs.in 000’s)
Particulars 31 March 2015 31 March 2014Opening Balance of amount transferred to DEAF Nil NilAmount transferred during the year 248,327 NilAmount reimbursed by DEAF towards claims Nil NilClosing balance of amounts trans-ferred to DEAF 248,327 Nil
1.25. Unhedged Foreign Currency Exposure (UFCE) The Bank has a policy for monitoring the unhedged foreign currency exposure
of all clients. Relevant data in this regard is requested from all clients every quarter and the potential loss which the clients could face owing to foreign currency fluctuation is computed. Suitable incremental provisions are then computed in line with the RBI guidelines.
Provision held for UFCE as at 31 March 2015 is Rs 223,366 thousands. Incremental capital held by the Bank for UFCE as at 31 March 2015 is Rs. 1,163,573 thousands.
1.26. Liquidity Coverage Ratio (LCR) The Bank manages funding and liquidity risk through a formal governance
structure of India Assets Liability Committee (ALCO). India ALCO comprises of senior management of the Bank and meets periodically. The Committee oversees funding and liquidity position of the Bank and provides guidance and oversight. The Committee is responsible to oversee and ensure compliance with regulatory and internal requirements related to Liquidity risk management. ALCO is assisted in its oversight role by Treasury, Finance, Operations and other business units.
The Bank has adopted the Basel III framework on liquidity standards as prescribed by RBI and has put in place requisite systems and processes to enable periodic computation and reporting of LCR. The Bank has been submitting LCR reports to RBI from January 2015.
The Bank follows the criteria laid down by RBI for month-end calculation of High Quality Liquid Assets (HQLAs), gross outflows and inflows within the next 30-day period. HQLAs of the Bank primarily consist of Cash, Government of India (GoI) bonds and Treasury-bills. The weighted outflows mainly consist of unsecured wholesale funding, retail deposits, derivative cash flows and other contingent funding liabilities. The weighted inflows primarily consist of inflows on account of advances and derivative cash flows.
Liquidity requirement of the Bank on account of market valuation changes for derivative transactions was limited. The Bank may be required to post additional collateral due to market valuation changes on derivative transactions settled through Clearing Corporation of India (CCIL) which is a Qualified Central Counterparty (QCCP) in India. The outflow on account of such market valuation change for derivative transactions with CCIL has been considered based on the prescribed look back approach. The significant part of the Banks operations are conducted in INR currency. The Bank also monitors the LCR in US Dollar currency and Japanese Yen currency, which qualify as significant currencies for monitoring LCR as per RBI guidelines.
Based on the above, monthly average LCR (all currency) of the Bank for the three months ended 31 March 2015 was 106.29% against the regulatory minimum of 60%.
The average LCR above is based on monthly submission made to the RBI. The Bank monitors the concentration of funding sources from significant
counterparties, products and maintains diversified sources of funding dispersed across products and maturities.

THE ROYAL BANK OF SCOTLAND N.V. (Incorporated in the Netherlands with Limited Liability)
INDIAN BRANCHES
15
(Rs. in 000’s)
Liquidity Coverage Ratio Average of month end position during the quarter
ended March 31, 2015Total
Unweighted Value
Total weighted Value
31 March 2015 31 March 2015High Quality Liquid Assets1 Total High Quality Liquid Assets (HQLA) 29,828,469 29,828,469
Cash Outflows
2 Retail deposits and deposits from small business customers, of which:
(i) Stable deposits(ii) Less stable deposits 38,673,192 3,867,319
3 Unsecured wholesale funding, of which :
(i) Operational deposits (all counterparties) 12,946,337 3,236,584
(ii) Non-ope ra t i ona l depos i t s (a l l counterparties) 64,709,212 35,610,673
(iii) Unsecured debt Nil Nil4 Secured wholesale funding Nil Nil5 Additional requirements, of which Nil Nil
(i) Outflows related to derivative exposures and other collateral requirements - 6,302,397 6,302,397
(ii) Outflows related to loss of funding on debt products Nil Nil
(iii) Credit and liquidity facilities 195,386,915 13,987,6326 Other contractual funding obligations Nil Nil7 Other contingent funding obligations Nil Nil8 Total Cash Outflows 318,018,053 63,004,605
Cash Inflows9 Secured lending (e.g. reverse repos) 7,484,965 7,484,965
10 Inflows from fully performing exposures 34,497,499 17,248,75011 Other cash inflows 10,473,966 10,207,56212 Total Cash Inflows 52,456,430 34,941,27713 Total HQLA 29,828,46914 Total Net Cash Outflows 28,063,32915 Liquidity Coverage Ratio (%) 106.29%In computing the above information, certain estimates have been made by the Bank’s management which have been relied upon by the auditors.
1.27. Concentration of Deposits (Rs. in 000’s)
Particulars 31 March 2015 31 March 2014
Total Deposits of twenty largest depositors 39,813,247 44,989,427
Percentage of Deposits of twenty largest depositors to Total Deposits of the Bank 38% 39%
1.28. Concentration of Advances(Rs. in 000’s)
Particulars 31 March 2015 31 March 2014
Total Advances to twenty largest borrowers 79,472,540 80,023,748
Percentage of Advances to twenty largest borrowers to Total Advances of the Bank 23% 29%
1.29. Concentration of Exposures (Rs. in 000’s)
Particulars 31 March 2015 31 March 2014Total Exposure to twenty largest borrowers/customers 79,472,540 80,023,748
Percentage of Exposures to twenty largest borrowers/customers to Total Exposure of the bank on borrowers/customers 23% 29%
1.30. Concentration of NPAs (Rs. in 000’s)
Particulars 31 March 2015 31 March 2014Total Exposure to top four NPA* accounts 725,526 851,053
* Represents Gross NPA
1.31. Sectorwise advances (Rs in 000’s)
SI No Sector 31 March 2015 31 March 2014
O/s Total Advances Gross NPAs
Percentage of Gross NPAs to Total Advances in that sector
O/s Total Advances Gross NPAs
Percentage of Gross NPAs to Total Advances in that sector
A Priority Sector1 Agriculture & Allied activities Nil Nil Nil Nil Nil Nil
2 Advances to Industries Sector eligible as Priority Sector Lending 41,885,146 78,817 0.19% 53,426,934 21,510 0.04%
3 Services 560,423 Nil Nil 139,102 4,199 3.02%4 Personal Loans 116 Nil Nil 981 95 9.66%
Sub-total (A) 42,445,685 78,817 0.19% 53,567,017 25,804 0.05%B Non Priority Sector1 Agriculture & Allied activities 1,012,068 Nil Nil 1,148,675 Nil Nil2 Industries 42,830,458 669,152 1.56% 35,620,326 1,011,068 2.84%3 Services 25,851,173 72,585 0.28% 22,051,573 95,232 0.43%4 Personal Loans 130,080 792 0.61% 157,411 3,808 2.42%
Sub-total (B) 69,823,779 742,529 1.06% 58,977,985 1,110,108 1.88%Total (A+B) 112,269,465 821,346 0.73% 112,545,002 1,135,912 1.01%
1.32. Movement of NPAs (Rs. in 000’s)
Particulars 31 March 2015 31 March 2014Gross NPAs as on 1st April of particular year (Opening Balance) 1,135,912 2,795,950Additions (Fresh NPAs) during the year 71,299 159,567Sub-total (A) 1,207,211 2,955,517(i) Upgradations 480 1,720(ii) Recoveries (excluding recoveries made from upgraded accounts) 47,489 444,951(iii) Write-offs 337,896 1,372,934Sub-total (B) 385,865 1,819,605Gross NPAs as on 31st March of following year (closing balance) (A-B) 821,346 1,135,912
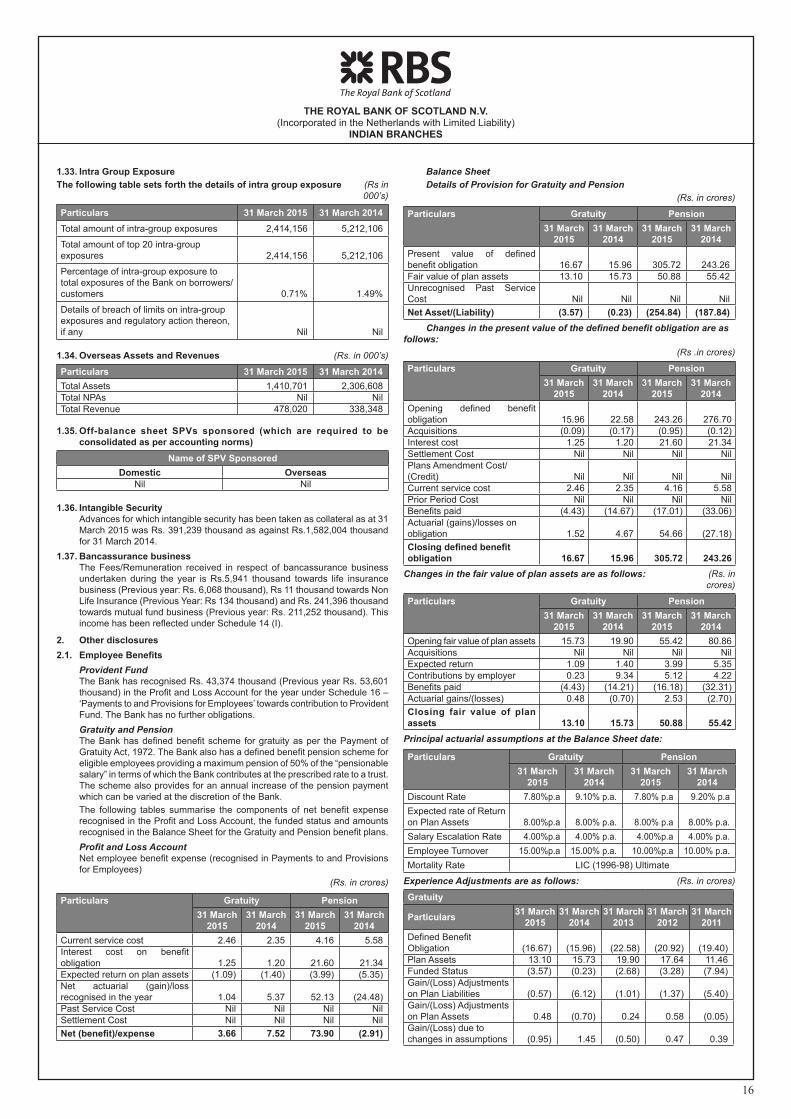
THE ROYAL BANK OF SCOTLAND N.V. (Incorporated in the Netherlands with Limited Liability)
INDIAN BRANCHES
16
1.33. Intra Group ExposureThe following table sets forth the details of intra group exposure (Rs in
000’s)
Particulars 31 March 2015 31 March 2014Total amount of intra-group exposures 2,414,156 5,212,106
Total amount of top 20 intra-group exposures 2,414,156 5,212,106
Percentage of intra-group exposure to total exposures of the Bank on borrowers/customers 0.71% 1.49%
Details of breach of limits on intra-group exposures and regulatory action thereon, if any Nil Nil
1.34. Overseas Assets and Revenues (Rs. in 000’s)
Particulars 31 March 2015 31 March 2014Total Assets 1,410,701 2,306,608Total NPAs Nil NilTotal Revenue 478,020 338,348
1.35. Off-balance sheet SPVs sponsored (which are required to be consolidated as per accounting norms)
Name of SPV SponsoredDomestic Overseas
Nil Nil
1.36. Intangible Security Advances for which intangible security has been taken as collateral as at 31
March 2015 was Rs. 391,239 thousand as against Rs.1,582,004 thousand for 31 March 2014.
1.37. Bancassurance business The Fees/Remuneration received in respect of bancassurance business
undertaken during the year is Rs.5,941 thousand towards life insurance business (Previous year: Rs. 6,068 thousand), Rs 11 thousand towards Non Life Insurance (Previous Year: Rs 134 thousand) and Rs. 241,396 thousand towards mutual fund business (Previous year: Rs. 211,252 thousand). This income has been reflected under Schedule 14 (I).
2. Other disclosures 2.1. Employee Benefits Provident Fund The Bank has recognised Rs. 43,374 thousand (Previous year Rs. 53,601
thousand) in the Profit and Loss Account for the year under Schedule 16 – ‘Payments to and Provisions for Employees’ towards contribution to Provident Fund. The Bank has no further obligations.
Gratuity and Pension The Bank has defined benefit scheme for gratuity as per the Payment of
Gratuity Act, 1972. The Bank also has a defined benefit pension scheme for eligible employees providing a maximum pension of 50% of the “pensionable salary” in terms of which the Bank contributes at the prescribed rate to a trust. The scheme also provides for an annual increase of the pension payment which can be varied at the discretion of the Bank.
The following tables summarise the components of net benefit expense recognised in the Profit and Loss Account, the funded status and amounts recognised in the Balance Sheet for the Gratuity and Pension benefit plans.
Profit and Loss Account Net employee benefit expense (recognised in Payments to and Provisions
for Employees)(Rs. in crores)
Particulars Gratuity Pension31 March
201531 March
201431 March
201531 March
2014Current service cost 2.46 2.35 4.16 5.58Interest cost on benefit obligation 1.25 1.20 21.60 21.34Expected return on plan assets (1.09) (1.40) (3.99) (5.35)Net actuarial (gain)/loss recognised in the year 1.04 5.37 52.13 (24.48)Past Service Cost Nil Nil Nil NilSettlement Cost Nil Nil Nil NilNet (benefit)/expense 3.66 7.52 73.90 (2.91)
Balance Sheet Details of Provision for Gratuity and Pension
(Rs. in crores)
Particulars Gratuity Pension31 March
201531 March
201431 March
201531 March
2014Present value of defined benefit obligation 16.67 15.96 305.72 243.26Fair value of plan assets 13.10 15.73 50.88 55.42Unrecognised Past Service Cost Nil Nil Nil NilNet Asset/(Liability) (3.57) (0.23) (254.84) (187.84)
Changes in the present value of the defined benefit obligation are as follows:
(Rs .in crores)
Particulars Gratuity Pension31 March
201531 March
201431 March
201531 March
2014Opening defined benefit obligation 15.96 22.58 243.26 276.70Acquisitions (0.09) (0.17) (0.95) (0.12)Interest cost 1.25 1.20 21.60 21.34Settlement Cost Nil Nil Nil NilPlans Amendment Cost/(Credit) Nil Nil Nil NilCurrent service cost 2.46 2.35 4.16 5.58Prior Period Cost Nil Nil Nil NilBenefits paid (4.43) (14.67) (17.01) (33.06)Actuarial (gains)/losses on obligation 1.52 4.67 54.66 (27.18)Closing defined benefit obligation 16.67 15.96 305.72 243.26
Changes in the fair value of plan assets are as follows: (Rs. in crores)
Particulars Gratuity Pension31 March
201531 March
201431 March
201531 March
2014Opening fair value of plan assets 15.73 19.90 55.42 80.86Acquisitions Nil Nil Nil NilExpected return 1.09 1.40 3.99 5.35Contributions by employer 0.23 9.34 5.12 4.22Benefits paid (4.43) (14.21) (16.18) (32.31)Actuarial gains/(losses) 0.48 (0.70) 2.53 (2.70)Closing fair value of plan assets 13.10 15.73 50.88 55.42
Principal actuarial assumptions at the Balance Sheet date:
Particulars Gratuity Pension31 March
201531 March
201431 March
201531 March
2014Discount Rate 7.80%p.a 9.10% p.a. 7.80% p.a 9.20% p.aExpected rate of Return on Plan Assets 8.00%p.a 8.00% p.a. 8.00% p.a 8.00% p.a.Salary Escalation Rate 4.00%p.a 4.00% p.a. 4.00%p.a 4.00% p.a.Employee Turnover 15.00%p.a 15.00% p.a. 10.00%p.a 10.00% p.a.Mortality Rate LIC (1996-98) Ultimate
Experience Adjustments are as follows: (Rs. in crores)
Gratuity
Particulars 31 March 2015
31 March 2014
31 March 2013
31 March 2012
31 March 2011
Defined Benefit Obligation (16.67) (15.96) (22.58) (20.92) (19.40)Plan Assets 13.10 15.73 19.90 17.64 11.46Funded Status (3.57) (0.23) (2.68) (3.28) (7.94)Gain/(Loss) Adjustments on Plan Liabilities (0.57) (6.12) (1.01) (1.37) (5.40)Gain/(Loss) Adjustments on Plan Assets 0.48 (0.70) 0.24 0.58 (0.05)Gain/(Loss) due to changes in assumptions (0.95) 1.45 (0.50) 0.47 0.39
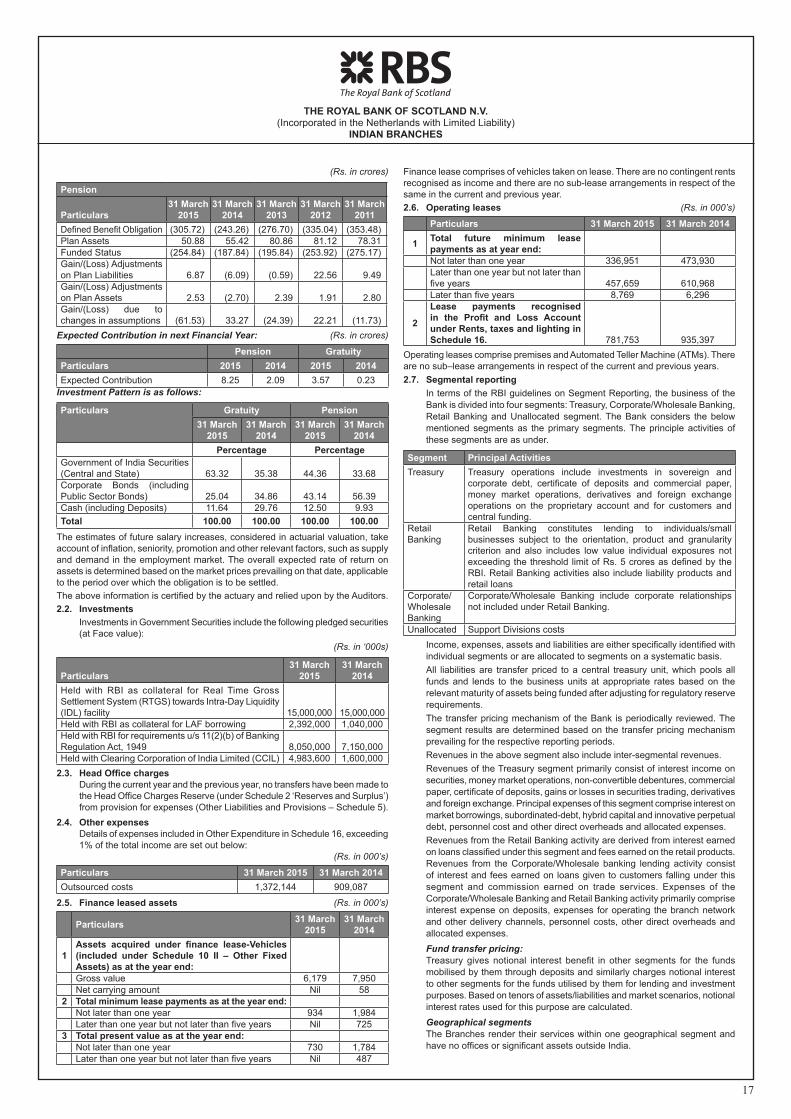
THE ROYAL BANK OF SCOTLAND N.V. (Incorporated in the Netherlands with Limited Liability)
INDIAN BRANCHES
17
(Rs. in crores)
Pension
Particulars31 March
201531 March
201431 March
201331 March
201231 March
2011Defined Benefit Obligation (305.72) (243.26) (276.70) (335.04) (353.48)Plan Assets 50.88 55.42 80.86 81.12 78.31Funded Status (254.84) (187.84) (195.84) (253.92) (275.17)Gain/(Loss) Adjustments on Plan Liabilities 6.87 (6.09) (0.59) 22.56 9.49Gain/(Loss) Adjustments on Plan Assets 2.53 (2.70) 2.39 1.91 2.80Gain/(Loss) due to changes in assumptions (61.53) 33.27 (24.39) 22.21 (11.73)
Expected Contribution in next Financial Year: (Rs. in crores)
Pension GratuityParticulars 2015 2014 2015 2014Expected Contribution 8.25 2.09 3.57 0.23
Investment Pattern is as follows:
Particulars Gratuity Pension31 March
201531 March
201431 March
201531 March
2014Percentage Percentage
Government of India Securities (Central and State) 63.32 35.38 44.36 33.68Corporate Bonds (including Public Sector Bonds) 25.04 34.86 43.14 56.39Cash (including Deposits) 11.64 29.76 12.50 9.93Total 100.00 100.00 100.00 100.00
The estimates of future salary increases, considered in actuarial valuation, take account of inflation, seniority, promotion and other relevant factors, such as supply and demand in the employment market. The overall expected rate of return on assets is determined based on the market prices prevailing on that date, applicable to the period over which the obligation is to be settled. The above information is certified by the actuary and relied upon by the Auditors.2.2. Investments Investments in Government Securities include the following pledged securities
(at Face value):(Rs. in ‘000s)
Particulars31 March
201531 March
2014Held with RBI as collateral for Real Time Gross Settlement System (RTGS) towards Intra-Day Liquidity (IDL) facility 15,000,000 15,000,000Held with RBI as collateral for LAF borrowing 2,392,000 1,040,000Held with RBI for requirements u/s 11(2)(b) of Banking Regulation Act, 1949 8,050,000 7,150,000Held with Clearing Corporation of India Limited (CCIL) 4,983,600 1,600,000
2.3. Head Office charges During the current year and the previous year, no transfers have been made to
the Head Office Charges Reserve (under Schedule 2 ‘Reserves and Surplus’) from provision for expenses (Other Liabilities and Provisions – Schedule 5).
2.4. Other expenses Details of expenses included in Other Expenditure in Schedule 16, exceeding
1% of the total income are set out below: (Rs. in 000’s)
Particulars 31 March 2015 31 March 2014Outsourced costs 1,372,144 909,087
2.5. Finance leased assets (Rs. in 000’s)
Particulars 31 March 2015
31 March 2014
1Assets acquired under finance lease-Vehicles (included under Schedule 10 II – Other Fixed Assets) as at the year end:Gross value 6,179 7,950Net carrying amount Nil 58
2 Total minimum lease payments as at the year end:Not later than one year 934 1,984Later than one year but not later than five years Nil 725
3 Total present value as at the year end:Not later than one year 730 1,784Later than one year but not later than five years Nil 487
Finance lease comprises of vehicles taken on lease. There are no contingent rents recognised as income and there are no sub-lease arrangements in respect of the same in the current and previous year.2.6. Operating leases (Rs. in 000’s)
Particulars 31 March 2015 31 March 2014
1 Total future minimum lease payments as at year end:Not later than one year 336,951 473,930Later than one year but not later than five years 457,659 610,968Later than five years 8,769 6,296
2
Lease payments recognised in the Profit and Loss Account under Rents, taxes and lighting in Schedule 16. 781,753 935,397
Operating leases comprise premises and Automated Teller Machine (ATMs). There are no sub–lease arrangements in respect of the current and previous years.2.7. Segmental reporting In terms of the RBI guidelines on Segment Reporting, the business of the
Bank is divided into four segments: Treasury, Corporate/Wholesale Banking, Retail Banking and Unallocated segment. The Bank considers the below mentioned segments as the primary segments. The principle activities of these segments are as under.
Segment Principal ActivitiesTreasury Treasury operations include investments in sovereign and
corporate debt, certificate of deposits and commercial paper, money market operations, derivatives and foreign exchange operations on the proprietary account and for customers and central funding.
Retail Banking
Retail Banking constitutes lending to individuals/small businesses subject to the orientation, product and granularity criterion and also includes low value individual exposures not exceeding the threshold limit of Rs. 5 crores as defined by the RBI. Retail Banking activities also include liability products and retail loans
Corporate/Wholesale Banking
Corporate/Wholesale Banking include corporate relationships not included under Retail Banking.
Unallocated Support Divisions costs Income, expenses, assets and liabilities are either specifically identified with
individual segments or are allocated to segments on a systematic basis. All liabilities are transfer priced to a central treasury unit, which pools all
funds and lends to the business units at appropriate rates based on the relevant maturity of assets being funded after adjusting for regulatory reserve requirements.
The transfer pricing mechanism of the Bank is periodically reviewed. The segment results are determined based on the transfer pricing mechanism prevailing for the respective reporting periods.
Revenues in the above segment also include inter-segmental revenues. Revenues of the Treasury segment primarily consist of interest income on
securities, money market operations, non-convertible debentures, commercial paper, certificate of deposits, gains or losses in securities trading, derivatives and foreign exchange. Principal expenses of this segment comprise interest on market borrowings, subordinated-debt, hybrid capital and innovative perpetual debt, personnel cost and other direct overheads and allocated expenses.
Revenues from the Retail Banking activity are derived from interest earned on loans classified under this segment and fees earned on the retail products. Revenues from the Corporate/Wholesale banking lending activity consist of interest and fees earned on loans given to customers falling under this segment and commission earned on trade services. Expenses of the Corporate/Wholesale Banking and Retail Banking activity primarily comprise interest expense on deposits, expenses for operating the branch network and other delivery channels, personnel costs, other direct overheads and allocated expenses.
Fund transfer pricing: Treasury gives notional interest benefit in other segments for the funds
mobilised by them through deposits and similarly charges notional interest to other segments for the funds utilised by them for lending and investment purposes. Based on tenors of assets/liabilities and market scenarios, notional interest rates used for this purpose are calculated.
Geographical segments The Branches render their services within one geographical segment and
have no offices or significant assets outside India.
THE ROYAL BANK OF SCOTLAND N.V. (Incorporated in the Netherlands with Limited Liability)
INDIAN BRANCHES
18
Segment results for 31 March 2015 are set out below: (Rs. in 000’s)
Particulars Treasury Retail BankingCorporate/
Wholesale Banking Unallocated TotalRevenue 12,569,490 2,268,581 12,441,444 116,300 27,395,815Less: Inter Segment Revenue 9,742,888Revenue net of Inter segment 17,652,927Operating Profit 2,943,233 30,809 4,867,741 (4,915,770) 2,926,013Taxes (1,754,220) (1,754,220)Net Profit/(Loss) 1,171,793Segment Assets 71,196,364 558,833 111,585,635 6,852,345 190,193,177Segment Liabilities 103,015,611 32,475,267 21,308,799 33,393,500 190,193,177Capital expenditure during the year 221,481 221,481Depreciation on fixed assets during the year 304,655 304,655
Segment results for 31 March 2014 are set out below: (Rs. in 000’s)
Particulars Treasury Retail BankingCorporate/
Wholesale Banking Unallocated TotalRevenue 15,869,615 5,397,643 12,667,405 33,934,663Less: Inter Segment Revenue 9,947,217Revenue net of Inter segment 23,987,446Operating Profit 2,490,643 1,454,459 5,835,821 (3,159,749) 6,621,174Taxes (3,068,931) (3,068,931)Net Profit/(Loss) 3,552,243Segment Assets 84,328,836 756,236 111,614,811 6,962,975 203,662,858Segment Liabilities 110,823,693 33,799,302 22,100,511 36,939,352 203,662,858Capital expenditure during the year 184,912 184,912Depreciation on fixed assets during the year 369,148 369,148
Note: In computing the above information, certain estimates and assumptions have been made by the Management which have been relied upon by the Auditors. Segment liabilities includes Share Capital and Reserves and Surplus.Previous Year segment has been redrawn to comply with current year estimates and assumptions.2.8. Related party disclosures (i) The Information required in this regard in accordance with Accounting Standard 18 on ‘Related Party Disclosures’, specified under section 133 of the Companies Act,
2013 read with Rule 7 of the Companies (Accounts) Rules, 2014 read with guidelines issued by the RBI insofar as they are applicable to the Bank, is provided below:
Sr. No. Relationship Name1 Parent/Head Office and branches of Head Office and ultimate holding
companyThe Royal Bank of Scotland N.V. Netherlands, and its branchesThe Royal Bank of Scotland Group Plc (Ultimate holding company) and its branches
2 Subsidiaries of Parent (Head Office) and entities under common control with whom there are transactions
RBS Business Services Private LimitedRBS Global Trade Services Private Limited RBS Financial Services (India) Private Limited RBS Equities (India) Limited RBS Corporate Finance (India) Private Limited RBS Foundation India RBS India Development Centre Private LimitedNational Westminster Bank PLCCitizens Bank National AssociationCoutts & Co.
3 Key Management Personnel Brijesh Mehra, Country Executive – IndiaThe transactions with related parties are detailed below, except where there is only one related party at any one point in time (i.e., key management personnel):
Relationship and Nature of Transactions
Maximum outstanding during the year ended
31 March 2015 As at 31 March 2015
Maximum outstanding during the year ended
31 March 2014 As at 31 March 2014Parent/Head Office and branches of Head OfficeDeposits * 1,679,163 * 227,164Balance due from Banks outside India * 1,013,872 * 1,547,674Balance due to Banks outside India * 4,141,681 * 5,186,823Money Market Borrowings 5,312,500 2,187,500 22,168,550 NilForeign exchange deals (Notional) * 103,714,185 * 103,863,215Derivative transactions (Notional) * 140,311,992 * 78,505,075Subordinated Debt Nil Nil 3,944,814 NilInnovative perpetual debt 4,256,528 4,256,528 4,741,179 4,741,179Hybrid Capital 9,117,314 9,117,314 10,155,420 10,155,420Non - funded commitments * 34,430,554 * 37,011,853Other receivables * 325,786 * 224,542Other payables * 488,178 * 1,908,772Subsidiaries of Parent (Head Office) and entities under common controlAdvances * Nil * 23,798Balance due from Banks outside India * 27,818 * 295,265Deposits 16,278,087 15,872,512 13,885,852 12,383,070Non - funded commitments * 392,889 * 400,672Foreign exchange deals (Notional) * 778,449 * 684,102Other receivables * 41,113 * 10,172Other payables * 390,249 * 407,500
* Maximum amounts outstanding during the year have not been given/cannot be determined

THE ROYAL BANK OF SCOTLAND N.V. (Incorporated in the Netherlands with Limited Liability)
INDIAN BRANCHES
19
Profit and Loss Account 31 March 2015 31 March 2014Parent/Head Office and branches of Head OfficeExpenses incurred 479,846 952,158Other Income 473,854 68,084Interest expense 535,431 1,337,301Interest income 868 3,485Subsidiaries of Parent (Head Office) and entities under common controlSecondment revenue and other costs recovered 38,058 38,014Expenses recovered 35,320 199,775Services rendered 2,422 3,712Services received 978,371 1,415,048Interest income 1,029 97,435Interest expense ** 989,314 927,460Fee/commission income 1,472 7,851
** Interest expense includes interest on term deposits.2.9. Deferred taxation The Bank follows the accounting policy for taxes on income in line with
the Accounting Standard 22 (AS-22) on ‘Accounting for Taxes on Income’ specified under section 133 of the Companies Act, 2013 read with Rule 7 of the Companies (Accounts) Rules, 2014.
The primary components that give rise to deferred tax assets and liabilities included in Schedule 11 ’Other Assets’ are as follows:
(Rs. in 000’s)
Particulars 31 March 2015 31 March 2014Deferred tax assetLoan loss provisions 876,494 1,058,503Depreciation on fixed assets and assets on lease 250,739 250,739Provision for Employee Benefits 954,052 954,052Others 239,470 345,300Deferred tax liabilitySpecial reserve created for loan for residential housing purposes 26,110 26,110Net deferred tax asset 2,294,645 2,582,484
2.10. Provisions, contingent liabilities and contingent assets In accordance with the provisions of AS 29, ‘Provisions, Contingent Liabilities
and Contingent Asset’, specified under section 133 of the Companies Act, 2013 read with Rule 7 of the Companies (Accounts) Rules, 2014., Given below are movements in provision for credit card reward points and a brief description of the nature of contingent liabilities recognised by the Bank.
Movement in provision for credit card reward points The Credit Cards reward point liability is Nil as at 31 March 2015 as the Bank
had sold its Credit Cards portfolio in financial year ended 31 March 14. In the earlier years, provision for reward points was determined based on past redemption pattern, periodically reassessed and adjusted based on changes in redemption behaviour. Provisions were utilised when the customer actually redeemed the points or when they lost their eligibility to utilise the points.
Particulars 31 March 2015
31 March 2014
Opening provision for reward points Nil 220,360Provision for reward points made during the year Nil 23,856Utilisation/Write back of provision for reward points Nil (244,216)Closing Provision for reward points Nil Nil
Description of Contingent Liabilities
Contingent Liability Brief DescriptionClaims against the Bank not acknowledged as debts
Includes various legal proceedings and outstanding tax matters in the normal course of business, which are disputed by the Bank.
Liability on account of forward exchange and derivative contracts.
The Bank enters into foreign exchange contracts, currency options, forward rate agreements, currency swaps and interest rate swaps with inter-bank participants on its own account and for customers. Forward exchange contracts are commitments to buy or sell foreign currency at a future date at the contracted rate. Currency swaps are commitments to exchange
cash flows by way of interest interest/principal in one currency against another, based on predetermined rates. Interest rate swaps are commitments to exchange fixed and floating interest rate cash flows. Forward Rate Agreements are agreements to pay or receive a certain sum based on a differential interest rate on a notional amount for an agreed period. The notional amount that are recorded, as contingent liabilities are typically amounts used as a benchmark for the calculation of the interest component of the contracts.
Guarantees given on behalf of constituents, Acceptances, Endorsements and other
As a part of its commercial banking activities, the Bank issues documentary credit and guarantees on behalf of its customers. Guarantees generally represent irrevocable assurances that the Bank will make payments in the event of the customer failing to fulfill its financial or performance obligations.
Other items for which the Bank is contingently liable – Others
This include Capital Commitments, DEAF and Undrawn Commitments
2.11. Prior period items There were no prior period items that have been debited/credited in the current
and previous year’s Profit and Loss Account. 2.12. India Bank Restructuring Sale of Diamond & Jewellery business Subsequent to the year end, as part of a strategic business decision, the Bank
has entered into an agreement to sell its Diamond and Jewellery business on a going concern basis comprising of loans aggregating approximately to Rs. 4,200 crores and deposit aggregating approximately to Rs. 300 crores as at the year end.
The transaction will be recorded in financial year 2015-16 in accordance with accounting principles generally accepted in India read with RBI guidelines.
Restructuring of CIB Business Based on the global internal restructuring announcements made by The
Royal Bank of Scotland Group Plc, the Management of the Bank is currently evaluating options to implement the global restructuring strategy. Based on the Asset Liability Management (ALM) projected by the Management, the Bank has adequate funding from the date of approving of the financial statements to repay its obligations.
In Management’s view, based on the current ALM position and progress made on its restructuring strategy, the Bank has considered itself as a going concern.
2.13. Software Included in ‘Other Fixed Assets’ is capitalised software amounting:
(Rs. In 000’s)Particulars As at
31 March 2015As at
31 March 2014At Book ValueBeginning of the year 776,157 725,065Additions during the year 71,313 51,092Deductions during the year Nil NilTotal 847,470 776,157DepreciationBeginning of the year 734,228 682,744Additions during the year 47,914 51,484Deductions during the year Nil NilTotal 782,142 734,228Net Book Value 65,328 41,929
2.14. During the year, the Bank has appropriated Rs. 33,269 thousand (previous year Rs. 7,628 thousand), (net of taxes and transfer to Statutory Reserve) to Investment Reserve Account, being write back of excess provision on Investments charged to the Profit and Loss Account, in accordance with RBI guidelines.
2.15. During the year the Bank has not transferred and sold securities classified under the Held to Maturity (“HTM”) category in excess of 5% of the book-value of investments held under the HTM category as at the beginning of the year. In accordance with the Master Circular issued by the RBI on “Disclosure in Financial Statements”, the excess of book value over the market value of the securities classified under the HTM category at the end of the current year is Nil (previous year Rs. 258,192).
2.16. To the extent of the information received by the Bank from its vendors, there are no transactions with “suppliers” as defined under the Micro, Small and
THE ROYAL BANK OF SCOTLAND N.V. (Incorporated in the Netherlands with Limited Liability)
INDIAN BRANCHES
20
Medium Enterprises Development Act, 2006 during the financial year, hence the disclosures as required under the said Act are not applicable. This has been relied upon by the Auditors.
2.17. Corporate Social Responsibility (CSR) As per the provisions of the Section 135 of the Companies Act, 2013 the Bank
is required to contribute Rs. 1,28,663 thousand. The Bank has contributed entire amount to the Prime Minister’s National Relief Fund in the current financial year .The same is forming part of Schedule 16 (xii) – Operating Expenses.
2.18. In accordance with the requirements of the RBI circular DBOD No BC. 72/29.67.001/2011-12 dated 13 January 2012 the Bank has obtained a letter from its Head Office which states that the compensation policies in India including that for the CEO are in line with the Financial Stability Board (FSB) requirements.
2.19. Previous year figures have been regrouped/reclassified, where necessary, to conform to current year’s presentation.
For The Royal Bank of Scotland N.V. - Indian Branches
Brijesh Mehra Jaykumar Shah Country Executive - India Chief Financial Officer - India
Mumbai, 29 June 2015 Mumbai, 29 June 2015
BASEL III – PILLAR 3 DISCLOSURES AS AT 31 MARCH 2015
The Royal Bank of Scotland N.V. – Indian Branches (“the Bank”) is subject to the Basel III framework with effect from 1 April 2013 as stipulated by the Reserve Bank of India (RBI). The Basel III framework consists of three-mutually reinforcing pillars: (I) Pillar 1: Minimum capital requirements for credit risk, market risk and operational risk (II) Pillar 2: Supervisory review of capital adequacy (iii) Pillar 3: Market disciplineMarket discipline (Pillar 3) comprises disclosures on the capital adequacy and risk management framework of The Bank, India. These disclosures have been set out in the following sections.The Basel III capital regulations were effective April 1 2013 as per RBI guidelines Background1. Scope of Application The Pillar 3 disclosures, being published in accordance with the requirements
of RBI for a branch of foreign bank, do not require the disclosures pertaining to the consolidation of entities.
Royal Bank of Scotland Group Pillar 3 disclosures are published in accordance with the requirements of the Capital Requirements Directive on the Group Investor relations website www.investors.rbs.com and should be read together with the Group Annual Report and Accounts.
2. Capital Structure Summary information on main terms and conditions/features of capital instruments The Bank’s regulatory capital is classified for disclosure according to the RBI
capital adequacy requirements. Common Equity Tier-I capital includes Interest free funds received from Amsterdam (Head Office), statutory reserves, other disclosed free reserves and capital reserves.
Additional Tier-I capital are borrowings from Amsterdam that comply with RBI regulations specified for Innovative Perpetual Debt Instruments. Innovative Perpetual Debt Instruments (IPDI) are perpetual in nature with a call option after the instrument has run for 10 years. Interest on these borrowings are payable semi-annually. These borrowings have a step-up clause on interest rates ranging from 0 to 100 basis points. Capital eligible portion of IPDI is calculated as per RBI regulations.
Tier-II Capital includes general provision and loss reserve including provision on Unhedged Foreign Currency Exposure, investment reserve and borrowings from The Bank, Amsterdam that meets RBI regulations on Hybrid Capital. Tier-II Capital (Hybrid Capital) has an original maturity of 15 years with call option after 10 years. The interest on this borrowing is payable semi-annually and has a step-up clause on interest rates of 100 basis points.
The Bank has not borrowed any debt capital from Head office in the period April 2014– March 2015.
3. Capital Adequacy a. Capital Management The Bank actively manages its capital position to ensure compliance with
regulatory norms meeting current and future business needs in line with the Group’s strategy.
Organizational set-up The capital management framework of The Bank is administered by the India
Asset Liability Committee (ALCO) and the India Risk and Control Committee (RCC) under the supervision of the Executive Committee (MTCo).
Regulatory capital The Bank is subject to the capital adequacy norms stipulated by the RBI
guidelines on Basel III. The RBI guidelines on Basel III require The Bank to maintain a minimum ratio of total capital to risk weighted assets of 9.0%, with a minimum Tier-I capital adequacy ratio of 7% and Common equity capital adequacy ratio of 5.5%. The total capital adequacy ratio of the Bank at 31 March 2015 as per the RBI guidelines on Basel III is 14.23% with a Tier-I capital adequacy ratio of 11.26% and Common equity capital adequacy ratio of 10.76%. Under Pillar 1 of the RBI guidelines on Basel III, The Bank follows the Standardized Approach for credit risk, Standardized Duration method for market risk and Basic Indicator approach for operational risk.
Internal assessment of capital Effective management of the Bank’s capital is achieved by supervision of
actual capital ratios and forecasting capital ratios over three year horizon. The Bank’s capital management framework also includes a comprehensive internal capital adequacy assessment process (ICAAP) conducted annually. The ICAAP encompasses capital planning for a three year time horizon, identification and measurement of material risks and the relationship between risk and capital.
The Bank’s capital management framework is complemented by its risk management framework (detailed in the following sections), which includes a comprehensive assessment of material risks.
Stress testing which is a key aspect of the ICAAP and the risk management framework provides an insight on the impact of extreme but plausible scenarios on The Bank, India’s risk profile and capital position. Based on the approved stress testing framework, The Bank conducts stress tests on its various portfolios and assesses the impact on its capital ratios and the adequacy of capital buffers for current and future periods. The Bank periodically assesses and refines its stress tests in an effort to ensure that the stress scenarios capture material risks as well as reflect possible extreme market moves that could arise as a result of market conditions.
Monitoring and reporting The Management maintains an active oversight over The Bank’s capital
adequacy levels. On a quarterly basis the capital adequacy position and the risk weighted assets as stipulated by RBI, are reported to the ALCO and MTCo
b. Capital requirements for various risk areas As required by RBI guidelines on Basel III, The Bank’s capital requirements
as at 31 March 2015 have been computed using the Standardized Approach for credit risk, Standardized Duration method for market risk and Basic Indicator approach for operational risk. The minimum total capital required to be held at 9.00% for credit, market and operational risks is given below:
DF-3: CAPITAL ADEQUACY (Rs. In crore)31-March-2015 31-March-2014
A Capital requirements for Credit Risk 1,605 1,489 Portfolios subject to standardized approach 1,605 1,489 Securitisation exposures
B Capital requirements for Market Risk 261 327 Standardized duration approachInterest rate risk 207 273 Foreign exchange risk 54 54 Equity risk
C Capital requirements for Operational riskBasic indicator approach 225 241
D Capital Adequacy Ratio of the Bank (%) 14.23% 15.31%
E CET 1 capital ratio (%) 10.76% 11.54%F Tier II capital ratio (%) 2.97% 3.38%
Risk Management Framework: As a financial intermediary, The Bank is exposed to various types of risks
including credit, market, liquidity, operational, legal, compliance and reputation risks. The objective of the risk management framework at The Bank is to identify measure, control and monitor as well as manage and report risks in a clear manner and that the policies and procedures established to address these risks are strictly adhered to.
The important aspects of The Bank’s risk management are a robust risk approval mechanism, well defined processes and guidelines and an independent internal control mechanism. The risk approval mechanism covers all the key areas of risk such as credit, market and operational risk and is involved in quantification of these risks wherever possible for effective and continuous monitoring.
Measurement of risks for capital adequacy purposes Under Pillar 1 of the extant RBI guidelines on Basel III, The Bank currently
follows the Standardized approach for credit risk and Standardized Duration approach for market risk and Basic Indicator approach for operational risk.
THE ROYAL BANK OF SCOTLAND N.V. (Incorporated in the Netherlands with Limited Liability)
INDIAN BRANCHES
21
Objectives and Policies The Bank’s risk management processes are guided by well defined global
as well as local policies appropriate for various risk categories. There is an independent risk team that oversees this function whose oversight is by the regional and global risk offices with periodic independent risk reviews and internal audit reviews. The risk appetite for the Bank in India is determined by the global risk committees based on inputs from the country management.
In addition to the risk management and compliance departments of the Bank, India in India, the India Asset and Liability Committee (ALCO) and Governance and Control Committee (GCC) are involved in managing these risks within the Bank’s guidelines and regulatory requirements.
The Group has global policies for Stress Testing to measure impact of adverse stress scenarios on the adequacy of capital which are implemented locally within the Bank.
Structure and Organization The Bank, India has well established processes for management of all material
risks faced by it as outlined above and has a robust risk governance framework comprising of risk committees at the global, regional and India level.
The key components within The bank’s risk management framework include: l Identification of all material risks that are relevant to the Bank, India
covering all the current activities of the Bank as well as new products and initiatives
l Definition of relevant policies defined by the Head Office customised as required to suit local RBI regulations
l Measurement of its key material risks and performs stress testing to assess its position and response strategy in a stress scenario
l Having a robust control environment to monitor whether the various policies and limits are being adequately implemented
l Monitoring & reporting to the senior management on various material risks The Bank’s risk management framework is embedded in the business
through the three lines of defence model supported by an appropriate level of investment in information technology and its people. The three lines of defence include the Business, Risk management department and Group Internal Audit. The Three Lines of Defence Policy Standard defines responsibilities and accountabilities of each unit. The three lines of defence are completely independent of each other. Business is independent of Risk which is independent from Group Internal Audit. The country Governance and Control Committee (GCC) and the ALCO detailed below are an important aspect of the risk management framework for the Bank.
The Cross Divisional GCC is the apex In-Country Risk Governance body established by the Country Executive to manage and oversee the country’s aggregate risk exposure and to facilitate consolidated risk management for the RBS group franchise in India. The GCC meets monthly and the senior management of the Bank including heads of all the businesses, operations, support functions and risk functions, participate in the meeting. Cross divisional risk issues (ranging from exceptions to policies for IT and Retail & Commercial unit to large corporate risk issues) are tabled and taken to a resolution under the ambit of the country GCC.
Country ALCO is responsible for managing balance sheet risks within its scope and ensuring all related local regulatory requirements are met on a continual basis. The ALCO is a forum for discussion and making decisions on key strategic, financial, risk, control, operational and governance matters relating to the country’s balance sheet, capital, liquidity and funding, non-traded interest rate risk and intra-group limits, subject to policies, limits and targets prescribed by RBS and Regional ALCO.
The Bank, has constituted the following senior management level committees from the perspective of risk governance at the India and Group level:
India LevelCommittee ResponsibilitiesManagement Team Committee (MTCo)
The India Management Team Committee (MTCo) is the highest in-country level decision-making forum which serves as the Local Advisory. The MTCo meets monthly and is responsible for all policy matters and periodic review of the same. It is chaired by the Country Executive and its members include the Head of Trading & Sales, Head of Transaction Services, Head of Private Banking, Chief Financial Officer, Country Risk Officer, Head Compliance, Chief of Internal Vigilance, Head Human Resources, COO.
Committee ResponsibilitiesCountry GCC The Cross Divisional GCC is the apex In-Country Risk
Governance body established by the Country Executive Committee tol Manage and oversee the country’s aggregate risk
exposure and to facilitate consolidated risk management for the RBS group locally regulated entities in the country, namely: RBS Bank Branch, RBS Financial Services (India) Pvt. Ltd., RBS Equities (India) Ltd. & RBS Corporate Finance India Pvt. Ltd.
l Support the Regional & business line Committees/Boards & Country ExCo. as it discharges its responsibilities relating to internal control, financial reporting controls, risk assessment and regulatory compliance by providing a forum for these matters to be reviewed in detail
l Confirm that the first line of defence and the risk management, audit and support functions are discharging their responsibilities and that they are operating adequately and effectively
l Receive and consider an assessment (in the form of reviews, assurance, audits, etc) by the second & third line of defence of the status of the first line’s management of governance & control in the business and take appropriate action.
It is chaired by the Country Executive and convened by India Country Risk Officer. Members of the GCC comprises of Divisional/Business Heads: Markets, Corporate & Institutional Banking, Private Banking, Retail Banking, Business Banking, Commercial Banking, Business Services, ID&JG. Support Function (including Risk) and Group Internal Audit
Asset Liability Committee
India Asset Liability Committee (ALCO) is responsible for ensuring that all Balance Sheet related regulatory requirements outlined in ALCO Terms of reference as within its scope are met on a continual basis. The ALCO is a forum for discussion and making decisions on key strategic, financial, risk, control, operational and governance matters relating to the country’s balance sheet, capital, liquidity and funding, non-traded interest rate risk and intra-group limits, subject to policies, limits and targets prescribed by RBS and APAC ALCO.
India Credit Forum (ICF)
ICF mechanism covers approvals/recommendations for all credits under C&IB and Microfinance businesses. ICF members include the senior officers based in India, from Origination/TPM and the CRO office with individual delegated credit authorities.
Audit Committee
The Audit Committee for the Bank is chaired by the Country Executive. Members include India MTCo and Group Internal Audit (GIA). Frequency of meetings is quarterly; however additional meetings can be convened as required. In the meetings, GIA presents to the committee inter alia, audit plan and achievement thereof, review of significant audit findings, and comment on future planned audits.
Group Level
Committee ResponsibilitiesGroup Board The Group Board is the principal decision making forum for the
company. It has overall responsibility for leading and controlling the company and is accountable to shareholders for financial and operational performance. The Board approves Group strategy and monitors performance.
Group Audit Committee
The Group Audit Committee is responsible for assisting the Board in discharging its responsibilities in relation to the disclosure of the financial affairs of the Group. The committee also reviews accounting and financial reporting and regulatory compliance and the Group's system of internal controls along with monitoring the Group's processes for internal audit, risk management and external audit.
Board Risk Committee
The Board Risk Committee is responsible for providing oversight and advice to the Board in relation to current and potential future risk exposures of the Group and future risk strategy, including determination of risk appetite and tolerance.
Group Performance and Remuneration Committee
The Group Performance and Remuneration Committee is responsible for the overview of the Group's remuneration policy and remuneration governance framework, ensuring that remuneration arrangements are consistent with and promote effective risk management. The committee also makes recommendations to the Board on the remuneration arrangements for the executive directors.
THE ROYAL BANK OF SCOTLAND N.V. (Incorporated in the Netherlands with Limited Liability)
INDIAN BRANCHES
22
Committee ResponsibilitiesGroup Nominations Committee
The Group Nominations Committee is responsible for assisting the Board in the formal selection and appointment of directors having regard to the overall balance of skills, knowledge, experience and diversity on the Board. The committee also considers succession planning for the Chairman, Group Chief Executive and Non-executive Directors.
Group Sustainability Committee
The Group Sustainability Committee is responsible for overseeing and challenging how management is addressing sustainability and reputation issues relating to all stakeholder groups.
Executive Committee
The Executive Committee (ExCo) reports to Group CEO and is accountable to the Board. It meets bi-weekly and focuses on substantive business decisions cutting across issues of Group-wide significance.
Management Committee
The Management Committee (ManCo), comprising our major businesses and functional leaders, meets 3 - 4 times annually and is a vehicle for strategy and business performance review.
Risk & Control Committee
The Risk & Control Committee inter alia oversees the risk framework within The Bank, monitors the actual risk profile and advises the Managing Board. Its scope is credit, market, operational and regulatory risk within the Bank.
Asset & Liability Management Committee (ALCO)
The Managing Board has delegated to the ALCO the responsibility for the management of capital, liquidity, interest rate risk and foreign exchange risk. This includes, among other tasks, responsibility for reviewing, approving and allocating balance sheet, capital, liquidity and funding limits.
Disclosure Committee
The Disclosure Committee advises and assists the Managing Board in fulfilling its responsibilities for overseeing the accuracy and timelines of public disclosures made by the company. This inter alia includes reviewing and advising on the adequacy of the design and establishment of controls and other procedures, including procedures currently used by the Bank in this respect.
4. Credit Risk The Bank is exposed to credit risk in its lending operations. Credit risk is the
risk of loss that may occur from the failure of any counterparty to abide by the terms and conditions of any financial contract with the Bank principally the failure to make required payments as per the terms and conditions of the contracts.
Credit Risk Management Policy Credit risk considers the ability of a borrower or counter-party to honor
commitments under an agreement as any such failure has an adverse impact on the Bank financial performance. The Bank, India is exposed to credit risk through its various lending activities such as funded facilities, non-funded facilities as well as hedging facilities.
The Bank’s credit risk management process is independent of the business so as to protect integrity of the risk assessment process and decision making. The global as well as local policies guide the credit risk team to make informed decisions.
Credit risk in respect of exposures on corporate as well as micro, small and medium enterprises (MSME) is measured and managed at both individual counterparty level as well as at a portfolio level. Selected products
Extended by the Bank, India are managed at the portfolio level, as the individual loans under product programs are guided by the product program with built in triggers. Credit rating tools are an integral part of risk-assessment of the corporate borrowers and different rating models are used for each segment that has distinct risk characteristics such as Large Corporate, Small and Medium Corporate, financial companies and project finance.
The credit rating tools use a combination of quantitative inputs and qualitative inputs to arrive at a ‘point-in-time’ view of the rating of counterparty. Each internal rating grade corresponds to a distinct probability of default. Model validation is carried out periodically at a global level by objectively assessing the accuracy and stability of ratings.
All credit exposures, once approved, are monitored and reviewed periodically against the approved limits. Besides this there are monthly risk migration analysis and monthly watch list meetings.
Risk review involves independent review of credit risk assessment, compliance with internal policies of the Bank and with the regulatory framework, compliance of sanction terms and conditions and effectiveness of loan administration.
Customers with emerging credit problems are identified early and classified accordingly. Remedial action is initiated promptly to minimize the potential loss to the Bank.
The Bank controls and limits Concentration Risk by means of appropriate structural limits and borrower limits based on creditworthiness. The exposures to individual clients or counterparty group are based on the internal rating of the borrower as well as group-wide borrowing limits and capped by the regulatory ceiling.
Industry analysis plays an important part in assessing the Concentration Risk within the loan portfolio. Particular attention is given to industry sectors where The Bank believes there is a high degree of risk or potential for volatility in the future. The Bank has fixed internal limits for aggregate commitments to different sectors so that the exposures are evenly spread over various sectors.
Definition and classification of non-performing assets (NPAs) RBI guidelines are adhered to while classifying advances into performing and
non-performing advances (NPAs) as per RBI guidelines. NPAs are further classified into sub-standard, doubtful and loss assets based on the criteria stipulated by RBI.
The asset classification Standard: less than overdue & up to a maximum of 90days from thereon Substandard: Overdue from the 91st day up to maximum one year from there, Doubtful1: Substandard + up to maximum one year from there Doubtful2: Substandard + > 1 year but up to maximum 3 years from there Doubtful3: Substandard + > 3 years Loss: Substandard + > 3 years A loss asset is one where loss has been identified by the Bank, India or internal
or external auditors or during RBI inspection but the amount has not been written off fully.
An asset, including a leased asset, becomes non-performing when it ceases to generate income for the Bank, India.
An NPA is defined as a loan or an advance where: Interest and/or installment of principal remain overdue for more than 90 days in
respect of a term loan. Any amount due to The Bank under any credit facility is ‘overdue’ if it is not paid on the due date fixed by The Bank; if the interest due and charged during a quarter is not serviced fully within 90 days from the end of the quarter; the account remains ‘out of order’ in respect of an overdraft/cash credit facility.
An account is treated as ‘out of order’ if: the outstanding balance remains continuously in excess of the sanctioned limit/drawing power for 90 days; or where the outstanding balance in the principal operating account is less than the sanctioned limit/drawing power, but there are no credits continuously for 90 days as on the date of the balance sheet; or credits in the account are not enough to cover the interest debited during the accounting period; or drawings have been permitted in the account for a continuous period of 90 days based on drawing power computed on the basis of stock statements that are more than three months old even though the unit may be working or the borrower’s financial position is satisfactory; or the regular ad hoc credit limits have not been reviewed/renewed within 180 days from the due date/date of adhoc sanction. a bill purchased/discounted by the Bank remains overdue for a period of more than 90 days; interest and or installment of principal in respect of an agricultural loan remains overdue for two crop seasons for short duration crops and one crop season for long duration crops;
In respect of a securitization transaction undertaken in terms of the RBI guidelines on securitization, the amount of liquidity facility remains outstanding for more than 90 days;
In respect of derivative transactions, if the overdue receivables representing positive mark-to-market value of a derivative contract, remain unpaid for a period of 90 days from the specified due date for payment.
Restructured assets The Bank, India would ensure that prudential guidelines in respect of income
recognition, asset classification & provisioning (including restructuring of advances) as specified by the RBI from time to time at the minimum, should be adhered to at all times
DF – 4: Credit Risk Exposures Total Gross Credit Risk Exposure Including Geographic Distribution of Exposure
(Rs in crore)
31 March 2015 31 March 2014
Domestic Overseas Total Domestic Overseas TotalFund Based 11,804 - 11,804 14,289 - 14,289 Non Fund Based 11,042 - 11,042 7,273 - 7,273 Total 22,846 - 22,846 21,562 - 21,562
Industry distribution of exposures (Rs in crore)
Industry Classification
31-Mar-15 31-Mar-14
Funded Non funded Funded Non
fundedAll Engineering 751 888 1,081 843 Basic Metal and Metal Products 129 9 86 99 Beverages (excluding Tea & Coffee) and Tobacco 467 28 - 203Cement and Cement Products - 2 - - Chemicals and Chemical Products (Dyes, Paints, etc.) 769 250 988 393 Construction 60 107 366 301 Food Processing 237 103 282 40 Gems and Jewellery 3,767 77 4,517 23 Glass & Glassware - 60 - Infrastructure 777 1,648 555 1,276 Leather and Leather products - - - - Mining and Quarrying 14 28 7 - Other Industries 405 367 2,121 3,843

THE ROYAL BANK OF SCOTLAND N.V. (Incorporated in the Netherlands with Limited Liability)
INDIAN BRANCHES
23
Paper and Paper Products 68 - 218 125 Petroleum (non-infra), Coal Products (non-mining) and Nuclear Fuels - - - - Residuary Other Advances 3,858 7217 62 - Rubber, Plastic and their Products 10 98 88 34 Textiles 10 0 125 1 Vehicles, Vehicle Parts and Transport Equipments 482 160 619 92 Wood and Wood Products - - - - Total 11,804 11,042 11,115 7,273
Residual Contractual Maturity breakdown of Assets as at 31 March 2015 (Rs. in crore)
Particulars Deposit Advances Investment Borrowings FCY Asset
FCY Liabilities
Day 1 237 763 - 196 551 224 2 to 7 days 1,111 2,298 - 675 736 50 8 to 15 days 928 893 - 200 636 32 15 to 28 days 802 1,882 - - 765 3 29 days to 3 months 1,656 1,894 560 219 625 231 Over 3 months to 6 months 370 883 410 - 240 16 Over 6 months to 12 months 712 226 200 - - 32 Over 1 Year to 3 Years 4,676 2,292 2,104 426 790 1,607 Over 3 Years to 5 Years 21 9 1,372 911 - 914 Over 5 Years - 11 - - 823 424 Total 10,513 11,151 4,646 2,627 5,166 3,533
Residual Contractual Maturity breakdown of Assets as at 31 March 2014 (Rs. In crore)
Particulars Deposit Advances Investment Borrowings FCY Asset
FCY Liabilities
Day 1 259 650 - 519 552 563 2 to 7 days 1,810 1,275 - 100 738 70 8 to 15 days 796 480 - - 440 46 15 to 28 days 764 980 78 - 675 8 29 days to 3 months 1,988 4,438 623 - 855 368 Over 3 months to 6 months 580 1,140 - - 454 193 Over 6 months to 12 months 449 724 505 - 8 38 Over 1 Year to 3 Years 4,952 1,434 1,684 197
1,540 1,628
Over 3 Years to 5 Years 28 7 2,344 829 - 830 Over 5 Years - 7 204 - 57 - Total 11,626 11,135 5,438 1,645 5,319 3,744
Movement of NPAs and Provision for NPAs (Rs. in crore)
Particulars 31-March-2015 31-March-2014A Amount of NPAs (Gross) 82 114 Substandard 7 1 Doubtful 17 89 Loss 58 24 B Net NPAs 6 (6)C NPA Ratios Gross NPAs to gross advances (%) 0.73% 1.01% Net NPAs to net advances (%) 0.05% -0.05%D Movement of NPAs (Gross) Opening balance 114 280 Additions during the year 7 16 Reductions during the year (39) (182) Closing balance 82 114 E Movement of Provision for NPAs Opening balance 119 243 Provision made during the year 3 1
Write – offs/Write – back of excess provision (46) (125)
Closing balance 76 119
Non Performing investments (NPIs) and Provision for depreciation on NPIs - NIL
5. Credit Risk: Use of rating Agency under the Standardized approach The Bank has not applied external ratings to its funded or non funded short-
term and long-term instruments or bank facilities’ and has treated them as unrated exposure.
DF – 5: Details of Gross credit risk exposure (Fund based and Non-fund based) based on Risk Weight (Rs. in crore)
31- March-2015 31- March-2014Below 100% risk weight 8,096 8,684100% risk weight 10,769 14,552More than 100% risk weight 4,595 113DeductionsInvestments in subsidiaries - -
6. Credit Risk Mitigation The Bank, India uses various collaterals both financial and non-financial,
guarantees and credit insurance as credit risk mitigants. The main financial collaterals include bank deposits, National Saving Certificate (NSC), Kendriya Vikas Patra (KVP), Life Insurance Policy (LIP), while main non-financial collaterals include land and building, plant and machinery, residential and commercial property. The guarantees include those given by corporate, bank and personal guarantees.
The Bank reduces its credit exposure to counterparty with the value of eligible financial collateral to take account of the risk mitigating effect of the collateral. To account for the volatility in the value of collateral, haircut is applied based on the type, issuer, maturity, rating and re-margining/revaluation frequency of the collateral.
DF – 6: Detail of total credit exposure position as on 31 March 2015 (Rs. in crore)
31- March-2015 31-March-2014Covered by Financial collaterals 464 418Guarantees -
7. Securitization DF – 7: Securitization There were no securitization transactions entered during the year (Previous
year - Nil).8. Market Risk in Trading Book Market risk is the risk to the Bank, India’s earnings and capital arising from
changes in the market level of interest rates or prices of securities and foreign exchange rates. The Bank, India is exposed to market risk through its trading activities, which are carried out both for customers and on a proprietary basis. The Bank, adopts a comprehensive approach to market risk management for its trading, investment and asset/liability portfolios. The policies require that operations in securities, foreign exchange and derivatives are conducted in accordance with sound and acceptable business practices and are as per the extant regulatory guidelines, laws governing transactions in financial securities and the financial environment. The policies contain the limit structure that governs transactions in financial instruments. The policies are reviewed periodically to incorporate changed business requirements, economic environment and changes in regulations.
The Bank uses various risk metrics, both statistical and non-statistical, including:
Non-statistical measures such as position, gaps and sensitivities Value at risk (VaR) The Bank has set in place Value at Risk (VaR) limits, which are based on the
Historical Simulation Method to control and monitor market risk. Daily reports are made available through the risk management systems for monitoring these exposures. In addition to these limits, stress and scenario analysis are undertaken to evaluate shock impacts
The Bank periodically reports on the various investments and their related risk measures to the India MTCo. The Bank also periodically submits the required reports to the regulator as per the regulatory reporting requirements.
A fuller description of the Group’s approach to market risk can be found in the Group’s 2015 Annual Report and Accounts for market risk disclosure.
DF – 8: Capital Requirement for Market Risk
Amount of
Capital requiredAmount of
Capital required31-March-2015 31-March-2014
Interest rate risk 207 273 Foreign exchange risk (including gold) 54 54 Equity position risk
9. Operational Risk Operational Risk is the risk of loss resulting from inadequate or failed internal
processes, and systems or from external events. Operational Risk includes legal risk but excludes strategic and reputational risk. Operational Risk is an integral and unavoidable part of the Bank, India’s business as it is inherent in the processes operating to provide services to customers and generate profit for shareholders.
THE ROYAL BANK OF SCOTLAND N.V. (Incorporated in the Netherlands with Limited Liability)
INDIAN BRANCHES
24
The objective of the Bank’s Operational Risk management is to manage and control operational risks in a cost effective manner within targeted levels of Operational Risk consistent with RBS risk appetite. To ensure appropriate responsibility is allocated for the management, reporting and escalation of operational risk, The Bank operates three lines of defense model which outlines principles for the roles, responsibilities and accountabilities for operational risk management.
Operational Risk – three lines of defense model 1st Line of Defence - Management & Supervision The first line of defence includes customer franchises, Technology & Operations
and the support aspects of functions such as HR, Communications and Financial MI. The first line of defence own and manage the risks within their business area.
First line responsibilities: l Own, manage and supervise, within a defined Risk Appetite, the risks
which exist in the business area l Ensure appropriate controls are in place to mitigate risk: balancing control,
cost, customer service and competitive advantage l Ensure that the culture of the business supports balanced risk decisions
and compliance with policy, laws and regulations l Ensure that the business has effective mechanisms for identifying,
reporting and managing risk and controls 2nd Line of Defence - Oversight & Control The second line includes the Risk and Conduct functions and the financial
aspects of Finance. The second line of defence oversees and/or develops the risk and control frameworks. Additionally, they are responsible for policy setting; approvals of client, transaction, product and process decisions; oversee and challenge the first line where necessary.
Second line responsibilities: l Own and develop the risk and control policies, limits and tools for the
business to use to discharge its responsibilities l Oversee and challenge the effective management of risks and controls
independently from the business l Lead the design, development and communication of the bank’s risk
culture and appetite l Analyse the bank’s aggregate risk profile and ensure that risks are being
managed to the desired level (Risk Appetite) l Provide expert support and advice to the business on risk management l Provide senior executive with relevant management information and
reports and escalate concerns where appropriate l Undertake risk-based, proportionate assurance 3rd Line of Defence - Internal Audit Group Internal Audit provide assurance to the Group Audit Committee and
senior executive that the main business risks have been identified and that effective controls are in place to manage these risks.
Third line responsibilities: l Provide independent assurance over the key risks to the organisation,
which includes an assessment of the entire control framework l Hold RBS Risk Management accountable for establishing an appropriate
risk management framework With regards to the above framework, it must be noted that all the three lines
of defence are completely independent of each other. The Operational Risk Policy Standards provide the direction for delivering
effective operational risk management. They comprise principles and processes that enable the consistent
identification, assessment, management, monitoring and reporting of operational risk across the Group. The objectives of the standards is to protect the Group from financial loss or damage to its reputation, its customers or staff and to ensure that it meets all necessary regulatory and legal requirements.
The standards are supported by several key operational risk management techniques of which the Bank, India applies the following techniques:
1. Risk assessments: business units identify and assess operational risks to ensure that they are effectively managed, prioritized, documented and aligned to risk appetite;
2. Risk Event and Loss data management: each business unit’s internal loss data management process captures all operational risk loss events above certain minimum thresholds. The data is used to enhance the adequacy and effectiveness of controls, identify emerging themes, enable formal loss event reporting and inform risk and control assessments and scenario analysis.
Escalation of individual events to senior management is determined by the seriousness of the event. Operational loss events are categorized under the following headings:
Clients, products and business practices; Technology and infrastructure failures; Employment practices and workplace safety; Internal fraud; External fraud; Execution, delivery and process management; and Disaster and public safety
3. Risk Issues Management: This process ensures that operational risk issues are captured and classified consistently, and that there is robust governance over their closure and acceptance.
4. New products approval process: This process ensures that all new products or significant variations to existing products are subject to a comprehensive risk assessment. Products are evaluated and approved by specialist areas and are subject to executive approval prior to launch; and Scope and nature of reporting and measurement systems
Reporting forms an integral part of operational risk management. The Group’s risk management processes are designed to ensure that issues are identified, escalated and managed on a timely basis. Exposures for each division are reported through monthly risk issue reports, which provide detail on the risk issues and action plans.
Events that have a material, actual or potential impact on THE BANK, India’s finances, reputation or customers, are escalated and reported to divisional and Group executive.
Policies for mitigating risks The objective of operational risk management is not to remove operational
risk altogether, but to manage the risk to an acceptable level, taking into account the cost of minimizing the risk with the resultant reduction in exposure. Strategies to manage operational risk include avoidance, transfer, acceptance and mitigation by controls.
Each business unit must manage its operational risk exposure within an acceptable level, testing the adequacy and effectiveness of controls and other risk mitigants regularly and documenting the results. Where unacceptable control weaknesses are identified, action plans must be produced and tracked to completion.
DF- 9: Approach for Operational Risk Capital Assessment As per the RBI guidelines on Basel III, The Bank, India has adopted Basic
Indicator approach for computing capital charge for operational risk. The capital required for operational risk at March 31, 2015 was Rs. 225 crores.
10. Interest Rate Risk in the banking Book (IRRBB) Interest Rate Risk in the Banking Book Risk management framework for Interest Rate Risk in the Banking book
(IRRBB) also referred as Non-Trading interest Rate Risk (NTIRR) covers the interest rate risk outside the interest rate trading business.
The branch holds various interest rate sensitive assets, liabilities and off balance sheet items linked to various benchmark interest rates and with different re-pricing and maturity dates. IRRBB or NTIRR arises where there is potential for changes in benchmark interest rates to result in a movement in bank’s future income.
Governance framework India ALCO is responsible for evolving appropriate systems and procedures
for identification and analysis of various balance sheet risks including IRRBB or NTIRR and laying down parameters for efficient management of these risks. India ALCO comprises of senior management of the branch and meets periodically. The ALCO focuses on setting interest rate risk appetite by setting limits on relevant indicators, which positively contributes to optimising the balance sheet structure and Net Interest Income (NII) over time, while limiting the susceptibility to interest changes. ALCO periodically monitors risk positions of the branch, ensures compliance with regulatory requirements and internal limits and provides strategic guidance for management of the IRRBB or NTIRR.
Measurement The branch uses the following tools for managing interest rate risk: l Gap analysis: The interest rate gap or mismatch risk is measured by
calculating gaps over different time intervals as at a given date. This static analysis measure mismatches between rate sensitive liabilities (RSL) and rate sensitive assets (RSA). The report is prepared monthly by grouping rate sensitive assets, liabilities and off-balance sheet positions into time buckets according to residual/behavioural maturity or next re-pricing period. The difference between RSA and RSL for each time bucket signifies the gap in that time bucket. The direction of the gap indicates whether net interest income is positively or negatively impacted by a change in interest rates and the magnitude of the gap helps in finding out the change in net interest income for any given interest rate shift.
l Earnings at risk (EaR): The interest rate gap reports mentioned above indicate whether the branch is in a position to benefit from rising interest rates by having a positive gap (RSA > RSL) or whether it is in a position to benefit from declining interest rates by having a negative gap (RSL>RSA). EaR measures the change in NII over a one year time horizon for various levels of parallel shift in interest rates.
l Economic value: Change in the interest rates have a long-term impact on the capital position of the branch, as the economic value of the Branch’s assets, liabilities and off-balance sheet positions get affected by these rate changes. The branch applies modified duration approach and monitors impact of various levels of parallel shift in interest rate curves on the capital position.
l PV01: PV01 measures the impact on economic value of a 1 basis point (0.01%) change in interest rates. The branch also uses PV01 limits to manage IRRBB or NTIRR.
Details of increase (decline) in earnings and economic value for upward and downward rate shocks, assuming parallel shift in the interest rate curves (basis points), based on the local currency positions as are given below

THE ROYAL BANK OF SCOTLAND N.V. (Incorporated in the Netherlands with Limited Liability)
INDIAN BRANCHES
25
Earnings perspective: (Rs. in crore)
31-March-15 31-March-14-200 200 -200 200
INR (19) 19 (9) 9
USD (52) 52 (63) 63
GBP 0 0 1 (1)
EUR 0 0 (1) 1
JPY 8 (8) 8 (8)
RES 0 0 0 (0)
Total (63) 63 (64) 64
Economic value perspective:(Rs. in crore)
31-March-15 31-March-14
-200 200 -200 200INR (4) 4 39 (39)
USD 30 (30) 17 (17)
GBP (1) 1 (0) 0
EUR (5) 5 (5) 5
JPY (9) 9 (9) 9
RES (0) 0 (7) 7
Total 11 (11) 34 (34)
11. General Disclosure for Exposures Related to Counterparty Credit Risk Methodology used to assign economic capital and credit limits for
counterparty credit exposures Counterparty credit risk is covered by the Group’s credit risk framework and
there are policies which apply to OTC derivatives and repo products addressing documentation requirements, product-specific requirements, counterparty specific requirements, issuer risk, margin trading, collateral etc.
Counterparty exposure is calculated per each Counterparty based on THE BANK, India’s approved exposure calculation methodology. The exposure takes into account of mark-to-market and potential future exposure of each trade, as well as Bank’s netting/collateral opinion to the governing master agreement. Where there is a collateral agreement with clear collateral opinion in place, collateral held/posted is also used in the exposure calculation.
Policies for securing collateral and establishing credit reserves The group credit policy framework governs counterparty credit risk management
requirements where legal and administrative capacity of counterparties to enter into collateral agreement is assessed. The policy framework establishes minimum documentation requirements under collateral agreements including thresholds, minimum transfer amounts, haircuts, collateral eligibility criteria and collateral call frequency. Where netting and/or collateral enforceability criteria are not fulfilled, exposure is assumed to be un-collateralized.
Policies with respect to Wrong-way risk (WWR) exposures Wrong-way risk exposures are also governed by the group policy framework.
WWR arises when the risk factors driving the exposure to counterparty are adversely correlated with the creditworthiness of that counterparty, i.e. the size of the exposure increases at the same time as the riskiness of the counterparty increases. Bank recognizes two different types of WWR – Specific WWR and General WWR.
Specific WWR arises when the exposure on transactions is by virtue of economic dependence or ownership i.e. ‘self-referenced’, to the counterparty. General WWR is further classified as (a) Currency Risk and (b) Correlation Risk. Currency risk arises when counterparty is correlated with a macroeconomic factor which also affects the exposure. Correlation Risk arises when the exposure on the transaction is correlated with the counterparty’s creditworthiness for a reason that is specific to the counterparty. Bank monitors and manages the wrong-way risk in accordance with the group wide policy framework.
Collateral required in the event of a credit rating downgrade The Group calculates the additional collateral it would be required to post in
the event of its credit ratings being downgraded by one or two notches. This is undertaken on a daily basis for treasury and liquidity management purposes. The Bank follows the group-wide policy framework on collateral requirement in the event of credit rating downgrade.
(Rs. in crore)
Particulars IRS/CCS/FRA OPTIONSGross Positive Fair Value of Contracts 1,177 3Netting Benefits 0 0Netted Current Credit Exposure 1,177 3Collateral held (e.g. Cash, G-sec, etc.) 0 0Net Derivatives Credit Exposure 1,177 3Exposure amount (under CEM) 3,543 61Notional value of Credit Derivative hedges 0 0
Credit derivative transactions that create exposures to CCR 0 0
12. Composition of Capital
Sr. No.
ParticularAmount (Rs. In
millions)
Amounts Subject to Pre-
Basel III Treatment
Ref No.
1 Directly issued qualifying common share capital plus related stock surplus (share premium) 1,690 a
2 Retained earnings 26,024 b+c+d3 Accumulated other comprehensive income
(and other reserves) 0 4 Directly issued capital subject to phase out
from CET1 (only applicable to non-joint stock companies1) 0 Public sector capital injections grandfathered until 1 January 2018 0
5 Common share capital issued by subsidiaries and held by third parties (amount allowed in group CET1) 0
6 Common Equity Tier 1 capital before regulatory adjustments 27,714 Common Equity Tier 1 capital: regulatory adjustments
7 Prudential valuation adjustments 0 8 Goodwill (net of related tax liability) 0 9 Intangibles other than mortgage-servicing
rights (net of related tax liability) 0 10 Deferred tax assets 2 1,416 944 e11 Cash-flow hedge reserve 0 12 Shortfall of provisions to expected losses 0 13 Securitisation gain on sale 0 14 Gains and losses due to changes in own credit
risk on fair valued liabilities 0 15 Defined-benefit pension fund net assets 0 16 Investments in own shares (if not already
netted off paid-in capital on reported balance sheet) 0
17 Reciprocal cross-holdings in common equity 0 18 Investments in the capital of banking, financial
and insurance entities that are outside the scope of regulatory consolidation, net of eligible short positions, where THE BANK, India 0 does not own more than 10% of the issued share capital(amount above 10% threshold) 0
19 Significant investments in the common stock of banking, financial and insurance entities that are outside the scope of regulatory consolidation, net of eligible short positions(amount above 10% threshold) 0
20 Mortgage servicing rights4 (amount above 10% threshold) 0
21 Deferred tax assets arising from temporary differences5(amount above 10% threshold, net of related tax liability) 0
22 Amount exceeding the 15% threshold6 0

THE ROYAL BANK OF SCOTLAND N.V. (Incorporated in the Netherlands with Limited Liability)
INDIAN BRANCHES
26
23 of which: significant investments in the common stock of financial entities 0
24 of which: mortgage servicing rights 025 of which: deferred tax assets arising from
temporary differences 026 National specific regulatory adjustments7
(26a+26b+26c+26d) 026a of which: Investments in the equity capital of
the unconsolidated insurance subsidiaries 026b of which: Investments in the equity capital of
unconsolidated on-financial subsidiaries8 026c of which: Shortfall in the equity capital of
majority owned financial entities which have not been consolidated with the bank 0
26d of which: Unamortised pension funds expenditures 0Regulatory Adjustments Applied to Common Equity Tier 1 in respect of Amounts Subject to Pre-Basel III Treatment 0of which: [INSERT TYPE OF ADJUSTMENT] For example: filtering out of unrealised losses on AFS debt securities (not relevant in Indian context) 0of which: [INSERT TYPE OF ADJUSTMENT] 0of which: [INSERT TYPE OF ADJUSTMENT] 0
27 Regulatory adjustments applied to Common Equity Tier 1 due to insufficient Additional Tier 1 and Tier 2 to cover deductions 0
28 Total regulatory adjustments to Common equity Tier 1 1,416
29 Common Equity Tier 1 capital (CET1) 26,298 Additional Tier 1 capital: instruments
30 Directly issued qualifying Additional Tier 1 instruments plus related stock surplus (31+32) -
31 of which: classified as equity under applicable accounting standards (Perpetual Non-Cumulative Preference Shares) 0
32 of which: classified as liabilities under applicable accounting standards (Perpetual debt Instruments) -
33 Directly issued capital instruments subject to phase out from Additional Tier 1 2,171 f
34 Additional Tier 1 instruments (and CET1 instruments not included in row 5) issued by subsidiaries and held by third parties (amount allowed in group AT1) -
35 of which: instruments issued by subsidiaries subject to phase out -
36 Additional Tier 1 capital before regulatory adjustments 2,171 Additional Tier 1 capital: regulatory adjustments
37 Investments in own Additional Tier 1 instruments 0
38 Reciprocal cross-holdings in Additional Tier 1 instruments 0
39 Investments in the capital of banking, financial and insurance entities that are outside the scope of regulatory consolidation, net of eligible short positions, where THE BANK, India does not own more than 10% of the issued common share capital of the entity (amount above 10% threshold) 0
40 Significant investments in the capital of banking, financial and insurance entities that are outside the scope of regulatory consolidation (net of eligible short positions)10 0
41 National specific regulatory adjustments (41a+41b) 0
41a Investments in the Additional Tier 1 capital of unconsolidated insurance subsidiaries 0
41b Shortfall in the Additional Tier 1 capital of majority owned financial entities which have not been consolidated with THE BANK, India 0Regulatory Adjustments Applied to Additional Tier 1 in respect of Amounts Subject to Pre-Basel III Treatment 944 of which: DTA 944 eof which: [INSERT TYPE OF ADJUSTMENT e.g. existing adjustments which are deducted from Tier 1 at 50%] 0
42 Regulatory adjustments applied to Additional Tier 1 due to insufficient Tier 2 to cover deductions 0
43 Total regulatory adjustments to Additional Tier 1 capital 944
44 Additional Tier 1 capital (AT1) 1,227 44a Additional Tier 1 capital reckoned for capital
adequacy11 1,227 45 Tier 1 capital (T1 = CET1 + AT1) (29 + 44a) 27,525
Tier 2 capital: instruments and provisions 46 Directly issued qualifying Tier 2 instruments
plus related stock surplus 047 Directly issued capital instruments subject to
phase out from Tier 2 5,010 e48 Tier 2 instruments (and CET1 and AT1
instruments not included in rows 5 or 34) issued by subsidiaries and held by third parties (amount allowed in group Tier 2) 0
49 of which: instruments issued by subsidiaries subject to phase out 0
50 Provisions12 2,251 g+h51 Tier 2 capital before regulatory adjustments 7,261
Tier 2 capital: regulatory adjustments 52 Investments in own Tier 2 instruments 053 Reciprocal cross-holdings in Tier 2 instruments 054 Investments in the capital of banking, financial
and insurance entities that are outside the scope of regulatory consolidation, net of eligible short positions, where THE BANK, India does not own more than 10% of the issued common share capital of the entity (amount above the 10% threshold) 0
55 Significant investments13 in the capital banking, financial and insurance entities that are outside the scope of regulatory consolidation (net of eligible short positions) 0
56 National specific regulatory adjustments (56a+56b) 0
56a of which: Investments in the Tier 2 capital of unconsolidated subsidiaries 0
56b of which: Shortfall in the Tier 2 capital of majority owned financial entities which have not been consolidated with THE BANK, India 0Regulatory Adjustments Applied To Tier 2 in respect of Amounts Subject to Pre-Basel III Treatment 0of which: [INSERT TYPE OF ADJUSTMENT e.g. existing adjustments which are deducted from Tier 2 at 50%] 0of which: [INSERT TYPE OF ADJUSTMENT 0
57 Total regulatory adjustments to Tier 2 capital 058 Tier 2 capital (T2) 7,261
58a Tier 2 capital reckoned for capital adequacy14 7,261 58b Excess Additional Tier 1 capital reckoned as
Tier 2 capital 058c Total Tier 2 capital admissible for capital
adequacy (58a + 58b) 7,261 59 Total capital (TC = T1 + T2) (45 + 58c) 34,786
Risk Weighted Assets in respect of Amounts Subject to Pre-Basel III Treatment
244,417

THE ROYAL BANK OF SCOTLAND N.V. (Incorporated in the Netherlands with Limited Liability)
INDIAN BRANCHES
27
of which: [INSERT TYPE OF ADJUSTMENT] Of which:
60 Total risk weighted assets (60a + 60b + 60c) 244,417 60a of which: total credit risk weighted assets 190,345 60b of which: total market risk weighted assets 29,044 60c of which: total operational risk weighted assets 25,028
Capital ratios 61 Common Equity Tier 1 (as a percentage of risk
weighted assets) 10.76%62 Tier 1 (as a percentage of risk weighted
assets) 11.26%63 Total capital (as a percentage of risk weighted
assets) 14.23%64 Institution specific buffer requirement
(minimum CET1requirement plus capital conservation and countercyclical buffer requirements, expressed as a percentage of risk weighted assets) 0
65 of which: capital conservation buffer requirement 0
66 of which: bank specific countercyclical buffer requirement 0
67 of which: G-SIB buffer requirement 068 Common Equity Tier 1 available to meet
buffers (as a percentage of risk weighted assets) 5.60%National minima (if different from Basel III)
69 National Common Equity Tier 1 minimum ratio (if different from Basel III minimum) 5.50%
70 National Tier 1 minimum ratio (if different from Basel III minimum) 7.00%
71 National total capital minimum ratio (if different from Basel III minimum) 9.00%Amounts below the thresholds for deduction (before risk weighting)
72 Non-significant investments in the capital of other financial entities 0
73 Significant investments in the common stock of financial entities 0
74 Mortgage servicing rights (net of related tax liability) 0
75 Deferred tax assets arising from temporary differences (net of related tax liability) 0Applicable caps on the inclusion of provisions in Tier 2
76 Provisions eligible for inclusion in Tier 2 in respect of exposures subject to standardised approach (prior to application of cap) 2,251
77 Cap on inclusion of provisions in Tier 2 under standardised approach 2,379
78 Provisions eligible for inclusion in Tier 2 in respect of exposures subject to internal ratings-based approach (prior to application of cap) NA
79 Cap for inclusion of provisions in Tier 2 under internal ratings-based approach NACapital instruments subject to phase-out arrangements (only applicable between 31 March , 2017 and 31 March, 2022)
80 Current cap on CET1 instruments subject to phase out arrangements NA
81 Amount excluded from CET1 due to cap (excess over cap after redemptions and maturities) NA
82 Current cap on AT1 instruments subject to phase out arrangements NA
83 Amount excluded from AT1 due to cap (excess over cap after redemptions and maturities) NA
84 Current cap on T2 instruments subject to phase out arrangements NA
85 Amount excluded from T2 due to cap (excess over cap after redemptions and maturities) NA
* NA - Not Applicable
Notes to the Template
Particular (Rs. in million)
10 Deferred tax assets associated with accumulated losses 0Deferred tax assets (excluding those associated with accumulated losses) net of Deferred tax liability 2,360
19 If investments in insurance subsidiaries are not deducted fully from capital and instead considered under 10% threshold for deduction, the resultant increase in the capital of bank
NA
of which: Increase in Common Equity Tier 1 capital NAof which: Increase in Additional Tier 1 capital NAof which: Increase in Tier 2 capital NA
26b
If investments in the equity capital of unconsolidated non-financial subsidiaries are not deducted and hence, risk weighted then:
NA
(i) Increase in Common Equity Tier 1 capital NA (ii) Increase in risk weighted assets NA
44a
Excess Additional Tier 1 capital not reckoned for capital adequacy (difference between Additional Tier 1 capital as reported in row 44 and admissible Additional Tier 1 capital as reported in 44a)
0
of which: Excess Additional Tier 1 capital which is considered as Tier 2 capital under row 58b 0
50 Eligible Provisions included in Tier 2 capital 2,251 Eligible Revaluation Reserves included in Tier 2 capital 0
58a
Excess Tier 2 capital not reckoned for capital adequacy (difference between Tier 2 capital as reported in row 58 and T2 as reported in 58a)
0
15. Composition of Capital – Reconciliation RequirementsParticulars Balance sheet as in
financial statements As on 31 March 2015 (Rs. In Millions)
Ref No.
A Capital & Liabilities i Paid-up Capital 1,690 a
Reserves & Surplus 27,033of which :Statutory Reserves 8,280 bCapital Reserves 224 cOther Revenue reserves 17,520 dInvestment fluctuation Reserve 164 gBalance in Profit/Loss account 846Minority Interest -Total Capital 28,723
ii Deposits 105,127of which: Deposits from banks 1,860of which: Customer deposits 103,268of which: Other deposits (pl. specify) -
iii Borrowings 26,267I. Borrowings in Indiaof which: From RBI 2,300of which: From banks 3,000of which: From other institutions & agencies 3,446of which: Others (pl. specify) -II. Borrowings outside India 17,521of which: Capital instruments 13,374 f
iv Other liabilities & provisions 30,076of which : Provision for Standard Advances 2,087 h Total 190,193
B Assets i Cash and balances with Reserve
Bank of India 9,969Balance with banks and money at call and short notice 1,101
ii Investments: 46,463 of which: Government securities 46,463 of which: Other approved securities -

THE ROYAL BANK OF SCOTLAND N.V. (Incorporated in the Netherlands with Limited Liability)
INDIAN BRANCHES
28
Particulars Balance sheet as in financial statements As
on 31 March 2015 (Rs. In Millions)
Ref No.
of which: Shares - of which: Debentures & Bonds - of which: Subsidiaries/Joint Ventures/Associates of which: Others (Commercial Papers, Mutual Funds etc.) -
iii Loans and advances 111,507 of which: Loans and advances to banks 12 of which: Loans and advances to customers 111,495
iv Fixed assets 624v Other assets 20,529
of which: Goodwill and intangible assets of which: Deferred tax assets 2,295 e
vi Goodwill on consolidation -vii Debit balance in Profit & Loss
account - Total Assets 190,193
15. Main Features Template1 Issuer NA2 Unique identifier (e.g. CUSIP, ISIN or
Bloomberg identifier for private placement) NA3 Governing law(s) of the instrument
Regulatory treatment 4 Transitional Basel III rules Tier II 5 Post-transitional Basel III rules Ineligible6 Eligible at solo/group/group & solo NA7 Instrument type HO - Borrowings8 Amount recognised in regulatory capital (Rs.
in million, as of most recent reporting date) 5,0109 Par value of instrument 5,010
10 Accounting classification Liability - Borrowings11 Original date of issuance 31st March, 200812 Perpetual or dated Dated13 Original maturity date 31st March, 202314 Issuer call subject to prior supervisory
approval Yes15 Optional call date, contingent call dates and
redemption amount 31st March, 2018 , Loan Principal amount and Accrued Interest
16 Subsequent call dates, if applicable 31 March and/or 30 September every year after 31st March, 2018
Coupons/dividends Coupon17 Fixed or floating dividend/coupon Floating18 Coupon rate and any related index LIBOR+4.07%19 Existence of a dividend stopper NA20 Fully discretionary, partially discretionary or
mandatory NA21 Existence of step up or other incentive to
redeem Yes22 Noncumulative or cumulative NA23 Convertible or non-convertible NA24 If convertible, conversion trigger(s) NA25 If convertible, fully or partially NA26 If convertible, conversion rate NA27 If convertible, mandatory or optional
conversion NA28 If convertible, specify instrument type
convertible into NA29 If convertible, specify issuer of instrument it
converts into NA30 Write-down feature NA
31 If write-down, write-down trigger(s) NA32 If write-down, full or partial NA33 If write-down, permanent or temporary NA34 If temporary write-down, description of write-
up mechanism NA35 Position in subordination hierarchy in
liquidation (specify instrument type immediately senior to instrument) NA
36 Non-compliant transitioned features Yes37 If yes, specify non-compliant features No Basel III Loss
Absorbency
1 Issuer NA NA2 Unique identifier (e.g. CUSIP, ISIN
or Bloomberg identifier for private placement) NA NA
3 Governing law(s) of the instrument Regulatory treatment
4 Transitional Basel III rules Additional Tier I Additional Tier I5 Post-transitional Basel III rules Ineligible Ineligible6 Eligible at solo/group/group & solo NA NA7 Instrument type HO - Borrowings HO - Borrowings8 Amount recognised in regulatory
capital (Rs. in million, as of most recent reporting date) 2,171
9 Par value of instrument 2,171 2,17110 Accounting classification Liability -
BorrowingsLiability - Borrowings
11 Original date of issuance 13th March , 2008
19th December, 2006
12 Perpetual or dated Perpetual Perpetual13 Original maturity date NA NA14 Issuer call subject to prior
supervisory approval Yes Yes15 Optional call date, contingent call
dates and redemption amount 13th September, 2018
21st December, 2016
16 Subsequent call dates, if applicable 13th March & 13th September after 1st call date
13th March & 13th September after 1st call date
Coupons/dividends Coupon Coupon17 Fixed or floating dividend/coupon Floating Floating18 Coupon rate and any related index LIBOR+1.4275% LIBOR+4.2%19 Existence of a dividend stopper NA NA20 Fully discretionary, partially
discretionary or mandatory NA NA21 Existence of step up or other
incentive to redeem No No22 Noncumulative or cumulative Non Cumulative Non Cumulative23 Convertible or non-convertible NA NA24 If convertible, conversion trigger(s) NA NA25 If convertible, fully or partially NA NA26 If convertible, conversion rate NA NA27 If convertible, mandatory or
optional conversion NA NA28 If convertible, specify instrument
type convertible into NA NA29 If convertible, specify issuer of
instrument it converts into NA NA30 Write-down feature NA NA31 If write-down, write-down trigger(s) NA NA32 If write-down, full or partial NA NA33 If write-down, permanent or
temporary NA NA34 If temporary write-down, description
of write-up mechanism NA NA35 Position in subordination hierarchy
in liquidation (specify instrument type immediately senior to instrument)
Subordinated to other Creditors
Subordinated to other Creditors
36 Non-compliant transitioned features Yes Yes37 If yes, specify non-compliant
features No Basel III Loss Absorbency
No Basel III Loss Absorbency