
The Role of the “PD” in Today's Banking System
28
The Role of the “PD” in Today’s Banking System Douglas Dwyer Managing Director Moody’s KMV February 2009
Transcript of The Role of the “PD” in Today's Banking System
The Role of the “PD” in Today’s Banking System
Douglas Dwyer
Managing Director
Moody’s KMV
February 2009

COPYRIGHT@2009 MOODY’S KMV COMPANY. ALL RIGHTS RESERVED.The Role of the “PD” in today’s banking system
Takeaways
� A “PD” is playing an increasingly central role in today’s banking system
� A PD’s meaning can differ, depending on context
� An internal rating
� The long run average of the one-year default rate of a specific population within a specific risk profile
� The best estimate of the PD given available information and a model
� Level Validation of a “PD” is challenging
� Correct models will over state default rates most of the time
� There are many data issues associated with how to define default
� Data collection methods are not constant over long time periods
� The level of a PD needs to be benchmarked against other sources
� Reasonable differences in methodologies can lead to large differences in results

1 How did we get here?
COPYRIGHT@2009 MOODY’S KMV COMPANY. ALL RIGHTS RESERVED.The Role of the “PD” in today’s banking system
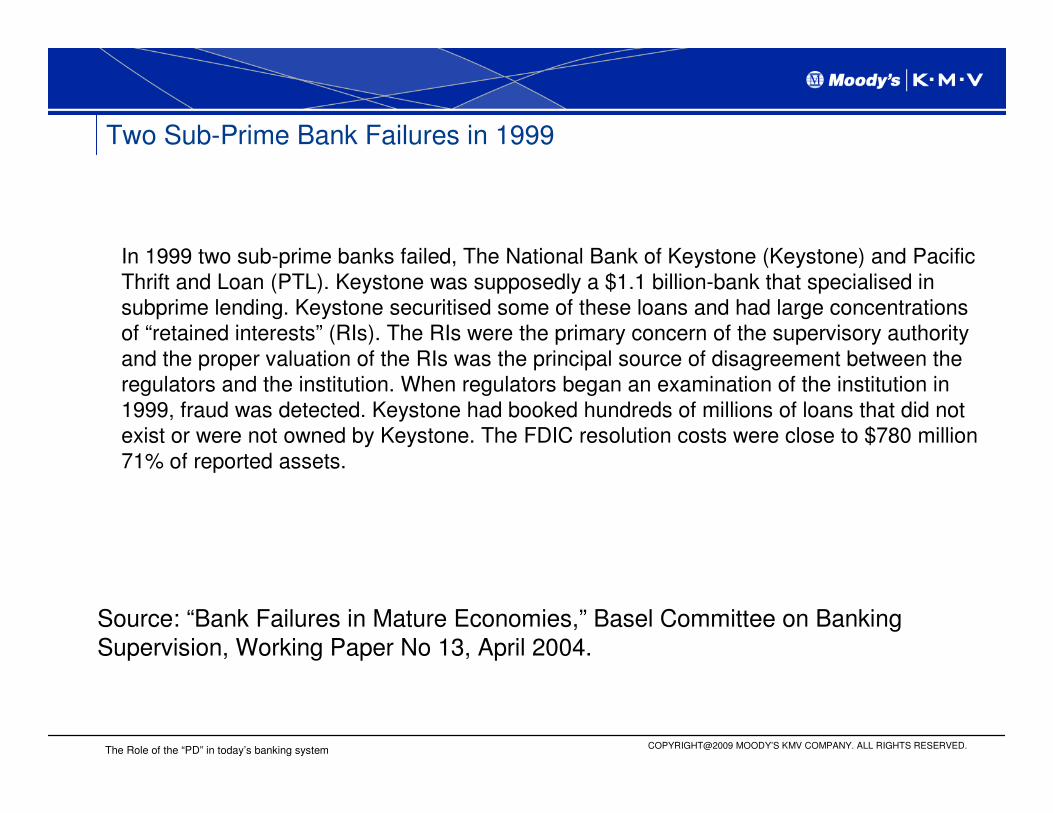
Two Sub-Prime Bank Failures in 1999
In 1999 two sub-prime banks failed, The National Bank of Keystone (Keystone) and Pacific Thrift and Loan (PTL). Keystone was supposedly a $1.1 billion-bank that specialised in subprime lending. Keystone securitised some of these loans and had large concentrations of “retained interests” (RIs). The RIs were the primary concern of the supervisory authority and the proper valuation of the RIs was the principal source of disagreement between the regulators and the institution. When regulators began an examination of the institution in 1999, fraud was detected. Keystone had booked hundreds of millions of loans that did not exist or were not owned by Keystone. The FDIC resolution costs were close to $780 million 71% of reported assets.
Source: “Bank Failures in Mature Economies,” Basel Committee on Banking Supervision, Working Paper No 13, April 2004.
COPYRIGHT@2009 MOODY’S KMV COMPANY. ALL RIGHTS RESERVED.The Role of the “PD” in today’s banking system
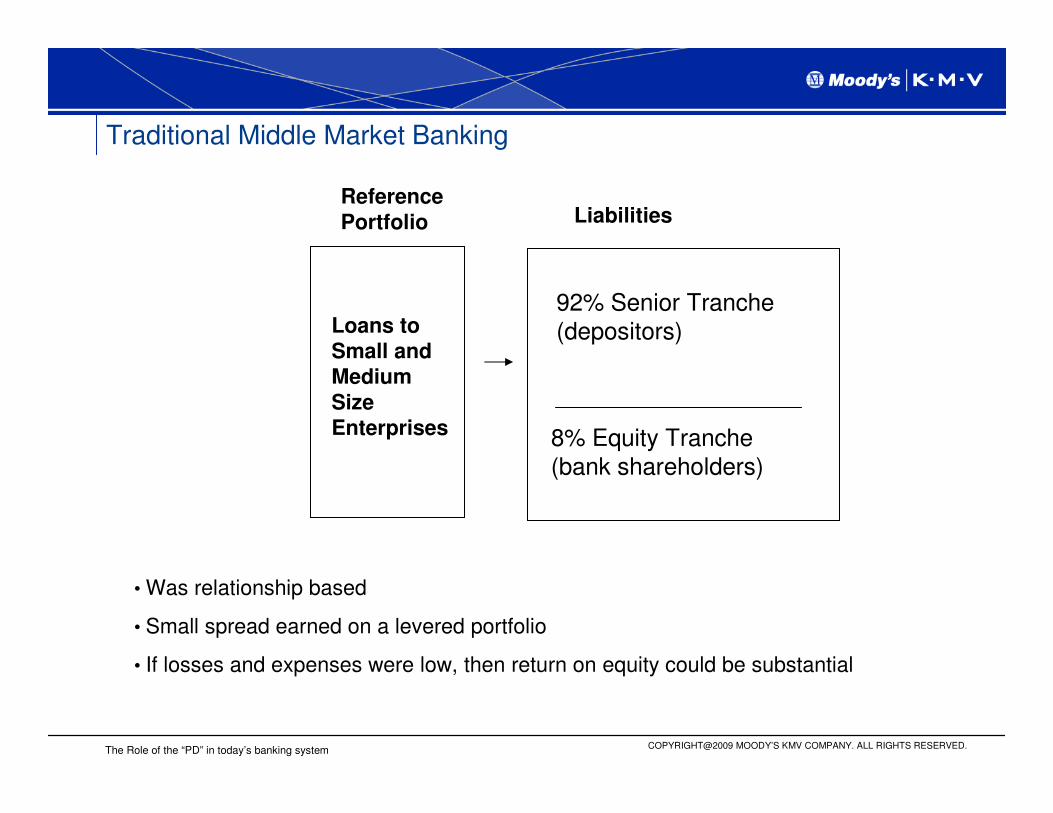
Traditional Middle Market Banking
Loans to Small and Medium
Size Enterprises
Reference
Portfolio
92% Senior Tranche(depositors)
8% Equity Tranche(bank shareholders)
• Was relationship based
• Small spread earned on a levered portfolio
• If losses and expenses were low, then return on equity could be substantial
Liabilities
COPYRIGHT@2009 MOODY’S KMV COMPANY. ALL RIGHTS RESERVED.The Role of the “PD” in today’s banking system
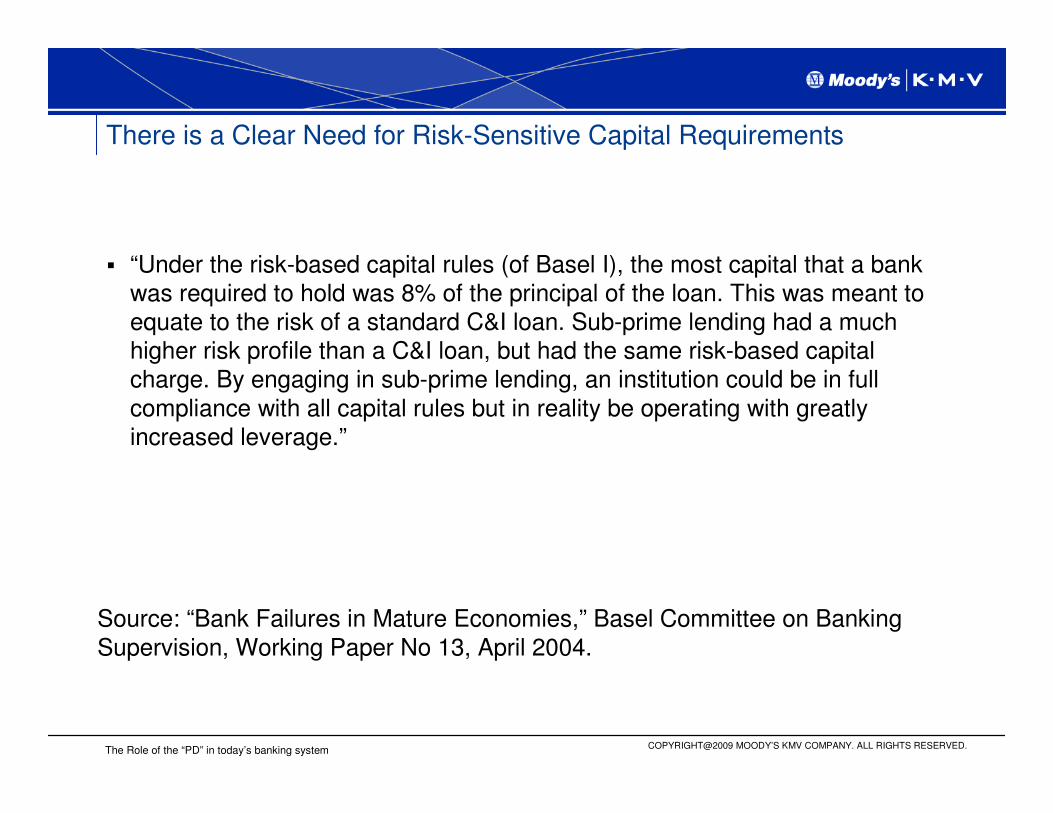
� “Under the risk-based capital rules (of Basel I), the most capital that a bank was required to hold was 8% of the principal of the loan. This was meant to equate to the risk of a standard C&I loan. Sub-prime lending had a much higher risk profile than a C&I loan, but had the same risk-based capital charge. By engaging in sub-prime lending, an institution could be in full compliance with all capital rules but in reality be operating with greatly increased leverage.”
Source: “Bank Failures in Mature Economies,” Basel Committee on Banking Supervision, Working Paper No 13, April 2004.
There is a Clear Need for Risk-Sensitive Capital Requirements

COPYRIGHT@2009 MOODY’S KMV COMPANY. ALL RIGHTS RESERVED.The Role of the “PD” in today’s banking system
Under Basel II, Regulatory Capital is Largely Determined by the PD
1 1( ) (.999)
1
i i
i
PDK EAD LGD PD
ρ
ρ
− − Φ + Φ = × Φ −
−
K is capital requirements
EAD is exposure at default
LGD is loss given default
PD is the one year probability of default
ρi is “asset correlation”
0.999 sets the capital requirement to the 1 in a thousand worst case scenario
This is Vasicek’s limiting distribution and assumes a highly diversified portfolio and a one-factor model
COPYRIGHT@2009 MOODY’S KMV COMPANY. ALL RIGHTS RESERVED.The Role of the “PD” in today’s banking system
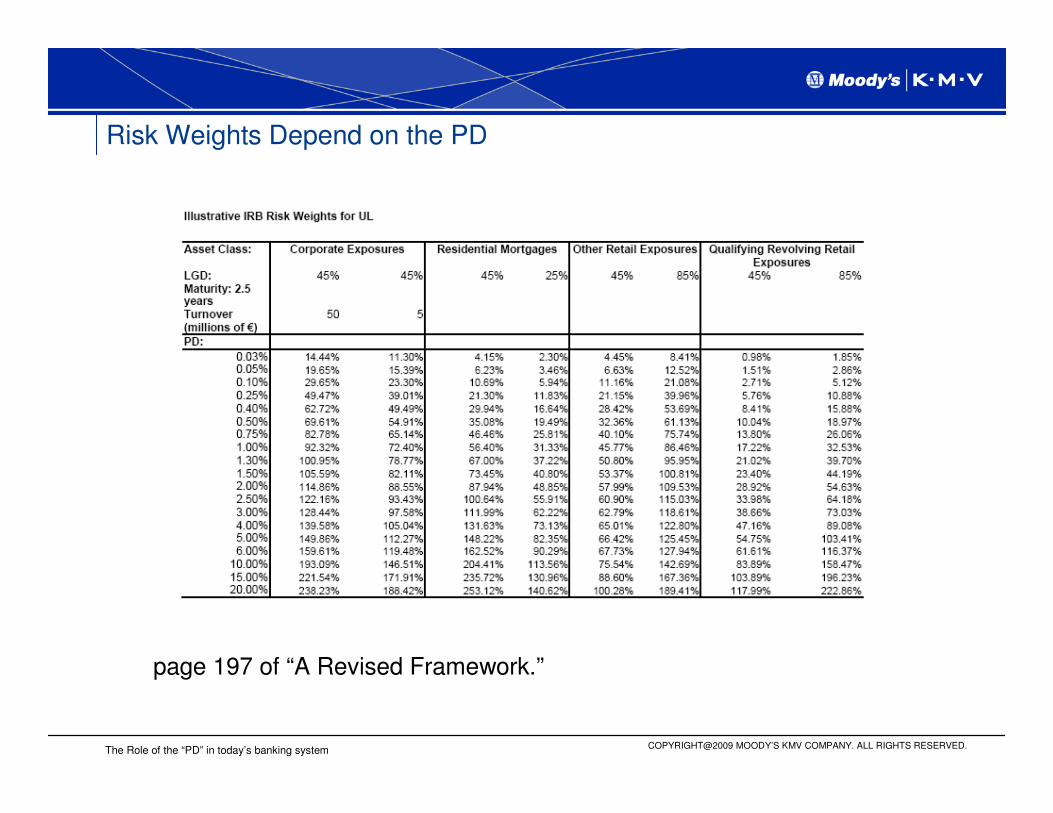
Risk Weights Depend on the PD
page 197 of “A Revised Framework.”
COPYRIGHT@2009 MOODY’S KMV COMPANY. ALL RIGHTS RESERVED.The Role of the “PD” in today’s banking system
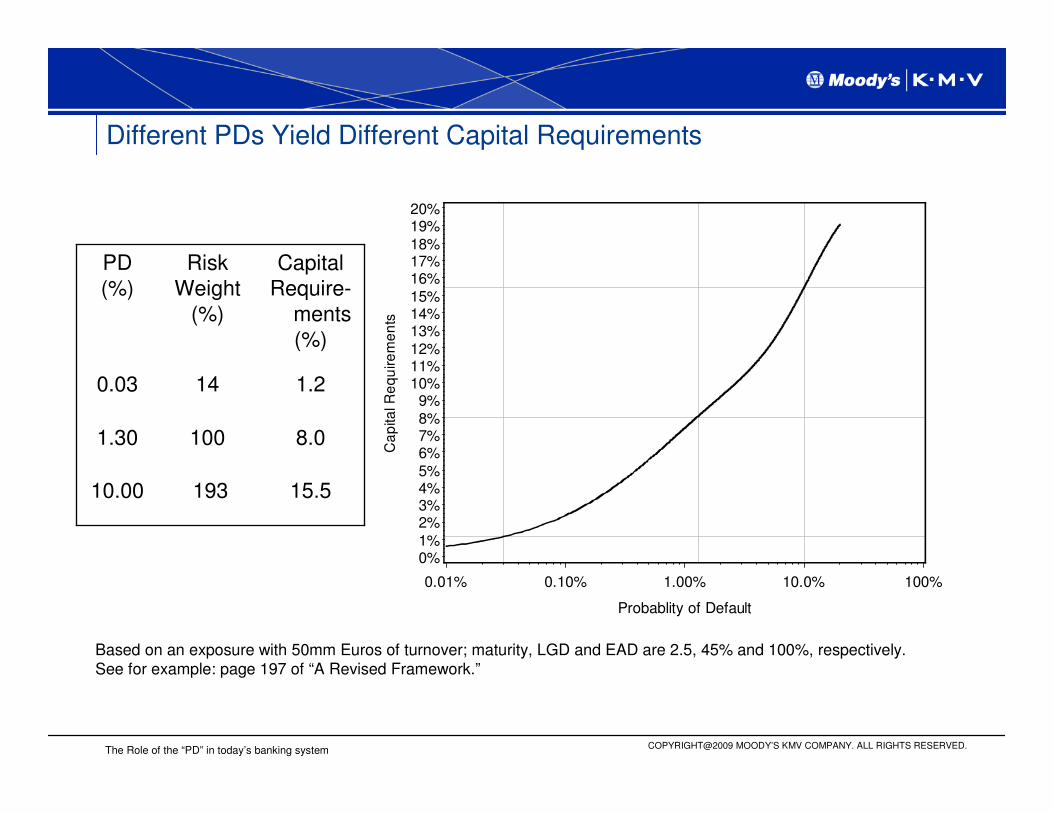
Different PDs Yield Different Capital Requirements
Ca
pita
l Re
qu
ire
me
nts
0% 1% 2% 3% 4% 5% 6% 7% 8% 9% 10% 11% 12% 13% 14% 15% 16% 17% 18% 19% 20%
Probablity of Default
0.01% 0.10% 1.00% 10.0% 100%
15.519310.00
8.01001.30
1.2140.03
Capital Require-
ments(%)
Risk Weight
(%)
PD(%)
Based on an exposure with 50mm Euros of turnover; maturity, LGD and EAD are 2.5, 45% and 100%, respectively. See for example: page 197 of “A Revised Framework.”

2 What is a PD?

COPYRIGHT@2009 MOODY’S KMV COMPANY. ALL RIGHTS RESERVED.The Role of the “PD” in today’s banking system
What is a PD?
� Is it: The probability of default within one-year given all information available and a model
� How is default defined?
� Is default a black and white event?
� Is it: The “long-run average” one-year default rate of a rating class?
� Is it: The output of an internal rating system used to determine:
� Capital requirements
� The level of monitoring
� Loan limits
� Pricing terms
� Whether or not to originate? or Renew?
COPYRIGHT@2009 MOODY’S KMV COMPANY. ALL RIGHTS RESERVED.The Role of the “PD” in today’s banking system
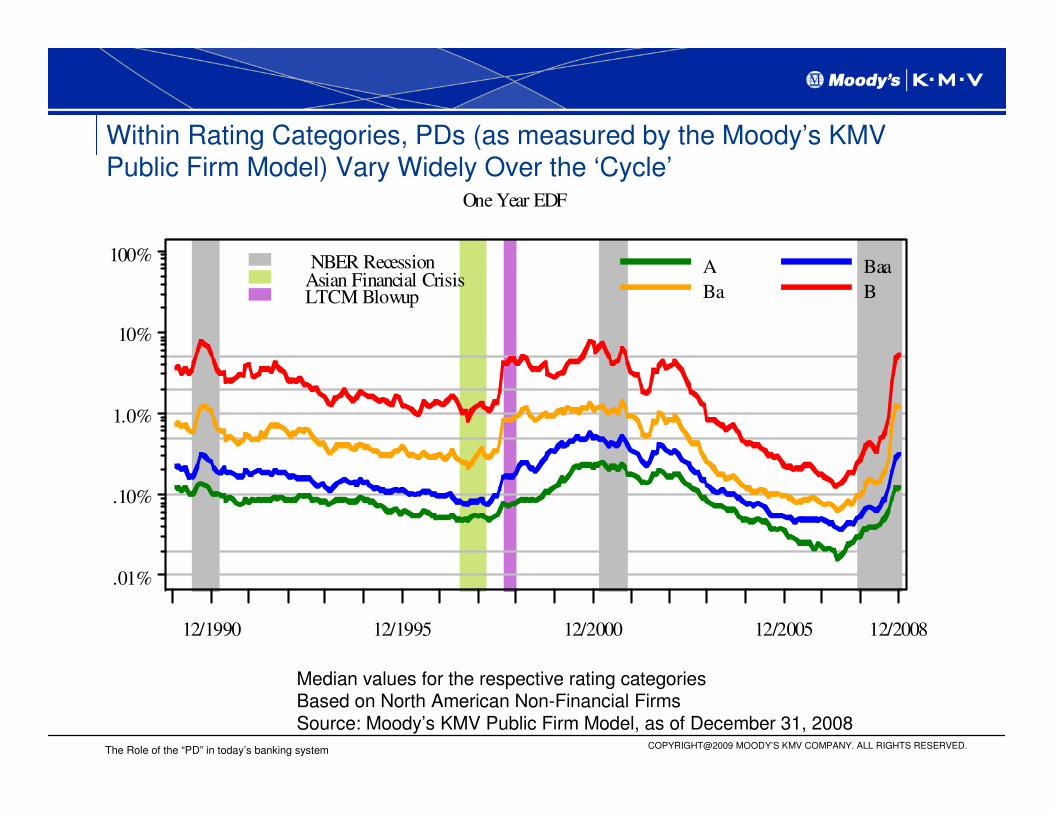
NBER RecessionAsian Financial CrisisLTCM Blowup
One Year EDF
A Baa
Ba B
.01%
.10%
1.0%
10%
100%
12/1990 12/1995 12/2000 12/2005 12/2008
Within Rating Categories, PDs (as measured by the Moody’s KMV Public Firm Model) Vary Widely Over the ‘Cycle’
Median values for the respective rating categoriesBased on North American Non-Financial Firms Source: Moody’s KMV Public Firm Model, as of December 31, 2008
3 Challenges in Measuring a Realized Default Rate
COPYRIGHT@2009 MOODY’S KMV COMPANY. ALL RIGHTS RESERVED.The Role of the “PD” in today’s banking system
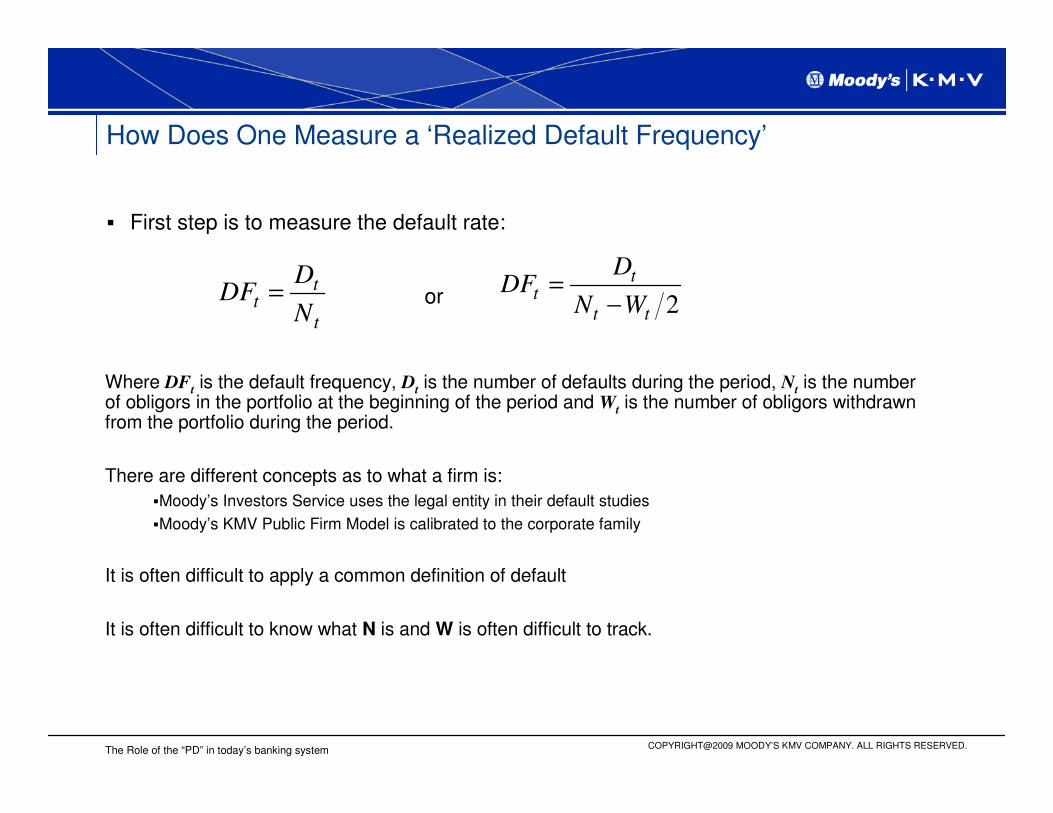
How Does One Measure a ‘Realized Default Frequency’
� First step is to measure the default rate:
t
t
t
DDF
N=
Where DFtis the default frequency, D
tis the number of defaults during the period, N
tis the number
of obligors in the portfolio at the beginning of the period and Wtis the number of obligors withdrawn
from the portfolio during the period.
There are different concepts as to what a firm is:
�Moody’s Investors Service uses the legal entity in their default studies
�Moody’s KMV Public Firm Model is calibrated to the corporate family
It is often difficult to apply a common definition of default
It is often difficult to know what N is and W is often difficult to track.
2
t
t
t t
DDF
N W=
−or
COPYRIGHT@2009 MOODY’S KMV COMPANY. ALL RIGHTS RESERVED.The Role of the “PD” in today’s banking system
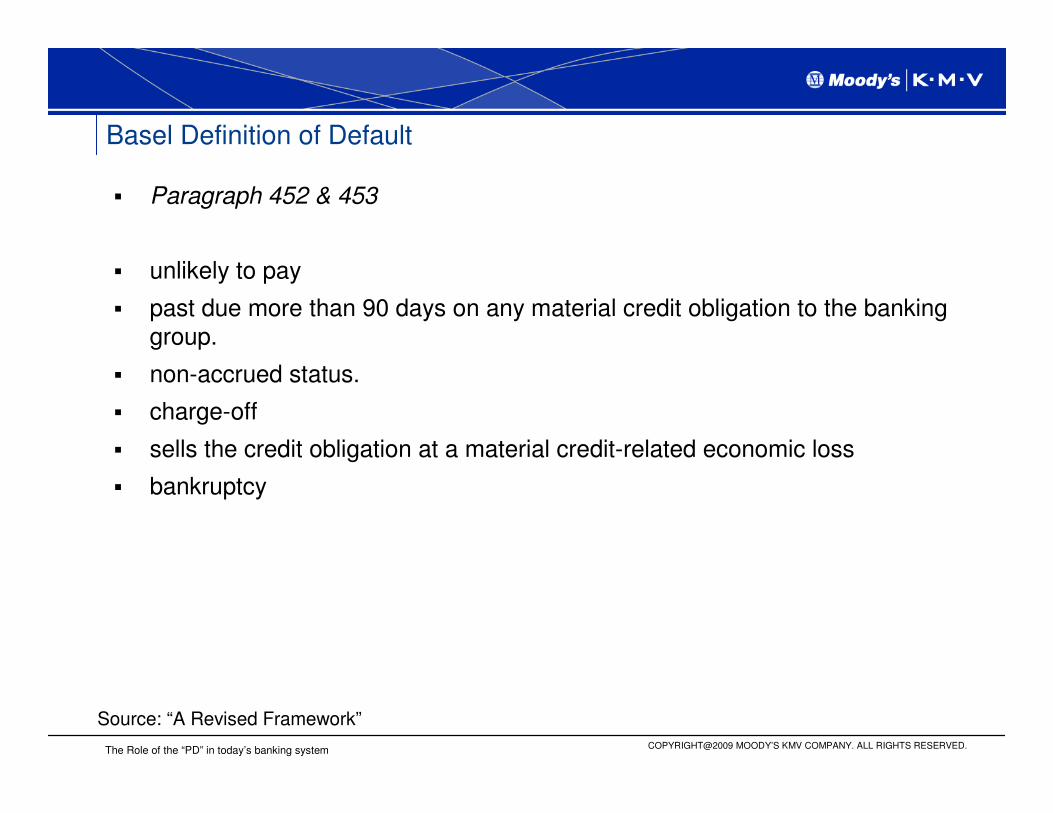
Basel Definition of Default
� Paragraph 452 & 453
� unlikely to pay
� past due more than 90 days on any material credit obligation to the banking group.
� non-accrued status.
� charge-off
� sells the credit obligation at a material credit-related economic loss
� bankruptcy
Source: “A Revised Framework”
COPYRIGHT@2009 MOODY’S KMV COMPANY. ALL RIGHTS RESERVED.The Role of the “PD” in today’s banking system
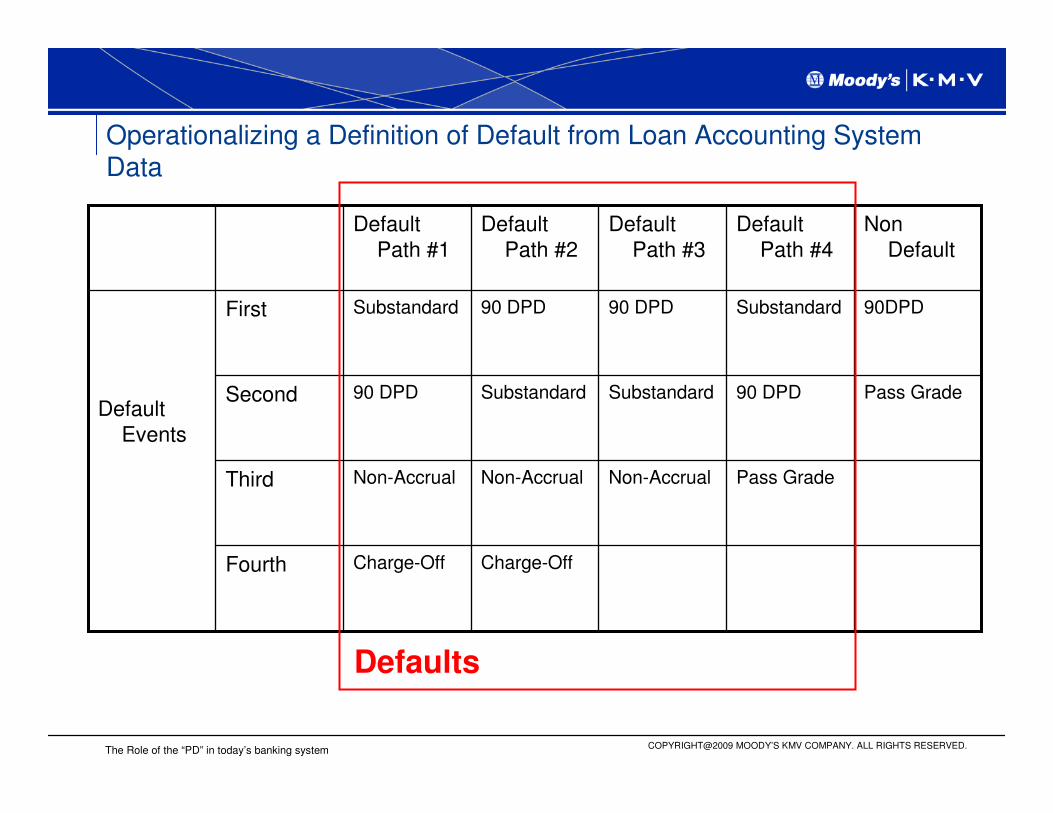
Operationalizing a Definition of Default from Loan Accounting System Data
Default Events
Non Default
Default Path #4
Default Path #3
Default Path #2
Default Path #1
Fourth
Third
Second
First
Charge-OffCharge-Off
Pass GradeNon-AccrualNon-AccrualNon-Accrual
Pass Grade90 DPDSubstandardSubstandard90 DPD
90DPDSubstandard90 DPD90 DPDSubstandard
Defaults

4 Evaluating the level of the PD for Small and Medium Sized Enterprises

COPYRIGHT@2009 MOODY’S KMV COMPANY. ALL RIGHTS RESERVED.The Role of the “PD” in today’s banking system
Level Validation of Private Firm Default Prediction Models has Been Challenging
� Typically based on financial statements and default information drawn from separate sources
� Default information is often based either on bankruptcy or reconstructed after the fact and, hence, incomplete
� Financial statements may not actually have debt outstanding associated with them
� Models are calibrated to a ‘Central Default Tendency’
COPYRIGHT@2009 MOODY’S KMV COMPANY. ALL RIGHTS RESERVED.The Role of the “PD” in today’s banking system
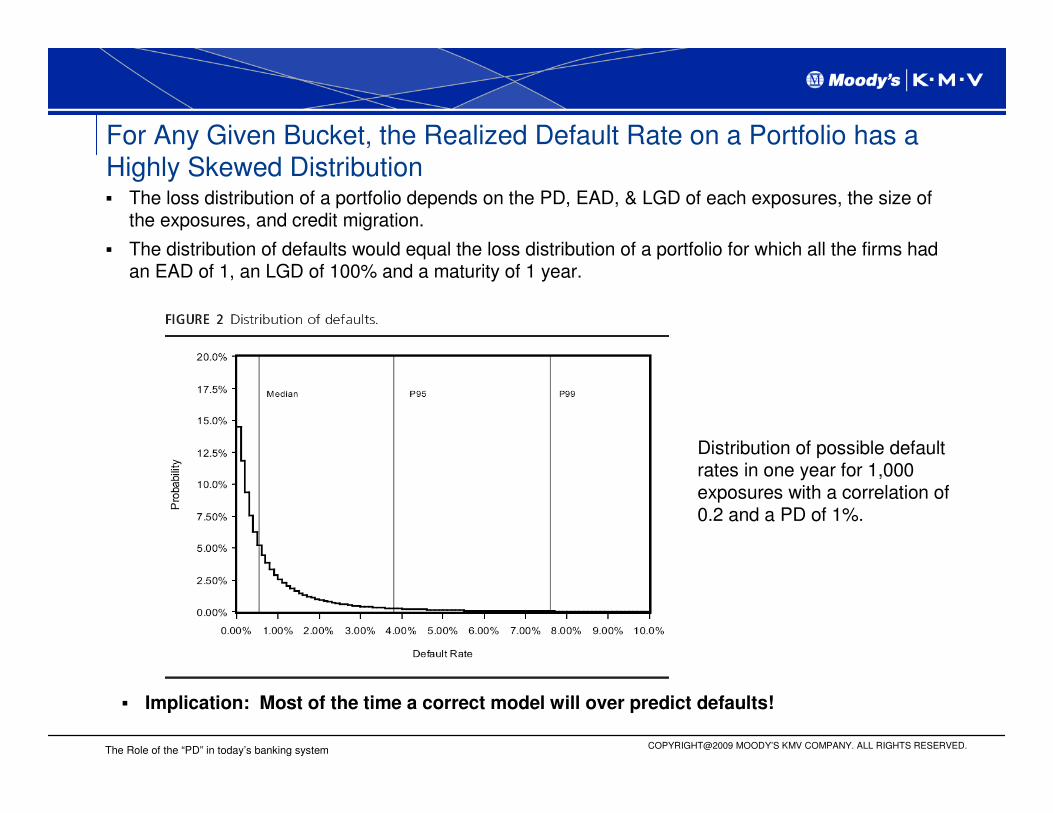
For Any Given Bucket, the Realized Default Rate on a Portfolio has a Highly Skewed Distribution� The loss distribution of a portfolio depends on the PD, EAD, & LGD of each exposures, the size of
the exposures, and credit migration.
� The distribution of defaults would equal the loss distribution of a portfolio for which all the firms had an EAD of 1, an LGD of 100% and a maturity of 1 year.
Distribution of possible default rates in one year for 1,000 exposures with a correlation of 0.2 and a PD of 1%.
� Implication: Most of the time a correct model will over predict defaults!
COPYRIGHT@2009 MOODY’S KMV COMPANY. ALL RIGHTS RESERVED.The Role of the “PD” in today’s banking system
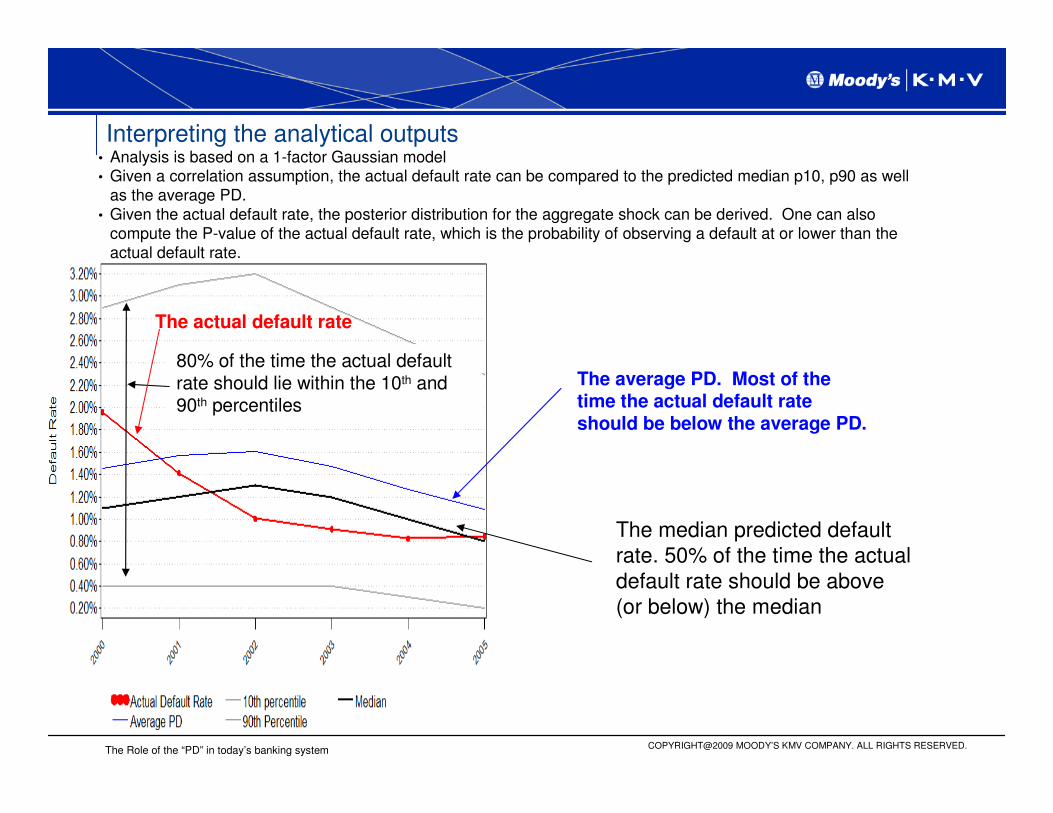
Interpreting the analytical outputs
80% of the time the actual default rate should lie within the 10th and 90th percentiles
The median predicted default rate. 50% of the time the actual default rate should be above (or below) the median
The average PD. Most of the time the actual default rate should be below the average PD.
• Analysis is based on a 1-factor Gaussian model• Given a correlation assumption, the actual default rate can be compared to the predicted median p10, p90 as well
as the average PD.• Given the actual default rate, the posterior distribution for the aggregate shock can be derived. One can also
compute the P-value of the actual default rate, which is the probability of observing a default at or lower than the actual default rate.
The actual default rate
COPYRIGHT@2009 MOODY’S KMV COMPANY. ALL RIGHTS RESERVED.The Role of the “PD” in today’s banking system
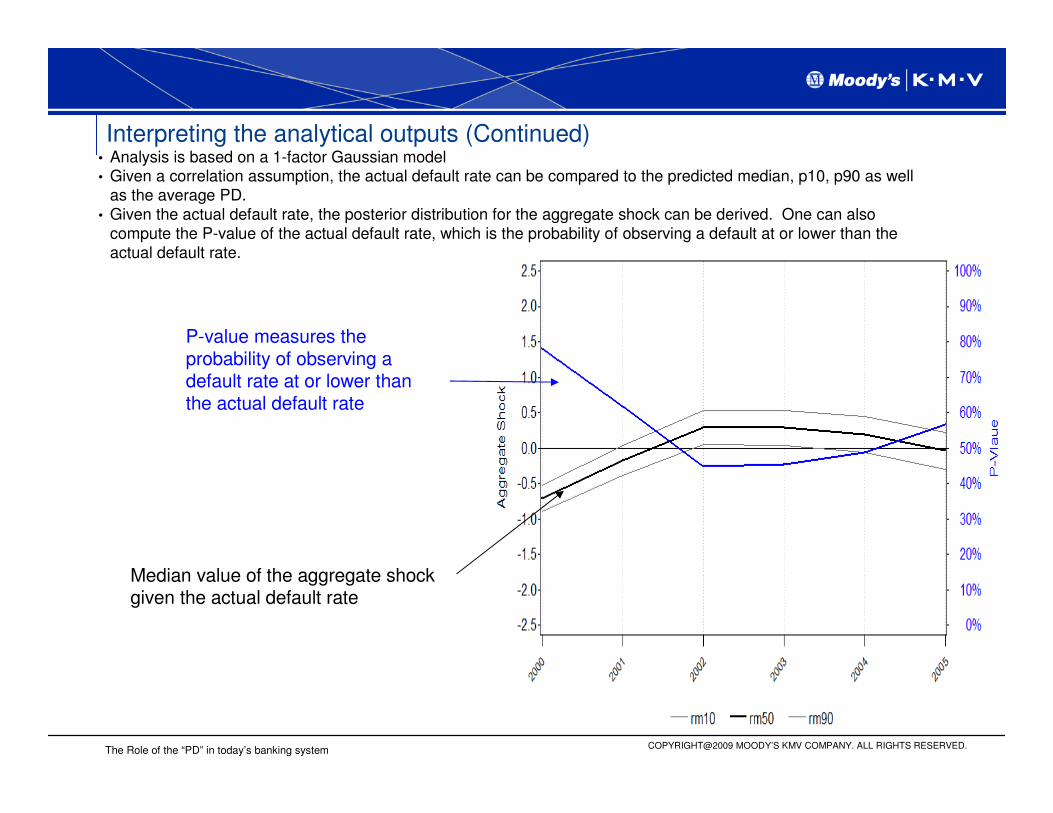
Interpreting the analytical outputs (Continued)
P-value measures the probability of observing a default rate at or lower than the actual default rate
Median value of the aggregate shock given the actual default rate
• Analysis is based on a 1-factor Gaussian model• Given a correlation assumption, the actual default rate can be compared to the predicted median, p10, p90 as well
as the average PD.• Given the actual default rate, the posterior distribution for the aggregate shock can be derived. One can also
compute the P-value of the actual default rate, which is the probability of observing a default at or lower than the actual default rate.

COPYRIGHT@2009 MOODY’S KMV COMPANY. ALL RIGHTS RESERVED.The Role of the “PD” in today’s banking system
Assume Rho=0
Actual Default Rate 10th percentile MedianAverage PD 90th Percentile
De
fau
lt R
ate
0.90%
1.00%
1.10%
1.20%
1.30%
1.40%
1.50%
1.60%
1.70%
1.80%
1.90%
2.00%
2.10%
2.20%
2.30%
2.40%
2.50%
2.60%
2.70%
2.80%
2.90%
3.00%
3.10%
3.20%
3.30%
2000
2001
2002
2003
2004
2005
2006
PLOT RM10 RM50 RM90
Ag
gre
ga
te S
ho
ck
-2.5
-2.0
-1.5
-1.0
-0.5
0.0
0.5
1.0
1.5
2.0
2.5
STMT_YEAR
2000 2001 2002 2003 2004 2005 2006
P-V
alu
e
0%
10%
20%
30%
40%
50%
60%
70%
80%
90%
100%
COPYRIGHT@2009 MOODY’S KMV COMPANY. ALL RIGHTS RESERVED.The Role of the “PD” in today’s banking system
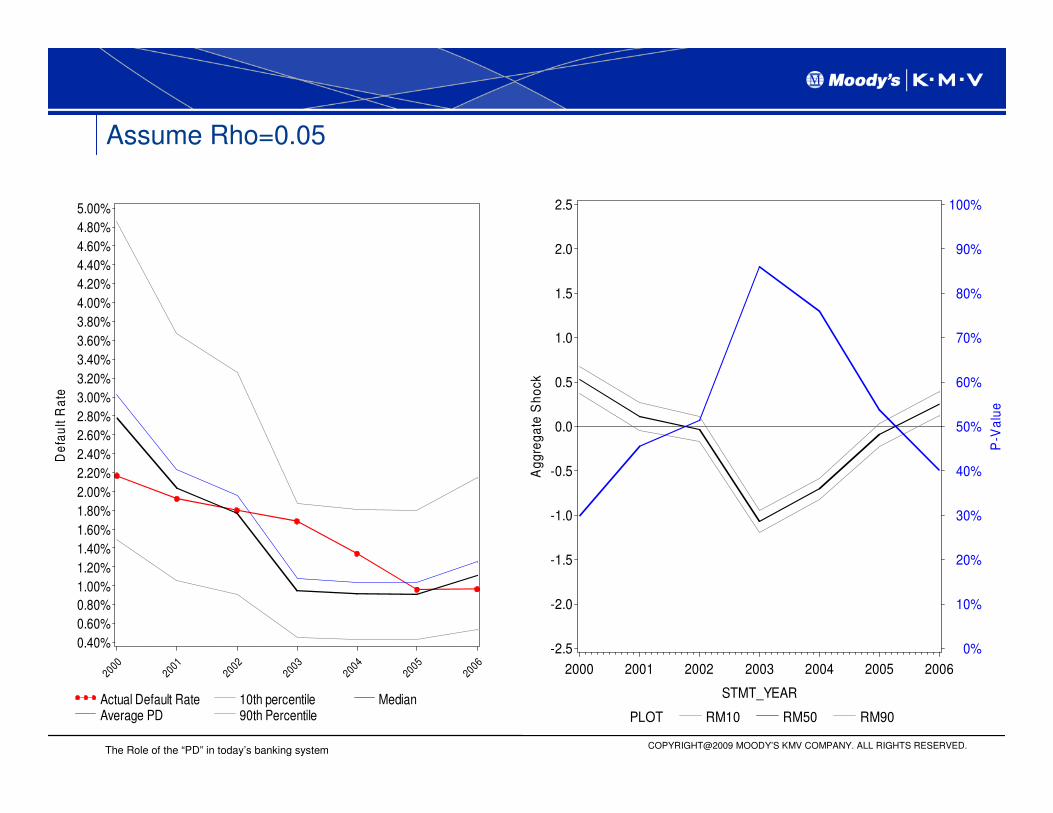
Assume Rho=0.05
Actual Default Rate 10th percentile MedianAverage PD 90th Percentile
De
fau
lt R
ate
0.40%
0.60%
0.80%
1.00%
1.20%
1.40%
1.60%
1.80%
2.00%
2.20%
2.40%
2.60%
2.80%
3.00%
3.20%
3.40%
3.60%
3.80%
4.00%
4.20%
4.40%
4.60%
4.80%
5.00%
2000
2001
2002
2003
2004
2005
2006
PLOT RM10 RM50 RM90
Ag
gre
ga
te S
ho
ck
-2.5
-2.0
-1.5
-1.0
-0.5
0.0
0.5
1.0
1.5
2.0
2.5
STMT_YEAR
2000 2001 2002 2003 2004 2005 2006
P-V
alu
e
0%
10%
20%
30%
40%
50%
60%
70%
80%
90%
100%
COPYRIGHT@2009 MOODY’S KMV COMPANY. ALL RIGHTS RESERVED.The Role of the “PD” in today’s banking system
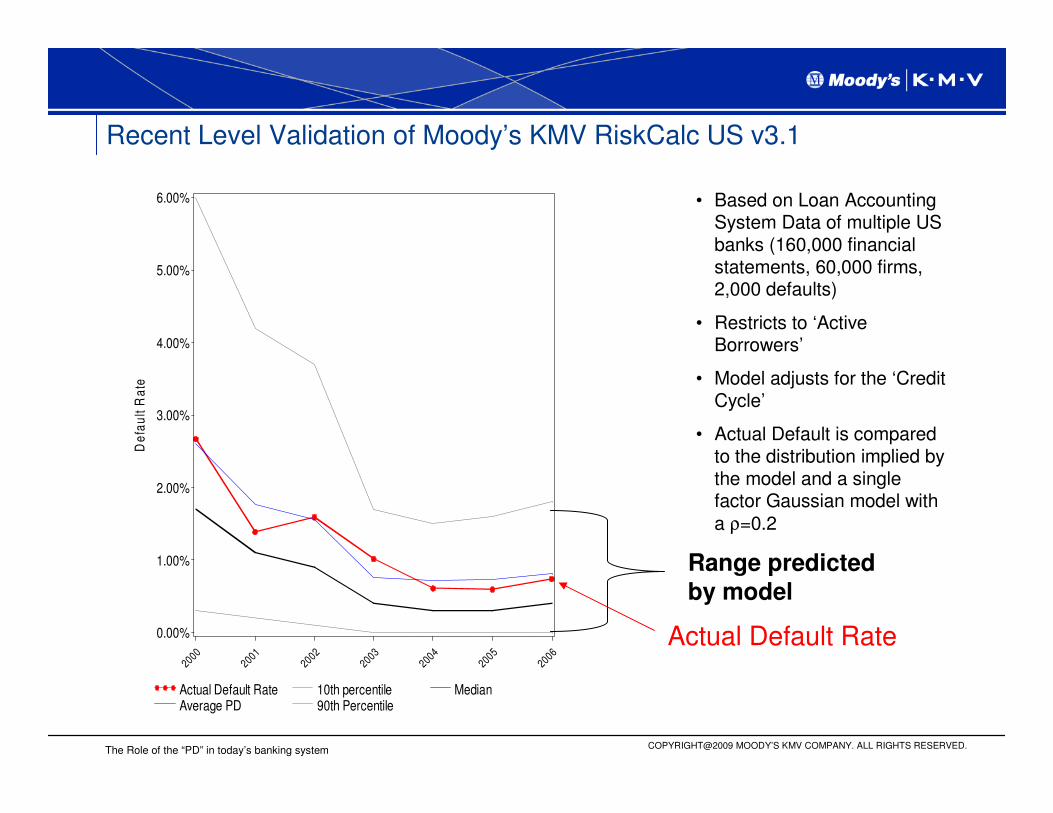
Recent Level Validation of Moody’s KMV RiskCalc US v3.1
Actual Default Rate 10th percentile MedianAverage PD 90th Percentile
De
fau
lt R
ate
0.00%
1.00%
2.00%
3.00%
4.00%
5.00%
6.00%
2000
2001
2002
2003
2004
2005
2006
• Based on Loan Accounting System Data of multiple US banks (160,000 financial statements, 60,000 firms, 2,000 defaults)
• Restricts to ‘Active Borrowers’
• Model adjusts for the ‘Credit Cycle’
• Actual Default is compared to the distribution implied by the model and a single factor Gaussian model with a ρ=0.2
Range predicted
by model
Actual Default Rate

COPYRIGHT@2009 MOODY’S KMV COMPANY. ALL RIGHTS RESERVED.The Role of the “PD” in today’s banking system
Observed Default Rate can be Compared to Charge-Offs and Delinquency Rates
Source: http://www.federalreserve.gov/releases/Thru second quarter of 2008Commercial and Industrial LoansCharge-Offs implied PD is computed assuming an LGD of 40%
0
1
2
3
4
5
6
7
Ja
n- 8
7J
an
- 88
Ja
n- 8
9J
an
- 90
Ja
n- 9
1J
an
- 92
Ja
n-9
3J
an
-94
Ja
n- 9
5J
an
- 96
Ja
n- 9
7J
an
- 98
Ja
n- 9
9J
an
-00
Ja
n-0
1J
an
-02
Ja
n- 0
3J
an
- 04
Ja
n- 0
5J
an
- 06
Ja
n- 0
7J
an
-08
%
Charge-Offs implied PD
Delinquency Rate

5 Conclusion
COPYRIGHT@2009 MOODY’S KMV COMPANY. ALL RIGHTS RESERVED.The Role of the “PD” in today’s banking system
Conclusion
� The loss distribution of a portfolio depends on the PD, EAD, LGD and size of the exposures in it as well as the number of exposures in the portfolio and the degree of systematic risk between them, as well as other risk factors
� Avoiding bank failures will require better measurement of all these portfolio features
� We may have made the most progress with respect to the determining the PD, but it is still challenging
� We are using the term PD in multiple ways which is creating some confusion
COPYRIGHT@2009 MOODY’S KMV COMPANY. ALL RIGHTS RESERVED.The Role of the “PD” in today’s banking system
Further Reading
Arora, Navneet, Jeffery Bohn, and Irina Korablev, “Power and Level Validation of the EDF™Credit Measure in the U.S. Market,” Moody’s KMV, 2005a.
Basel Committee on Banking Supervision, “International Convergence of Capital Measurement and Capital Standards (‘A Revised Framework’),” Bank for International Settlements, 2004.
Basel Committee on Banking Supervision, “An Explanatory Note on the Basel II IRB Risk Weight Functions,” Bank for International Settlements, 2005.
Basel Committee on Banking Supervision, “Bank Failures in Mature Economies,” Working Paper No.13, April 2004.
Dwyer, Douglas, (2007) “The Distribution of Defaults and Bayesian Model Validation," Journal of
Risk Model Validation, Volume 1, No 1
Dwyer, Douglas and Irina Korablev, (2007) “Power and Level Validation of Moody’s KMV EDF™Credit Measures in North America, Europe and Asia”, Moody’s KMV, 2007
Kealhofer, Stephen, “Quantifying Credit Risk I : Default Prediction.” Financial Analysts Journal, January/February2003, 30–44, 2003a
Kurbat, Matthew and Irina Korablev, (2002) “Methodology for Testing the Level of the EDFTM
Credit Measure,” Moody’s KMV.
Lopez, Jose A., “The Empirical Relationship Between Average Asset Correlation, Firm Probability of Default, and Asset Size,” Federal Reserve Bank of San Francisco, Working Paper 2002–2005, 2002.