The role of South Africa’s freight rail regulatory ... Event… · The underperformance has also...
30
The role of South Africa’s freight rail regulatory framework in General Freight’s sluggish growth performance Basani Baloyi 1 1. Introduction Over the last two decades, the country has witnessed an exodus in general freight from rail to road. Many explanations have been put forward to account for the switch: rail’s technological redundancy [see Marsay, 2005] (however this is countered by the rail renaissance witnessed in North America in the 1980s and 1990s); freight road’s dominance as a result of the deregulation of transport [see Van der Mescht, 2006]; the lack of investments in freight rail [see Perkins, Feddeker and Luiz, 2005] and institutional or governance weaknesses [see Thompson, 2009]. Each of these explanations, aside from rail’s technological backwardness, is valid and related. Indeed the deregulation of the freight road mode increased intermodal competition and saw to an increasing shift in general freight from rail to road, however the switch, particularly in commodities for which rail is competitive, was exacerbated by the state’s decision to cut investments for over a thirty year period. Therefore the mass switch from rail to road at least in certain market segments is not unavoidable and the growth in rail’s share can contribute to a competitive and efficient logistics system, which currently stands at 12 percent of GDP (CSIR, 2012). Indeed Transnet Freight Rail’s (TFR’s) drive to recapture some lost market share through its six year capital expenditure programme demonstrates that there is scope for general freight to be moved on rail in certain market segments. However, these investments have not had the desired impact on the country’s freight volumes as these have declined at a compound average growth of 0.2 percent in the last decade. The paper will contribute to unpacking the reason’s for failure by examining the regulatory regime’s impact on TFR’s investment decisions. This will be done by analysing the regulatory regime and its influence on TFR’s investment strategy (section 3); followed by a critical evaluation of the outcomes at the macro- level (section 4) and then at the sectoral level through case study analysis (section 5). The paper will show that the sluggishness in Transnet’s General Freight Business (GFB) volumes is due in part to the fact that the current macro-level performance based regulatory framework has encouraged a constrained investment environment that biases private rates of return rather than social rates of return inherent in TFR’s key-commodity key-corridor strategy. The paper will also demonstrate that the regulatory framework’s focus on macro-level performance rather than addressing disputes at the micro or sectoral level has created a power vacuum that may have been exploited by certain vested interests that have always benefited from freight provision and may continue to do so unduly at the expense of other general freight users. There is a push by the state to solve these challenges through an economic regulator (section 6). The paper will argue, however, that economic regulation under a constrained investment environment is not the panacea that will resolve the problem of GFB underperformance. A real financial commitment by the state is required to transform the network inefficiencies that structurally constrain the operational efficiencies within rail that inform the sluggishness in 1 Centre for Competition, Regulation and Economic Development, University of Johannesburg
Transcript of The role of South Africa’s freight rail regulatory ... Event… · The underperformance has also...

The role of South Africa’s freight rail regulatory framework in
General Freight’s sluggish growth performance
Basani Baloyi1
1. Introduction
Over the last two decades, the country has witnessed an exodus in general freight from rail to
road. Many explanations have been put forward to account for the switch: rail’s technological
redundancy [see Marsay, 2005] (however this is countered by the rail renaissance witnessed
in North America in the 1980s and 1990s); freight road’s dominance as a result of the
deregulation of transport [see Van der Mescht, 2006]; the lack of investments in freight rail
[see Perkins, Feddeker and Luiz, 2005] and institutional or governance weaknesses [see
Thompson, 2009]. Each of these explanations, aside from rail’s technological backwardness,
is valid and related. Indeed the deregulation of the freight road mode increased intermodal
competition and saw to an increasing shift in general freight from rail to road, however the
switch, particularly in commodities for which rail is competitive, was exacerbated by the state’s
decision to cut investments for over a thirty year period. Therefore the mass switch from rail
to road at least in certain market segments is not unavoidable and the growth in rail’s share
can contribute to a competitive and efficient logistics system, which currently stands at 12
percent of GDP (CSIR, 2012).
Indeed Transnet Freight Rail’s (TFR’s) drive to recapture some lost market share through its
six year capital expenditure programme demonstrates that there is scope for general freight
to be moved on rail in certain market segments. However, these investments have not had
the desired impact on the country’s freight volumes as these have declined at a compound
average growth of 0.2 percent in the last decade. The paper will contribute to unpacking the
reason’s for failure by examining the regulatory regime’s impact on TFR’s investment
decisions. This will be done by analysing the regulatory regime and its influence on TFR’s
investment strategy (section 3); followed by a critical evaluation of the outcomes at the macro-
level (section 4) and then at the sectoral level through case study analysis (section 5). The
paper will show that the sluggishness in Transnet’s General Freight Business (GFB) volumes
is due in part to the fact that the current macro-level performance based regulatory framework
has encouraged a constrained investment environment that biases private rates of return
rather than social rates of return inherent in TFR’s key-commodity key-corridor strategy. The
paper will also demonstrate that the regulatory framework’s focus on macro-level performance
rather than addressing disputes at the micro or sectoral level has created a power vacuum
that may have been exploited by certain vested interests that have always benefited from
freight provision and may continue to do so unduly at the expense of other general freight
users.
There is a push by the state to solve these challenges through an economic regulator (section
6). The paper will argue, however, that economic regulation under a constrained investment
environment is not the panacea that will resolve the problem of GFB underperformance. A real
financial commitment by the state is required to transform the network inefficiencies that
structurally constrain the operational efficiencies within rail that inform the sluggishness in
1 Centre for Competition, Regulation and Economic Development, University of Johannesburg

2
GFB volumes. First, we turn to assessing South Africa’s freight rail performance relative to
other freight rail economies (section 2).
2. Global perspective: relative performance and common regulatory features
Contextualising South Africa’s freight rail performance within a global setting is made difficult
by the fact that each country is characterised by unique structural features that determine
performance. Some of these features include the country’s regulatory regime, the underlying
network technology, distances and climate. Notwithstanding this important caveat, the section
will compare South Africa’s freight rail performance with that of other leading freight rail
economies, namely the US, Canada, Russia, China, India and Australia. It will then describe
the common features of a regulated freight rail network to determine South Africa’s place in
the regulatory continuum.
South Africa has the largest freight rail market on the continent and can be classified as a
freight rail economy given the relative size of its freight rail business (Figure 1). The country’s
freight densities (measured by freight tonne/km), staff productivity and train performance are
competitive considering the size of the country’s freight rail market (Table 1). However, the
country’s freight rail system has underperformed in other areas. Annual tonnage performance
has declined by 0.2 percent while comparator countries have experienced growth (Table 1).
Growth in China, Russia and Australia is linked to the 2000s commodities super cycle, North
America’s (Canada and US) stagnant growth was preceded by a period of rapid growth
between 1980s-1990s after regulatory reform, while the EU’s small freight rail market has
been growing thanks to Germany’s strong performance.
Figure 1. Country comparison of size of freight business
Source: www.worldmapper.org

3
Thompson (2009) argues that the country’s freight densities are a reflection of two of the
country’s most efficient lines rather than a reflection of the operational efficiencies of its whole
entire freight rail system. The Coalex and Orex lines operate along ‘6.7 percent of the entire
[22,300] line km track, but generate 56 percent of tonnage and 60 percent of the tonne
km’(Thompson, 2009:9).
Table 1. Country comparison of freight rail performance
Train Performance Volume Performance Gauge
Country Train km
(millions)
2011
Tonne/km
(millions)
2011
Mt
2011
10 yr
CARG %
2001-
2011
Freight
tonne/km
2011
Cape
Gauge
1000-
1067mm
Standard
Gauge
1435-
1520mm
Staff
Productivit
y
2011
US 794 4,495,196 1,710 0.7 2,254,585 218,554 15,935
China 1,824 4,198,054 3,184 12.1 2,562,635 72,404 1,255
Russia 1,473 4,043,783 1381 3.1 2,127,832 86,660 2,320
India 1,022 1,445,869 922 6.9 625,723 14,024 471
Canada 155 646,824 310 0.3 254,069 66,828 7,933
SA 60 170,083 182.1 - 0.2 113,342 22,300 4,722
EU 4,260 1,226,818 1283 3.6 326,429 297
Germany 978 392,883 412 4.1 111,980 45,991 397
Australia 29 101,956 242 5.2 59,649 18,988 16,042 6,627
Source: www.uic.org
The freight rail system’s underperformance is linked to investment cuts over the last three
decades and the growth in the use of road transportation after the deregulation of the country’s
freight road mode. The investment strike was particularly devastating to South Africa’s freight
rail business given the deficiencies in its underlying network technology as discussed in
section 5. Investments into North America’s freight rail system have introduced a standardised
and a simple network that have boosted performance (see Railkonsult, 2012).
The underperformance has also been linked to weaknesses in the regulatory regime (see
Thompson, 2009). The freight rail network is owned and operated by a single corporatised
unregulated state monopoly, Transnet Freight Rail (TFR). TFR’s corporatisation was part of a
global network infrastructure privatisation agenda emerging in the 1980s. The anticipated
outcomes of that agenda (i.e. high output, better services, competitive pricing) were not
realised and in the 1990s a new set of reforms emerged globally, focusing on regulating the
conduct of both state and privatised network infrastructure. Although there has been a push
for economic regulation for the country’s freight rail system, this has not been achieved.
Illustrated in table 2 are the common features of a regulated freight rail network and the
features that the selected countries possess. South Africa’s regulatory regime can be
characterised as performance based, as the rules merely monitor key performance areas as

4
set out by TFR’s shareholder and TFR (see section 3). The other countries operate on a more
formalised rules-based regulatory system with legislated economic regulators that possess
investigative and enforcement powers operating within a dispute settlement process. The
degree of the rules-based system varies considerably across countries. At one extreme is the
US’s minimal regulatory regime, while at the other is Australia’s high-level regulatory regime.
The current US regulatory environment was set up in response to the 1970s railroad
bankruptcies during a period of heavy regulation (see Cramer, 2007). The reform process
stripped down regulations over prices, labour, mergers and acquisition towards a model that
fosters commercial decision-making through commercial contracts (Drew, np: 35). However,
the regime has a dispute settlement process wherein disputes over pricing, service and access
are heard and settled by the regulator (see Cramer, 2007). The burden of proof lies with the
complainant and a maximum price is instituted if the railroad is found guilty of excessive pricing
(Drew, np: 35). The system is characterised by minimal regulation out of a thinking that there
is a significant amount of rivalry induced by the competitive market structure (see Drew,
np:35). Therefore the rules are mostly focused on regulating mergers and acquisition to ensure
that rivalry is maintained (Drew, np:35). The Canadian regulatory system also encourages
commercial decision-making, but it perhaps has more rules on access and service provision
as the market structure is duopolistic (see Padova, 2007). Australia has different regulatory
regimes across the states and is more regulated than the US and Canadian systems with
regards to price, access and investment rules (see Queensland Government, 2010).
Generally, commercial decisions are supported within the bounds of regulation. For instance,
the regulator of Western Australia sets a price band within which contracts are negotiated, in
Queensland, the seeker applies to the owner for access, the owner provides indicative
capacity assessment within 30 days, parties negotiate and an agreement is brokered, and if
there is no capacity then the owner is required to provide the cost of expanding the work (see
Queensland Government, 2010).
Table 2. Country comparison of regulatory regime
Level of
regulation
Ownership
Structure
Regulatory
independence
Rules: pricing,
investment,
access
Macro
performance
Monitoring: KPIs
Micro
performance
monitoring:
Dispute
Settlement
Investigative,
enforcement and
decision making
legislation
Cana
da
Medium Privatised, vertically
integrated Duopoly
✔ ✔ ✗ ✔ ✔
USA Minimal Private, vertically
integrated 4 main
companies
✔ ✓ ✗ ✔ ✔
Aus High Private and public
vertical separation
✔ ✔ ✔ ✔ ✔
SA N/A Corporatised
Vertically Integrated
monopoly
✗ ✗ ✔ ✗ ✗
Source: Author’s construction

5
3. South African perspective: regulatory regime, policy and Transnet strategy
The previous section argued that one of the characteristic features of South Africa’s regulatory
regime is that it is only empowered to fulfil a performance-monitoring role at the macro-level.
This section aims to provide further details about the actors and mechanics involved in South
Africa’s regulatory regime and how the regulatory regime influences Transnet’s corporate
strategy.
3.1. Fleshing out South Africa’s regulatory regime
In the main, there are three important actors that form part of South Africa’s freight rail
regulatory: the Department of Transport, the Department of Public Enterprises and the Railway
Safety Regulator. The Regulator is empowered by the National Railway Safety Regulator Act
of 2002 to oversee the safety and functioning of the country’s railway network by providing
safety standards and ‘regulatory practices for the protection of persons, property and the
environment’ (Department of Transport, 2012). The Department of Transport is responsible
for developing transport policy and exercises oversight on several rail related Acts
(Department of Transport, 2012). The most notable acts are: the various Acts from the 1970s
that ordered the construction of dedicated railway lines and ports for the export of iron ore and
coal; the Legal Succession Act of 1989, which corporatised what is today called Transnet; the
Transport Deregulation Act of 1988, which deregulated freight road transportation; and the
National Railway Safety Regulator Act of 2002, which established the safety regulator.
The Department of Public Enterprises is essentially TFR’s de facto quasi-regulator. This
informal role is given by its formal role as shareholder in terms of the Public Finance
Management Act (PFMA). As shareholder, the Department of Public Enterprises’ mandate is
to ensure the financial viability of its state-owned enterprises (SOEs) and to align their
operations with government policy (Department of Public Enterprises, 2011). Therefore the
Act narrowly defines the Department of Public Enterprises’ regulatory responsibility within the
arena of performance monitoring.
This performance-based regulatory regime is meted out through various provisions in the Act
that oblige SOEs to engage in agreements with the shareholder and to make certain
submissions to the shareholder for approval that effectively act as performance monitoring
instruments (Presidency, 2012). More specifically, the SOE is obliged to submit corporate
plans, revenue projections, expenditure and borrowing plans to the shareholder for approval.
Treasury Regulation 29.1 specifies the types of corporate plans that the SOE must submit to
the shareholder; and importantly, the PFMA obligates the shareholder and its SOEs to enter
into an annually negotiated shareholder compact (Presidency, 2012). The shareholder
compact is an agreement that regulates the relationship between the SOE and its shareholder,
sets out the key performance areas with which the SOE must comply, and the reporting
procedures for performance monitoring (Presidency, 2012).
Stakeholder interviews with the Department of Public Enterprises and TFR representatives
corroborate that the shareholder compact is the most important control mechanism that
regulates TFR’s actions. The regulatory regime is rewards and punishment based. It rewards
‘good performance’ (i.e. meeting and exceeding KPIs in shareholder compact) by distributing
bonuses and may punish bad behaviour by changing the SOE’s board of directors. However,
stakeholder interviews clearly demonstrate that the shareholder compact is used to effect the

6
Department of Public Enterprises’ formalised shareholder responsibilities rather than its de
facto quasi-regulator assumed responsibilities. This is due to the fact that the compact is a
negotiated process, therefore TFR has the room to manoeuvre such that it negotiates terms
that it can commit to. Second, punishments for poor performance do not go far as there is an
appreciation of TFR’s task and thus it is not in the shareholder’s interest to ‘whip the business’.
Corrective actions are also made difficult by the fact that the quasi-regulator’s primary and
only relationship is with TFR as there is no formal dispute settlement process in which the
quasi-regulator can arbitrate disputes between TFR and its customers.
3.2. South Africa’s regulatory regime’s interpretation of overarching policy
frameworks
The regulatory regime’s performance monitoring is not only guided by the formal rules that
govern its relationship with TFR, but is also guided by an overarching policy framework that
governs the freight rail network. The section will outline how the policy framework has evolved
since the 1980s and how it has been interpreted by the departments of public enterprises and
transport in their formulation of policies and strategies for the country’s freight rail network.
The evolution of the overarching policy framework for the country’s freight rail network in the
last three decades is distinguished by two policy phases. The first phase, beginning in the
1980s and lasting until the early 2000s, spearheaded the privatisation and deregulation
agenda (Table 3). It was believed that deregulation and the privatisation of infrastructure
provision would create a competitive infrastructure network while at the same time ensuring
economic growth and stability through restoring fiscal balance (Table 3). In the 1980s, the
deregulation and privatisation agenda began with a decision by the De Villiers commission
report in 1986 to stop investments in infrastructure and to corporatise Transnet. The
deregulation of freight road service provision came into effect in 1988, and Transnet’s
corporatisation came into effect in 1989. The Growth and Economic Redistribution (GEAR)
policy of 1996 continued to deepen the privatisation agenda.
The privatisation agenda influenced how the Department of Transport (in its transport policy)
and the Department of Public Enterprises (in its shareholding responsibility) characterised
Transnet’s strategic value. The Department of Transport’s position held in various policies
championed the idea of TFR’s privatisation, as it believed that this would build a competitive
intermodal system (Table 3). Moreover, the department believed that such a system would
increase freight rails land freight market share by increasing output and investment, improving
service delivery and competitive pricing (Table 3). This would serve the microeconomic policy
objectives of the development of a competitive logistics system for exportables.
The Department of Public Enterprises introduced the SOE Restructuring Framework in 1999
with the strategic aim of maximising shareholder value by attracting private investment where
possible and ensuring that SOE operations emulate competitive private firm operations
(Department of Public Enterprises, 1999). The first priority was to restructure Transnet’s
Pension Fund debt to restore profitability in the business. The second was to restore the
profitability of the GFB that had been benefiting from cross subsidies from the profitable
Coalex and Orex lines (Department of Public Enterprises, 1999). The eventual removal of
cross subsidies was viewed as critical as subsidies placed the long-term viability of the Coalex
and Orex operations in jeopardy (Department of Public Enterprises, 1999). This would be done

7
through corporatization and the introduction of private capital into the GFB and the
concessioning of the export ore lines (Department of Public Enterprises, 1999).
Table 3. Interaction between overarching economic policy and regulatory regime
Macroeconomic
Policy
Microeconomic
Policy
Department of
Transport
Department of Public
Enterprises
Phase 1:
1980s
early
2000s
Deregulation and
Privatisation of
SOEs
Policy:
Gear (1996)
Competitive
logistics for
exportables
Aim: seamless &
competitive intermodal
transport system,
boost general freight
Investments, End
competitive market,
Interim economic
regulator
Policies
White Paper on
National Transport
(1996)
Moving South Africa
(1998)
National Freight
Logistics Strategic
Framework (2005)
Privatise to max shareholder
value & operational eff
Policy:
Policy Framework for an
accelerated agenda for the
restructuring of State-owned
enterprises
Phase 2:
mid 2000s
until
present
Capital Expenditure
for jobs and
economic growth
Policy
Asgisa (2006)
Competitive
logistics for value
added goods,
SOE buying
power for BEE
and industrial
development
Policy:
NIPF (2007)
Max SOE developmental
impact through procurement
& investment
Less B/S financing to boost
investment, especially GFB
intermodality
Policy:
Strategic Plan 2012-2017
Source: Author’s construction
Towards the end of the 2000s, the policy environment entered into a new phase in which the
envisioned strategic value of SOEs captured in certain policies began to shift towards a more
developmental role – similar to that played by SOEs in East Asia. East Asian SOEs had a
broader mandate that included capital expenditure programmes that were used for job creation
and leveraged to build a domestic industrial base. The shift towards leveraging the capex
programme for job creation and the development of domestic industrial capabilities was
captured in various policy documents: the Presidency’s Accelerated Shared Growth Initiative
for South Africa (2006), the Department of Trade and Industry’s National Industrial Policy
Framework (2007) and its iterative Industrial Policy Action Plans, the Department of Public
Enterprises’ Competitiveness Supplier Development Programme and its five-year Strategic
Framework (2012-2016), the Department of Economic Development’s (2010) New Growth
Path and the African National Congress’s Economic Transformation document on
Development Finance Institutions and SOEs (2012).
A second policy thrust that some of these policies strongly emphasised was the development
of a competitive transport network that served value-added goods. Creating greater linkages
between the transport network and value-added goods was given emphasis in the Department
of Trade and Industry’s NIPF and the iterative IPAPs; the Department of Public Enterprises’
strategic framework and the Economic Development Department’s National Growth Plan.

8
3.3. The influence of South Africa’s regulatory regime on Transnet’s
corporate strategy
Having outlined the form and policy framework to which the regulatory regime has been
designated to subscribe, the discussion now turns to how this has influenced Transnet’s and
specifically TFR’s corporate strategy. The discussion is limited to the period at the start of the
second policy phase, where remnants of the first policy phase were still at play and there was
growing awareness of SOEs’ strategic value as instruments of development.
The interplay between the privatisation agenda and developmental approach is evident at
varying degrees throughout Transnet’s restructuring journey. The market focus was
particularly strong in the four-point Turnaround Plan (2005-2007) that aimed to reposition the
SOE into a competitive and profitable freight logistics company. The shareholder compact
negotiated between the Department of Public Enterprises and Transnet focused on stabilising
the SOE’s finances (Figure 1). This was reflected in the design of the KPIs, which primarily
focused on restructuring the balance sheet. The indicators included gearing below 50 percent,
cash interest cover and profitability ratios (Figure 1). Investment targets were also set,
although the amount was considerably limited due to the investment backlog. Given these
performance criteria Transnet strategised to drive profitability by reducing the pension debt
burden, and privatised what it saw as non-core assets to focus on the business in logistics
operations (Ramos, 2007).

9
Figure 1. Shareholder compact negotiated corporate strategy
Source: Transnet annual reports (2006-2012)
Figure 1 shows that: having strengthened its financial position, both shareholder and Transnet
focused on leveraging the balance sheet to grow the business; the KPI design was improved
with each successive corporate plan (the Growth Strategy (2008-09), the Quantum Leap
(2010-11) and the Market Demand Strategy (2012-present)); targets were set at the divisional
rather than group levels and investment targets were increased and mostly aimed at TFR’s
GFB; and to attract GFB customers, KPIs became focused on improving
productivity/operational efficiency and service delivery, while financial performance KPIs were
maintained.
Given that investments have been a critical part of Transnet’s strategy to grow the volumes in
the GFB, which has been for the most a loss-making operation, it becomes critical to
investigate Transnet’s investment financing strategy. What the investigation essentially
reveals is a constrained investment environment. Figure 2 shows Transnet’s investment
financing strategy, its proposed investment allocations and the intended outcome. It is clear
R31.5b
2005-7
R34.8b
2008-9
R54.6b
2010-11
R194.4b
2012-
present
Turnaround KPI Gearing,
Profitability, Investment
Rev: Vol > Price
Growth KPI Gearing,
Profitability, Investment,
Operational eff, Vol Rev: Vol > Price
Quantum Leap KPI Gearing, Profitability,
Investment, Vol Operational eff, Service delivery
MDS KPI Gearing, Profitability,
Investment, Vol, Operational eff, service delivery
GROW BUSINESS: Investments, GFB volumes (Key Commodities), Integrated Planning and intermodality (Key Corridors)
Divisional Target
Financial Stability
Freight focus
Group Target

10
that the bulk of Transnet’s investment financing has relied on cash from operations and the
rest from the capital market.
Figure 2. Transnet’s financing strategy
Source: Author’s construction using Transnet annual reports (2007-2012).
The constrained investment environment has had two effects on Transnet’s investment
allocation strategy. The first is that investments have been targeted towards sustaining rather
than expanding the business; and second, investments have been largely targeted at
profitable commodity groups and corridors through the key-corridor and key-commodity
strategy. This implies that secondary networks and commodities serving these networks have
been largely underserved.
The constrained investment environment was promoted in the past by the Department of
Public Enterprises as a means of forcing Transnet to emulate market efficiencies by subjecting
it to market forces (Department of Public Enterprises, 2006). However, the department has
since changed tack, in line with a developmental approach that holds that there needs to be
less reliance on balance sheet financing in order to drive investments required to improve
service delivery, economic and job growth (Department of Public Enterprises, 2011). However,
the development rhetoric has not been matched by actual support in the form of an equity
injection or government guarantee on bonds. The next section investigates the outcomes of
the current regulatory regime at the macro level.
Financing Strategy
No govt guarantee
60 % Cash from operations
Rest capital market
Key Corridor
Key Commodity
Investments in GFB > Coalex and Orex
GFB Volumes growth
Operational Efficiencies
Corridors selected
6 Commodities: mainly bulk, agriculture (grain), automotives &
containers

11
4. Macro-level performance of South Africa’s regulatory regime
The section describes and evaluates the macro-level outcomes generated by the regulatory
regime in the light of KPI targets set in the shareholder compact. The analysis will evaluate
the performance by assessing TFR’s outcomes in investment, pricing, volumes and efficiency
performance in the Coalex, Orex and the GFB segments.
TFR has managed to meet and recently exceed investment targets (Figure 3). Importantly,
the majority of these have been channelled towards the GFB segment (Figure 4). The targets
and actual performance of the contribution of price increases and volume increases to revenue
increases show that Transnet has relied on tariff increases rather than volume increases to
generate the cash required for investments (Figure 5). The freight rail tariff increases have
been so strong that they have since 2010 been at levels above those set by freight road
operations (Figure 6). This means that on average, road freight out-competes the country’s
freight rail network. Figure 7 shows that, of the three commodity groups, GFB average tariffs
are substantially higher than those of the Coalex and Orex lines. This makes sense as
investments are mostly targeted at the GFB market segment and these lines are more
operationally efficient than the GFB lines. However, the relatively high tariffs that are on
average at levels higher than road can possibly explain the poor performance of the GFB
market. In spite of receiving the bulk share of investments, volumes have not improved (Figure
8), as arguably the level of operational efficiencies at the current price level (as indicated by
the locomotive productivity indicator (Figure 11) and wagon turnaround time (Figure 12)] are
too poor for freight rail to be deemed attractive.
What is interesting is the Coalex line’s volume performance. The Coalex line has recorded a
volume gap between actual volumes and target volumes in spite of solid and improving
operational efficiencies (Figure 9). In contrast, the Orex line’s actual volumes have kept
abreast with target volumes (Figure 10).
A critical reflection that can be made about the outcomes of the regulatory regime thus far is
that the constrained investment environment is partially to blame for the sluggishness in the
GFB segment. This is because its focus on balance sheet financing for a railway network that
has been left in disrepair for a 30-year period means that it places a bias on private rates of
return rather than social rates of return. Private rates of return have forced TFR to focus on
sustaining investments rather than expansionary investments. Sustaining investments merely
maintain rather than grow and diversify out of the current customer base. The current customer
base is already focused on a narrow set of key commodities and corridors. Importantly, the
private rates of return have also forced TFR to set prices that are currently at levels higher
than road, which is an anomaly in the literature as rail is generally considered to be more price-
competitive than road. Lastly, the tariff-investment strategy has triggered a vicious circle as
price increases to generate revenue for investments have hampered growth in GFB volumes
due to the low operational efficiencies of the segment. However, as GFB is a large market
segment with over 100 commodities, it becomes critical to unpack how different commodities
have faired under the current regulatory regime with respect to investment, access and pricing.
This requires a deeper sectoral analysis.

12
5. Micro-level performance of South Africa’s regulatory regime
Given the sheer size of the GFB, a deeper inquiry at the sectoral level is required to establish
how different commodity groups have been affected by the regulatory regime. Who has
benefited and who has lost and under what pretext have these outcomes been generated?
More importantly, can an economic regulator help to minimise the costs given the constrained
investment environment? Three sectoral case studies (coal, citrus and automotives) are used
to explore these issues
5.1. Unpacking TFR’s pricing policy and impact on GFB access, investment
and pricing
The previous section showed that tariffs are vital to Transnet’s investment strategy. Moreover,
the differential tariff levels across the main commodity segments have been set such that GFB
tariffs are higher than the other commodity segments. This is sensible given GFB’s lower
operational efficiencies. Still, GFB is a large segment with over 100 commodities and it is
therefore expected that there will be variances across the commodities. It thus becomes
critical to unpack the mechanics of TFR’s pricing policy to establish how different commodities
are affected by TFR’s pricing policy, as this affects the level of service, access and
investments that each commodity is likely to receive.
TFR is responsible for tariff-setting and there is little to no oversight on pricing from the quasi-
regulator given the legislative vacuum. TFR sets prices according to a required rate-of-return
model adopted from the Transnet Group model and the model is customised to suit freight rail
dynamics. Little is known about the contents of the actual model, but interviews held with TFR
and Transnet corporate suggested that it is comprised of the following key row line items that
are set against each column commodity: return on asset base, weighted average cost of
capital (measure of risk), depreciation, tax, expenses, commodity profitability and cross-
subsidy (Table 4). Within each row line item are sub-line items, so the description in table 4 is
actually a crude and somewhat opaque reflection of reality.
Table 4. Crude representation of TFR pricing model
Required Return Coalex Citrus Autos
Return on Asset Base
WACC
Depreciation
Tax
Expenses
Volume
Cross-subsidy
Source: Author’s own construction.
According to the interviews, return on asset base is a measure used to incentivise investments
and is thus a cost recovery measure for sustaining the business. The measure will differ across

13
commodities as the quality and operational efficiencies of the assets that serve particular
commodities vary widely. So the return on asset base will be higher for Coalex than assets
that move citrus products due to the quality of the Coalex assets. However, linked to the cost
recovery process is the consideration of the profitability of the commodity as TFR will try to
capture the windfalls in profits by pricing higher. Therefore, TFR follows the Ramsey pricing
strategy in principle as it sets the price at a level the market can bear. A higher tariff will thus
be set on a commodity in periods of high profitability and a lower tariff will be set in loss-making
periods. It is difficult to tell whether the profits generated by the commodity in question are
reinvested in the assets it uses, due to the workings of cross-subsidisation that supports loss-
making operations.
Operating costs are also critical to TFR’s differentiated pricing strategy. Operating costs are
divided into head office costs, and then those induced by the commodity. Head office costs
include taxes, depreciation and other expenses. Interviews with Transnet Group reveal that
head office costs may be distributed either according to the number of staff or the volumes
moved. Operating costs generated by the commodity will be induced in relation to the
underlying network that supports the transportation of that commodity. Commodity based
operating costs are determined by the level of complexity and standardisation of the underlying
network. Transnet’s own assessment of the railway network is that it generally has
unacceptable levels of standardization (Table 5). The implication is that operating costs will
be exorbitantly high. However, these complexities are more acute in the general freight line
than in Coalex and Orex lines (Table 6). Table 6 also shows that the coal and iron ore export
lines both enjoy dedicated lines, have dedicated rolling stock, have less loading points, shorter
route length, one destination point, standard axle load, one commodity, standard track types
and standardised traction along their lines. The GFB network characteristics are: shared
railway lines with passenger rail, partial dedicated rolling stock, many destination points and
commodities, and varied axle loads (although standard on the main corridors), track types and
train traction. Consequently tariffs will tend to be higher for the GFB in order to recover
operating costs.

14
Table 5. Transnet assessment of network standardisation
Source: Transnet (2013)
Table 6. Comparison of Coalex, Orex and GFB network complexity
Source: Transnet

15
It is important to note that tariffs are also set according to the volumes moved. Volumes
determine not only price but also the level of service and access. Access rules are generally
determined by TFR. There are two types of customers: those that are served directly by TFR
(also known as key account holders) and those that are served by one of eight logistics
companies with key accounts contracted by TFR. Containers are served by logistics
companies. To obtain a key account, the customer submits a volume projection to the TFR
marketing/customer service personnel and is prepared to pay an annual fee for its upkeep if
slots are available. TFR sector teams will organise access by identifying slots for the year,
negotiate contracts and oversee the service of the contract. However, critical to the decision
to provide a slot is the size of the volume, the regularity of train moves and the availability of
locomotives and personnel.
Generally, the bigger the volumes the better the price, service and access. There are three
types of services: megarail, accessrail and flexirail. Megarail is a service plan for large and
regular consignments of a minimum of 20 loaded wagons, operating 5 days a week set at a
minimum of an annual contract. Only once slots, locos and crews are allocated for the megarail
is the rest allocated for the pricier accessrail and flexirail. The accessrail is a regular operation
that operates trains from other train moves ending at a hub, while the flexirail is an irregular,
ad hoc operation for sudden unscheduled demand. This implies that the GFB will tend to be
pricier than the ore export lines with respect to volumes as it has lower densities than the ore
export lines.
It is quite apparent that the GFB segment will be priced higher than the ore lines given the
latter’s volume densities and the unacceptable levels of standardisation and network
complexities along the GFB lines. However, that the pricing bias falls against GFB is more a
question of history than just a technical matter. Past investment decisions have produced a
highly complex GFB network and a simpler network for the ore lines. Importantly, the simplicity
in the ore line network was brought about by decree through legislative Acts ordering the
construction of dedicated railway lines and the port of Saldana. Added to this was the decision
taken in 1986 not to invest in freight rail. Investments were, however, limited to the ore lines.
Recent investments have done little to change the underlying structure of the network as they
are focused on sustaining the network. Arguably these biases are behind the vicious circle
that hampers GFB volume growth, triggered by a purely tariff-based investment strategy.
5.2. Sectoral analysis of regulatory regime outcomes
The discussion thus far has revealed that the constrained investment environment has forced
TFR to rationalise investments in profitable commodities and corridors. It has also shown that
the constrained investment environment has produced a pricing regime that works against the
GFB and has thus contributed to the sluggishness in GFB volumes. This is due to the fact that
the magnitude of the underlying network deficiencies along the GFB lines dwarfs the
investments such a regime can generate to minimise the operating costs on the network. This
section uses case studies of ongoing disputes within the Coalex, citrus exports and auto
assembly sectors to investigate the outcomes of the regulatory regime at the sectoral level.
The section will also discuss the role that economic regulation can play in addressing these
disputes as a means of driving greater volumes in the GFB by reflecting on how other country
regulatory regimes, such as Canada, the US and Australia, would handle such disputes.

16
The cases reveal a range of ongoing or unresolved disputes over the regulatory regime’s
investment, pricing and access decisions that are holding to ransom the aim of economic and
industrial policy to ensure a competitive and efficient logistics system for industrial
development. The ongoing disputes over the Coalex line in particular are highly problematic:
if investigations by a credible dispute settlement process with decision making, investigative
and enforcement powers show that indeed, certain coal miners cannot fulfil their orders due
to structural constraints in the sector, the disputes are preventing the possible shared use of
that infrastructure by players within the sector (i.e. junior miners) and other sectors (such as
citrus) (Box 1).
Canada’s regulatory regime would handle the Coalex-TFR slow contractual agreement by
allowing complaints to be forwarded to the regulator for arbitration, in which the complainant
has the burden of proof (Padova, 2007:3). Therefore, Coalex miners would have to prove that
they have the volumes, that they have made investments that meet their orders and that they
have the potential to exceed the annualised 70 mt target to justify expansionary rail
investments. There is the possibility that neither party will come forward to build a case, in
which case a more proactive regulatory regime would set a limit to the duration of contractual
negotiation. If the timeframe is exceeded, then the regulator empowered by investigative
powers would step in to investigate the dispute. This proactive regulatory process therefore
ensures that negotiations do not hold the line to ransom, while at the same time it acts as an
incentive for the railway service provider and the customer to come to an agreement.
A South African economic regulator would find the citrus investment dispute more complicated
to handle, as the outcomes of the case are due to decisions taken within the constrained
investment environment (Box 2).
The Australian regulatory regime’s handling of the citrus case would have the infrastructure
owner respond to the access seeker within 30 days with an indicative capacity assessment;
after which negotiations for entry begin (Queensland Government, 2010). If the indicative
capacity assessment finds that there is no capacity then the infrastructure owner must produce
a work programme for expansion (Queensland Government, 2010). However, 60 percent of
the access seekers in the industry would have to sign a contractual agreement with the
infrastructure owner stating that they will make use of the new investment and that this will be
fed into the tariff charged over a particular time with penalties for non-delivery (Queensland
Government, 2010).
17
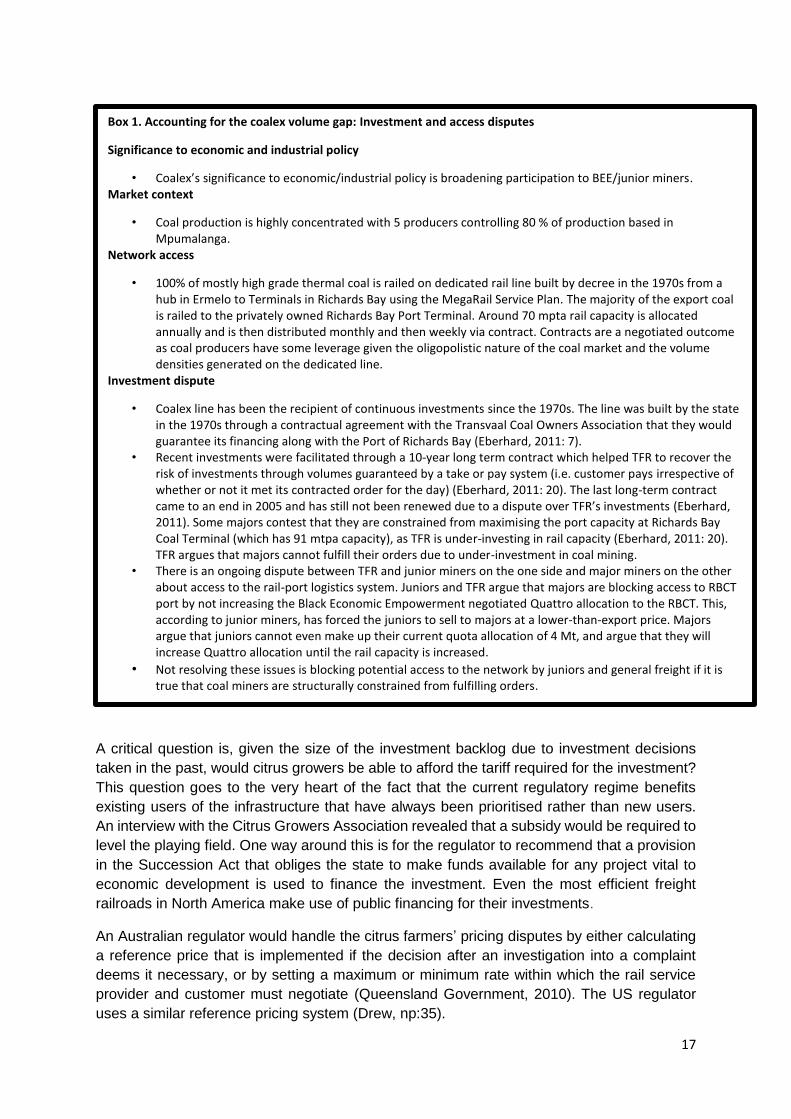
A critical question is, given the size of the investment backlog due to investment decisions
taken in the past, would citrus growers be able to afford the tariff required for the investment?
This question goes to the very heart of the fact that the current regulatory regime benefits
existing users of the infrastructure that have always been prioritised rather than new users.
An interview with the Citrus Growers Association revealed that a subsidy would be required to
level the playing field. One way around this is for the regulator to recommend that a provision
in the Succession Act that obliges the state to make funds available for any project vital to
economic development is used to finance the investment. Even the most efficient freight
railroads in North America make use of public financing for their investments.
An Australian regulator would handle the citrus farmers’ pricing disputes by either calculating
a reference price that is implemented if the decision after an investigation into a complaint
deems it necessary, or by setting a maximum or minimum rate within which the rail service
provider and customer must negotiate (Queensland Government, 2010). The US regulator
uses a similar reference pricing system (Drew, np:35).
Box 1. Accounting for the coalex volume gap: Investment and access disputes
Significance to economic and industrial policy
• Coalex’s significance to economic/industrial policy is broadening participation to BEE/junior miners. Market context
• Coal production is highly concentrated with 5 producers controlling 80 % of production based in Mpumalanga.
Network access
• 100% of mostly high grade thermal coal is railed on dedicated rail line built by decree in the 1970s from a hub in Ermelo to Terminals in Richards Bay using the MegaRail Service Plan. The majority of the export coal is railed to the privately owned Richards Bay Port Terminal. Around 70 mpta rail capacity is allocated annually and is then distributed monthly and then weekly via contract. Contracts are a negotiated outcome as coal producers have some leverage given the oligopolistic nature of the coal market and the volume densities generated on the dedicated line.
Investment dispute
• Coalex line has been the recipient of continuous investments since the 1970s. The line was built by the state in the 1970s through a contractual agreement with the Transvaal Coal Owners Association that they would guarantee its financing along with the Port of Richards Bay (Eberhard, 2011: 7).
• Recent investments were facilitated through a 10-year long term contract which helped TFR to recover the risk of investments through volumes guaranteed by a take or pay system (i.e. customer pays irrespective of whether or not it met its contracted order for the day) (Eberhard, 2011: 20). The last long-term contract came to an end in 2005 and has still not been renewed due to a dispute over TFR’s investments (Eberhard, 2011). Some majors contest that they are constrained from maximising the port capacity at Richards Bay Coal Terminal (which has 91 mtpa capacity), as TFR is under-investing in rail capacity (Eberhard, 2011: 20). TFR argues that majors cannot fulfill their orders due to under-investment in coal mining.
• There is an ongoing dispute between TFR and junior miners on the one side and major miners on the other about access to the rail-port logistics system. Juniors and TFR argue that majors are blocking access to RBCT port by not increasing the Black Economic Empowerment negotiated Quattro allocation to the RBCT. This, according to junior miners, has forced the juniors to sell to majors at a lower-than-export price. Majors argue that juniors cannot even make up their current quota allocation of 4 Mt, and argue that they will increase Quattro allocation until the rail capacity is increased.
• Not resolving these issues is blocking potential access to the network by juniors and general freight if it is true that coal miners are structurally constrained from fulfilling orders.

18
The auto assembly case confirms the notion that under the current regulatory regime, resource
allocation and access benefits those currently served by the network, and more recently this
has been aided by quasi-regulator arrangements in order to serve industrial policy. This may
be viewed as positive as it is a reflection of the alignment between industrial policy and freight
rail investment strategies. However, closer examination shows that the current arrangement
reflects the interest of the strong and entrenched vested interest (auto-assemblers) while the
component manufacturers – the labour intensive and high value added segment of the industry
– are left out of the process. Certainly, the inclusion of this segment of the auto-sector would
have changed the resource allocations to include containers as part of the arrangement.
Containers have been left out of the arrangement due to their complexity. Therefore the
alignment between the quasi-regulator auto sector arrangement and industrial policy is only
partial. Moreover, it shows that as with the citrus sector, containers are not well prioritised
within TFR’s investment strategy. The implication is that TFR’s investment strategy is unlikely
to serve rail-friendly value added goods.

19
Box 2. Accounting for no citrus volumes on rail
Significance to economic and industrial policy
• New Growth Path targets rural development and agricultural sector for labour intensive growth. Industrial Policy targets regional industrialisation.
Citrus market and logistics dynamics
• There are over 1,000 citrus growers in Western and Eastern Cape, and in the Northern region in Limpopo, Mpumalanga, and in Zimbabwe and Swaziland. The sector employs 100,000 workers, or 400,000 including seasonal workers. The Northern region produces 800,000 pallets annually.
• Logistic costs for the Northern region amount to 60 percent of revenue and about 25 percent of these costs are land freight logistics. In 2005, 80 percent of the Northern region volumes were transported by rail. Rail’s contribution to citrus transportation has dropped significantly to 5 percent by 2009.
Investment needs for citrus exports
• Historically, citrus was transported on rail using O type wagons but market dynamics in the last five years have shifted towards containers. The industry argues that there is a need for more reefer containers operating on a six-day week, as 80 percent of citrus exports are transported via containers. According to the Citrus Growers Association, the deregulation of transport and agricultural boards fragmented the export supply chain. The deregulation of road transport and the removal of the rail subsidy for agricultural products made road more competitive with rail. Agricultural boards created a centralised export distribution chain. Therefore industry argues that there is a need for a hub in Limpopo to centralise the supply chain.
Investment dispute
• The Citrus Growers Association argues that TFR deemed citrus not rail friendly due to its seasonality and thus started to disinvest to focus on iron ore and coal. Disinvestment was compounded by the key -corridor key-commodity strategy, which cut operations on branch lines to focus on main lines. This culminated in TFR removing citrus from the network linking the Northern region through the Swazi loop to Richards Bay in favour of bulk commodities. Currently 350 trucks transport citrus to Durban weekly. Congestion caused by truck traffic at the port undermines the cold chain required for citrus exports. This would be minimised on rail as the cargo would be railed directly to the newly constructed Fruit and Vegetable Terminal at one go. Since the Quantum Leap Strategy, Transnet has been promising investments, but industry argues that these have not been forthcoming. Moreover, the association argues that the meager investment made by TFR came to a waste as TFR failed to consult industry to customise the containers according to dimensions required to make the cost of the containers advantageous.
Pricing dispute
• Industry argues that unregulated third-party logistics companies are charging prices similar to road, making rail uncompetitive due to rail’s current service offering. 2010 prices show that the price difference was R33 for 28 standard pallets and R52 for 26 standard pallets. Industry argues that a key account would see a more competitive price but the TFR policy of containers through a logistics company is a stumbling block.

20
Box 3. Quasi-regulator, TFR and auto-assembly special arrangements
Economic and industrial policy
• The sector has received industrial policy support since the 1960s due to linkages/spillovers, technology and employment.
Market dynamics
The South African automotive industry is the bedrock of the country’s manufacturing capabilities in light of its contribution to manufacturing value added, GDP (7 percent in 2012) and employment. The flagship industrial policy programme, the Motor Industry Development Programme, positioned itself as a sub-contracting hub of a complex, dynamic global value chain geared to supplying the North American, European and African markets. An efficient and competitive logistics system is therefore required to maintain and grow its position within the value chain.
Network access
• There are four inland producers located in Roslyn, Gauteng, 600 km from the port of Durban. The bulk share of cargo transported in containers and on wagons uses the Durban Corridor. A small consignment of cargo has recently made its way through the port of Maputo, which is the closest port.
• 90 percent of Completely Knocked Down (CKD) travels on rail containers and 10-30% CBU wagons. Investment and service disputes
• The rail investment was part of the package attracting the auto sector to Roslyn. Industry claims that TFR cannot live up to the service agreement as it is unreliable, which is detrimental to its global logistics chain and undermines the ability of local producers to negotiate further investments into the country with corporate head offices in Europe.
Solutions
• Industrial policy alignment introduced recent investments in customised wagons through a TFR-auto sector design partnership. The auto sector’s activism and the growing alignment between industrial policy and the Department of Public Enterprises’ strategic orientation has spurred the quasi-regulator’s involvement to remove the stumbling blocks found in the industry. The partnership between assemblers, TFR and the quasi-regulator has been formalised by the State Owned Companies Automotive Competitive Forum to remove the stumbling blocks in electricity and transport supply with ministerial support. Projects are targeted towards wagons as containers are complex.
• On the transport side, the collaboration between NAAMSA and Transnet has resulted in the Customer Focused Commodity Strategy for the Automotive Sector. The strategy has a number of projects that include infrastructure investments and system improvements. A notable milestone is that the Minister has charged the sector with developing a dashboard of key performance indicators that measures the performance of TFR’s auto sector service delivery mandate. This tool will be used to by the DPE to monitor TFR’s service delivery performance.

21
6. South Africa’s freight rail regulatory reform process
The micro-level analysis highlighted a range of ongoing or unsettled disputes between the
railway service provider and customers. These issues are well understood by the main actors
within the regulatory regime, namely the Department of Public Enterprises, the Department of
Transport and TFR. National Treasury has also stepped into the fray to support the process.
It is for this reason that a regulatory reform process was initiated in 2005; however, this
initiative has not gained much traction due to contests within the policy space.
All the main actors are in agreement that there is a need for an economic regulator to regulate
pricing and access contests, but the actors disagree on the reform process that should be
followed and its end game. The Department of Transport maintains the view that the end game
is for a privatised freight railway network. According to this view, privatisation will generate
investments, drive competitiveness and increase output and service levels. However, the
Department of Transport argues that privatisation must be preceded by a series of gradual
reform steps. The first step is to gazette the draft Rail Green Paper, which was due to be
published for comment in the first quarter of 2012. The Green Paper will set the platform for
the development of a Rail Act to set up an economic rail regulator that will regulate the sector.
Table 7. Policy debate on freight regulatory reform process
Department of Transport
- Regulator is important: price and
access
- End Game: Privatisation of TFR
- Process: White paper STER
reporting to Parliament 10 yrs
- Interim process: Interim regulator,
Rail policy Green Paper
Department of Public Enterprises
- Regulator is important: price and
access
- End Game: No privatisation to align
with the Presidency and govt policy
- Process: Land Freight Policy creating
intermodal competitive neutrality
Regulator
Industry
- Regulator is important: price and
access
- End Game: Privatisation but ensure at
least 2 companies to ensure
competition – Autos; Coal we will run it
like in Australia.
TFR
- Regulator is important: price and access
- End Game: No privatisation to align with
Presidency and govt policy
- Process: Land Policy Freight Policy
creating intermodal competitive neutrality
regulator
Source: Author’s construction from stakeholder interviews.
The Department of Transport believes that the Green Paper-Rail Act process short-circuits a
longer reform process, which may take up to 10 years, currently taking place in parallel. The
longer reform process will begin with the development of a new Transport White Paper to
replace the 1996 version. The White Paper will provide the platform for the formation of a

22
Single Transport Economic Regulator. There are four modes of transport that are being
considered: rail, road, maritime and ports.
Both the Department of Public Enterprises and TFR maintain that the privatisation of the freight
rail system contradicts government’s developmental agenda as discussed out in section 3 of
this paper. Moreover, the Department of Public Enterprises is in opposition to the Department
of Transport’s short-circuit reform process as it undermines the viability of the freight rail mode.
According to the Department of Public Enterprises, freight rail’s viability is currently
undermined. This is because, while Transnet has to raise financing off its balance sheet to
fund the rail network, freight road operators are free riders on a road network that is financed
by the fiscus, which supplements user fees that are largely paid by private motorists.
Therefore, regulating rail without regulating the freight road mode will lead to the deterioration
of the already fragile underperforming freight rail network. Consequently, more freight will
migrate to the road mode. It is for this reason that the Department of Public Enterprises and
TFR have proposed a policy process that they believe must begin with a land freight white
paper policy. A key provision in the policy is a framework to ensure competitive neutrality
between the freight road and rail modes. The policy would then be followed by an Act that
establishes the Single Transport Economic Regulator. In response to TFR and the Department
of Public Enterprises’ concerns, National Treasury argues that an interim regulator process
and competitive neutrality may still be viable if road freight operators are charged a rand per
km fare; the revenues are then ring fenced and channelled towards freight rail, as is done in
Sweden, Australia and part of the US. Interviews do reveal that Transnet has a general
resistance towards receiving state injections due to the loss in autonomy such injections are
associated with. Transnet’s position towards therefore brings into question its commitment to
resolving policy issues that are withholding the reform process from fully materialising.
7. Conclusion
The aim of the paper was to investigate the contribution of the regulatory framework to the
sluggishness in GFB’s volumes through an analysis of TFR’s investment decisions. The
macro-level analysis showed that the underperformance in GFB’s volume is due to the current
macro-level performance-based regulatory framework that has encouraged a constrained
investment environment. This constrained environment relies on a tariff-based investment
strategy that triggers a vicious cycle on which the volume improvement from the GFB segment
is limited given the current poor levels of service. The effect of the strategy on rail’s tariffs is
such that they have exceeded road’s average tariffs in recent years, which is contradictory to
the received wisdom about rail’s relative cost competitiveness. As a consequence of the
regulatory regime, TFR has had to rationalise investments in high revenue-earning key
corridors and commodities. Moreover, investments have focused on sustaining the current
customer base rather than growing and diversifying it, as the investment is not large enough
to radically restructure the inefficiencies in the underlying network. Therefore the performance
based regulatory regime favours a private rate of return rather than a social rate of return.
The paper also demonstrated that the regulatory regime’s current focus on macro-level
performance rather than from a micro-level sectoral perspective, has created a power vacuum
that has the potential to be exploited by certain vested interests which have always benefited
from freight provision and may continue to do so at the expense of other general freight users.

23
This was shown in the investment dispute between coal miners and TFR, and with the quasi-
regulator’s involvement in the automotive assembly, while the labour-intensive component
segment has not been catered to. Moreover, it was shown through the citrus and auto cases,
that containers which are likely to attract value added goods are not as well prioritised as the
constrained investment environment cannot contend with their complexities.
The paper drew from cases of various regulatory regimes in other countries to reflect on the
role of the regulator in investment, pricing and access issues. Although some of these rules
may be applicable in South Africa, an economic regulator will fall short of setting and
implementing rules due to the constrained investment environment that cannot deal with the
structural network inefficiencies that plague the freight rail system and that largely contribute
to the sluggishness in GFB volumes.

24
Appendix A
Figure 3. Actual and target investments in TFR, 2004-2012
Source: Transnet Annual Reports (2004-2012)
Figure 4. Target and actual investments
Source: Transnet annual reports (2009-2011)
0
2
4
6
8
10
12
14
16
18
20
2004 2005 2006 2007 2008 2009 2010 2011 2012
R b
illi
on
Actual
Target
0.0
1.0
2.0
3.0
4.0
5.0
6.0
7.0
8.0
2009 2010 2011
R b
n General Freight
Coal
Iron ore

25
Figure 5. Actual and target contribution of price and volume increase to revenue
increase
Source: Transnet annual reports (200,2009 and 2010)
Figure 6. Average revenue per tonne for freight rail and road, 2008-2012
Source: StatsSA Land Freight Monthly Survey
-10
-5
0
5
10
15
20
25
2007 2009 2010
%
Volume growth Target Volume growth Actual
Tariff growth Target Tariff growth Actual
0
0.02
0.04
0.06
0.08
0.1
0.12
0.14
0.16
2008 2009 2010 2011 2012
Re
ven
ue
pe
r to
nn
e
Rail
Road

26
Figure 7. Average revenue per tonne for GFB, Coalex and Orex, 2008-2012
Source: Transnet annual reports (2009-2012)
Figure 8. Actual and target GFB Volumes, 2009-2012
Source: Transnet annual reports (2009-2012)
0
50
100
150
200
250
2009 2010 2011 2012
R/t
on
ne
GFB
Coalex
orex
Linear (GFB)
Linear (Coalex)
Linear (orex)
0
10
20
30
40
50
60
70
80
90
100
2009 2010 2011 2012
Mt Target
Actual

27
Figure 9. Coalex actual and target volumes, 2009-2012
Source: Transnet annual reports
Figure 10. Export iron ore volumes, 2009-2012
Source: Transnet annual reports (2009-2012)
Figure 11. Actual and target locomotive productivity, 2010-2014
54
56
58
60
62
64
66
68
70
72
74
76
2009 2010 2011 2012
Mt Target
Actual
0
10
20
30
40
50
60
2009 2010 2011 2012
Mt Target
Actual

28
Source: Transnet annual reports (2010-2013)
Figure 12. Actual and target wagon turnaround time, 2010-2014
Source: Transnet annual reports (2010-2013)
0
10000
20000
30000
40000
50000
60000
Actual Target Actual Target Actual Actual Target Target
2010 2011 2012 2013 2014
GTL
00
0/l
oco
mo
tive
/mo
nth
GFB Coal Iron ore
0
2
4
6
8
10
12
14
16
Actual Target Actual Target Actual Actual Target Target
2010 2011 2012 2013 2014
day
s
GFB Coal Iron ore

29
References
African National Congress, 2007, Economic Transformation Policy Discussion document.
Van der Mescht., J., 2006, Revisiting the road versus rail debate. Conference proceeding of
the 26th Southern Africa Transport Conference, Pretoria, 10-13 July 2006.
CSIR., 2012, State of Logistics for South Africa, Centre for Logistics and Decision Support,
Pretoria.
Cramer., B.E., 2007, North American freight rail: regulatory evolution, strategic rejuvenation,
and the revival of an ailing industry, University of Iowa, PHD Thesis.
Department of Transport, 1996, White Paper on National Transport Policy, Pretoria:
Department of Transport.
Department of Transport, 1999, Moving South Africa: A Transport Strategy for 2020 - Report
and Strategy Recommendations, Pretoria: Department of Transport.
Department of Transport, 2005, National freight logistics strategy, Pretoria: Department of
Transport.
Department of Transport, 2012, Annual Report, Pretoria: Department of Transport.
Department of Public Enterprises, 1999, Policy Framework for an accelerated agenda for the
restructuring of State-owned enterprises, Pretoria: Department of Public Enterprises.
Department of Public Enterprises, 2006, Annual Report, Pretoria: Department of Public
Enterprises.
Department of Public Enterprises, 2012, Strategic Plan 2012/13-2016/17, Pretoria:
Department of Public Enterprises.
Department of Trade and Industry, 2007, National Industrial Policy Framework, Pretoria:
Department of Trade and Industry.
Drew J., 2004, Regulatory Framework options for South Africa, DFID Funded Programme,
Implemented by Adam Smith International Regulatory Framework Options for the Rail Sector
Final Report 24 June 04.
Eberhardt A., 2011, The Future of South African Coal: Market, Investment and Policy
Challenges, Working Paper 100 January 2011.
Economic Development Department, 2010, The New Growth Path, Pretoria: Department of
Economic Development.
Marsay A 2005. The cost of freight transport capacity enhancement: A comparison of road
and rail. Conference proceedings of the 24th Southern Africa Transport Conference,
Pretoria, 11-13 July 2005.
Padova., A., 2007, Rail shipper protection under the Canada Transportation Act, Canada
Parliamentary information and research service, PRB 05-73E.

30
Perkins. P., Fedderke. J., and Luiz. J., 2005, An analysis of economic infrastructure
investment in South Africa, South African Journal of Economics., Vol 73 (2), pp 211 -228.
Presidency (2006), 2006 Annual Report - Accelerated and Shared Growth Initiative – South
Africa (ASGISA), Pretoria: The Presidency.
Thompson. L.S., 2009, Railway and ports organization in the Republic of South Africa and
Turkey: the Integrator’s Paradise? Prepared for the Round Table of 5-6 February 2009 on
Integration and Competition between Transport and Logistics Businesses. Discussion Paper
no. 2009-5.
Transnet, 2004, Annual Report
Transnet, 2005, Annual Report
Transnet, 2006, Annual Report
Transnet, 2007, Annual Report
Transnet, 2009, Annual Report
Transnet, 2010, Annual Report
Transnet, 2011, Annual Report
Transnet, 2012, Annual Report
Transnet, 2013, Annual Report
Transnet, 2013, Chapter 3 – Rail Development Plan
Queensland Government, 2010, Regulation of Queensland’s Coal A New Era for the
Queensland’s coal export industry.