The Role Of PI In Adani Ports Information Management...
50
Presented by The Role Of PI In Adani Ports Information Management System Vijendra Pancholi Adani Ports and SEZ Limited
Transcript of The Role Of PI In Adani Ports Information Management...
Presented by
The Role Of PI In Adani Ports InformationManagement System
Vijendra Pancholi Adani Ports and SEZ Limited

2
Adani Group
PIMS
Port Integration
1
2
4
Dynamic Vessel Monitoring System (DVMS)3

3
Leading Business Conglomerate with interest in diversified sectors...
Resources
Sourcing hydrocarbons from around the world to fuel India’s growth
Logistics
Owning a large network of ports, railways, ships and operate various facilities around our ports
Energy
Leading player in private sector power generation
Resources Logistics Energy
• Multi Modal Logistics
• Ports
• Special Economic Zones
• Gas Distribution
• Power
• Bunkering
• Grain Silos & Fruits
• Edible Oil
• Coal Mining
• Oil & Gas Exploration
• Coal Trading

4
Helping India build Port Capacity
Indian Ports & Terminals Location Year of Operations (expected) Existing Capacity Planned
Capacity
Adani Mundra Port Mundra, Gujarat 1998 165 240
Adani Petronet (Dahej) Port Pvt. Ltd. Dahej, Gujarat 2010 20 20
Adani Abbot Point Terminal Pty Ltd Australia 2011 50 100
Adani Hazira Port Private Ltd. Hazira, Gujarat 2012 25 75
Adani Murmugoa Coal Terminal Pvt. Ltd. Goa (2013) 7
Adani Vizag Coal Terminal Pvt. Ltd. Vizag, Andhra Pradesh (2013) 7
Adani Kandla Bulk Terminal Private Ltd. Kandla, Gujarat (2014) 20
Total Capacity (Million MT) 260 469
India
• Adani initially started its first port at Mundra location. Later on it has
aggressively added new Indian & Overseas ports to its portfolio.
• Adani Ports is targeting to achieve the mammoth figure of 200 million
MT per annum Indian cargo handling by 2020
• In the last fin year Adani Ports (India) handled over 90 Million MT of
cargo
5

6
Coal Mining &
Coal Trading
Power Generation &
TransmissionPorts & Logistics Current: 4620 MW
2020 : 20000 MW2020 : 200 MMT
2012: 36 MMT
2020 : 100 MMT
2012: 2 MMT
2020 : 200 MMT
2012: 78 MMT
Coal TradingCoal Mining
Power GenerationPort Cargo
Integrated
Business
Model

7
Adani Group
Port Information Management System
Port Integration
1
2
4
Dynamic Vessel Monitoring System (DVMS)3

8
Actual hurdles to overcome pain points
1 Missing transparency
2 Heterogeneous infrastructure
3 Manual data collection
No real time data
Manual reporting
No Benchmarks
4
5
6
9
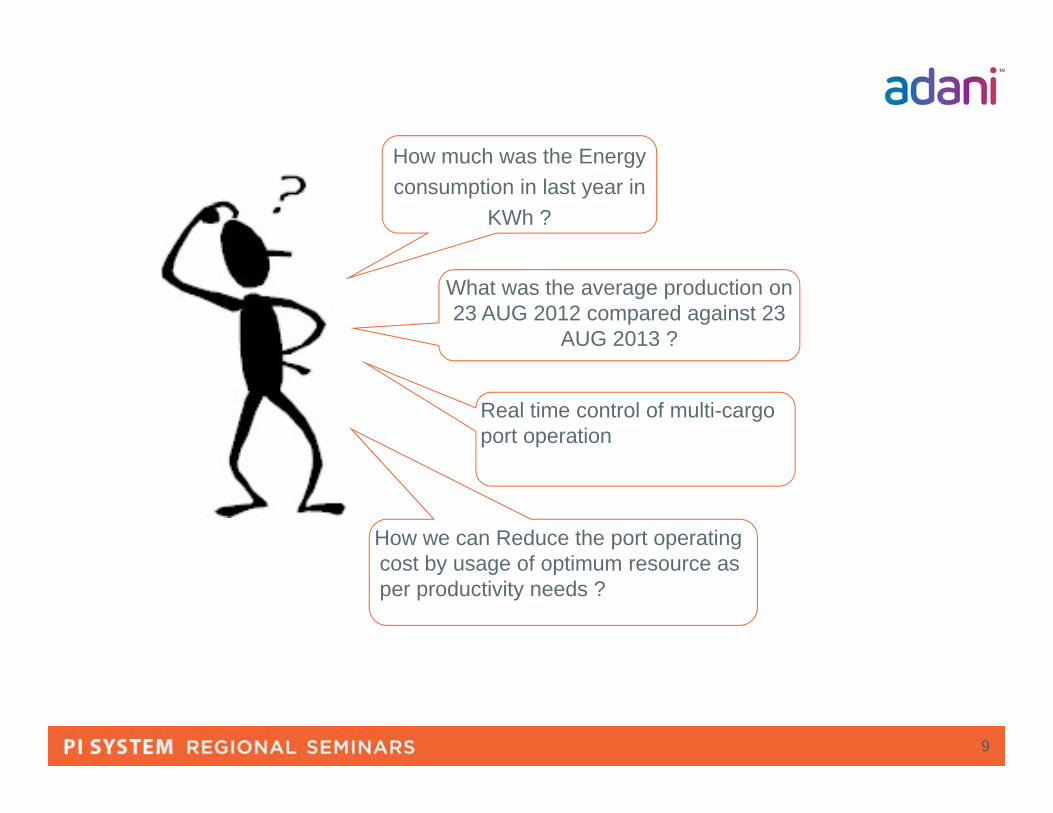
How much was the Energy consumption in last year in
KWh ?
What was the average production on 23 AUG 2012 compared against 23
AUG 2013 ?
Real time control of multi-cargo port operation
How we can Reduce the port operating cost by usage of optimum resource as per productivity needs ?

10
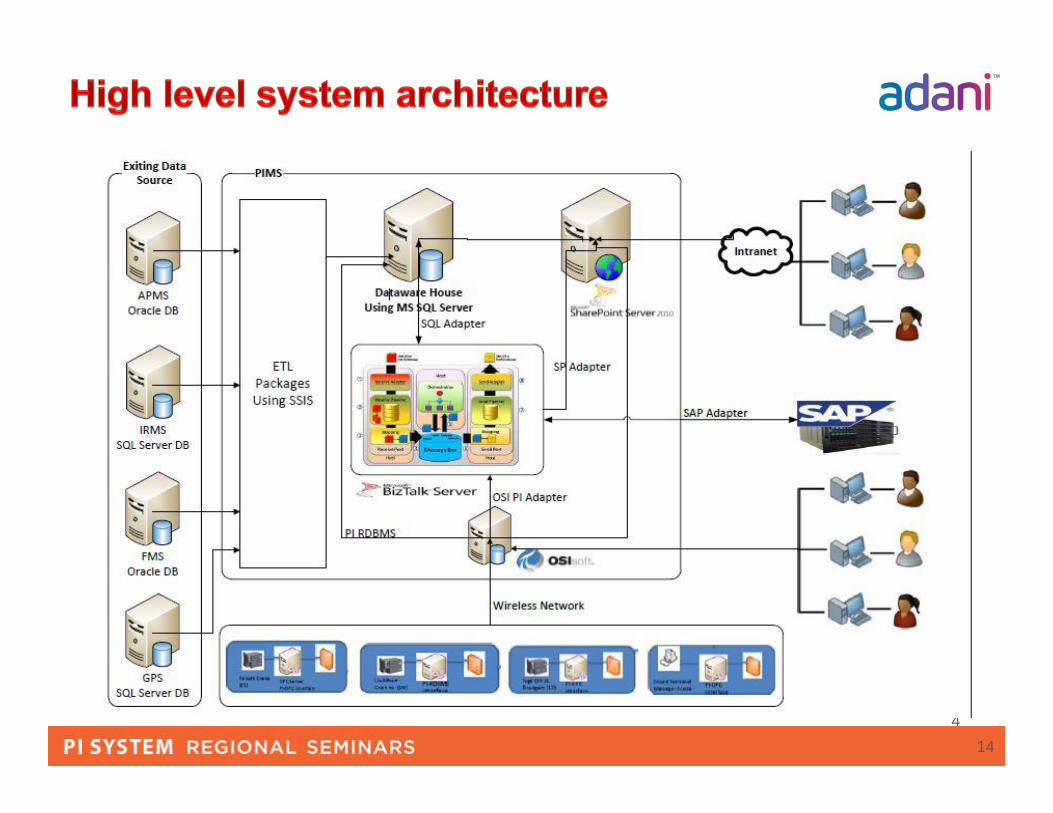
• PIMS is a tool to achieve ‘Operational excellence’ by optimizing production in real time
• Integration of applications like Oracle, SQL server based and intelligent automation systems
onboard Conveyors & Cranes
• PIMS allows the evaluation of system and operator performance
• Provide client tools for better trending, handling complex calculations
• PIMS will be consisting of two main areas:-
Integration of equipment information
Reports / dashboards
11
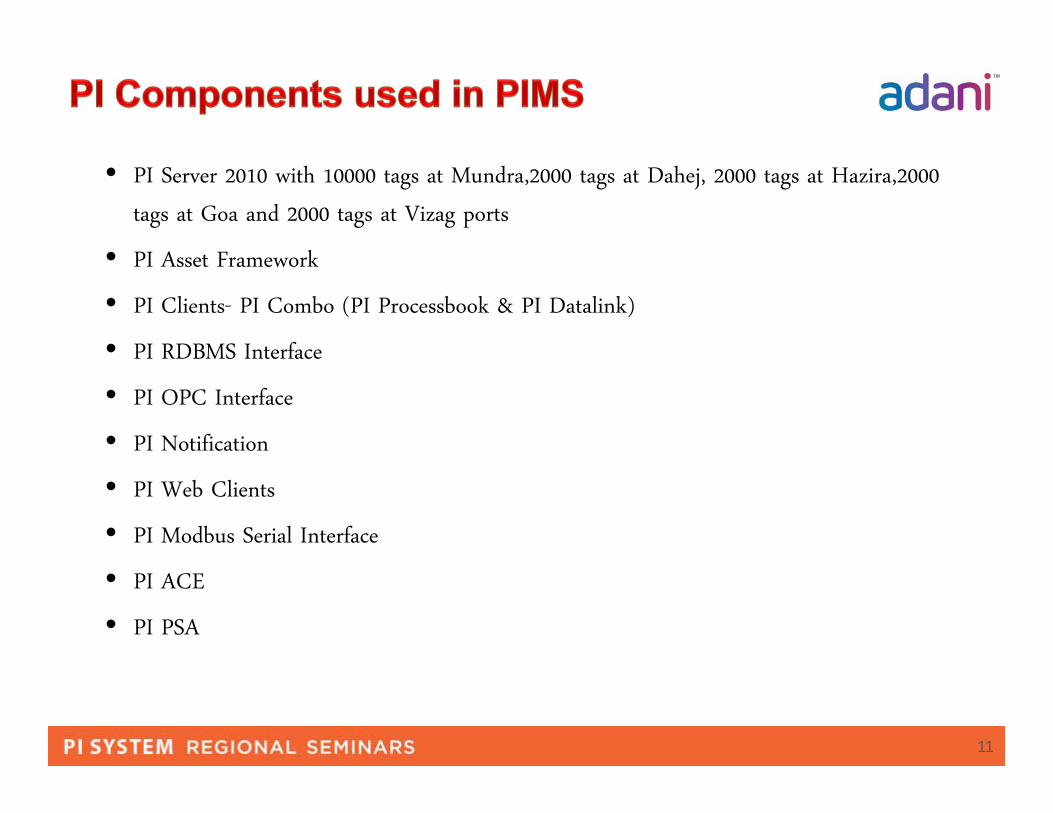
• PI Server 2010 with 10000 tags at Mundra,2000 tags at Dahej, 2000 tags at Hazira,2000
tags at Goa and 2000 tags at Vizag ports
• PI Asset Framework
• PI Clients- PI Combo (PI Processbook & PI Datalink)
• PI RDBMS Interface
• PI OPC Interface
• PI Notification
• PI Web Clients
• PI Modbus Serial Interface
• PI ACE
• PI PSA

12
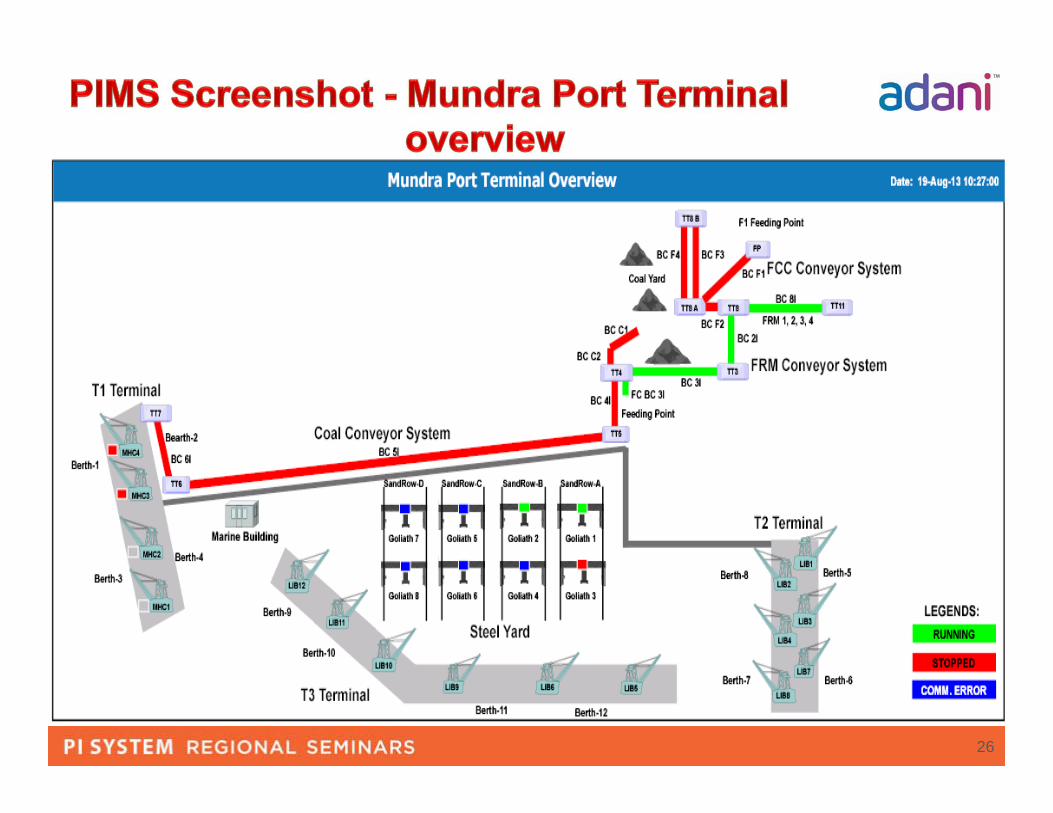
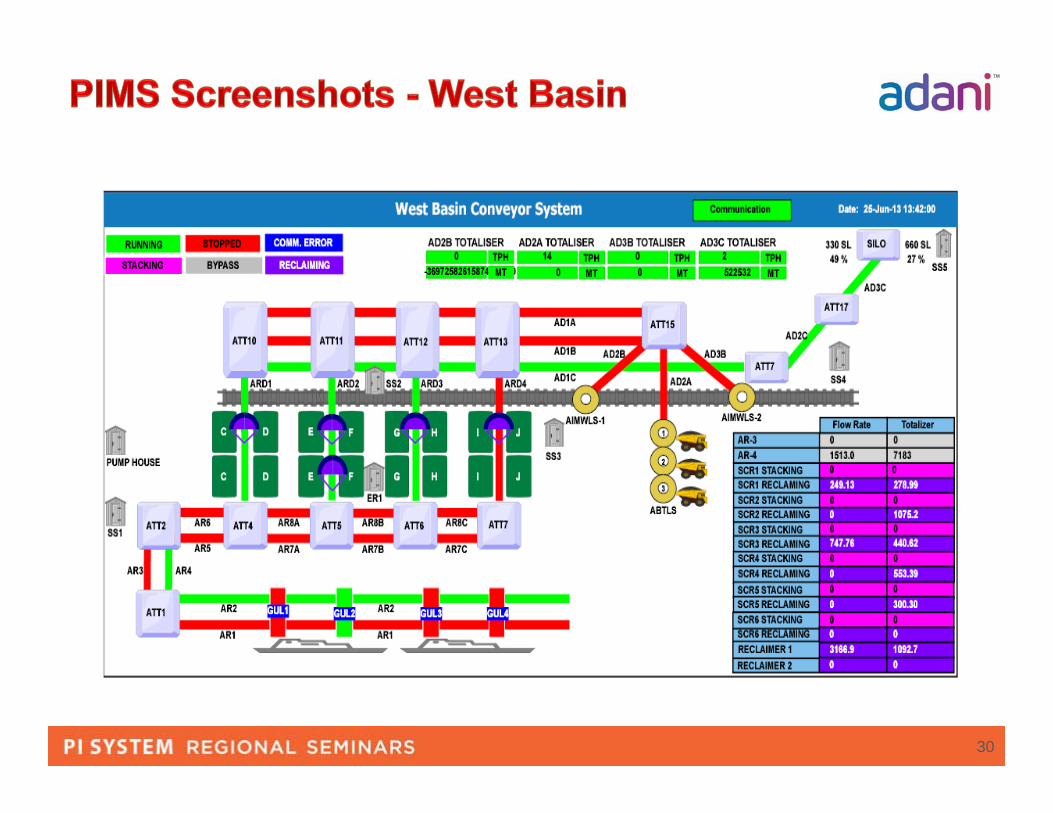
• Coal conveyor system
• Hopper system
• Bagging system
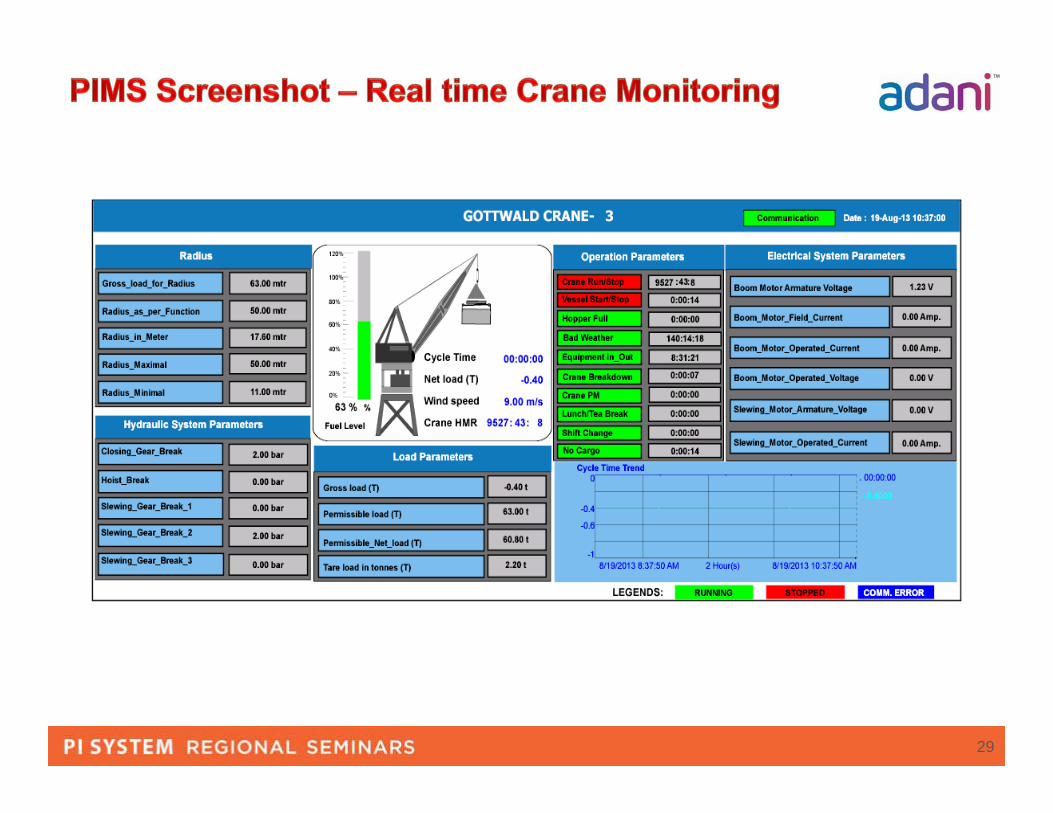
• Mobile harbor and yard cranes
• Fuel management system
• GPS
• FMS
• Liquid terminal automation
• LOCO
• Stacker / reclaimer
• Wagon and truck loading system
• SAP reports integration
• Reports using SSRS
• EMS
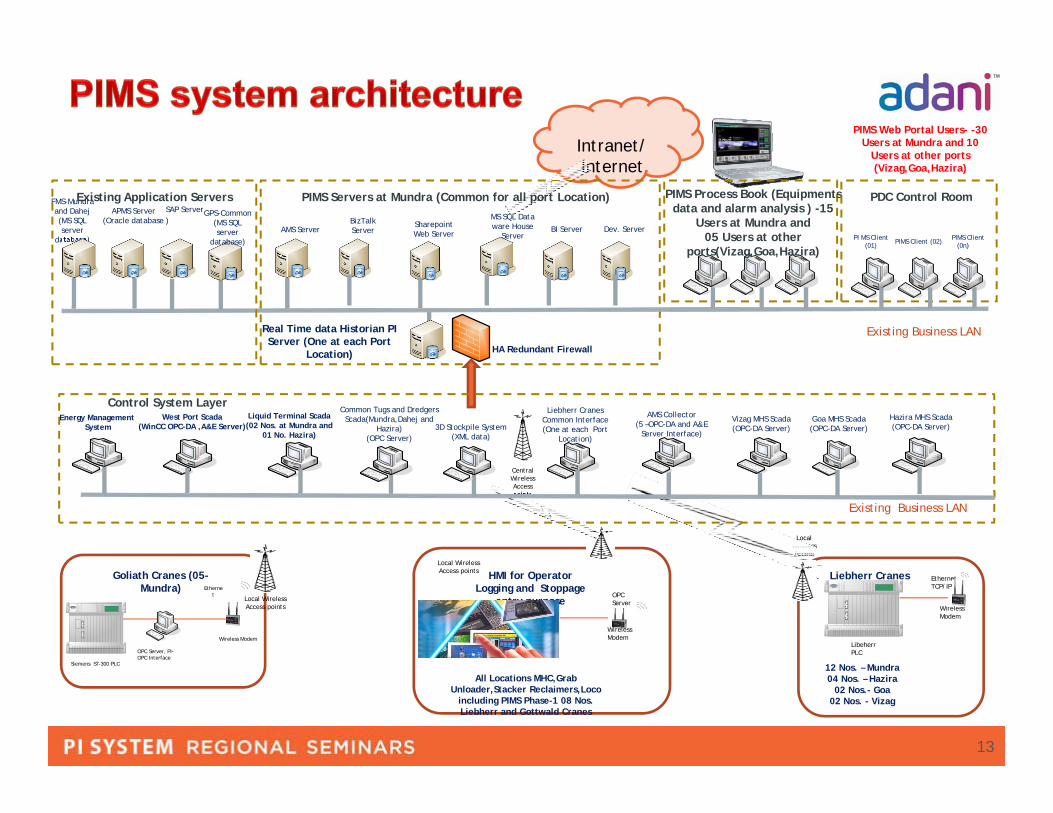
FMS-Mundraand Dahej(MS SQL server
database)
Local Wireless Access points
Intranet/ Internet
Liebherr Cranes
Wireless Modem
LibeherrPLC
Ethernet TCP/IP
12 Nos. – Mundra04 Nos. – Hazira
02 Nos.- Goa02 Nos. - Vizag
PIMS Web Portal Users- -30 Users at Mundra and 10
Users at other ports (Vizag,Goa,Hazira)
Goliath Cranes (05-Mundra)
Wireless Modem
Ethernet
OPC Server, PI-OPC Interface
Siemens S7-300 PLC
Local Wireless Access points
HMI for Operator Logging and Stoppage
entry purpose
Local Wireless Access points
Wireless Modem
OPC Server
All Locations MHC,GrabUnloader,Stacker Reclaimers,Loco
including PIMS Phase-1 08 Nos. Liebherr and Gottwald Cranes
SharepointWeb Server
MS SQL Data ware House
Server
BizTalk Server
Real Time data Historian PI Server (One at each Port
Location)
APMS Server (Oracle database )
SAP Server
PIMS Process Book (Equipments data and alarm analysis ) -15
Users at Mundra and 05 Users at other
ports(Vizag,Goa,Hazira)PI MS Client
(01) PIMS Client (02) PIMS Client (0n)
PDC Control Room
Existing Business LAN
AMS Server
GPS-Common(MS SQL server
database)
BI Server Dev. Server
PIMS Servers at Mundra (Common for all port Location)
HA Redundant Firewall
Existing Application Servers
Existing Business LAN
Central Wireless Access points
West Port Scada(WinCC OPC-DA ,A&E Server)
Liebherr Cranes Common Interface (One at each Port
Location)
Liquid Terminal Scada(02 Nos. at Mundra and
01 No. Hazira)
Common Tugs and Dredgers Scada(Mundra,Dahej and
Hazira)(OPC Server)
Goa MHS Scada(OPC-DA Server)
Vizag MHS Scada(OPC-DA Server)
Hazira MHS Scada(OPC-DA Server)3D Stockpile System
(XML data)
AMS Collector (5 –OPC-DA and A&E
Server Interface)
Control System LayerEnergy Management
System
13
14
14

15
Adani Group
PIMS
Port Integration
1
2
4
Dynamic Vessel Monitoring System (DVMS)3
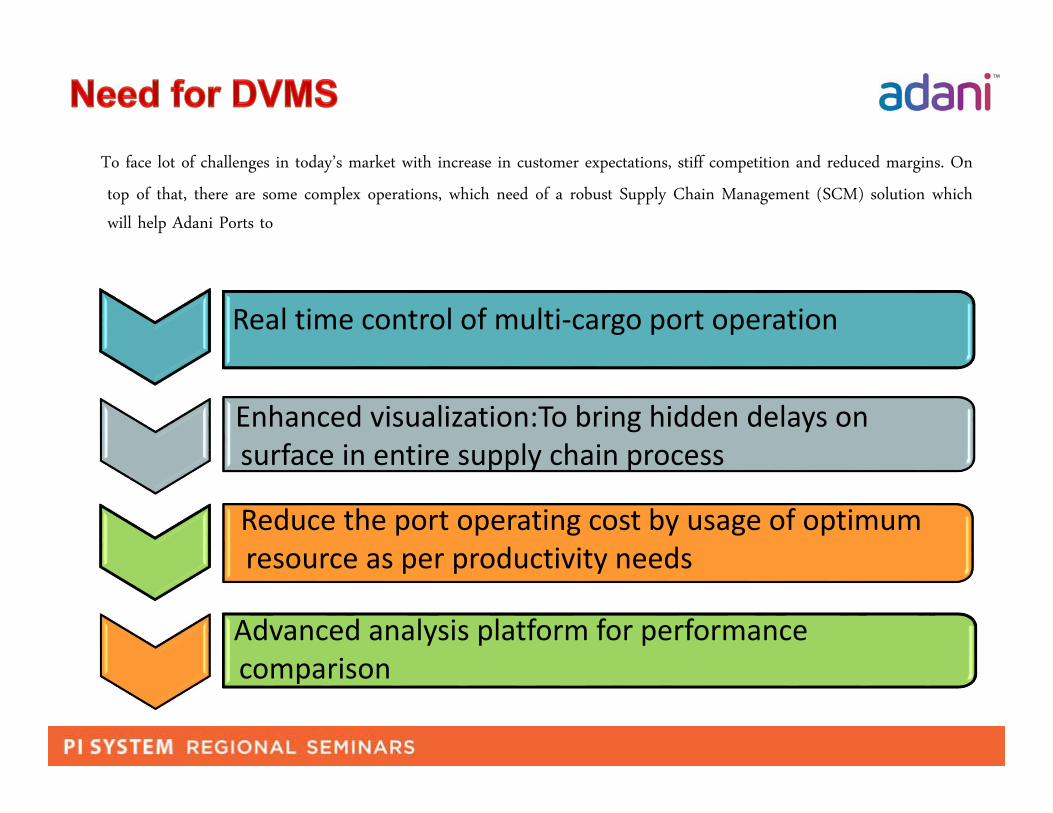
Advanced analysis platform for performance comparison
Real time control of multi‐cargo port operation
Enhanced visualization:To bring hidden delays on surface in entire supply chain process
To face lot of challenges in today’s market with increase in customer expectations, stiff competition and reduced margins. On
top of that, there are some complex operations, which need of a robust Supply Chain Management (SCM) solution which
will help Adani Ports to
Reduce the port operating cost by usage of optimum resource as per productivity needs
17
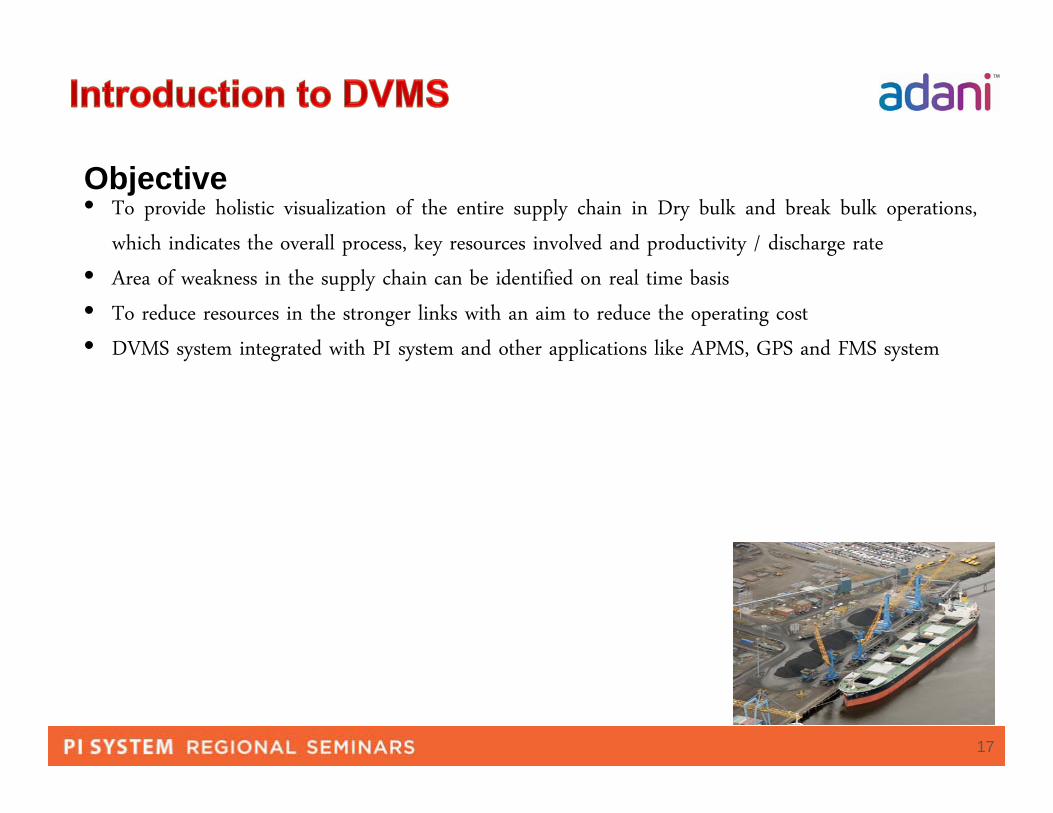
Objective• To provide holistic visualization of the entire supply chain in Dry bulk and break bulk operations,
which indicates the overall process, key resources involved and productivity / discharge rate
• Area of weakness in the supply chain can be identified on real time basis
• To reduce resources in the stronger links with an aim to reduce the operating cost
• DVMS system integrated with PI system and other applications like APMS, GPS and FMS system
18
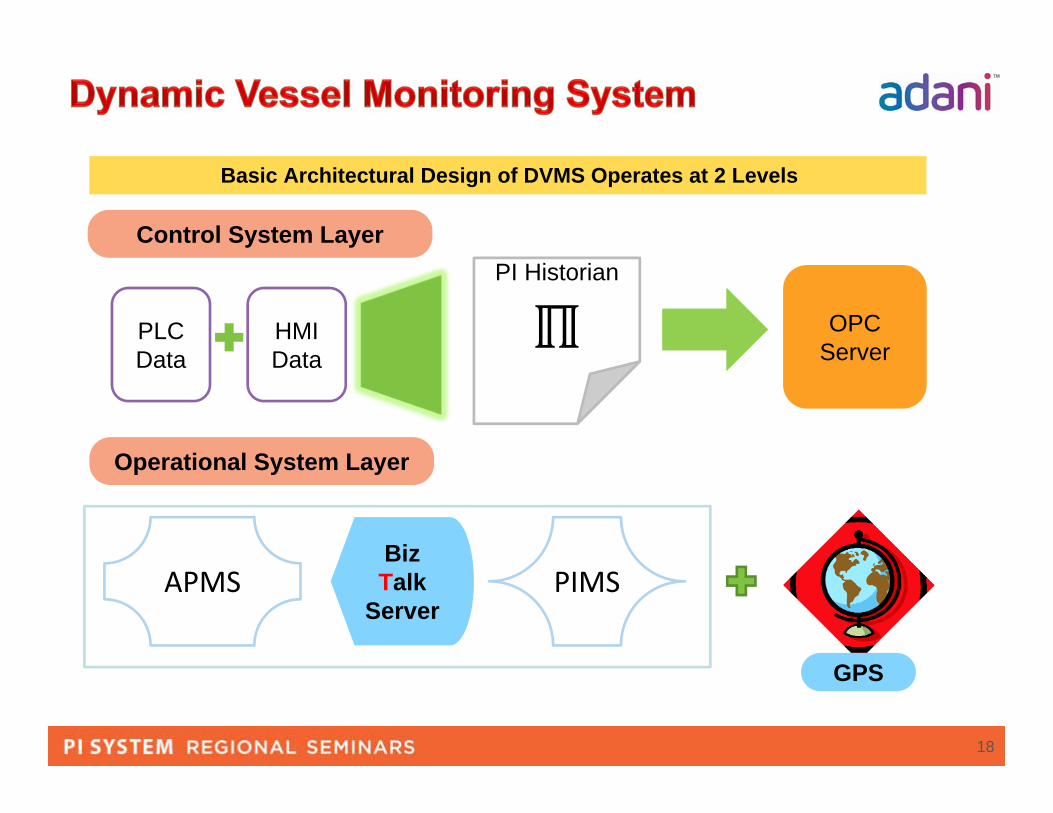
Control System Layer
Basic Architectural Design of DVMS Operates at 2 Levels
PLC Data
HMI Data
PI Historian
OPC Server
Operational System Layer
APMSBiz Talk
ServerPIMS
GPS

19
Crane• It shows active number of
system• Crane data – productivity,
reflect
Hatch• Hatch number along with • DVMS will show number of
that of a vessel
Resources• The total number of
shown beneath the figure
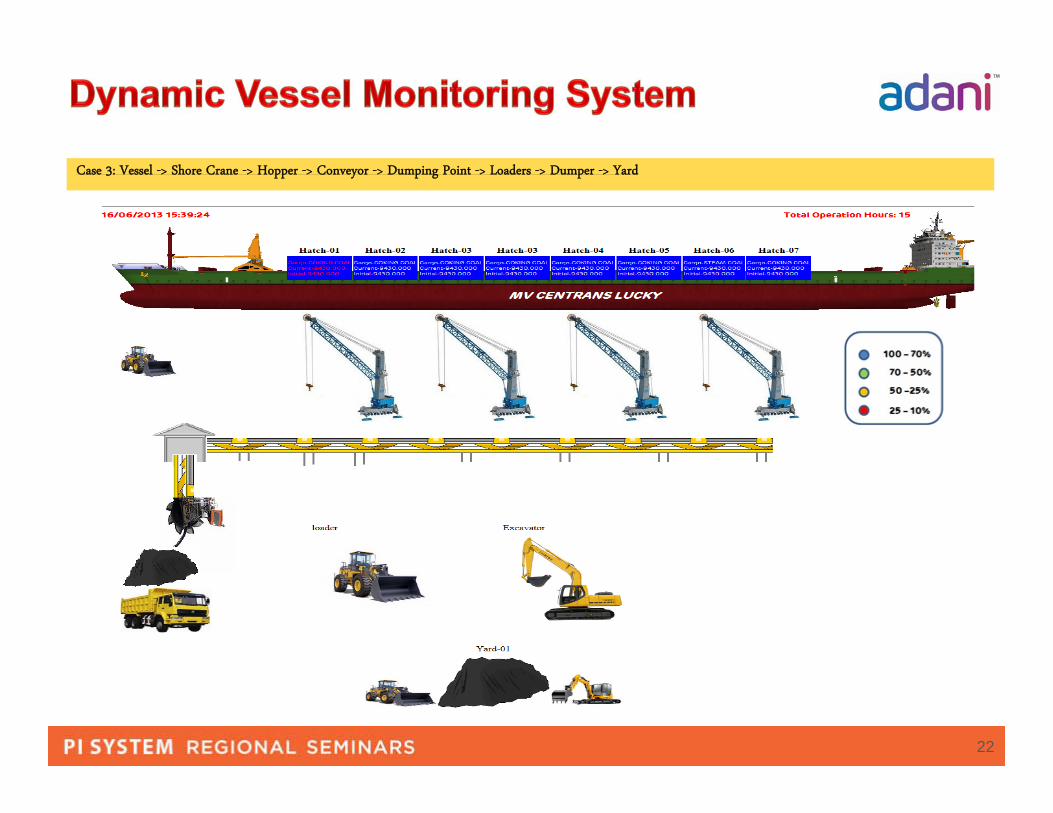
DVMS is an integrated tool for monitoring the overall vessel and for balancing the line of supply chain. The supply chain in a dry cargo operation comprises of the Shore cranes / vessel cranes, Hopper, Dumpers / Trailers / Conveyors and Back up equipments
Dumper• Number of dumpers and total
along with last hour productivity
Conveyor • In case, supply chain has a
conveyor belt will be visible• Productivity per hour reflect
placed on it
Yard• As per the allocation the back
the system• Number of available back up

20
Case 1: Vessel -> Shore Crane -> Hopper -> Dumper -> Yard -> Excavators & Loaders

21
Case 2: Vessel -> Shore Crane -> Hopper -> Jetty -> Loader -> Dumper -> Yard -> Excavators & Loaders
22
Case 3: Vessel -> Shore Crane -> Hopper -> Conveyor -> Dumping Point -> Loaders -> Dumper -> Yard
23
• Better Vessel Planning, Equipment Allocation as well as Yard Planning to increase in profit margin
• Actual Vs Plan productivity in real time basis to Identification of process bottlenecks
• Optimum equipment deployment based on the per ton handling cost
• Advanced analysis platform and enhanced visualization for decision making
• Consolidated data availability of each vessel in entire port and base for Inter port Knowledge sharing for cost optimization

24
Adani Group
PIMS
Port Integration
1
2
4
Dynamic Vessel Monitoring System (DVMS)3

25
• Microsoft SharePoint is a Web application platform developed for collaboration purpose. SharePoint has historically been associated with intranet content management and document management. PIMS developed on the Microsoft SharePoint 2010 technology. The SharePoint 2010 portal are responsible for showing reports and dashboard. PIMS application is also be using SharePoint 2010 out of the box authentication and authorization for the robustness of the application.
26

27

28
29
30
31
This image cannot currently be displayed.

32
33
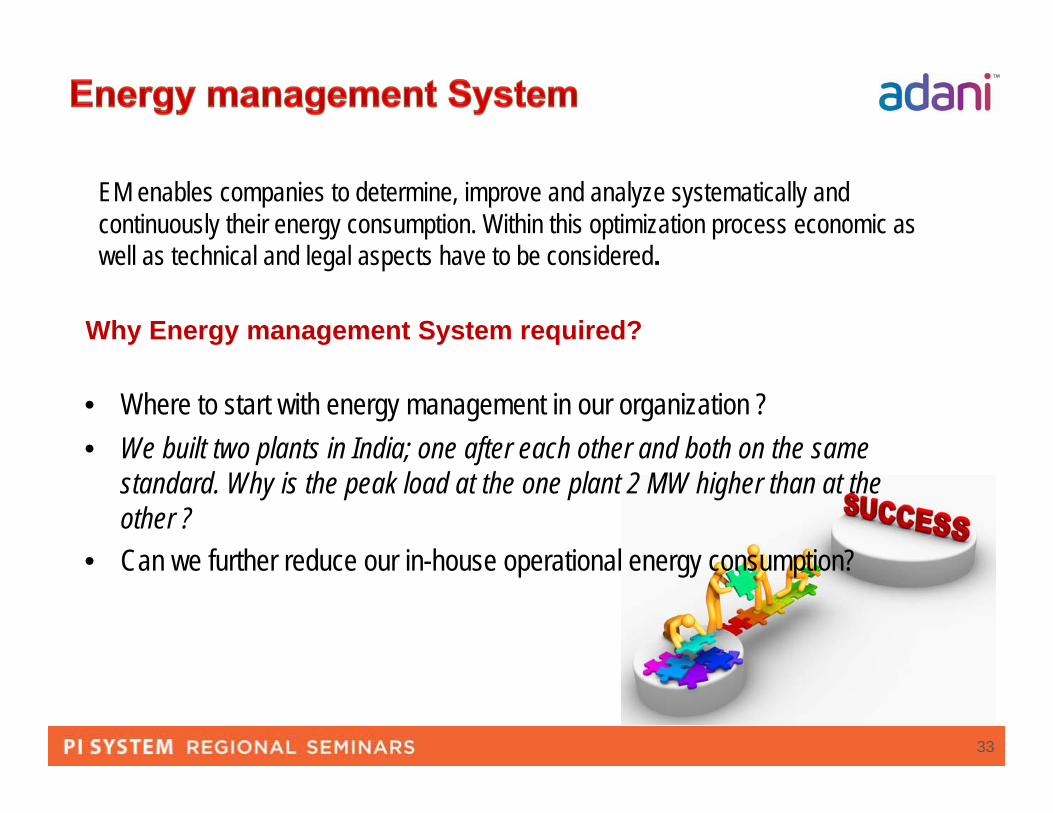
• Where to start with energy management in our organization ?• We built two plants in India; one after each other and both on the same
standard. Why is the peak load at the one plant 2 MW higher than at the other ?
• Can we further reduce our in-house operational energy consumption?
EM enables companies to determine, improve and analyze systematically and continuously their energy consumption. Within this optimization process economic as well as technical and legal aspects have to be considered.
Why Energy management System required?

34
Data Capturing through PIMS from the Plant Electrical system
Real Time Data graph through PIMS
35
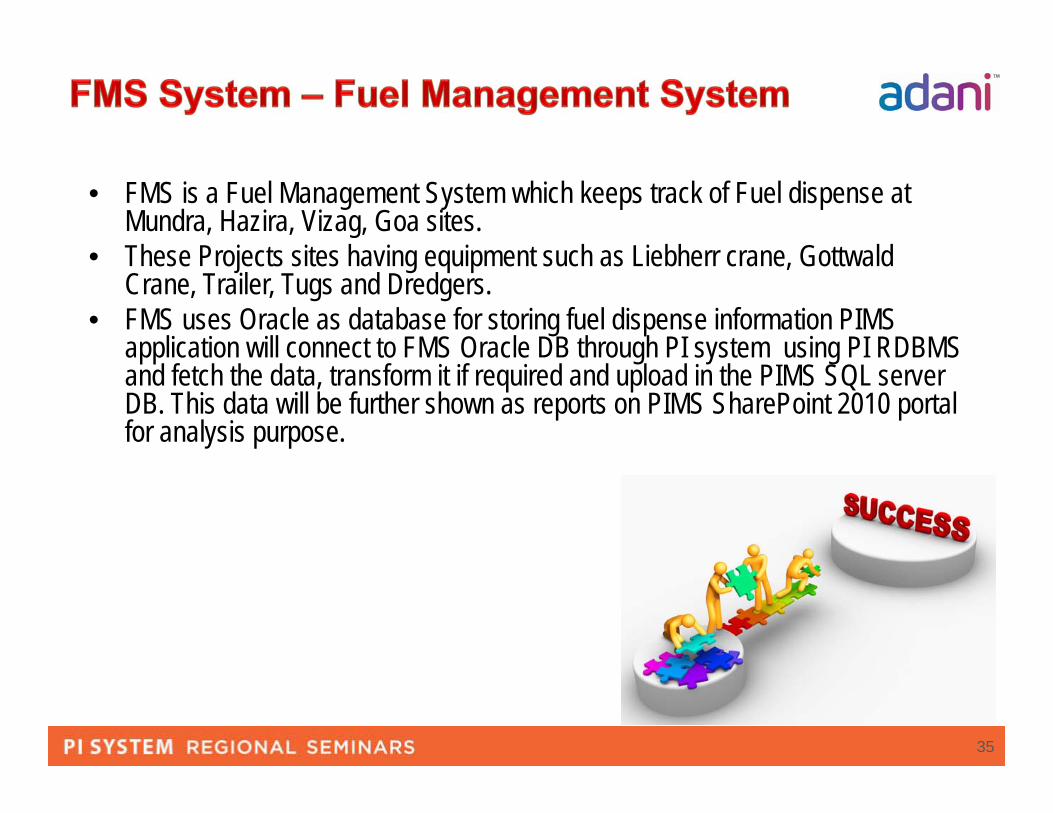
• FMS is a Fuel Management System which keeps track of Fuel dispense at Mundra, Hazira, Vizag, Goa sites.
• These Projects sites having equipment such as Liebherr crane, GottwaldCrane, Trailer, Tugs and Dredgers.
• FMS uses Oracle as database for storing fuel dispense information PIMS application will connect to FMS Oracle DB through PI system using PI RDBMS and fetch the data, transform it if required and upload in the PIMS SQL server DB. This data will be further shown as reports on PIMS SharePoint 2010 portal for analysis purpose.

36
37
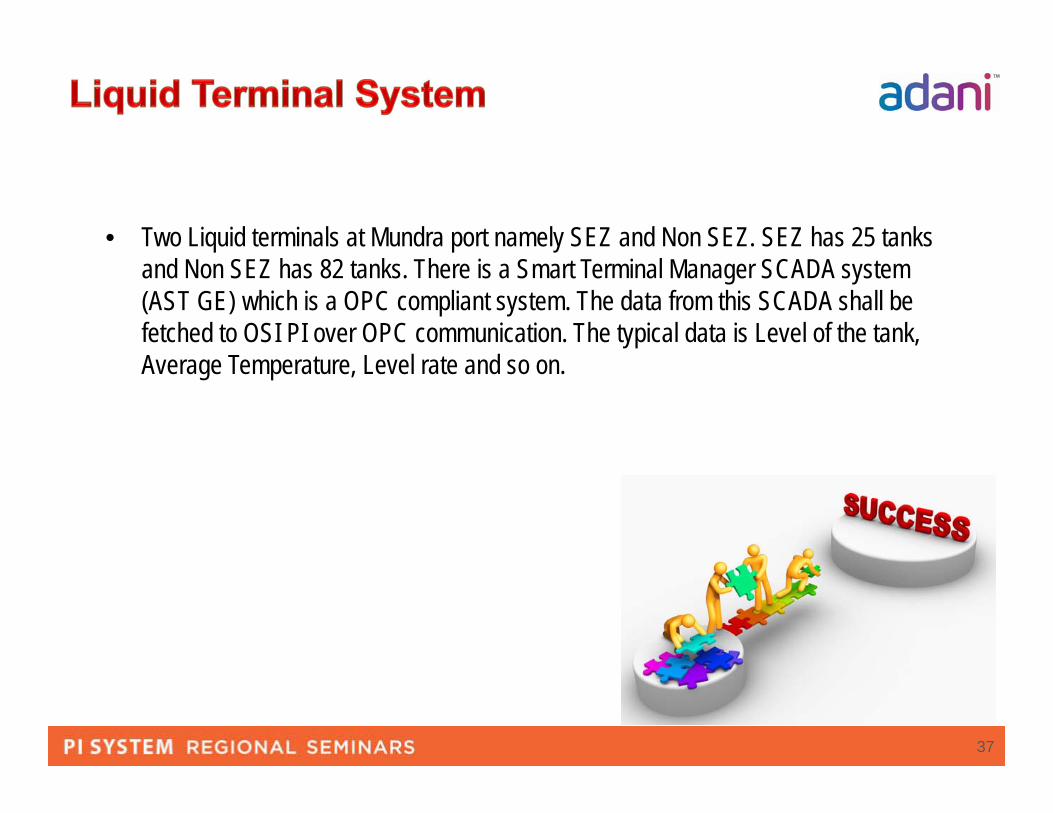
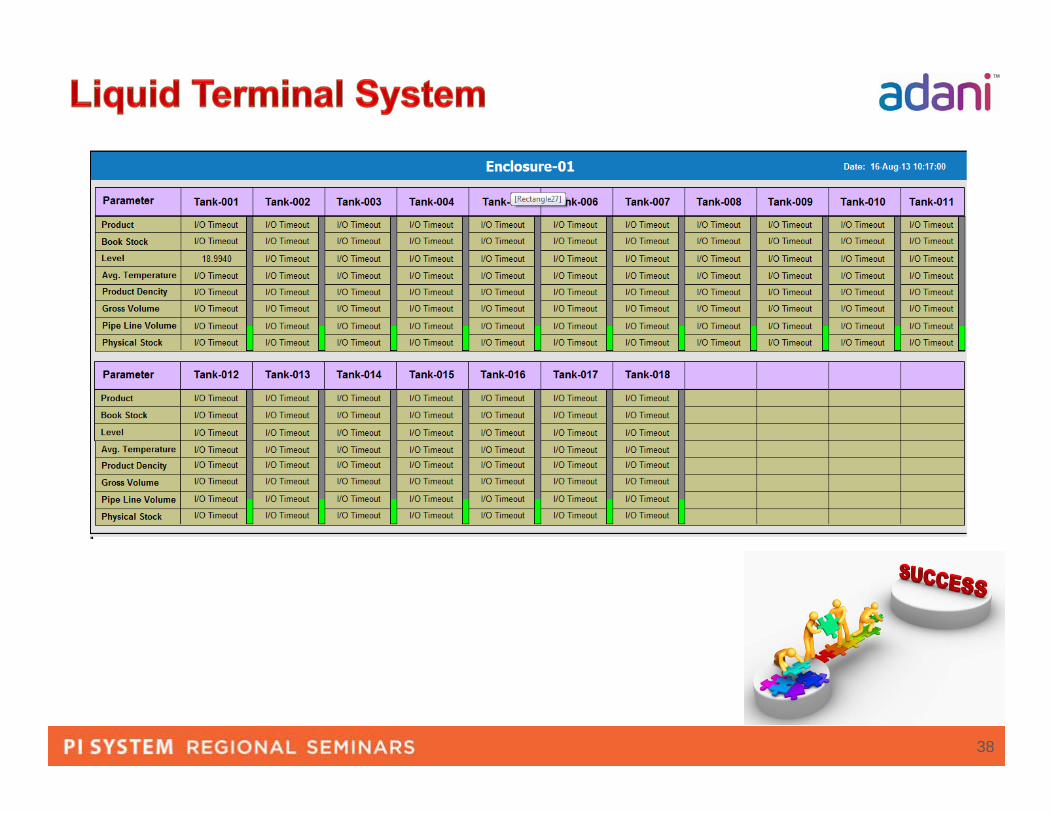
• Two Liquid terminals at Mundra port namely SEZ and Non SEZ. SEZ has 25 tanks and Non SEZ has 82 tanks. There is a Smart Terminal Manager SCADA system (AST GE) which is a OPC compliant system. The data from this SCADA shall be fetched to OSI PI over OPC communication. The typical data is Level of the tank, Average Temperature, Level rate and so on.
38

39
Supervisor to collect Daily Progress Report (DPR) manually from the individual equipment
On basis of the DPR , Data entry in SAP System manually
OLD CONVENTIONAL SYSTEM PIMS SYSTEM
Data collection based on Real time monitoring data of individual equipment from PIMS
Data automatically feed into SAP using BIZTALK

40

41

42
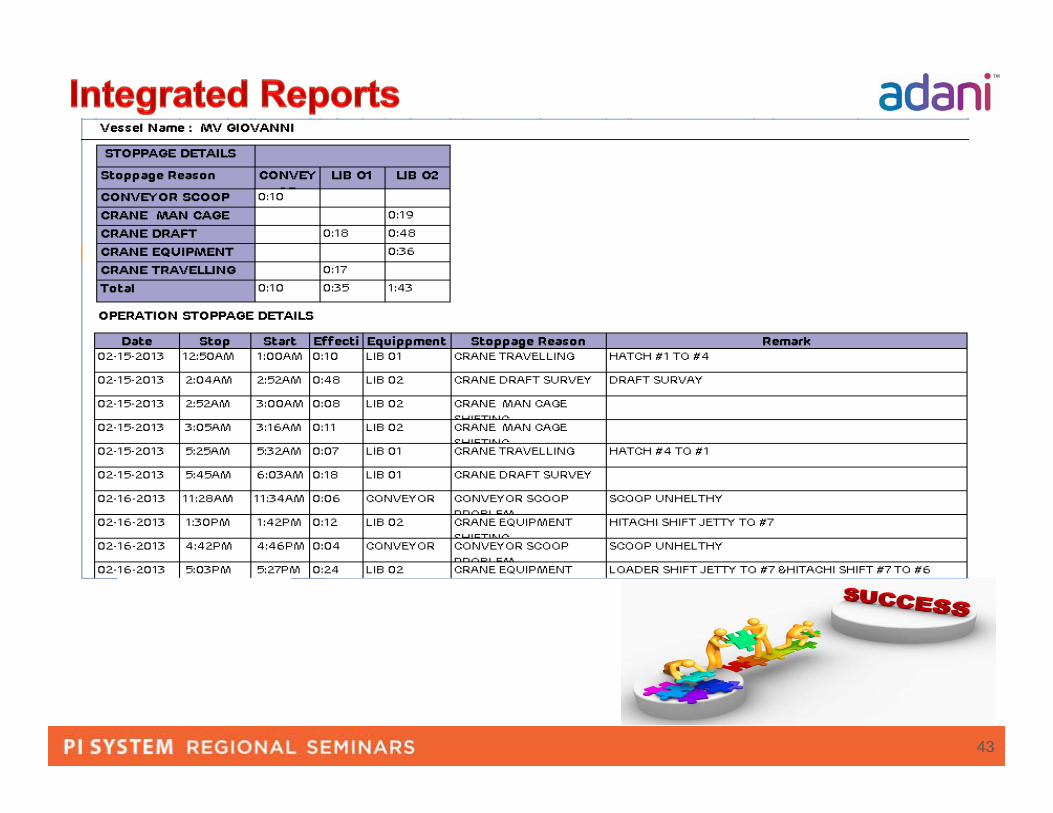
43

44
Current Status – Highlights either operational activity or Delay – in the
ON modeOperation – ON/ OFF
Vessel Name Date TimeCargo Hatch Number Berth # Operator Name
Signal StrengthVCN
Operational Activity Delays/ Stoppages
Speaker
IDLE Alarm
Microphone
VHF
Net Shift
Cargo Trim
LoadrShift
Net Clean
Hatch Clean
Crane Shift
Diesel Shift
Vessel Related
Breakdown/ Power Cut
Break – Tea/ Lunch/ Shift/ operator change
Ship Related
Contractor
SAFETY
WeatherStev. Instruction
Excavator Shift
No Cargo/ Hopper fill

45
Capture Operation and non operation Delays
• Operation (Cargo handling)/ Operational activity/Delays (stoppages)
Integration with PLC Data
• PLC cycle time data will be recorded for operational hours
• Idle Alarm alert mechanism
Interactive User interface
• Intuitive data capture • To keep focus in operation than detailed data
capture
Integration with Card slot and ICCR
• Linking operation activity to resource• Linking operation performance to ICCR for
real-time control

46
Crane Operator Slot-in Card
Operator slot-in his employee card –Start time is recorded
All operations, activities and delays gets recorded
Operator takes out his card from the slot – End time is recorded
Information Capture
Crane Operator Detail Contracted Workforce Management
Crane Operator Efficiency
Operator incentive will be based on this
ICCR, Contracted Workforce Management
PLC Data, HMI, ICCR, Contracted Workforce Management
47
Plan1. Planning and
Scheduling2. Resource Allocation
Plan1. Planning and
Scheduling2. Resource Allocation Data Based
Decision Making (Act)
1. Real time Analysis Planned vs actual
2. By productivity, Schedule & cost
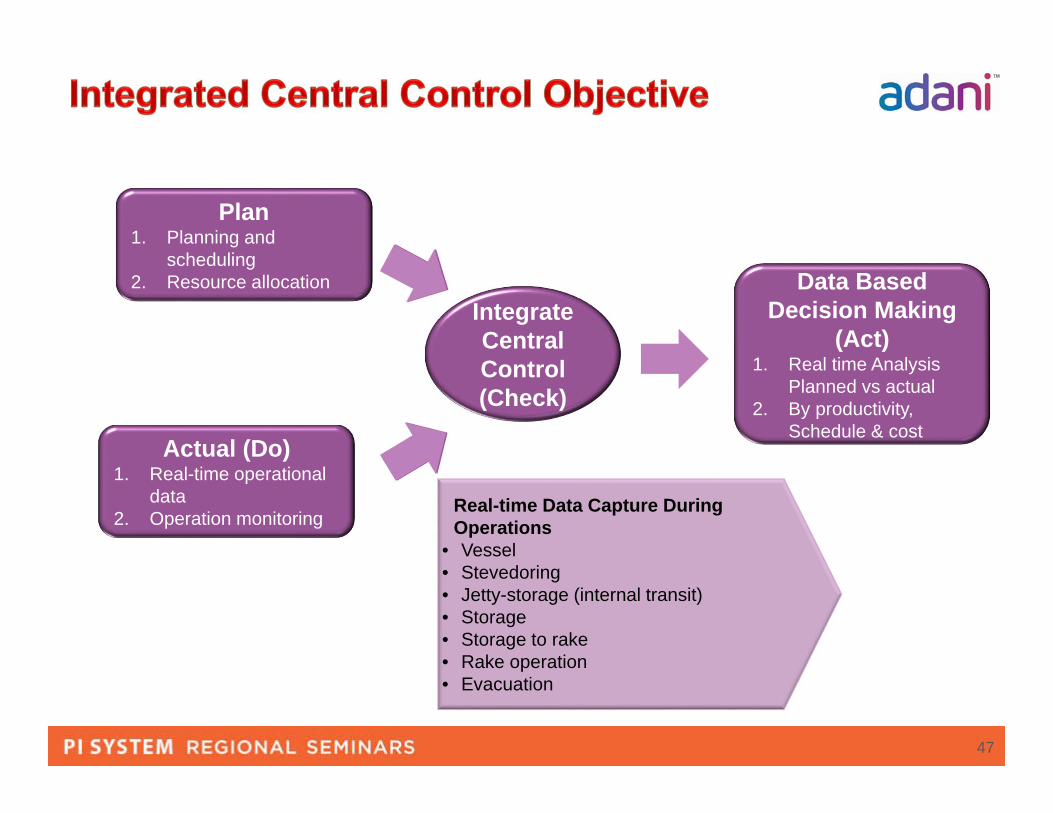
Plan1. Planning and
scheduling2. Resource allocation
Actual (Do)1. Real-time operational
data2. Operation monitoring
Integrate Central Control(Check)
Real-time Data Capture During Operations
• Vessel• Stevedoring• Jetty-storage (internal transit)• Storage • Storage to rake• Rake operation• Evacuation

48
Plan
DoActCheck
Real-time Variance Analysis• Planned vs. actual • Estimate future productivity to
completion vs. actual trending earned productivity to completion
• Estimate future cost vs actual trending cost to budgeted cost at completion
Data Based Decision making• Rectify actual operation within the
planned threshold, by schedule, Productivity & cost
• Perform the role of portfolio management to port vessels operations
• Rebalance vessel supply chain line by allocation of resources ( Equipment + labor)

49
Monitor & Control• Eyes and ears to sense the heart beat of
operations• Over multi vessel and vessel specific
• Monitor thresholds as per frozen plans• Initiate balancing action where threshold
breaching