Food Allergy testing, Food Allergy Test, Food Intolerance, Food Sensitivity, Chemical Sensitivity

THE ROLE OF FOOD INTOLERANCE IN
GASTROINTESTINAL SYMPTOMS IN CHILDREN
A RETROSPECTIVE SURVEY
UGUR MURAT
Supervisors:
Dr. Anne Swain, Dip Nutr Diet, PhD
Chief Dietitian
Dr. Robert H. Loblay, MB, BS, FRACP, PhD
Director
Dr. Velencia L Soutter, MB, BS, FRACP
Paediatrician
Allergy Unit
Department of Clinical Immunology
Royal Prince Alfred Hospital
June 1998

2
DECLARATION
1. I, Ugur Murat, hereby declare that none of the work presented in this essay has
been submitted to any other University or Institution for a higher degree and that
to the best of my knowledge contains no material written or published by another
person, except where due reference is made in the text.
2. The studies described in this essay were approved by the Central Sydney Area
Health Service Medical Ethics Committee (RPAH Zone), and all subjects gave
informed consent before participating.
Signature..................................................................... Monday 8th
June, 1998

3
ACKNOWLEDGEMENTS
I would like to thank everyone at the RPAH Allergy Unit for all their help,
support and friendship. I feel very privileged to have worked with such a motivated
and giving group of people.
I would especially like to thank Rob for allowing me the opportunity to work
on such an interesting and rewarding project, and for his valuable wisdom.
Gigantic thanks to Dr. Anne Swain for her constant support, guidance and
never ending motivation.
Many thanks to Velencia for allowing me the wonderful opportunity to observe
and work closely with the children. It really helped put theory into practice.
A big thank you to Allan for all his time and effort to set up the database and
analysis. Dorothy for helping me with follow-up consultations with the children.
Finally I would like to thank my wonderful and loving parents for always
being there for me.

4
TABLE OF CONTENTS
CONTENTS PAGE NUMBER
Abstract 1
Introduction
Aims
Methods
Results
Discussion
References
Appendices
A. Information Letter
Conners’ Rating Scale for Parents Questionnaire
B. Allergy and Intolerance Follow-Up Questionnaire
C. CSIRO Food Frequency Questionnaire
D. Reminder Letter
E. Patients Nutrient Summaries
F. Graphs
H. Tables

5
ABSTRACT
Introduction: From 1995 to 1998, 750 children aged 3-12 years were seen at the Royal
Prince Alfred Hospital (RPAH) Allergy Unit, for the investigation of suspected food
allergy and/or intolerance. Of these, 223 children presented with gastrointestinal
symptoms. The aims of this project were (1) to document the occurrence of food
intolerances in this subgroup, (2) to determine the long-term outcome of dietary
modification, and (3) to determine the nutritional adequacy of the diet after appropriate
modification.
Methods: Clinical data on these 223 children was collected from the medical and dietetic
notes at the RPAH Allergy Unit. Parents were sent a Follow Up Questionnaire and a
Conners’ Rating Scale for Parents on behalf of their child, to obtain information
regarding the long term outcome of the Simplified Elimination Diet (SED), dietary
modification and any changes in their child’s symptoms. Ten volunteers were sent a Food
Frequency Questionnaire to assess nutritional adequacy of dietary management of such
children. All data was entered into a computerized database for analysis.
Results: At presentation and on challenge the most common gastrointestinal symptoms
were diarrhoea and abdominal pain, and the most common associated symptoms were
hyperactivity, eczema and headaches. Eighty-three percent of respondents found that their
gastrointestinal symptoms improved significantly when their diets were modified. Of
these, 56% achieved this by dietary modification based on formal challenge testing, and
27% by a self modified diet based on information and advice received at the clinic.
Dietary modification significantly improved behaviour and physical symptoms.
Salicylates, amines, milk, wheat and additives were the common triggers and therefore
the most restricted. Children on modified diets maintained their growth velocity but can
have inadequate intake of vitamin A without supplementation. Dietary calcium intakes
did not meet Recommended Daily Intake in those with milk exclusion without
supplementation.
Conclusions: Gastrointestinal symptoms were found to be associated with intolerance to
salicylates, milk, wheat and amines. The SED protocol was a useful tool for the
investigation of food intolerance in children, however many parents preferred to modify
their child's diet empirically, based on the information received at the clinic, rather than

6
going through the formal elimination and challenge protocol. Dietary modification
requires monitoring by a dietitian to ensure adequate nutrition.
INTRODUCTION
Food intolerances are common causes of gastrointestinal symptoms in childhood. A
number of double blind studies 12, 21, 29
have shown that individual foods can
reproduce symptoms in children with gastrointestinal symptoms, but the mechanisms
are not fully understood.
From 1995 to 1998, 750 children aged 12 or under were seen at the RPAH Allergy
Unit for investigation of suspected food allergy and/or food intolerance. In many
cases, the outcome of the simplified elimination diet was not recorded in the dietetic
or medical notes, since parents of children who improved did not always feel the need
to return for follow-up. The purpose of this study was to follow-up a subgroup of 223
children aged between 3-12 years presenting with gastrointestinal symptoms, in order
to document (1) the results of the dietary elimination and challenge protocol, (2) the
long-term effectiveness of dietary modification, and (3) nutritional adequacy in these
children.
FOOD INTOLERANCE
Classical food allergies are mediated by IgE antibodies, and present with well
recognised clinical features such as atopic eczema and anaphylaxis. By contrast, food
intolerances are non-immunological reactions to food, and may present with a variety
of non-specific symptoms. It is currently believed that these reactions are
pharmacologically mediated responses to common food chemicals. These chemicals
may be naturally occurring substances (e.g. salicylates, amines, and glutamate) or
additives (preservatives, flavourings and colourings) found in a wide range of foods.
Reactions are dose-related, cumulative and delayed reactions are common, often
Comment [PJH1]:
Comment [PJH2]:

7
making diagnosis difficult. These characteristics of food intolerance often confuse
patients as to what foods are causing symptoms any in many cases leads to
unnecessary avoidance of foods 7. Studies have shown a discrepancy between foods
perceived to cause food intolerance and the results of double blind placebo controlled
food challenges 34
.
Clinical manifestations
In children, the most common gastrointestinal symptoms are abdominal pain, nausea,
feeling "sick", colic, flatulence and loose stools. Associated symptoms can include
hives, headaches, mouth ulcers, nasal congestion, leg aches and pain, learning
difficulties and behavioural disturbances 7
. Allergy and intolerance can coexist in the
same individual 7.
Toddler’s diarrhoea is seen in the first few years of life, and is characterized by
irregular bowel movement, watery or mushy faeces, which often contain mucus or
undigested food. Growth patterns are normal 2. Recurrent abdominal pain affects 10-
15% of school age children who generally have a history of colic in the first three
months of life, loose faeces, pain relieved by evacuation and food intolerance. The
pain can interfere with normal activity and may be associated with other symptoms
such as headaches, limb pains, enuresis and behaviour disturbances 2, 3, 5
.
Diagnosis
There are no reliable blood or skin tests for the diagnosis of food intolerance.
Currently, the most effective means of diagnosis is by an elimination diet and
challenge protocol. Those patients whose symptoms either improve significantly or
resolve completely within 2-6 weeks on an appropriate elimination diet are
systematically challenged with food substances. This can be done either as open food
challenges, or double blind challenges where purified food chemicals and placebos are
administered in capsule form 30
.

8
Management
The long-term effectiveness of dietary modification has not been established. Strict
adherence to a modified diet requires self-discipline, motivation, and a major
alteration in eating habits. Jones et al.21
found that only a small number of adult
patients were able to successfully complete an elimination diet and challenge protocol,
but they considered the effort of doing the elimination diet worthwhile since 50-65%
of patients became symptom free. In other studies, of those patients who responded
positively to an elimination diet, long-term compliance was about 80% 17, 26
.
Some authors18,20
have suggested that dietary modification is inappropriate for
children with recurrent abdominal pain. They consider this to be primarily a
psychosomatic disorder, since many patients have associated symptoms consistent
with the diagnostic criteria for hysteria. However, other studies 3, 19
have shown that
dietary elimination can simultaneously relieve both gastrointestinal symptoms and
associated neuropsychiatric symptoms in sensitive individuals.
NUTRITIONAL ADEQUACY
Criticisms have been made about the degree of dietary restriction required when
following an elimination diet or modified diet, due to the reduced variety of foods and
hence nutrient intake. The potential for malnutrition and growth failure is the greatest
concern, and particular emphasis has been placed on children who avoid staple foods
such as milk and wheat 8, 23
.
A study by Devlin et al 9
reported on 46 children with food intolerance. Twenty
children avoided milk, received no milk substitute, and 15 had a calcium intake below
the RDI for children. However in the 26 children who avoided cows milk but were

9
provided with a soya or casein hydrolysate formula only three had a calcium
deficiency9.
A study by Chiu 6
assessed the nutritional adequacy of 20 patients (5 adults and 15
children) seen at the RPAH allergy unit and placed on the "Simplified Elimination
Diet" (SED). Nutritional adequacy was assessed before and after the SED. The
children were divided into three groups: (i) children on the SED (n=5), (ii) children on
the milk free SED (n=5) and (iii) children on the milk free, wheat free SED (n=5).
The study showed that all groups had a significant reduction of vitamin A intake to
below the RDI, and also a significant increase in protein and vitamin C intake to
levels well above the RDI. The milk-free and wheat-free group had a significant
reduction in calcium intake, to a level below the RDI. But these levels were still better
than the inadequate intake on their regular diet 6.

10
AIMS
The purpose of this study was to document the role of food intolerance in children
with gastrointestinal symptoms.
The specific aims were:
1. To document the occurrence of food intolerance in a cohort of children aged 3 to
12 years presenting to the RPAH Allergy Clinic with gastrointestinal symptoms, by
analysis of medical and dietetic records.
2. To determine the long-term outcome of dietary modification by a follow-up
questionnaire.
3. To determine the nutritional adequacy of a sub-set of these patients by
administration of a Food Frequency questionnaire.

11
METHODS
ETHICAL APPROVAL
Ethical approval was obtained from the Ethics Review Committee of the Central
Sydney Area Health Service (RPAH Zone).
RECRUITMENT
Subjects
A cohort of 223 children of both sexes, 3-12 years of age, who had presented at the
RPAH Allergy Unit, with gastrointestinal symptoms were included in the study. The
subjects were selected from a larger cohort of 750 patients with a variety of symptoms
seen at the clinic between 1995 and 1998. The parents of all 223 children were sent a
follow-up questionnaire and were offered the opportunity to participate in a study of
nutritional adequacy. The first ten who volunteered were sent a food frequency
questionnaire and were given an appointment for dietetic and medical review. The
methodology is summarised in a flow diagram (Figure 1).
Dr. Velencia Soutter, Paediatrician at the Allergy Unit, recorded the diagnosis of
gastrointestinal symptoms. The children recruited had recurrent or chronic
gastrointestinal symptoms in the absence of organic disease. Where relevant, food
allergens were identified by skin prick tests. All the children in the study sample
underwent dietary investigation for suspected food intolerance. Dietary investigation
was with the use of the SED (appendix A).

12
PROCEDURE
The Questionnaires:
All parents of children with gastrointestinal symptoms were sent the following
package, containing:
1. An information letter outlining the aims and procedures of the study. A follow-up
consultation and nutrient analysis of the child’s diet, was offered to the first 10
parents to return the questionnaires (Appendix B).
2. Conners’ Behaviour Rating Scale Questionnaire for children >3years. The
Conners’ provides a percentile score for six aspects of child behaviour (Appendix
C).
3. A Follow-up Food Allergy and Intolerance Questionnaire was developed by Dr
Velencia Soutter and Dr Robert Loblay of the Allergy consulting Rooms. The
questionnaire was designed to obtain information on symptoms, diet,
food/chemical challenges and reactions, and medication (Appendix D).
4. A reply paid envelope.
A CSIRO Food Frequency Questionnaire to assess nutrient intake (Appendix E), was
sent to for the first 10 volunteers.
Four weeks after the initial mailing, a reminder letter was sent to parents who did not
respond to the initial request (Appendix F).

13
Data Collection
Preliminary information was gathered from the medical and dietetic files of children
seen by Dr. Soutter between 1995-1998. This information was entered into a
computerized database that was password protected and used for analysis. The
children were divided into four main symptom groups:
1. Gastrointestinal symptoms only.
2. Gastrointestinal symptoms and eczema.
3. Gastrointestinal symptoms and behaviour.
4. Gastrointestinal symptoms, eczema and behaviour.
Data from the Follow-Up and Conners’ Behaviour Rating Scale for Parents
questionnaires were entered into an access database.
Data from the CSIRO food frequency questionnaires were used to analyze the
macronutrients and micronutrient intake using the SOFFA (System for On-Line Food
Frequency Analysis) nutrition software. The program utilizes the NUTTAB food list.
Food items not listed in NUTTAB were added by creating an ‘Own Foods Database’.
Dietary supplements were not included in the analysis, in order to assess if they were
still required.
Nutritional adequacy of each child’s diet was assessed by comparison of selected
nutrients with the Recommended Dietary intake (RDI) for Australians by age and
sex31
. Nutritional inadequacy was considered to be less than two-thirds the RDI for
sex, age and weight. For those RDI values with a range of nutrient intakes, the upper
limit was taken to ensure adequacy.

14
FOLLOW UP CONSULTATION
The first 10 volunteers for nutritional assessment were offered a free follow-up
consultation with Dr. Velencia Soutter (Paediatrician) and specialist dietitians Dr.
Anne Swain and Dorothy Callender. Travel reimbursement was made available if
necessary.
At the follow-up consultation parents were given a summary of their child’s dietary
nutrient analysis (appendix G), and the opportunity to discuss the results and any other
problem regarding their child’s adverse reactions to food.
STATISTICAL ANALYSIS
All descriptive statistics (mean, range, and standard deviations) were calculated using
Minitab Statistical Package. A Pearson Chi-square test using Minitab was used to
determine: (a) gender differences in the total survey sample and respondents,
(b) difference between symptoms before diet, and now,
(c) difference between levels of dietary restriction of food/chemical
and symptoms,
(d) difference in change in symptoms and severity and dietary
restriction between self-modified diets and challenge-modified
diets.
A Students t-test (unpaired samples) was used to compare the age of participants of
total survey sample and respondents. A t-test (paired samples) was used to test for
differences between initial and final behaviour scores. A t-test (unpaired samples) was

15
used to identify any differences in nutrient intake for those on the elimination diet and
those on milk free and wheat free elimination diet.
P values less than 5% were reported as evidence of statistic significance.
Figure 1: Diagram of Study Methodology
RECRUITMENT OF SUBJECTS
Children who presented at RPAH allergy unit with gastrointestinal symptoms and
suspected food intolerance between 1995 and 1998
through records of RPAH allergy unit
PACKAGES SENT
Containing:
Information letter
Follow up questionnaire
Conners’ Parent Behaviour Rating Scale(for children> 3 years)
Food frequency questionnaire (only for the recruited 10 patients)
Reminder letter (sent after 4 weeks of initial package to non-
responders).
DATA COLLECTION
Preliminary information from medical and dietetic files
Questionnaires returned via mail by respondents
FOLLOW-UP CONSULTATION
Follow-up session with Dr Soutter/Dietitian, patients given summary of nutrient
analysis.

16
DATA ANALYSIS
RESULTS
Gender
In the total survey sample of 223 children with gastrointestinal symptoms there were
significantly more males 59% than females 41%, (p< 0.05, p= 0.01, DF = 1).
Age of Presentation to the Allergy Clinic of Total Survey Sample
The total survey sample consisted of children from the age of 3-12 years. The mean
age was 6.61 years (SD 2.53) and the range was 3.00- 12.79 years. Table 1 shows the
number of boys and girls in each age division.
Table 1: Age of presentation to the clinic for children with gastrointestinal symptoms
Age in years Female
(N=92)
Male
(N=131)
Total
(N=223)
< 4
4-7
8-11
12
16
45
31
0
20
72
36
3
36
117
67
3
Gender and Age of Respondents Compared to the Total Survey Sample
The results from the questionnaires represent a small percentage of the total survey
sample, due to the low response rate of 29 %. There is a high correlation in age
(DF=221, p=0.23, P>0.05) and sex (DF=1, p=0.86, p>0.05) distribution between the

17
survey respondents and non-respondents. A summary of the results is presented in
Table 2.
Table 2: Gender and Age of Total Survey Sample and Respondents
Sex and Age Total Survey Sample
(N=223)
Survey Respondents
(N=65)
Gender *
Male (%)
Female (%)
Mean age (years)
SD for Age (years)
Age range (years)
59
41
6.61
2.53
3.00-12.79
60
40
6.09
2.50
3.09-12.79
*Significantly more males than females, P value = 0.01.
Presenting Symptom Groups:
The total survey sample (n=223) was divided into four main symptom groups: 1.
1. 21% gastrointestinal symptoms only.
2. 16% gastrointestinal symptoms and eczema.
3. 54% gastrointestinal symptoms and behaviour.
4. 9% gastrointestinal symptoms, eczema, and behaviour.
The results indicate that over half the survey sample had associated behaviour
problems.
Gastrointestinal and Associated Symptoms
All the children in the total survey sample (n=223) had their symptoms recorded in the
medical notes on presentation at the clinic. All the children had gastrointestinal
symptoms. The main gastrointestinal symptoms were diarrhoea (47%) and abdominal

18
pain and cramps (46%). The most common symptoms associated with gastrointestinal
were found to be hyperactivity (42%), eczema (29%), and headaches (22%). A
summary of gastrointestinal and associated symptoms is presented in table 3.
Table 3: Symptoms in the Total Survey Sample (N=223).
Symptoms Children
(N=223)
% of Total Survey
Sample

19
Gastrointestinal
Diarrhoea/Loose stools
Pain/Cramp/Colic
Mouth Ulcers
Vomiting
Constipation
Reflux
Wind/Gas/Bloating
Central Nervous
System
Hyperactivity/Restless
Headaches
Irritable
Anxious
Concentration
ADD(diagnosed)
Learning Difficulties
Muscle/Joint pain
Aggression
Respiratory
Wheeze/Asthma
Sinus Irritation
Runny Nose
Skin
Eczema
Urticaria
Angioedema
Other
Anaphylaxis
105
103
23
14
12
7
5
94
48
18
14
13
9
8
8
5
43
37
27
65
15
6
2
47
46
10
6
5
3
2
42
22
8
6
6
4
4
4
2
19
17
12
29
7
3
1
Family History of Allergy/Intolerance
In the total survey sample (n=223) 66 % of mothers and 52 % of fathers had one or
more symptom associated with intolerance. The most common symptoms experienced

20
by the parents of children with gastrointestinal symptoms were diarrhoea/loose stools,
and rhinitis. Symptoms are summarized in Table 4.
Table 4: Parents Food Allergy/Intolerance Symptoms
% of Survey Sample
Mothers
(N=147)
% of Survey Sample
Fathers
(N=115)
Gastrointestinal
Diarrhoea/Loose Stools
Pain/Cramp/Colic
Mouth Ulcers
Constipation
Wind/Gas/Bloating
Central Nervous System
Headache
Muscle/Joint Pain
Hyperactive/Restless
Irritable
Anxious
Concentration
Learning difficulties
Respiratory
Rhinitis
Asthma/Wheeze
Runny Nose
Skin
Eczema
Urticaria
Angioedema
Other
Anaphylaxis
51
34
16
2
1
13
7
5
3
1
1
2
29
14
7
7
3
1
1
26
13
10
2
2
2
1
15
1
2
2
2
19
11
13
3
2
1
0
Progress Status

21
Progress status was documented in the dietetic notes of the total survey sample and in
the returned questionnaires from the respondents. Patients were classified according to
the following categories:
Abandoned SED if follow-up information was not recorded in the dietetic notes
or questionnaires were not returned.
Completed SED (challenge-modified diet) if they completed all the
foods/chemicals challenges and as a consequence modified their diet.
Incomplete SED (abandoned) if they started SED but did not complete all
challenges and then abandoned.
Self-modified diet if they did not start SED or if they started SED but did not
complete all challenges and instead self modified their diet based on information
given at the clinic.
The results show that the two-third abandoned the SED and one-third modified their
diet based on either challenge results or information received at the clinic. The
majority of patients whose responses were recorded showed an improvement in
symptoms. Table 5, 6 and figure 2 show a summary of the progress status and
response to dietary modification of the total survey sample. Figure 3 shows the
progress status and response of only the respondents.
Table 5: Progress Status of Total Survey Sample

22
Progress % of Total Survey Sample
(N=223)
Abandoned SED
Completed SED(challenge modified diet)
Incomplete SED(abandoned)
Self-modified diet
Incomplete SED (self-modified diet)
52
20
15
10
3
Table 6:Response of Total Survey Sample to Modified Diets
Response to Dietary Modification % of Total Survey Sample
(N=223)
Responders(improved)
Non-Responders(did not improved)
Unknown
29
5
66
Figure 2: Tree Diagram-Progress Status and Response of Total Survey Sample

23
From dietetic notes and returned questionnaires
Total Survey Sample
(223)
Did not start SED Started SED
137 86
Self modifiedA Abandoned
B Completed
C Incomplete
D Incomplete
E
diet challenges challenges challenges
self modified or abandoned
(22) (115) (45) (8) (33)
Responses
Unknown No Improvement
improvement
154
10 59
(6 A+D
+ 115B+ 33
E) (2
C+ 8
A+D) (43
C+ 16
A+D)
A= Self-Modified Diet.
B= Abandoned SED.
C= Completed Challenges.
D= Incomplete Challenges, Self-Modified Diet.
E= Incomplete Challenges, Abandoned.
Figure 3: Tree Diagram-Progress Status and Response of Respondents
24
From returned questionnaires
Respondents
65
Did not start SED Started SED
(22) (43)
Self modified Abandoned Complete Incomplete Incomplete
diet challenges challenges challenges
self modified and abandoned
(22) (0) (35) (8) (0)
Responses
Unknown No Improvement
improvement
6 10 49
(6 A+D
) (2C+ 8
A+D) (33
C+ 16
A+D)
A= Self-Modified Diet.
B= Abandoned SED.
C= Completed Challenges.
D= Incomplete Challenges, Self-Modified Diet.
E= Incomplete Challenges, Abandoned.
QUESTIONNAIRES RESULTS
Conners’ Behaviour Rating Scale for Parents

25
All children presenting to the allergy clinic were assessed for behaviour using the
Conners’ Rating Scale for Parents Questionnaire (appendix C). In the 223 children
with gastrointestinal symptoms 63% had one or more associated behaviour problems.
Significant change was assessed by comparing returned questionnaires to
questionnaires completed at initial presentation at the Allergy Clinic. Only 37
questionnaires could be matched for behaviour before and after dietary modification,
due to incomplete data concerning the patient. Some improvement was seen with all
behaviour problems assessed, however this only reached statistical significance with:
conduct (p=0.02, DF=32), impulsive-hyperactivity (p=0.0015, DF=35), somatic
(p=0.0007, DF=34), and hyperactive index (p=0.022, DF=36). No significant
improvement was seen with learning difficulties (p=0.06, DF=34) or anxiety (p=0.34,
DF=34). In no instance did the elimination diet cause deterioration in behaviours
measured by the Conners' Rating Scale for Parents. The results are summarized in
table 7.
Table 7: Conners’ Parent Behaviour Rating Scale Mean T-Scores
Behaviour Mean T-Score
at Presentation
N=37(SD)
Mean T-Score
at Follow up
N=37(SD)
Mean Difference
In T-Score
(SD)
Conduct*
Hyperactive***
Learning difficulties
Somatic***
Anxiety
Hyperactive Index*
67 (17.90)
66 (13.41)
68 (17.29)
81 (18.65)
58 (13.09)
66 (16.32)
62 (20.38)
60 (14.31)
63 (18.94)
68 (20.67)
56 (14.76)
62 (15.80)
5 ( 13.60)
6 ( 11.41)
5 ( 18.46)
13 ( 20.66)
2 ( 15.83)
4 ( 13.13)
Significant improvement in behaviour
*** P<0.001
** P<0.01
*P<0.05
Food Allergy and Intolerance Follow up Questionnaire
The Simplified Elimination Diet

26
The first question of the questionnaire (Appendix D) asked parents if their child
started the SED. Sixty-five parents responded to this question. Sixty-six percent
(n=43) started the SED. The 34% (n=22) who did not start the SED were then asked
(Q13) to explain the reasons for not starting the elimination diet. In the 22 children
who did not start SED the reasons for not starting were: child refused 36%, too sick
23%, and too difficult 41%.
Parents were asked when they started their child on the elimination diet (Q2). Sixteen
parents responded to the question. The majority (67%) of children started within 3-6
months, and the range was 1-36 months.
Parents were asked (Q3) if they noticed any improvement in their child’s symptoms
with the SED. Forty-three parents responded to this question. Forty-one children
(95%) noticed an improvement. Half began to notice an improvement within one to
seven days (range 1-56 days). The results are summarized in Table 8. Two (5%)
children did not show an improvement in symptoms and their parents were then asked
(Q12) how long they persisted with the elimination diet. Both persisted up to 6-7
weeks before deciding that the SED was not helping. Both then went back to their
normal diet.
Table 8: Time Taken to Notice Improvement on SED
Days % of Respondents
(N=41)

27
1-7
8-14
15-21
22-28
29-35
36-42
43-49
50-56
51
17
15
2
5
8
0
2
Thirty-seven parents responded to question five and six about the occurrence of
withdrawal symptoms on the SED. Fifty-one percent of children had withdrawal
symptoms. Sixteen parents responded to part two and three of question five about
when and how long withdrawal symptoms occurred. The majority (76%) of
withdrawal symptoms occurred within one to seven days (range 1-35 weeks) of
starting the SED. Withdrawal symptoms for over half the children lasted one to seven
days (range 1-27 days). The results are summarized in table 9.
Table 9: Withdrawal Symptoms on the SED
Days When Withdrawal Occurred.
% of Respondents
(N=16)
How Long Withdrawal Lasted.
% of Respondents
(N=16)
1-7
8-14
15-21
22-28
29-35
76
6
6
6
6
56
19
19
6
0
Thirty-seven parents recorded how long it took for their children’s symptoms to settle
before they could start the SED (Q6). Forty-one percent settled within the first two

28
weeks, and 47% settled within 2-6 weeks. The range was 1-84 days. The results are
summarized in table 10.
Table 10: Time Taken for Symptoms to Settle before SED was started
Days % of Respondents
(N=37)
1-7
8-14
15-21
16-28
29-35
36-42
43-49
50-56
57-63
63+
22
11
8
19
14
14
0
5
2
5
Food/Chemical Challenge Results
Forty-three parents who started the SED answered the questions (7 and 8) regarding
the taking of challenges on the SED. Eighty-one percent (n=35) did do the challenges,
and 19 % (n=8) did not start. Of the 35 children who did the challenges 63 % (n=22)
did the food challenges, 8 % (n=5) did the capsule challenges and 12 % (n=8) did
both.
For question 9, parents were asked how long it took to do the challenges. Thirty
parents responded, the majority taking 9-12 weeks (range 3-52 weeks) to do the
challenges. The results are summarized in table 11.
Table 11: Time Taken To Do Challenges in the SED

29
Weeks % of Respondents
(N=30)
1-4
5-8
9-12
13-16
17-20
21-24
25+
10
3
30
7
7
27
17
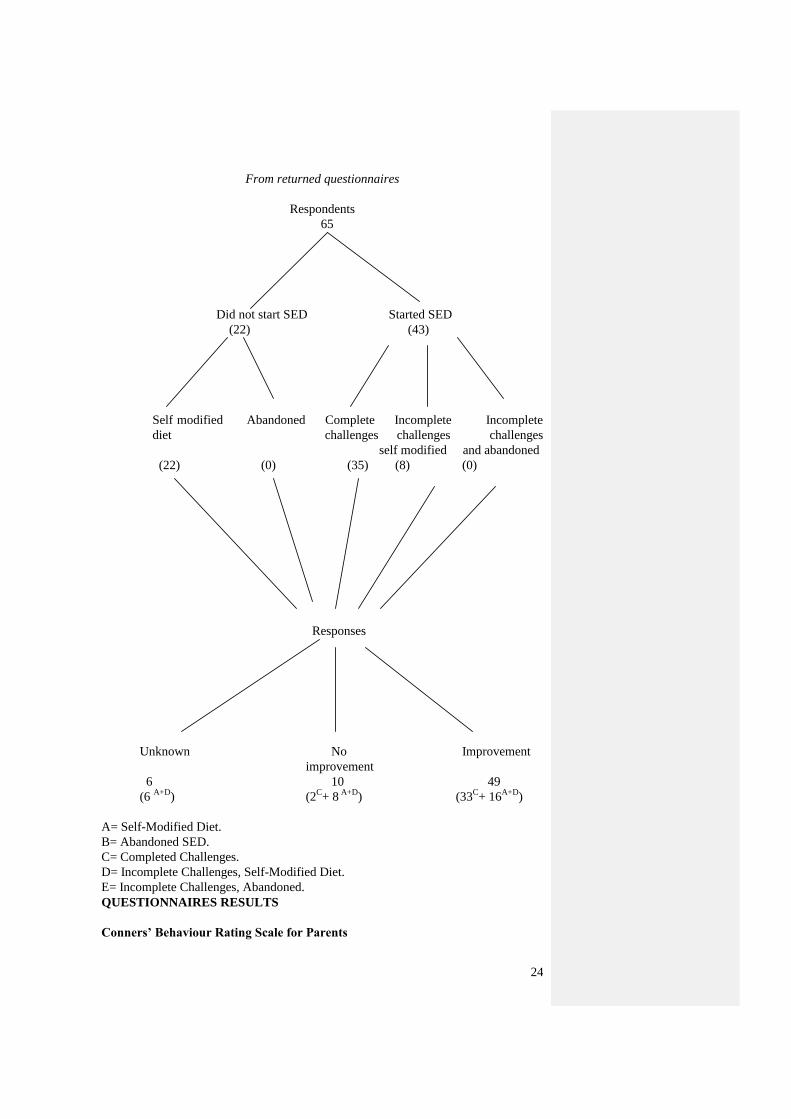
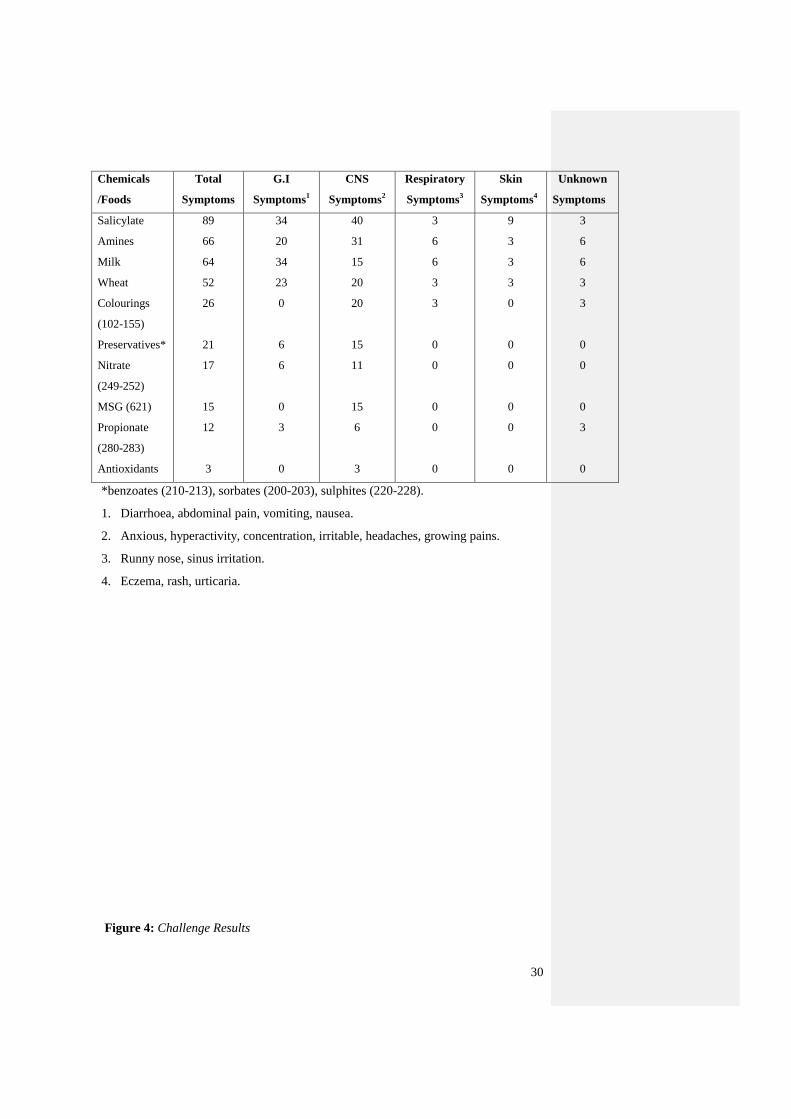
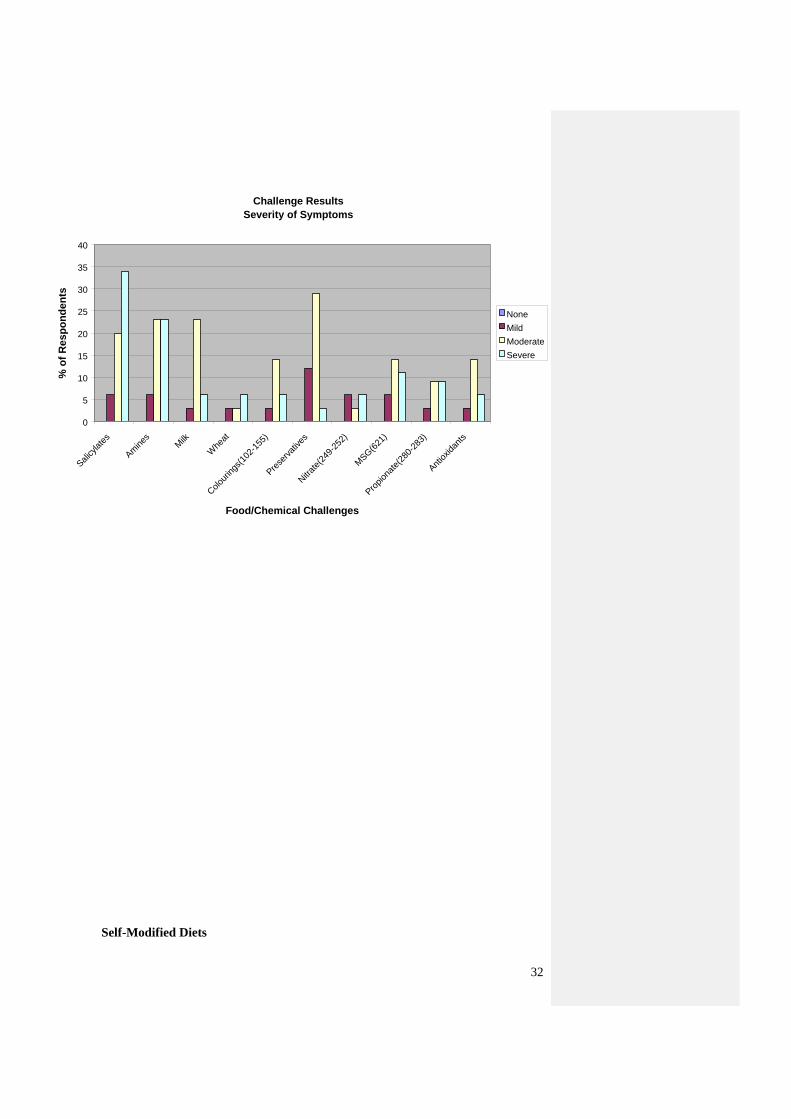
Thirty-five parents responded to question 11 about their results from doing
food/chemical challenges in the SED. Parents were also asked to list their child’s main
symptoms and severity to each challenge. The results of the challenges show that
salicylates (89%), amines (66%), milk (64%), and wheat (52%) were the main
chemicals/foods to provoke symptoms, notably gastrointestinal symptoms and central
nervous system symptoms. The main gastrointestinal symptoms were diarrhoea and
abdominal pain. Central nervous system symptoms of hyperactivity and irritability
provoked by the four main chemicals/foods as well as by colourings. Of the 35
patients the results of the food challenges are summarised in table 12 and figure 4.
Individual symptoms in each symptom group are shown in figure 5-8 (Appendix H).
Most parents rated their children's symptoms as severe or moderate. The results are
summarized Figure 9.
Table 12: Challenge Results % of Positive Reactions in Respondents (N=35)
30
Chemicals
/Foods
Total
Symptoms
G.I
Symptoms1
CNS
Symptoms2
Respiratory
Symptoms3
Skin
Symptoms4
Unknown
Symptoms
Salicylate
Amines
Milk
Wheat
Colourings
(102-155)
Preservatives*
Nitrate
(249-252)
MSG (621)
Propionate
(280-283)
Antioxidants
89
66
64
52
26
21
17
15
12
3
34
20
34
23
0
6
6
0
3
0
40
31
15
20
20
15
11
15
6
3
3
6
6
3
3
0
0
0
0
0
9
3
3
3
0
0
0
0
0
0
3
6
6
3
3
0
0
0
3
0
*benzoates (210-213), sorbates (200-203), sulphites (220-228).
1. Diarrhoea, abdominal pain, vomiting, nausea.
2. Anxious, hyperactivity, concentration, irritable, headaches, growing pains.
3. Runny nose, sinus irritation.
4. Eczema, rash, urticaria.
Figure 4: Challenge Results

31
Figure 9: Severity of Symptoms
Challenge Results
0
20
40
60
80
100
120
Salicylat
e
Am
ines
Milk
Whe
at
Colou
rings
(102
-155
)
Pre
serv
atives
Nitr
ate(
249-
252)
MSG (6
21)
Pro
pion
ate(
280-
283)
Ant
ioxida
nts
Chemical/Food Challenges
% o
f R
esp
on
den
ts
GI
CNS
Respiratory
Skin
Unknown
None
32
Self-Modified Diets
Challenge Results
Severity of Symptoms
0
5
10
15
20
25
30
35
40
Salicylat
es
Am
ines
Milk
Whe
at
Colou
rings
(102
-155
)
Pre
serv
atives
Nitr
ate(
249-
252)
MSG(6
21)
Pro
pion
ate(
280-
283)
Ant
ioxida
nts
Food/Chemical Challenges
% o
f R
es
po
nd
en
ts
None
Mild
Moderate
Severe

33
Parents who did not place their child on the SED were asked to answer whether they
modified their child’s diet based on information received at the clinic (self-modified).
Thirty parents responded affirmatively to this question (consisted of 22 parents who
did not start the SED and 6 who started the SED but did not complete it).
Modification of the diet involved avoiding or reducing suspected food/chemical
intolerants in the diet.
Improvement of Symptoms and Severity on Dietary Modification
All parents were asked (Q14) to rate their child’s symptoms as mild, moderate or
severe before starting the diet, and now (follow up). Forty-seven parents responded to
this question. Of the 47 children on modified diets 22 were on self-modified diets, and
25 were on challenge-modified diets. The children on self-modified diets were
compared with those on challenge-modified diets with no significant difference in
symptoms or severity. The results are summarised in table 13. Therefore the following
results on symptoms and severity are looked at as a group.
Both those children on self-modified and challenge-modified diets had a significant
improvement in most of their symptoms from presentation to follow-up. Learning
difficulties and a runny nose’s did not improve with dietary change. Table 13 and
figure 10 shows a summary of the results.
At presentation most parents rated their children's symptoms moderate or severe. On
follow-up most children had mild or no symptoms. Severity of symptoms was
presented in figure 11 and 12 (Appendix I: Severity of symptoms on self-modified and
challenge-modified diets, figures 11.1-11.4).
Table 13: Improvement in Symptoms (N=47)

34
Symptoms
Significance Level
Symptoms Before SED to
Follow-up
P value(DF=1)
Significance Level
Between self and
challenge modified Diets
P value(DF=1)
Gastrointestinal
Diarrhoea
Cramps/colic
Reflux
Mouth Ulcer
Central Nervous System
Behaviour
Headaches
Growing Pain
Learning Difficulties
Upper Airway
Ear Infection
Blocked Nose
Runny Nose
Skin
Eczema
<0.001
<0.001
=0.01
<0.05
<0.001
<0.001
<0.001
0.10 (NS)
<0.001
<0.05
0.21(NS)
<0.001
0.1(NS)
0.3(NS)
0.8(NS)
0.4(NS)
0.1(NS)
0.3(NS)
0.1(NS)
0.1(NS)
0.3(NS)
0.2(NS)
0.2(NS)
0.3(NS)

35
Figure 10: Change in Symptoms over the Three-Time Period
Percentage of Children Experiencing Varying Degrees of Symptoms
Over the Two Time Periods
0
20
40
60
80
100
120
Diarrh
oea/
Loos
e Sto
ols
Pain/
Cra
mp/
Colic
Ref
lux
Mou
th U
lcer
s
Beh
aviour
Pro
blem
s
Hea
dach
e
Lear
ning
Diff
icultie
s
Leg/
Gro
wing
Pains
Ear
Infe
ction
Block
ed N
ose
Run
ny N
ose
Ecz
ema
Symptoms
% o
f R
es
po
nd
en
ts
Before
Now

36
Figure 11: Severity of Symptoms before Dietary Modification
Severity of Symptoms Before Dietary Modification
0
5
10
15
20
25
30
35
40
45
50
Diarrh
oea
Abd
ominal P
ain
Ref
lux
Mou
th U
lcer
s
Beh
aviour
Hea
dach
es
Lear
ning
Diff
icultie
s
Gro
wing
Pains
Block
ed N
ose
Ear
Infe
ction
Run
ny N
ose
Ecz
ema
Symptoms
% o
f R
es
po
nd
en
ts
Severe
Moderate
Mild
None

37
Figure 12: Severity of Symptoms at Follow-Up
Severity of Symptoms Now
0
5
10
15
20
25
30
35
40
45
Diarrh
oea
Abd
ominal P
ain
Ref
lux
Mou
th U
lcer
s
Beh
aviour
Hea
dach
es
Lear
ning
Diff
icultie
s
Gro
wing
Pains
Block
ed N
ose
Ear
Infe
ction
Run
ny N
ose
Ecz
ema
Symptoms
% o
f R
esp
on
de
nts
Severe
Moderate
Mild
None

38
Level of Dietary Restriction
Parents were asked if they currently had their child on a modified diet (Q15). Fifty-
five parents responded to this question, and 82 % (n=45) of parents still had their
child on a modified diet. They were also asked to state the level of restriction of
chemicals and foods in their child’s diet. Fifty-one parents responded to this question.
Of the 51 who responded, 24 were on self-modified diets and 27 on challenge-
modified diets. There was no significance difference between both groups and their
levels of restriction. Both groups highly restricted salicylates, milk, additives, and
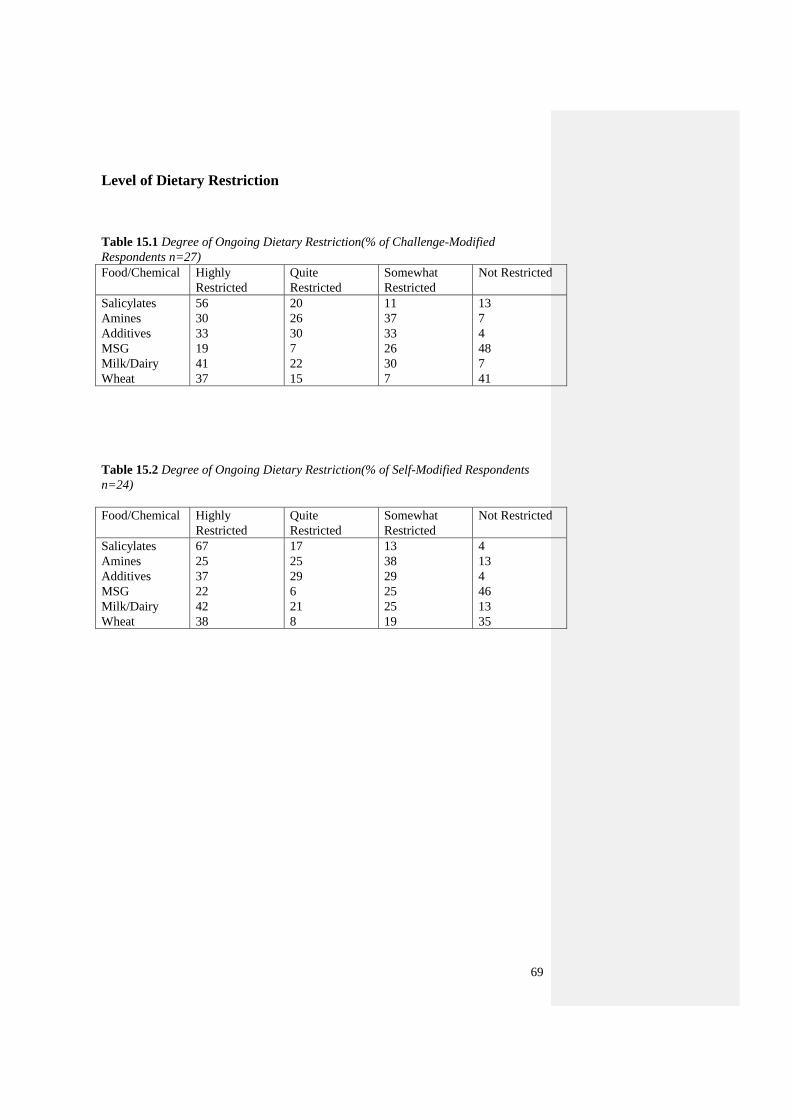
wheat (Appendix J tables 15.1-15.2). There was a significant difference between
individuals on each level of dietary restriction (DF=3, p=0). The results are
summarised in table 14.
Table 14: Degree of Ongoing Dietary Restriction (% of Respondents n=51).
Food/
Chemicals
Highly
Restricted
Quite
Restricted
Somewhat
Restricted
Not
Restricted
Significance Difference
Between Self and Challenge
Modified Diets
P Values (DF=1)
Salicylates
Amines
Additives
MSG
Milk/Dairy
Wheat
61
27
38
13
43
40
19
27
29
8
22
15
10
34
30
24
29
9
10
12
3
55
6
36
0.87(NS)
0.46(NS)
0.34(NS)
0.57(NS)
0.39(NS)
0.44(NS)
How Often Children Experience Food Intolerance Reactions
Fifty-one parents responded to the question about how often their child experienced
food intolerance reactions while on their modified diet (Q16). The results indicate
these reactions tended to be due to accidental exposure rather than knowingly
consuming the food or chemical. The results are summarized in table 15.

39
Table 15: Frequency of Food Reactions (% of Respondents, N=51)
Exposure Never Occasionally Fairly Often Frequently
Accidental Exposure
Knowing Exposure
14
29
37
27
31
31
18
13
Overall Improvement in Symptoms
All parents were asked if they noticed an improvement in their child’s symptoms since
coming to the clinic, and to rate their overall improvement (Q17). The 59 responses to
this question are presented in table 16, which indicates that 83% (n=49) of
respondents experienced an improvement (of these respondents 56% were on
challenge modified diets and 27% on self-modified diets). The majority (78%) being
much better or a little better once appropriate food/chemicals were avoided.
Table 16: Symptom Improvement on Modified Diet
Improvement On
Modified Diets
% of Respondents
(N=59)
Completely well
Much Better
A little Better
Same
Worse
5
47
31
17
0
The Need for Medication
Of the 57 parents who responded to question 18, 54% (n=31) reported that their
children continued to require medications to control their symptoms. The main
medications used were those for atopic problems: asthma, eczema and rhinitis. The
results are summarized in table 17.

40
Table 17: The Continuing Need for Medication
Medication % of Respondents
(N=57)
Asthma Drugs
Steroid Cream
Antihistamine
Nasal Sprays
Antibiotics
Ritalin/Dexamphetamine
72
56
49
47
26
14
Food Allergy
Fifty-two parents responded to the question about if their child tested positive to food
allergens at the clinic (Q19). Twenty nine percent (n=15) of children tested positive
for food proteins (egg and peanut), 48% (n=25) tested negative, and 23% (n=12) were
not tested.
In the questionnaire (Q21) parents were asked if their child had suffered from any
serious reactions to foods since being at the clinic. For children who had positive SPT
(n=15) to one or more food allergens at presentation, 33%(n=5) were reported to have
had a serious allergic reactions to foods to their food allergy.
Further Treatment
Of the total survey sample (n=223), 22% of parents sought further treatment
elsewhere for their children’s symptoms (Q22). The majority sought further assistance
from a psychologist. The results are summarized in table 18.

41
Table 18: Further Treatment
Further Treatment % of Respondents
(N=14)
Psychologist
Naturopath
Dermatologist
Paediatrician
65
21
7
7
Nutritional Adequacy of Modified Diets
The average nutrient intake (without supplements) of the children placed on modified
diet’s (MD) was estimated using a CSIRO food frequency questionnaire and
comparing with RDI values calculated for sex and age. The nutrition study sample
consisted of five children on a wheat free and milk free modified diet, and five
children on a modified diet which included wheat and milk. There was no significance
difference between both groups. Both groups had an average vitamin A intake below
the RDI meeting 60% and 63% of the RDI respectively from their diet alone. The milk
and wheat free group had an average calcium intake below the RDI meeting 60 % of
the RDI. Protein (207% and 204 % of the RDI) and vitamin C (221% and 215% of the
RDI) average intake was high in both the groups. The five children who had no milk
and wheat in their modified diet were taking calcium supplements and 3 were also
taking multivitamins. Of the modified diet group who included milk and wheat, two
were taking calcium and multivitamin supplements. Table 19 and figure 13 shows a
summary of the results.

42
Table 19: Mean Percentage of RDI met on Modified Diets.
Nutrients Modified Diet
n=5 (SD)
Modified Diet
No milk & wheat
N=5 (SD)
Significance
Difference
between groups
Total group
Modified Diet
n=10 (SD)
Energy
Protein
Calcium
Iron
Zinc
Sodium
Potassium
Magnesium
Phosphorus
Vitamin A
(retinol Eq)
Thiamin
Riboflavin
Niacin Eq
Vitamin C
86 ( 24.4)
204 (107.6)
81 (33.2)
108 (48.7)
101 (30.8)
113 (29.8)
94 (13.3)
116 (40.3)
133 (61.1)
63 (22.8)
120 (41.0)
123 (35.1)
113 (21.4)
215 (36.3)
98 (28.9)
247 (103.9)
60 (46.1)
113 (10.5)
116 (34.9)
96 (17.6)
82 (9.8)
149 (50.8)
103 (10.8)
60 (35.3)
112 (45.5)
115 (23.4)
127 (61.5)
221 (60.1)
0.5 (NS)
0.4 (NS)
0.3 (NS)
0.8 (NS)
0.4 (NS)
0.3 (NS)
0.2 (NS)
0.3 (NS)
0.3 (NS)
0.9 (NS)
0.7 (NS)
0.7 (NS)
0.5 (NS)
0.9 (NS)
92 (27.0)
225 (90.0)
71 (32.2)
11 (34.4)
109 (27.3)
105 (24.8)
88 (34.2)
133 (42.2)
118 (40.3)
62 (15.9)
116 (28.2)
119 (39.3)
120 (36.1)
220 (54.9)

43
Figure 13: Percent RDI Profile for Children on the Modified Diet
% RDI Profile for Children on the Modified Diet
0
50
100
150
200
250
300
prot
ein
ener
gy
calcium
phos
phor
us iron
sodium
pota
ssium
vita
min A
(tot
al re
tinol)
thiam
in
ribof
lavin
niac
in e
quivalen
t
vita
min C
mag
nesium zi
nc
NUTRIENTS
% o
f R
DI
MD(milk,wheat free)
MD
2/3 of RDI

44
DISCUSSION
This study reports on a group of children, aged 3-12 years who presented to the
Allergy Clinic for investigation of the role of food intolerance in their gastrointestinal
symptoms.
This was a retrospective observational study, based on:
1) Clinical data recorded by pediatrician/ dietitian.
2) Dietary challenge test results
3) Self-reported questionnaire information
There was a low response rate (29%). Possible reasons were:
1) 30% moved or changed address.
2) Young families-too busy to reply (know that phone call-"yes I was meaning to
reply"). However accept with alacrity the opportunity to come for a review.
3) They thought they did not fit the criteria for the study.
4) Responsive bias parents might be less likely to respond if:
-The diet did not lead to a clinical improvement,
-They were unhappy about the quality of the service provided,
-They were disinterested in dietary modification as a means of controlling
symptoms.
Had there been more time available for the study, it would have been possible to
increase the response rate by follow-up phone calls.
The first three reasons above are unlikely to influence the generalizebility of the
results. Comparing those who replied with those who did not reply to the
questionnaire, there were no significant differences in age or sex distribution. The

45
fourth reason would influence generalizeability of results; therefore generalization can
not be made. However the results provide valuable information for generating
hypothesis for future, prospective studies.
Gender and Age
In this study there was significantly more males to females. This reflects the
proportion of males to females in other studies on children with food intolerance 2,16
.
In adult studies about food intolerance there is significantly more females to males22,
29.
The majority of children presented at the clinic aged between 4-7 years (school age
years) A study by Hymans 18
shows that the 60% of children with gastrointestinal
symptoms present during the school age years suggesting a link with school associated
anxiety.
Associated Symptoms
Sixty-three percent of the children presenting with gastrointestinal symptoms also had
associated behaviour problems. The incidence of eczema (26%), asthma (20%), and
rhinitis (17%) was no different than the general population. These results do not
support the literature that reports food intolerance occurs more often in patients with
established allergic diseases such as asthma, rhinitis and eczema 5.
Family History
In the survey sample with 66 percent of mothers and 52 percent of fathers had one or
more food intolerance related symptoms. The most common symptoms for mothers
were diarrhoea/loose stools, abdominal pain and rhinitis. For fathers it was
46
diarrhoea/loose stools, rhinitis and hyperactivity. These results are consistent with
other studies 16, 32
which suggest that a family history of gastrointestinal symptoms is a
strong predictor for the development of gastrointestinal symptoms in childhood.
Graziol et al 16
found in his study that 50 percent of the children with food intolerance
had an atopic family history. It was also noted that 70% of these families had
gastrointestinal symptoms after food ingestion.
Behaviour
Sixty-three percent of the total survey respondents had gastrointestinal and
behavioural symptoms. Only six percent of these children scored highly for anxiety,
indicating that anxiety did not play a big role in these children’s gastrointestinal
symptoms. However these children scored high for somatic symptoms. Dietary
manipulation significantly improved somatic symptoms and also conduct, and
impulsive-hyperactivity. The chemicals that triggered behaviour problems were
predominantly food salicylates, amines, wheat, and colourings. Salicylates, wheat and
amines were also predominately the cause of gastrointestinal symptoms. Once these
chemicals were removed from the diet there was a significant improvement in both
behaviour and gastrointestinal symptoms.
These results support studies that have shown dietary elimination to relieve
gastrointestinal and neurotic symptoms at the same time 19
. Similar outcomes were
found in a study by Boris3 who shows that 73% of children with ADHD significantly
improved when food additives were removed from the diet. A study by Feingold 13
suggested also that natural salicylates frequently provoke hyperactivity.
47
Simplified Elimination Diet
Fifty-four percent of children completed the simplified elimination diet with 95
percent of patients recording improvement on their modified diet. Withdrawal
symptoms occurred with 50% of children on the SED. Symptoms occurred within one
to seven days (range 1-35 days), and lasted one to seven days (range 1-27 days).
Results as such have not previously documented.
Many found the SED too difficult to start. Even among those who did complete the
SED, it took the majority 3-6 months to start (range 1-36 months). However long-term
compliance was high with 95% of respondents continuing to modify their diet. Most
reactions to foods were due to accidental exposure rather than knowingly eating the
food. This type of response is well documented in a number of studies 7, 21
. Only a
small number of patients are able to successfully complete an elimination diet.
However 50-65% of those who do finish improve or are symptom free 21
and long
term compliance is about 80% 17, 26
.
Food/Chemical Intolerance and Gastrointestinal Symptoms
Salicylates, milk, wheat, and amines were the four main foods and chemicals
responsible for provoking the main gastrointestinal symptoms of diarrhoea and
abdominal pain. As a result salicylates, milk, wheat are the most highly restricted
foods and chemicals on follow up.
Stefanini et al 29
reported the same observations that food intolerance is more
commonly associated with diarrhoea and abdominal pain than other gastrointestinal

48
symptoms. Other studies also found that wheat, milk, salicylates and amines are
common triggers of diarrhoea and abdominal pain 15, 29
.
Modified Diets Symptoms and Severity
Eighty-three percent of children who modified their diet had a significant
improvement in symptoms. Forty seven percent of parents reported that their child
was much better once the identified food/chemicals were avoided.
In the paediatric population with gastrointestinal symptoms it is estimated that 39-
62% have symptoms related to intolerance 29
. Grazioli et al 16
also found a significant
improvement in children with food-related gastrointestinal symptoms after avoidance
of foods identified as precipitating symptoms.
Self-Modified versus Challenge-Modified diets
At follow-up when children on self-modified diets were compared with children on
challenge-modified, there were no significant differences in improvement of
symptoms and degree, or type of dietary restriction. These results indicate that
significant improvement and identification of foods responsible for adverse food
reactions can be achieved by the information provided to patients at the clinic.
These findings contrast with the study by Young et al 34
who found that foods patients
perceive to cause reactions at presentation are different to results of the double-blind
placebo controlled food challenges.
49
Medication
The results of this study reflected the need for additional medication to control
asthma, rhinitis and eczema. The main medications used were asthma medications
(72%), steroid cream (56%), and antihistamines (49%).
Asthma, rhinitis, and eczema can be provoked by aeroallergen such as dust, and dust
mite 7. Dietary modification alone is not always sufficient for these conditions
7.
Further Treatment
The majority of respondents who reported a need for further treatment saw a
psychologist (65%). This finding supports the study by Kellow et al 22
on adults where
patients needed dietary and/ or psychological treatment for gastrointestinal symptoms.
Some patients benefited more by treatment with both therapies.
Food Allergy
Of the 65 children who returned the questionnaires and were tested for food allergy,
38% tested positive. However food intolerance was more often the cause of
gastrointestinal symptoms then food allergy. The most common food allergens were
egg, and peanut.
These findings were consistent with those reported by Zwetchkenbaum36
who
reviewed a number of studies on food allergy/intolerance and gastrointestinal
symptoms, and found insufficient evidence that food allergy was the cause of
gastrointestinal symptoms. What he found was that food intolerance is more likely to
cause gastrointestinal symptoms. Among patients with food allergy and

50
gastrointestinal symptoms it is well documented that egg, peanut and milk are the
most common food allergens36
.
Nutritional Adequacy of Modified Diets
The average vitamin A intake was below the RDI for both groups of children
assessed, and calcium intake was below the RDI for the milk and wheat free group.
All children on the milk-free and wheat-free modified diet were taking calcium
supplements prescribed by the dietitians at the Allergy Unit. Fifty percent of all the
study children were also taking multivitamin supplements. These results reflected the
need for supervision by a dietitian to ensure nutritional adequacy of the diet.
Devlin et al 9 found similar results in children on an elimination diet who avoided
milk and received no milk substitute had a calcium intake below the RDI. A study by
Chiu 6 found the same result among children who were on the milk and wheat free
elimination diet. In addition Chiu also found vitamin A intake to be below the RDI,
and protein and vitamin C intake to be excessive.

51
CONCLUSION
This study has shown that food intolerance plays a key role in children who presented
at the allergy clinic with gastrointestinal symptoms. Identifying food intolerance with
the use of the simplified elimination diet and challenges, and modifying the diet as a
consequence, has proven in this study to be extremely beneficial in the management of
gastrointestinal and associated symptoms. However for the majority of children this
protocol was too difficult. Completion of the elimination diet required motivation and
self-discipline, and often was seen to be a ‘cure worse than the disease’. Many
parents, instead, self-modified their child’s diet based on information given at the
clinic, and apparently benefited as much as those who completed the SED. Long-term
monitoring by a dietitian is important to ensure the child receives adequate nutrition in
particular vitamin A and calcium, and dietary supplements may be necessary.
This study has highlighted a number of factors, which are commonly seen in children
with gastrointestinal symptoms and food intolerance. These are:
Reaction to food in the maternal diet.
A family history of food intolerance and gastrointestinal symptoms.
Diarrhoea and pain/cramps as the main gastrointestinal symptoms.
A range of associated symptoms of central nervous system, skin, and respiratory.
Behaviour problems often linked to abdominal pain and salicylate intake.
Wheat, milk, salicylates and or amines are common intolerances.
Chemicals/foods most commonly restricted in the diet correspond with the
chemical/food intolerances identified by challenge testing.
52
RECOMMENDATIONS (For Future Research)
Design a questionnaire or a method to obtain information from patients regardless of
progress status. The information obtained by this questionnaire does not represent
those who abandoned the SED. This is important, as there is incomplete knowledge of
long-term success of dietary modification among children with gastrointestinal
symptoms.
The long-term management of food intolerance should be supervised by a dietitian in
order to ensure adequate nutrition throughout the various stages of the growth cycle.
Regular follow up is important to help liberalise the diet as tolerance to
foods/chemicals improves.
The SED is a diagnostic tool, not a life-long cure for food intolerance. Further
investigation is required into the natural history of food intolerance among children.

53
REFERENCES:
1. Bardare, M., Vaccari, A., Allievi, E., Brunelli, L., Coco, F,De., Gaspari, G,C., and
Flauto, U.(1993) Influence of Dietary Manipulation on Incidence of Atopic Disease in
Infants at Risk. Annals of Allergy; 71: 366-371.
2. Bonamico, M., Culasso, F., Colombo, C., and Giunta, A. (1995) Irritable Bowel
Syndrome In Children : An Italian Multicentre Study, Italian Journal Gastroenterol;
Vol 27:13-20.
3. Boris, M., Mandel, F,S. (1994) Foods and Additives are Common Causes of the
Attention Deficit Hyperactive Disorder in Children. Annals of Allergy; 72: 462-468.
4. Carter, C.(1995). Dietary Treatment of Food Allergy and Intolerance. Clinical and
Experimental Allergy 25, Suppl. 1, 34-42.
5. Carter, C,M., Urbanocuicz, M., Hemsley,R.(1993) Effects of a Few Food Diet in
Attention Deficit Disorder. Archives of Disease in Childhood;69:564-568.
6. Chiu, A. (1996) Nutritional Adequacy and Dietary Compliance In Children and
Adults on Elimination Diets. (MND Research Project). Sydney: University of Sydney.
7.Clarke, L., McQueen, J., Samild, A., and Swain, A. (1996). The Dietary
management of food allergy & intolerance in children & adults. Australian Journal of
Nutrition & Dietetics.53;3.
8. David, T., Waddington, E., and Stanton, R. (1984) Nutritional Hazards of
Elimination Diets in Children with Atopic Eczema. Archives of Disease in Childhood;
59:323-325.
9. Devlin, J., Stanton, R., and David, T. (1989) Calcium Intake and Cow’s Milk Free
Diets. Archives of Disease in Childhood; 64:1183-4.

54
10. Dietitians Association of Australia Review Paper. (1996) The Dietary
Management of Food Allergy and Food Intolerance in Childrten and Adults.
Australian Journal of Nutrition and Dietetics; 52: 89-98.
11. Edwards, M. (1995). Food allergic disease. Clinical and experimental Allergy 25
Suppl. 1, 16-19.
12. Farah, D., Calder, I., Louise, B., Mackenzie, J., (1985) Specific Food Intolerance:
Its Place As A Cause Of Gastrointestinal symptoms. Gut, 26, pp. 164-168
13. Feingold, F., (1976) Hyperkinesis and Learning Difficulties Linked to Artifical
Food Colours. Americal Journal Nurs; 75: 797-803.
14. Feldman, W., Mc Grath, P., and Hodgson, C. (1985). The Use of Dietary Fibre in
the Management of Simple, Childhood, Idiopathic, Recurrent, Abdominal Pain.
American Journal of Disease in Childhood. Vol.139, pp 1216-1218.
15. Gertner, D., Tuck, J. (1994) Irritable Bowel Syndrome and Food Intolerance. The
Practitioner, July Vol.236.
16. Graziolo, G., Melzi, V., Balsomo, G., Castellucci, M. (1993) Food Intolerance and
Irritable Bowel Syndrome in Children, Minerva Pediatric,45:225-8.
17. Hunter, O., Workman, E., Jones, V. (1985) Dietary Studies. In: Gibson, P,R.,
Jewell, D,P., eds. Topics in Gastroenterology 12. Oxford: Blackwell Scientific: 305-
13.
18. Hyams, T, S. (1997) Recurrent Abdominal Pain and Irritable Bowel Syndrome in
Children. Journal of Pediatric Gastroenterology and Nutrition 25:S16-S17.
19. Idem, A. (1993) Randomised Controlled Trial Of Psychotherapy in Patients with
Refractory Irritable Bowel Syndrome. Br J Psychiatry: 163:315-21

55
20. Issenman, M, R., Hewson, S., Pirhonen, O., Taylor, W. (1987) Are Chronic
Digestive Complaints the Results of Abnormal Dietary Patterns? AJDC Vol 141,
June.
21. Jones, A., Shorthouse, M., Workman, E., Mclaughlan, P. (1982). Food
Intolerance: A Major Factor In The Pathogenesis of Irritable Bowel Syndrome., The
Lancet, November, pp 1116-117.
22. Kellow, J., and Langeluddecke, M. (1989) Advances In The Understanding and
Management of the Irritable Bowel Syndrome. The Medical Journal of Australia. July
17 Vol 151:92-96
23. Lloyd-Still, J,D. (1979) Chronic Diarrhoea of Childhood and the Misuse of
Elimination Diets. The Journal of Paediatrics ; 95(1): 10-13.
24. Loblay R,H., and Swain, A. (1989) Food Intolerance. Eds Walhquist and Truswell,
Recent Advances in Clinical Nutrition Vol2, pp.169-177 Libbey: London.
25. Lydiard, R,B. (1992) Anxiety and the Irritable Bowel Sydrome. Psychiatr. Ann.
22:612-8
26. Nanda, R., James, R., Smith, H., Dudley, C., Jewell, D. (1989). Food Intolerance
and the Irritable Bowel Syndrome, Gut, 30, pp 1099-1104.
27. Schmidt, M., and Floch, M. (1992) Food Hypersensitivity and the Irritable Bowel
Syndrome. The American Journal of Gastroenterology, Vol.87, No.1, pp18-19
28.Schwartz, R, H. (1992). Allergy, Intolerance, and Other Adverse Reactions to
Foods. Pediatric Annals 21(10), 655-674.
29. Stefanini, A., Saggioro, V. (1995). Oral Cromolyn Sodium on Comparison with
Elimination Diet in the Irritable Bowel Syndrome, Diarrheic Type. Scand. J
Gastroenterol 30: 535-541.

56
30. Swain, A, Loblay, R. and Soutter, V.(1991) The simplified elimination Diet. Dpt
of Clinical Immunology, RPAH: Camperdown.
31. Truswell, A, S., Dreosti, I,E., English, R,M., Rutishauser, I, H, E., and Palmer, N.
(1990). Recommended Nutrient Intakes Australian Papers. Australian Professional
Publications Mosman.
32. Walker, W, A. (1992). Summary and Future Directions. The Journal of Pediatrics
121(5), Suppl., S4-S6.
33.Weeke, E,R. (1992) Epidemiology of Allergic Diseases in Children. Rhinol Suppl.
13: 5-12.
34. Young, E., Stoneham, Michael., Petruckevitch, Anne.(1994) A Population Study
of Food Intolerance. The Lancet 343:1127-1129.
35. Zeiger, R, S., and Heller, S. (1995). The Development and Prediction of Atopy in
High- Risk Children: Follow- Up At Age Seven Years In a Prospective Randomized
Study of Combined Maternal and Infant Food Allergen Avoidance. Journal of
Clinical Immunology 95(6), 1179-1190.
36. Zwetchkenbaum, F, J., and Burakoff, R. (1988) Food Allergy and the Irritable
Bowel Syndrome. The American Journal of Gastroenterology; 83(9): 901-904.

57
APPENDIX A
SIMPLIFIED ELIMINATION DIET

58
APPENDIX B
INFORMATION LETTER

59
APPENDIX C
CONNERS’ BEHAVIOUR RATING SCALE FOR PARENTS

60
APPENDIX D
ALLERGY AND INTOLERANCE FOLLOW UP QUESTIONNAIRE

61
APPENDIX E
FOOD FREQUENCY QUESTINNAIRE

62
APPENDIX F
REMINDER LETTER

63
APPENDIX G
A PATIENT’S NUTRIENT SUMMARY

64
APPENDIX H
FIGURE 5-8:CHALLENGE RESULTS (Q11)

65
APPENDIX I
FIGURES 11.1-11.4: SEVERITY OF SYMPTOMS ON MODIFIED DIETS
(Q14)

66
APPENDIX J
TABLES 15.1-15.2: LEVELS OF DIETARY RESTRICTION ON MODIFIED
DIETS (Q15)
Figure 4: Challenge Results-Gastrointestinal Symptoms

67
Figure 5: Challenge Results-Central Nervous Symptoms
Challenge Results
Gastrointestinal Symptoms
0
2
4
6
8
10
12
14
16
18
Salicylat
e
Am
ines
Milk
Whe
at
Colou
rings
(102
-155
)
Pre
serv
atives
Nitr
ate(
249-
252)
MSG (6
21)
Pro
pion
ate(
280-
283)
Ant
ioxida
nts
Food/Chemical Challenges
% o
f R
es
po
nd
en
ts
Diarrhoea
Abdominal Pain
Vomiting
Nausea
Challenge Results
CNS Symptoms
0
5
10
15
20
25
Salicylat
e
Am
ines
Milk
Whe
at
Colou
rings
(102
-155
)
Pre
serv
atives
Nitr
ate(
249-
252)
MSG (6
21)
Pro
pion
ate(
280-
283)
Ant
ioxida
nts
Food/Chemical Challenges
% o
f R
es
po
nd
en
ts
Anxious
Hyperactivity
Concentration
Irritable
Headaches
Growing Pain

68
Figure 6: Challenge Results-Skin Symptoms
Figure 7: Challenge Results-Respiratory Symptoms
Respondents
Challenge Results
Skin Symptoms
0
1
2
3
4
5
6
7
Salicylat
e
Am
ines
Milk
Whe
at
Colou
rings
(102
-155
)
Pre
serv
atives
Nitr
ate(
249-
252)
MSG (6
21)
Pro
pion
ate(
280-
283)
Ant
ioxida
nts
Food/Chemical Challenges
% o
f R
es
po
nd
en
ts
Eczema
Rash
Urticaria
Challenge Results
Respiratory Symptoms
0
1
2
3
4
5
6
7
Salicylat
e
Am
ines
Milk
Whe
at
Colou
rings
(102
-155
)
Pre
serv
atives
Nitr
ate(
249-
252)
MSG (6
21)
Pro
pion
ate(
280-
283)
Ant
ioxida
nts
Food/Chemical Challenges
% o
f R
es
po
nd
en
ts
Runny Nose
Sinus Irritation
69
Level of Dietary Restriction
Table 15.1 Degree of Ongoing Dietary Restriction(% of Challenge-Modified
Respondents n=27)
Food/Chemical Highly
Restricted
Quite
Restricted
Somewhat
Restricted
Not Restricted
Salicylates
Amines
Additives
MSG
Milk/Dairy
Wheat
56
30
33
19
41
37
20
26
30
7
22
15
11
37
33
26
30
7
13
7
4
48
7
41
Table 15.2 Degree of Ongoing Dietary Restriction(% of Self-Modified Respondents
n=24)
Food/Chemical Highly
Restricted
Quite
Restricted
Somewhat
Restricted
Not Restricted
Salicylates
Amines
Additives
MSG
Milk/Dairy
Wheat
67
25
37
22
42
38
17
25
29
6
21
8
13
38
29
25
25
19
4
13
4
46
13
35

70
Challenge Modified Diets
Figure 11.1: Severity of Symptoms Before Dietary Modification
Figure 11.2: Severity of Symptoms at Follow-Up
Severity of Symptoms Before
Challenge Modified Diet
0
10
20
30
40
50
60
70
80
Diarrh
oea
Abd
ominal P
ain
Ref
lux
Mou
th U
lcer
s
Beh
aviour
Hea
dach
es
Lear
ning
Diff
icultie
s
Gro
wing
Pains
Block
ed N
ose
Ear
Infe
ction
Run
ny N
ose
Ecz
ema
Symptoms
% o
f R
esp
on
de
nts
Severe
Moderate
Mild
None
Severity of Syptoms Now
Challenge Modified Diet
0
10
20
30
40
50
60
Diarrh
oea
Abd
ominal P
ain
Ref
lux
Mou
th U
lcer
s
Beh
aviour
Hea
dach
es
Lear
ning
Diff
icultie
s
Gro
wing
Pains
Block
ed N
ose
Ear
Infe
ction
Run
ny N
ose
Ecz
ema
Symptoms
% o
f R
esp
on
de
nts
Severe
Moderate
Mild
None

71
Self-Modified Diets
Figure 11.3: Severity of Symptoms before Dietary Modification
Figure 11.4: Severity of Symptoms at Follow-Up
Severity of Symptoms Before
Self Modified Diet
0
5
10
15
20
25
30
Diarrh
oea
Abd
ominal P
ain
Ref
lux
Mou
th U
lcer
s
Beh
aviour
Hea
dach
es
Lear
ning
Diff
icultie
s
Gro
wing
Pains
Block
ed N
ose
Ear
Infe
ction
Run
ny N
ose
Ecz
ema
Symptoms
% o
f R
esp
on
de
nts
Severe
Moderate
Mild
None
Severity of Symptoms Now
Self Modified Diet
0
5
10
15
20
25
Diarrh
oea
Abd
ominal P
ain
Ref
lux
Mou
th U
lcer
s
Beh
aviour
Hea
dach
es
Lear
ning
Diff
icultie
s
Gro
wing
Pains
Block
ed N
ose
Ear
Infe
ction
Run
ny N
ose
Ecz
ema
Symptoms
% o
f R
esp
on
de
nts
Severe
Moderate
Mild
None