The Role of EVs in Saving fuel: STEPS study on PEV global ...
22
The Role of EVs in Saving fuel: STEPS study on PEV global potentials to 2030 GFEI Session, ITF Leipzig, May 27, 2015 www.steps.ucdavis.edu Lew Fulton, Co-Director, Sustainable Transportation Energy Pathways (STEPS), UC Davis H 2
Transcript of The Role of EVs in Saving fuel: STEPS study on PEV global ...

The Role of EVs in Saving fuel:
STEPS study on PEV global potentials to 2030
GFEI Session, ITF Leipzig, May 27, 2015
www.steps.ucdavis.edu
Lew Fulton,Co-Director, Sustainable Transportation
Energy Pathways (STEPS), UC Davis
H2

Project background
• UC Davis has been funded by FIA Foundation and ITS STEPS Program for this project
• Research team: Lew Fulton, Tom Turrentine, Gil Tal, Aria Berliner
• This project will use market analysis and diffusion theory to develop a new approach to projecting PEV sales around the world, and create a low and high scenario through 2030
• Will work with the IEA to estimate overall energy use/GHG impacts of these PEV scenarios
• Report by Autumn 2015
2
© OECD/IEA 2012
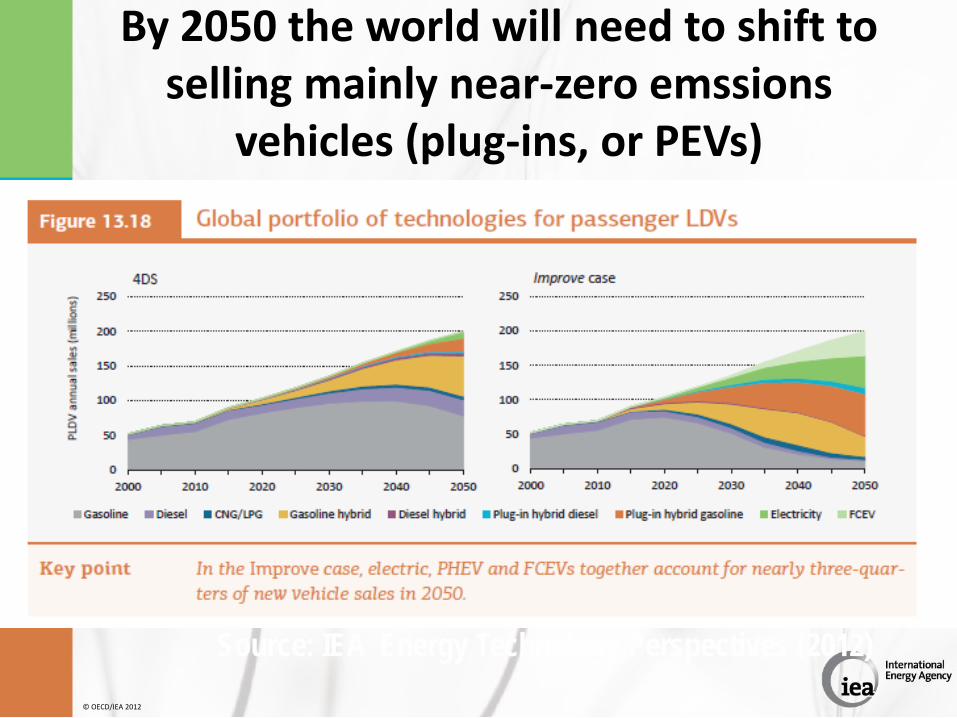
By 2050 the world will need to shift to selling mainly near-zero emssions
vehicles (plug-ins, or PEVs)
Source: IEA Energy Technology Perspectives (2012)

There exist many gobal PEV sales projections – mostly from an earlier time of exuberance…
IEA EV Outlook, 2013
4
5
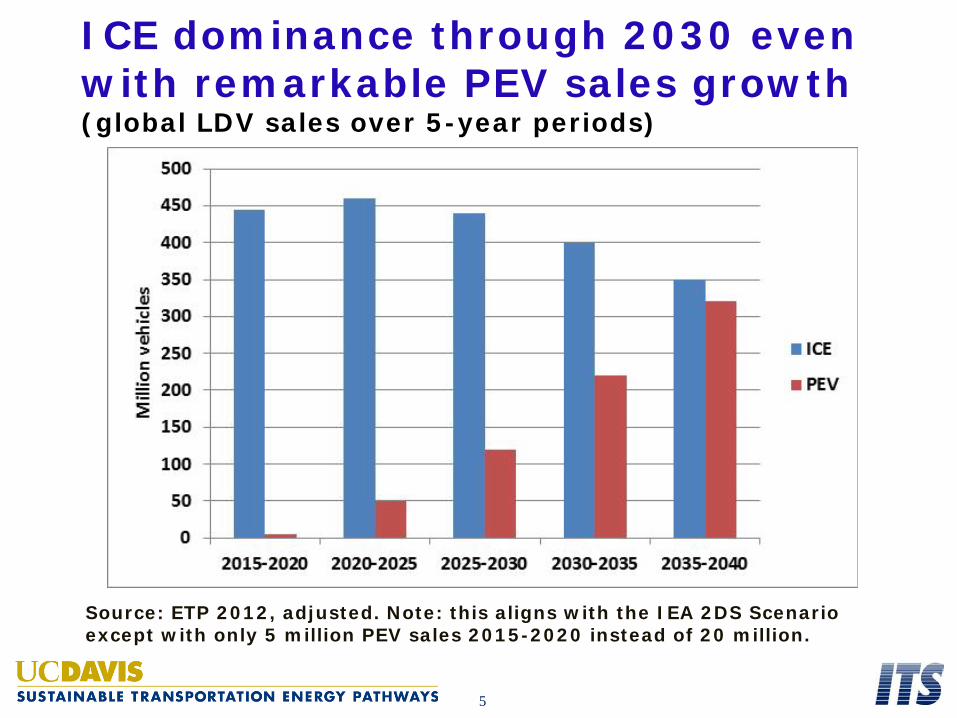
ICE dominance through 2030 evenwith remarkable PEV sales growth(global LDV sales over 5-year periods)
Source: ETP 2012, adjusted. Note: this aligns with the IEA 2DS Scenario except with only 5 million PEV sales 2015-2020 instead of 20 million.

UC Davis PH&EV Center Analysis: We are very early in a potential PEV transition
Asia
Europe 2014, 100,060, 33%
USA 2014, 119,701, 39%
Asia 2014, 85,019, 28%
2014 World EV/BEV Sales• Registered PEVs in the world will reach 1 million this year (Sept?)– .1% of 1 billion vehicles
• Annual world market about 300,000 in 2014– Should exceed 400,000 for 2015– About .5 % of 88 million
vehicles per year in 2015• Sales are concentrated in a few
“beachheads” with strong incentives- West Coast US, Northern Europe, Japan & China.– California has about 9-10% of
world PEVs sales, 2-3% of all vehicle sales
6

Top 10 World Sales leaders 1st Qtr 2015 (from EVBlogspot - Ponce)
Rank March YTD Availability US
1 Nissan Leaf BEV 6,484 13,437 Yes
2 Tesla S BEV 6,626 10,030 Yes
3 Mitsubishi Outlander PHEV 5,196 9,849 No
4 BYD Qin BEV 2,476 6,319 No
5 BMW i3 BEV & BEV/X 2,012 5,277 Yes
6 VW e-Golf BEV 1,299 3,661 2015
7 Renault Zoe BEV 1,349 3,053 No
8 Chevy Volt / Ampera PHEV 749 2,139 Yes
9 Toyota Prius Plug in PHEV 719 2,081 Yes
10 VW Golf GTE PHEV 442 2,003 2016
Total all models world 42,135 89,599
7

Global Vehicle market
1. ZEV & PEV Policy:goals, regulations & incentives
2. Research, development:demonstration & deployment
5. Early PEV users
4. PEV rollout & retail sector development
3. Infrastructure rollout& grid integration
Five sectors of PEV transition process
8

2025
Early core market:6-15% of market2020
Early market followers: 3-5% of market
First generation: vehicles, buyers &
infrastructure
20102015
Early market:1-2%
Second generation: batteries, rollout
expansion, buyers & infrastructure
Third generation: vehicles, buyers &
grid integration
Tom Turrentine sees 3 stages of PEV technology roll-out, much like we had for hybrids

Our research idea…
• Is not to “predict” or “forecast” the sales of PEVs, but explore what factors may matter in determining the trajectory, such as:– Consumer awareness, interest in different countries– Rate of new model appearance; manufacturer investments in
new models/facilities and production ramp-up rates– The size and nature of different market segments in different
countries, where PEVs are likely to appear, and how this may evolve
– Diffusion rates of models across countries– Policy overlays – the PEV-relevant policies in major markets and
their impacts on market development• We will combine these concepts into a quantitative framework that
allows us to project PEV sales to at least 2025, using a scenario approach
10

The role of market structure
• Plotting out vehicle sales by market segment/RPE to understand the distributions in different markets
• Can overlay PEV models onto this to see where they land
11

The role of market structure US LDV Sales by segment, 2013
0
0.5
1
1.5
2
2.5
3
3.5
Mill
ions
Electric /plug-in Hybrid Other
12

The role of market structure US LDV Sales by price, 2013
0.0
0.2
0.4
0.6
0.8
1.0
1.2
1.4
1.6
1.8
2.0
Mill
ions
Electric / PlugIn Hybrid Other
13
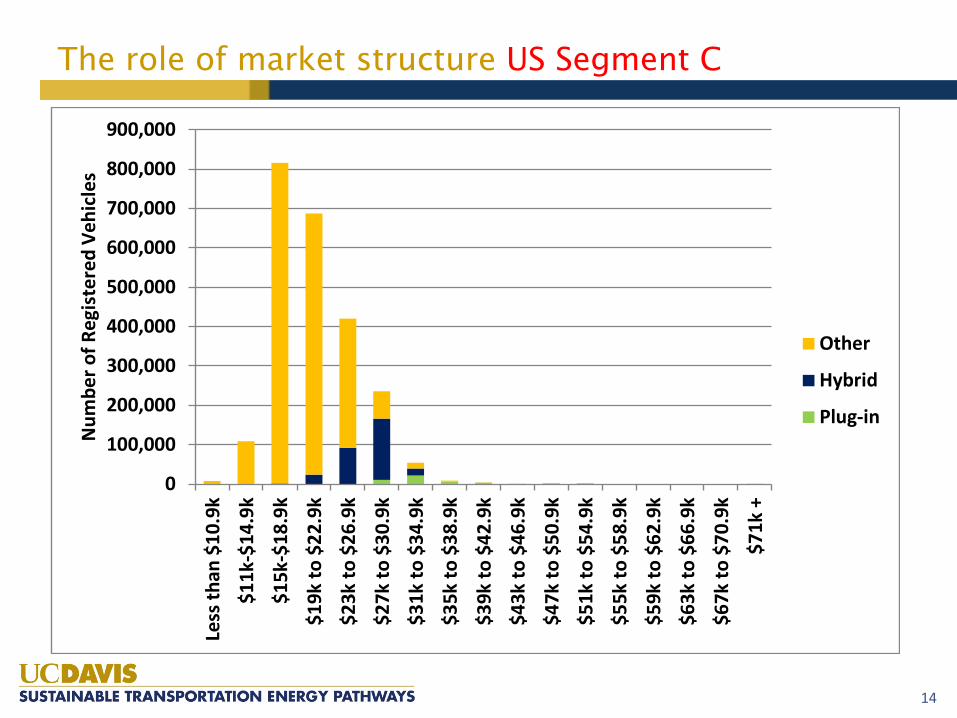
The role of market structure US Segment C
0
100,000
200,000
300,000
400,000
500,000
600,000
700,000
800,000
900,000
Less
than
$10
.9k
$11k
-$14
.9k
$15k
-$18
.9k
$19k
to $
22.9
k
$23k
to $
26.9
k
$27k
to $
30.9
k
$31k
to $
34.9
k
$35k
to $
38.9
k
$39k
to $
42.9
k
$43k
to $
46.9
k
$47k
to $
50.9
k
$51k
to $
54.9
k
$55k
to $
58.9
k
$59k
to $
62.9
k
$63k
to $
66.9
k
$67k
to $
70.9
k
$71k
+
Num
ber o
f Reg
iste
red
Vehi
cles
Other
Hybrid
Plug-in
14

Consumer behaviour
• Investigate awareness of PEVs in different countries, based on information available. Create an “awareness diffusion curve”, also called legitimation
• Relate potential demand to:– Number/percent of consumers aware of possibility of
purchasing plug-ins; percent willing to consider– Number of models available by market segment and the
sales of that segment– Price and attribute comparison of these models to average
vehicles in this segment– The policy overlay – what incentives exist in this country
that promote PEVs, improve awareness, et.
15

Manufacturer behaviour
• Snapshot of vehicle makes/models available in different countries today
• Look at sales per model, assume that future introductions occur when sales per model reach a certain level (and taking into account 3-5 year lead time)– Models will likely appear first in higher priced segments– Manufacturers will gear production toward largest markets
and those with best policy/incentive structures• Use a diffusion concept to model the rate of spread of models
and vehicle production/availability across countries
16

Role of technology
• Consider “3 phases” of PEV introduction with 2015, 2020 being start of phase 2 and 3.
• Battery cost decline – function of cumulative sales• Higher battery range – the arrival of 300 km EVs.• More public charging stations, including fast charging or
battery swapping
17
Role of policy
• For each country, estimate the impact of:– Vehicle purchase incentives– Other incentives (e.g. parking, HOV lanes)– Regulatory policies (fuel economy standards, sales
restrictions)– Support for manufacturing/introduction of models– Development of recharging infrastructure– Education/awareness campaigns
18

Putting it together
• These elements will be linked together in an iterative way –the version of this model developed in 2015 will be simplified
• We will project all LDV sales by market class in each country through 2025, the introduction and sales of new PEV models by class. This will reflect income and total LDV sales growth projections from the IEA.
• We hypothesize that our approach will tend to dampen sales projections, due to limiting factors:– Level and spread of awareness, interest in PEVs– Limited policy support in many countries– Manufacturer limits on investments, rates of new model
introduction/roll out, availability by market/class– Diffusion rate limits to new markets, new countries
19

outputs
• Develop low and high scenarios for PEV projections by country, PEV type, through 2025/2030
• Feed this into IEA Mobility Model to generate impacts in terms of electricity use, other energy use, CO2 emissions across transport. Might use this model also to apply diffusion to other countries beyond the major markets we characterize in our main study
• Show the contribution of PEVs through 2025/2030, describe what factors will be most important, how changes in policy could change trajectory
20

My hypotheses about our coming results
• Is that limits on rate of introduction of new models, rates of production, and consumer awareness will severely slow the projected rate of plug-in adoption– Consider that hybrids have been “stuck” at a few percent
per year in most countries for nearly 2 decades• We will explore how policies can be used to speed factors like:
– Consumer awareness / demand– Producer investments / diffusion
• We will try to identify “tipping points” where demand may take off (a la smartphones); this will most likely require widespread awareness, infrastructure, and better/cheaper vehicles
21

Thank you
22