The role of assay specificity in improving the diagnosis ...
54
1 The role of assay specificity in improving the diagnosis and treatment of endocrine disorders. Steven J. Soldin PhD, FACB Deputy Director Clinical Chemistry and Senior Scientist, NIH Clinical Laboratories Adjunct Professor, Department of Medicine, Georgetown University Disclosures: Steroid, 3 thyroid patents issued. Free Vitamin D3 and 1:25 dihydroxy Vitamin D3 patents pending NIH Intramural research support 2011-2015 NIH CTSA support 2000-2011 (Children’s National and Georgetown University) AACC CHICAGO 2015
Transcript of The role of assay specificity in improving the diagnosis ...

1
The role of assay specificity in improving the diagnosis and treatment of endocrine disorders.
Steven J. Soldin PhD, FACB
Deputy Director Clinical Chemistry and Senior Scientist, NIH Clinical Laboratories
Adjunct Professor, Department of Medicine, Georgetown University
Disclosures: Steroid, 3 thyroid patents issued. Free Vitamin D3 and 1:25 dihydroxy Vitamin D3 patents pending
NIH Intramural research support 2011-2015
NIH CTSA support 2000-2011 (Children’s National and Georgetown University)
AACC CHICAGO 2015

AACC CHICAGO 2015
To prescribe the right treatment, it is essential to have the correct diagnosis.
Correct diagnosis is dependent on reliable and accurate quantitation of disease markers
Disease markers need to correlate with the clinical picture.

AACC CHICAGO 2015
From colorimetric to HPLC amperometric detection for catecholamines /metabolites. Gil Hill, Bill Purdy McGill University
These assays markedly improved diagnosis and management of pheochromocytoma and neuroblastomapatients. Message: Lack of specificity in measurement changes both the means andwidens the Gaussian distributions for thenormal and diseased populations
Soldin SJ,Hill JG. Clin Chem 1980;26:291-4. Soldin SJ, Hill JG. Clin Chem. 1981;27:502-3.
Marks the beginning of lessons in specificity dating back to 1980s

AACC CHICAGO 2015
THYROID ISSUESWhy should we be interested in thyroid disorders ?
Total prevalence of hypothyroidism is 5.7% (19 million in USA).Total prevalence of hyperthyroidism is 3.1%.(10 million in USA).[European Journal of Endocrinology (2000) 143 639-647]
Endocrinologists constantly complaining about lack of correlation of free thyroid tests with TSH. CAP PT program shows major differences between different immunoassays.
Evidence is mounting that a substantial percentage of patients with hypothyroidism require T4 plus T3 replacement therapy. “Many hypothyroid patients are not tolerating and dissatisfied with LT4 treatment(palpitation, anxiety, insomnia, hypothyroid symptoms)”. Correct diagnosis depends on reliable measurement of T4, T3, FT4, FT3 and TSH.

AACC CHICAGO 2015
Suggested mechanisms of action
T4 pre-hormone…..D1 (plasma membrane)D2 (Endoplasmic reticulum)
T3 active combines with TRs in nucleus triggering biological effects
D3 plasma and nuclear membrane deactivates T3 to T2 and T4 to rT3

Spencer at. al. J Clin Endocrinol Metab 1990
FT4 vs Log TSH
AACC CHICAGO 2015
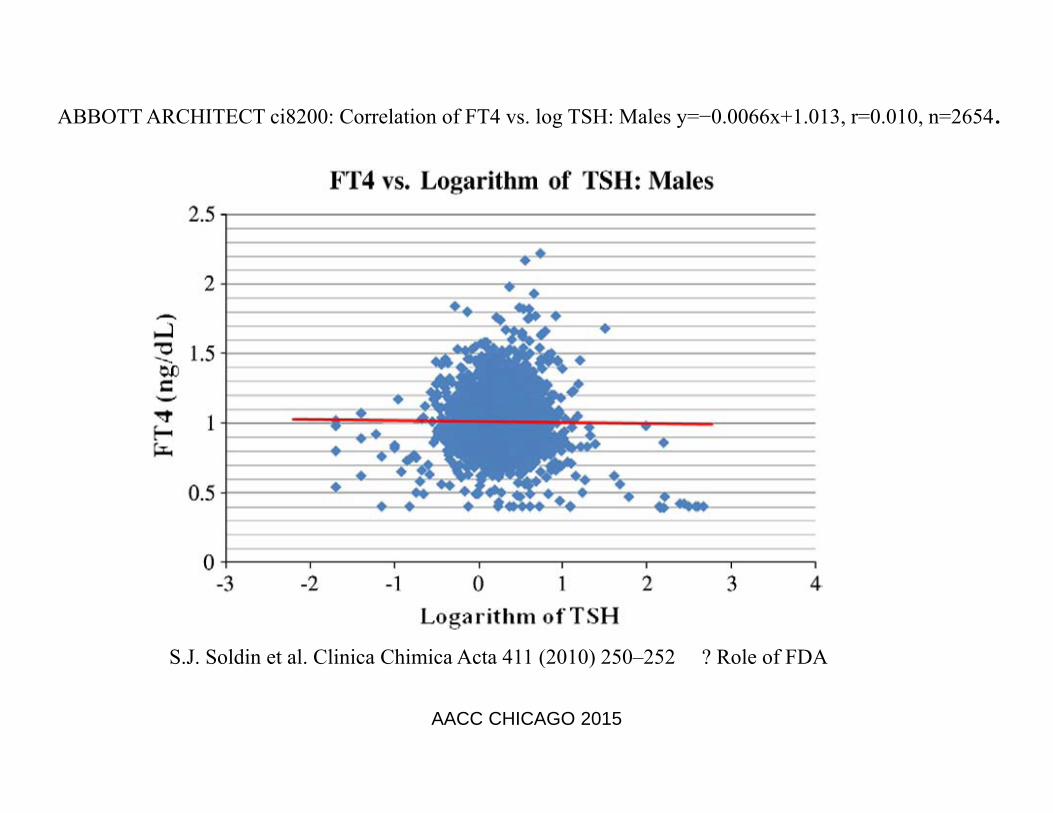
S.J. Soldin et al. Clinica Chimica Acta 411 (2010) 250–252 ? Role of FDA
ABBOTT ARCHITECT ci8200: Correlation of FT4 vs. log TSH: Males y=−0.0066x+1.013, r=0.010, n=2654.
AACC CHICAGO 2015

NIH Study 2010 n=109 UF MSMS Inverse log-linear relationship: LC-MS/MS-FT4 and Log TSHR = 0.84 (95 % CI 0.77 to 0.88)
Deventer HE ,Remaley A,Mendu DR,Soldin SJ Clin Chem 2011;57:122‐7.
AACC CHICAGO 2015

FT4 vs Log TSHIA Studies
Platform r Reference
Siemens RxL Dimension 0.48 Clin Chem. 55 (2009) 1380-1388. Studies by0.58 Thyroid. 18 (2008) 1303-1311. Soldin lab0.08 Thyroid. 18 (2008) 1303-1311.
Abbott Architect Ci8200 0.05 Clin Chim Acta. 411 (2010) 250-252.Siemens Immulite 2500 0.45 Clin Chem. 57 (2011) 122-127Beckman Coulter Access DXI 800 Unicel 0.75 CCLM 2012;50(10):1849–1852 Roche Modular E170 0.76 CCLM 2012;50(10):1849–1852 Siemens ADVIA Centaur 0.72 CCLM 2012;50(10):1849–1852
Mass Spectrometry Studies
Studies by 0.90 Clin Chem. 55 (2009) 1380-1388. Soldin lab 0.77 Clin Chem. 55 (2009) 1380-1388.
0.84 Clin Chem. 57 (2011) 122-1270.86 Thyroid. 18 (2008) 1303-1311.
AACC CHICAGO 2015

AACC CHICAGO 2015
Jonklaas J,Davidson B,Bhagat S,Soldin SJ. JAMA;2008:769-777.
POST THYROIDECTOMY TSH vs T3

AACC CHICAGO 2015
Georgetown University in and out-patient study
Soukhova N, Soldin OP, Soldin SJ. CCA 2004; 343:185-90Nguyen LT, Gu J, Soldin OP, Soldin SJ. Clin Chem 2011;57:Abstract B99,pA82
IA Siemens Immulite vs MSMS [9 vs 48 below 2.5th percentile. BIAS !! Intercept is 34 !!]

Roche 6000 T3 IA/MS comparisons at various concentration ranges
MS classifies 69 % as below 2.5th percentile. IA classifies 35% as below the 2.5th percentile
AACC CHICAGO 2015

TT3 (IA and MS) vs TSH >3.7uIU/mL
AACC CHICAGO 2015

AACC CHICAGO 2015
Georgetown in-patient study in non-thyroidal diseases.Summary:
Patients did not have underlying /overt thyroid disease
48% of the T3’s were below the 2.5th percentile when measured by MSMS
11% of them were below 2.5th percentile when measured by IA (Siemens Vista)
In-patients are on approximately 6-8 drugs.

AACC CHICAGO 2015
In-patients are on approximately 6-8 drugs.
QUESTION:
Are these multiple drug regimens affecting the deiodinases resulting in low T3’’s
See Abdalla SM and Bianco AC, “Defending plasma T3 is a biological priority” Clinical Endocrinology 2014;0:1-9
Also, Rhee et al “Thyroid functional disease: an under-recognized cardiovascular risk factor in kidney disease patients” Nephrol Dial Transplant 2014;0:1-15
Georgetown in-patient study in non-thyroidal diseases.

AACC CHICAGO 2015
70 y old woman with Hashimoto’s thyroiditis and problems converting T4 to T3:
IA results for T4,T3,FT4,FT3,TSH normal. Physicians refuse to change dose regimen as all tests normal. All FDA approved tests-poor correlation with TSH or log TSH. Patient complains of feeling sluggish and unwell.Mass Spectrometry results – good correlations with TSH3-Iodothyronamine <5pg/mL ( <5 pg/mL)T2 4.6 pg/mL (7.8-22.2 pg/mL)T3 74 ng/dL (80-166 ng/dL) LrT3 9.4 ng/dL (9.2-22.8 ng/dL) LNT4 10.0 ug/dL (4.9-10.6 ug/dL) FT4 1.9 ng/dL (1.3-2.4 ng/dL)FT3 1.8 pg/mL (1.5-6.2 pg/mL) LNT3 added to dosing regimenHer FT3 is now fine at 3.3 pg/mL (1-6) and patient better

50 y female with hypothyroidismComplains of tiredness and feeling sluggish.IA: FT4 1.0 (0.8-1.5); T3 91 (90-215); TSH 1.28 (0.4-4.0)
MSMS: FT4 2.1 ng/dL(1.3-2.4) ; FT3 1.9 pg/mL(1.5-6.0) ;T3 79 ng/dL (80-187); T4 7.1 ug/dL(4.9-10.5)
Added 12.5 ug T3 bid.
Patient reports feeling well.
AACC CHICAGO 2015

68 YEAR OLD WOMAN WITH HYPOTHYROIDISM FEELING LETHARGIC
MASS SPEC RESULTS IA RESULTSFT4 1.2 ng/dL (0.8-2.0) 1.2 ng/dL (0.8-1.5) FT3 1.5 pg/mL (1.5-6.0) 2.5 pg/mL (1.8-4.2)TT3 64 ng/dL (80-187) 99 ng/dL (90-215)rT3 8.7 ng/dL (9-21)T4 7.2 ug/dL (4.9-10.5) 8.0 ug/dL (4.5-12.5)
Heterezygous for human D2 Thr92Ala polymorphism (33-60% of population)Treatment with T3 normalized MSMS measurements and improved clinical condition. Cholesterol normalized, 220 to 160 mg/dL.JCEM 2011;96:E1527-E1533. Clinical Developmental Immunology 2012;Article ID 340542.
AACC CHICAGO 2015

Binding protein effects on FT4/FT3 by IA: 30 year old male AIDS-related Kaposi sarcoma
• Immunoassay resultsFT4 0.66 ng/dL (0.8-1.5) L Euthyroid patient, IA results do not FT3 1.41 pg/mL (1.80-4.20) L correlate with clinical condition.TSH is 3.52 uIU/mL (0.36-4.0) NT3 is 42 ng/dL (90-215) LT4 is 3.1 ug/dL (4.5-12.5) LTBG is 4.3 ug/mL (13-39) LTG is 32 ng/mL (1.6-60) N
• Mass spec results FT4 1.8 ng/dL (1.4-3.2) N Results correlate with clin symptomsFT3 1.7 pg/mL (1.5-6.0) NT4 2.4 ug/dL (4.9-10.2) LT3 25.2 ng/dL (83-168) LrT3 10.7 ng/dL (9-23) N
AACC CHICAGO 2015

56 YEAR OLD CAUCASIAN FEMALE WITH 3 YEAR HISTORY OF HYPOTHYROIDISM
She presented with lethargy, loss of energy and struggling to loose weight. BMI 29.9 kg/m2 . Patient was treated with Synthroid only and still feels lethargic, is also constipated.
Analyte MSMS ImmunoassayT4 ug/dL 13.4(5.1-11.3) 11.8 (4.5-11.7)FT4 ng/dL 1.9(1.3-2.4) 1.6 (0.9-1.7) TSH uIU/mL 2.65 (0.27-4.2) Normal T3 ng/dL 82 (80-187) [3rd %] 114 (80-200)[25th%]FT3 pg/mL 2.1 (1.5-6.2)[4th%] 2.6 (2.0-4.4)[20th%]Cholesterol mg/dL 219(<200)TBG normal, ATA and ATG below detection limitNow started on additional dosing BID with 12.5 ug T3.
AACC CHICAGO 2015

Case report continuedThe low MS FT3 and TT3 may explain the unresolved symptoms of hypothyroidism even with the now normalized FT4 and TSH. Patient was started on 12.5 ug bid T3. After 10 days of treatment all her symptoms of hypothyroidism were alleviated.
Also cholesterol dropped from 219 to 190 mg/dL.
Her 10 day post T3 treatment LC-MSMS results for FT3 and TT3 at 8am (pre-dose ) were 3.8pg/mL[1.5-6.2] and 129 ng/dL[80-187] and 2h post dose were 4.6 pg/mL and 145 ng/dL respectively.
AACC CHICAGO 2015

Wartofsky Curr Opin Endocrinol Diabetes Obes2013;20:460-466
“Perhaps 20% of hypothyroid patients treated with T4 alone continue to complain of symptoms suggesting thyroid hormone deficiency ? deiodinase polymorphisms. These patients may benefit from T3/T4 combination therapy !!”
AACC CHICAGO 2015

When patients complain and results do not correlate with the clinical picture there is usually a good reason.
What (wo)men do to (wo)men
“Do no harm”,Thomas Dunne
AACC CHICAGO 2015

FDA’s contribution to diagnostic errors• FDA has approved all the “problem” tests (IA’s for FT4,FT3,T3) without
assessing whether any of them are “clinically useful” (good correlation to: 1. log TSH and 2. clinical condition).
• One could argue that the current system provides clinicians with the wrong result thereby contributing actively to both incorrect diagnoses and subsequent treatment.
• In the low range, IA’s give false normal results in 65% of FT4’s and 50% of FT3’s and T3’s.This affects 4-6 million hypothyroid people in the USA alone. These tests therefore will account for many wrong diagnoses resulting in incorrect or no treatment with T3 when T3 treatment is warranted.
AACC CHICAGO 2015

AACC CHICAGO 2015
Summary and conclusions for thyroid hormone testing
T4 testing by immunoassay appears to be reliable.
T3 testing by immunoassay is suboptimal at low concentrations ,during pregnancy and in many in-patients.
FT4/FT3 and TT3 tests need to correlate with log TSH. The FDA has a role to play when they license IA for FT4, FT3 and TT3 .
We recommend that UF-MSMS be employed to measure FT4/FT3 for all specimens in which the TSH >95%-tile or <5%-tile. We also recommend that IA T3’s below the 10th percentile be repeated by LCMSMS.
T4,T3,FT4,FT3 tests by LCMSMS are available at commercial laboratories.

STEROID METABOLIC PATHWAY
AACC CHICAGO 2015

27
Lack of Specificity of FDA Approved Immunoassays.Data from CAP PT Program Y-A Survey 2010
Analytes Low High H/L
Testosterone (ng/dL) 83 213 (2.6)
715 1309 (1.8)
Estradiol (pg/mL) 38 366 (9.6)
274 1140 (4.2)
Progesterone (ng/mL) 4.6 6.3 (1.4)
7.4 12.5 (1.7)
17OH P (ng/dL) 765 2121 (2.8)AACC CHICAGO 2015

28
Tandem Mass Spectrometry.Data from CAP PT Program Y-A Survey 2010
Analytes Low High H/L
Testosterone (ng/dL) n=13 71 125 (1.7)
635 959 (1.5)
17OH P (ng/dL) n=11 821 1289 (1.5)
Estradiol (pg/mL) 142 184 (1.3)
n=4 NYS PT 44 152 (3.4)
Progesterone (ng/mL) 3.9 4.8 (1.2)
n=4 NYS PT 47 67 (1.4)AACC
CHICAGO 2015

29
SINGLE ANALYTE vs PROFILE
• The case of large commercial reference laboratories
• The majority of teaching hospitals have less than 1,000 beds and a single tandem MSMS performing steroid profiles would provide physicians to access >1 steroid in the panel.
• Panel testing provides the clinician with more informationSoldin SJ,Soldin OP Clin Chem.
2009;55:1061-6. AACC CHICAGO 2015

Cortisone Cortisol
Corticosterone 11-DOC
Androstendione Testosterone
17-OHPProgesterone
DHEA
Agilent Poroshell 120 EC-C8, 2.1 x 30mm, 2.7-Micron particle size analytical column.
3rd Generation Steroid Profile Assay by LCMSMSStolze BR, Gounden V, Gu J and Soldin SJ A408. Development and Validation of a High Performance Liquid Chromatography Tandem Mass Spectrometry 9 Steroid Panel using Minimal Sample Volume. Clinical Chemistry, Abstracts
2014;S133
AACC CHICAGO 2015

AACC CHICAGO 2015
ESTROGEN PROFILE ASSAY
Guo T, Gu J, Soldin OP, Singh RJ, Soldin SJ Clin Biochem, 2008;41:736-41.

AACC CHICAGO 2015
Recent new steroid profile applications
CAH
PCOS (most common gynecological endocrinopathy 7-14% of women)
Marathon running
Adrenal insufficiency (0.6%)
Diurnal effects on steroid concentrations
Neurosteroids

33
Case Study CAH: Steroid Panel• 2 day infant,normal penis, no palpable testes• 17 OH Prog >20,000 ng/dL(<100 ng/dL)• 11 Deoxycortisol 1.2 ug/dL(<0.15)• Testosterone 441 ng/dL(<10 ng/dL)• Androstenedione >11,900 ng/dL(<50 ng/dL)• Progesterone 3.31 ng/mL(<0.33 ng/mL)• DHEAS 15 ug/dL(<1.25 ug/dL)• CAH with 21 OH-ase deficiency (1 in 15 thousand births) Low
cortisol (3.8 ug/dL)• Karyotype on peripheral blood 46 XX• Early detection leads to early treatment (glucocorticoid
replacement) and avoids salt wasting crises.
AACC CHICAGO 2015

AACC CHICAGO 2015
DRUG TREATMENT OF CAHDRUG POTENCY SIDE EFFECTS
• Hydrocortisone/cortisone equipotent few• Prednisolone 5X long acting,impair growth• Dexamethasone 40-80X long acting,impair growth
Hydrocortisone preferred medication for children with CAHIf a salt-retaining hormone is needed, use fludrocortisone

Hormonal Circadian Rhythms in Patients with Congenital Adrenal Hyperplasia:
AACC CHICAGO 2015
The treatment goal in congenital adrenal hyperplasia (CAH) is to replace glucocorticoids while avoiding androgen excess and iatrogenic Cushing's syndrome.
Hormonal Circadian Rhythms in Patients with Congenital Adrenal Hyperplasia: Identifying Optimal Monitoring Times and Novel Disease Biomarkers. Debono M, Mallappa A, Gounden V, Nella AA, Harrison RF, Crutchfield CA, Backlund PS, Soldin SJ, Ross RJ, Merke DP.Eur J Endocrinol. 2015 Sep 4. pii: EJE-15-0064.

AACC CHICAGO 2015
Continuous Subcutaneous Hydrocortisone Infusion (CSHI)
Background: CAH treatment focuses on replacement of cortisol and aldosterone and prevention of ACTH – driven androgen excess. This approach is frequently inadequate.
5 patients with difficult to treat (7am 17-OHP>1200 ng/dL and androstenedione >210 ng/dL) classic CAH due to 21-hydroxylase deficiency.
Results: At 6 months all but 1 patient had 7am 17-OHPs 2-6 fold lower than baseline values.
Conclusion: CSHI is a safe and well-tolerated therapy.
Paper submitted to JCEM

PCOS STUDYANALYTE PCOS
mean (SD)CONTROLSMean (SD)
p value 2 sample t-test
p value non-parametric
HbA1c % 5.6 (0.4) 5.3 (0.4) <0.003 <0.008
ALDOSTERONE pg/mL 321 (178) 182 (110) 0.0006 0.0005
ANDROSTENEDIONE ng/dL
110 (57) 73 (45) 0.007 0.005
TESTOSTERONE ng/dL 46 (24) 26 (14) 0.0003 0.0001
PROGESTERONE ng/mL 1.3 (2.9) 2.1 (3.3) 0.32 0.024
ESTRONE pg/mL 80 (48) 53 (25) 0.008 0.05
ESTRIOL pg/mL 62 (30) 123 (49) 0.001 0.001
AACC CHICAGO 2015
DHEAS,DHEA,11-DOC,CORTICOSTERONE,17-OHP,VIT D3,ESTRADIOL p>0.1

Summary PCOS Study30 PCOS , 30 age matched controlsDHEA,DHEAS,Androstenedione,Testosterone and Aldosterone are higher in patients with PCOS. 5/30 PCOS patients had very elevated aldosterones (>550 pg/mL) some of which were due to an adrenal tumor. Conclusion: results emphasize the power of profile monitoring
AACC CHICAGO 2015

AACC CHICAGO 2015
Marathon runner study (n=51, distance 52 Km)
Hew-Butler T ,Soldin SJ et al. JCEM 2008 Jun;93(6):2072-2078.
• Pre vs post race steroid profiles• Aldosterone 6.1 to 19.7 ng/dL p<0.001• Corticosterone 226 to 3491 ng/dL p<0.001• 11-Deoxycortisol 0.03 to 0.54 ug/dL p<0.001• Cortisol 10 to 33 ug/dL p<0.001• DHEA,DHEAS and Androstenedione all
showed increases p<0.001

Box and whiskers plots of am versus pm values for males and females for the steroids: a. 11-DOC, b. Corticosterone, c. 17-OHP, d. Cortisol, e. Cortisone, f. Androstenedione, g. Testosterone vales for males only. (Mean is indicated by small square markers and median by bar in box, p<0.05 is considered statistically significant)
g
Stolze,Gounden,Gu,Soldin Clin Chem 2015:61;556-58
AACC CHICAGO 2015

Diurnal Variation for DHEA Concentration
Time of day
DH
EA
(ng/
dL)
Mean 8:00 am 566.4 ng/dLMean midnight 230.7 ng/dLMean decrease = 60%P = <0.0001n = 19
AACC CHICAGO 2015

Summary of Diurnal rhythms for steroids
• Diurnal effects are very significant for most steroids studied
• This means that it is necessary to standardize collection times and have reference intervals for 8am,8pm and midnight
AACC CHICAGO 2015
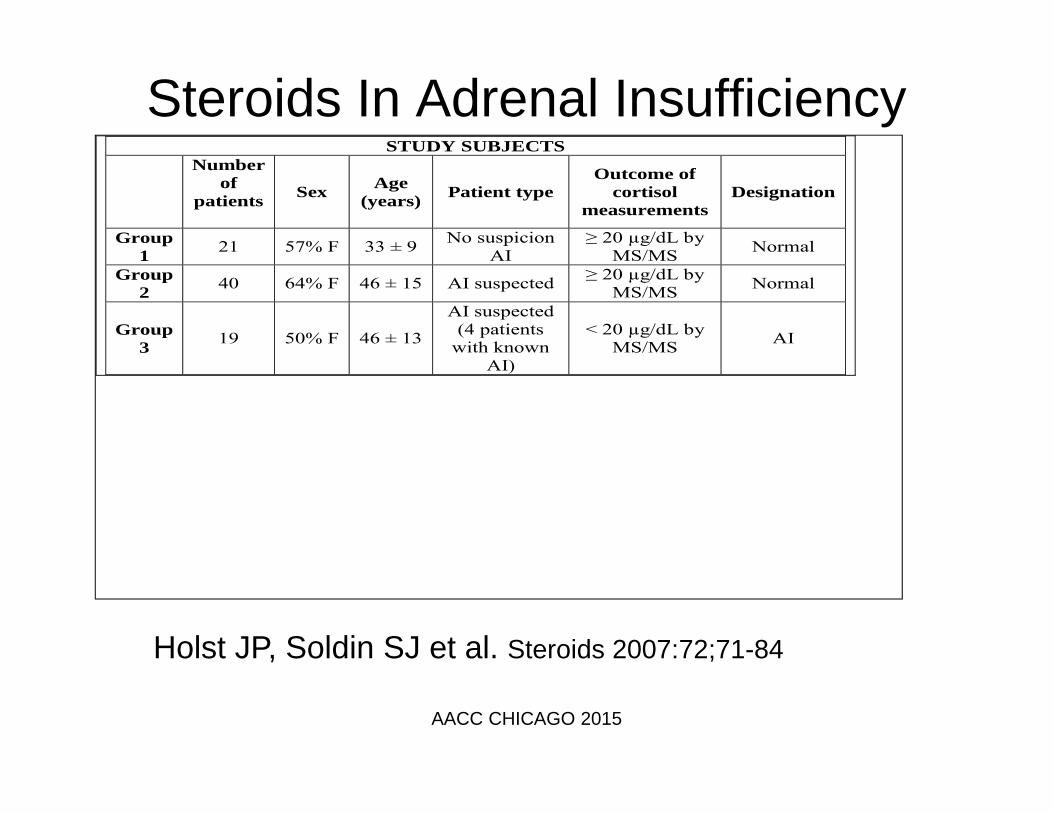
Steroids In Adrenal InsufficiencySTUDY SUBJECTS
Number of
patients
Sex Age (years) Patient type
Outcome of cortisol
measurements Designation
Group 1 21 57% F 33 ± 9 No suspicion
AI ≥ 20 µg/dL by
MS/MS Normal
Group 2 40 64% F 46 ± 15 AI suspected ≥ 20 µg/dL by
MS/MS Normal
Group 3 19 50% F 46 ± 13
AI suspected (4 patients
with known AI)
< 20 µg/dL by MS/MS AI
Holst JP, Soldin SJ et al. Steroids 2007:72;71-84
AACC CHICAGO 2015

Change in steroid hormones during an ACTH stimulation test
0
1
2
3
4
5
6
7
8
0 30 60 peak
ster
oid
horm
one
11-deoxycortisol (ng/mL)
DHEA (ng/mL)
Cortisol (µg/dL/10)
17-OH progesterone (ng/mL)
Androstenedione (ng/mL)
Progesterone (ng/mL)
AACC CHICAGO 2015

45
ACTH STIMULATION: MSMS PROFILES
AACC CHICAGO 2015

Summary of Adrenal Insufficiency Study
• Change the textbooks ! Cortisol is not the best marker to measure after ACTH stimulation
• The combination of 11 DOC, Cortisol, DHEA and Aldosterone optimizes correct classification of primary vs secondary adrenal insufficiency. Aldosterone concentrations <60 pg/mL at 30 min = primary AI
Holst JP,Soldin SJ et al. Steroids 2007:72;71-84
AACC CHICAGO 2015

Neurosteroids
AACC CHICAGO 2015
488 ng/mL
173 ng/dL

Values are mean ± SD. p = 0.33
0.0
10.0
20.0
30.0
40.0
50.0
60.0
CF NF
FAC
T-F
Scor
es
Values are mean ± SD. * p <0.01
*
FACT-F: cancer fatigue scores. All subjects are men with prostate cancer who have received radiation therapy. Fatigue and neurosteroidlevels were measured at one year after radiation therapy
Values are mean ± SD. p = 0.58
0.0
0.1
0.1
0.2
0.2
0.3
CF NF
Allo
preg
nano
lone
(ng/
ml)
0.000.200.400.600.801.001.201.401.601.802.00
CF NFD
HEA
(ng/
ml)

Studies on free vitamin D3 in our laboratory
AACC CHICAGO 2015
Suggested review: Groves et al Annual Rev. Nutr. 2014.34:117-41.

Why do we need to assess free vitamin D3 levels?
There is a poor correlation between total vitamin D3 and PTH
Some areas of clinical interest for free vitamin D3 include:
Depressive illness, Seizure disorders, Oncology, Bone diseases, Alzheimer’s disease, Schizophrenia, Autism,
Parkinson’s disease, Multiple Sclerosis, Pregnancy
AACC CHICAGO 2015

How to measure free vitamin D3Measurement of many free steroid and thyroid concentrations is easy. Why did we fail for so long to develop a method for measurement of free Vitamin D3 ?
Vitamin D3 binds to its binding protein in serum/plasma. Ultrafiltration results in a protein free ultrafiltrate. Vitamin D3 in this ultra-filtrate sticks to both glass and plastic. However, if filtered into an organic solvent it remains in solution and can be quantified.
AACC CHICAGO 2015

Time, min
Free 25OH Vitamin D32.5 pg/mL
RT = 8.00 min m/z: 383.3/229.2
Free 25OH Vitamin D3-d640 pg/mL
RT = 7.99 minm/z: 389.3/211.2
Time, min
Inte
nsity
, cps
Inte
nsity
, cps
AACC CHICAGO 2015
MS using APCI

AACC CHICAGO 2015

I love talking about nothing. It is the only thing I know anything about .
Oscar Wilde
AACC CHICAGO 2015
We are all amateurs…..we don’t live long enough to be anything else
Charlie Chaplin, Limelight
Don’t let schooling interfere with your education Grant and/or Mark Twain
Final comment on fate of creative people:
“It is the finest blades that are most easily blunted, bent or broken”