
The Road to Memory: An Early Rest for the Long Journey · The Journal of Immunology The Road to...
13
of November 26, 2018. This information is current as Long Journey The Road to Memory: An Early Rest for the Leng Tien and Yeow Tee Goh Meng-Chun Monica Shih, Shang Li, Xue Ying Wang, Sim Yi Zhao, Li Sun, Khoon Lin Ling, Mickey Boon Chai Koh, Liam Pock Ho, Pui San Yit, Lee Hui Ng, Yeh Ching Linn, http://www.jimmunol.org/content/191/11/5603 doi: 10.4049/jimmunol.1301175 November 2013; 2013; 191:5603-5614; Prepublished online 1 J Immunol References http://www.jimmunol.org/content/191/11/5603.full#ref-list-1 , 13 of which you can access for free at: cites 46 articles This article average * 4 weeks from acceptance to publication Fast Publication! • Every submission reviewed by practicing scientists No Triage! • from submission to initial decision Rapid Reviews! 30 days* • Submit online. ? The JI Why Subscription http://jimmunol.org/subscription is online at: The Journal of Immunology Information about subscribing to Permissions http://www.aai.org/About/Publications/JI/copyright.html Submit copyright permission requests at: Email Alerts http://jimmunol.org/alerts Receive free email-alerts when new articles cite this article. Sign up at: Print ISSN: 0022-1767 Online ISSN: 1550-6606. Immunologists, Inc. All rights reserved. Copyright © 2013 by The American Association of 1451 Rockville Pike, Suite 650, Rockville, MD 20852 The American Association of Immunologists, Inc., is published twice each month by The Journal of Immunology by guest on November 26, 2018 http://www.jimmunol.org/ Downloaded from by guest on November 26, 2018 http://www.jimmunol.org/ Downloaded from
Transcript of The Road to Memory: An Early Rest for the Long Journey · The Journal of Immunology The Road to...

of November 26, 2018.This information is current as
Long JourneyThe Road to Memory: An Early Rest for the
Leng Tien and Yeow Tee GohMeng-Chun Monica Shih, Shang Li, Xue Ying Wang, SimYi Zhao, Li Sun, Khoon Lin Ling, Mickey Boon Chai Koh, Liam Pock Ho, Pui San Yit, Lee Hui Ng, Yeh Ching Linn,
http://www.jimmunol.org/content/191/11/5603doi: 10.4049/jimmunol.1301175November 2013;
2013; 191:5603-5614; Prepublished online 1J Immunol
Referenceshttp://www.jimmunol.org/content/191/11/5603.full#ref-list-1
, 13 of which you can access for free at: cites 46 articlesThis article
average*
4 weeks from acceptance to publicationFast Publication! •
Every submission reviewed by practicing scientistsNo Triage! •
from submission to initial decisionRapid Reviews! 30 days* •
Submit online. ?The JIWhy
Subscriptionhttp://jimmunol.org/subscription
is online at: The Journal of ImmunologyInformation about subscribing to
Permissionshttp://www.aai.org/About/Publications/JI/copyright.htmlSubmit copyright permission requests at:
Email Alertshttp://jimmunol.org/alertsReceive free email-alerts when new articles cite this article. Sign up at:
Print ISSN: 0022-1767 Online ISSN: 1550-6606. Immunologists, Inc. All rights reserved.Copyright © 2013 by The American Association of1451 Rockville Pike, Suite 650, Rockville, MD 20852The American Association of Immunologists, Inc.,
is published twice each month byThe Journal of Immunology
by guest on Novem
ber 26, 2018http://w
ww
.jimm
unol.org/D
ownloaded from
by guest on N
ovember 26, 2018
http://ww
w.jim
munol.org/
Dow
nloaded from
The Journal of Immunology
The Road to Memory: An Early Rest for the Long Journey
Liam Pock Ho,*,†,‡ Pui San Yit,† Lee Hui Ng,† Yeh Ching Linn,† Yi Zhao,x Li Sun,x
Khoon Lin Ling,{ Mickey Boon Chai Koh,‡,‖ Meng-Chun Monica Shih,# Shang Li,#
Xue Ying Wang,** Sim Leng Tien,† and Yeow Tee Goh†,x
Central memory T lymphocytes were reported to develop after acute but not chronic infection, which prompted this feasibility study
on generating long-term CD8 T cells ex vivo, by applying a culture condition that simulates an acute infection. During 35 d of
culture, naive T cells (CD45RA+, CD127+, CCR7+, CD62L+, CXCR3+) first developed into effector T cells (CD45RA+/2,
CD127+/2, CCR7+/2, CD62L+, CXCR3+), followed by three intermediate stages: intermediate T cells 1 (CD45RO+, CD127+/2,
CCR7+, CD62L+, CXCR3+), intermediate T cells 2 (CD45RO+, CD1272, CCR72, CD62L+, CXCR3+), and intermediate T cells
3 (CD45RO+/2, CD127+, CCR7+, CD62L2, CXCR3+) before reverting to stable CD45RA+ central memory T cells (CD45RA+,
CD127+, CCR7+, CD62L+, CXCR3+). If both anti-CD3 and the inflammatory milieu persisted beyond day 10, intermediate T cells
2 gradually developed into effector memory T cells (CD45RO+, CD1272, CCR72, CD62L2, CXCR3+). Furthermore, intermediate
T cells 2 or effector memory T cells, when cultured in persistent inflammatory cytokines devoid of anti-CD3, were converted to
central memory T cells (CD45RO+, CCR7+, CD62L+). Overall, these results support ex vivo memory-like T lymphocyte produc-
tion and favor a developmental pathway including both divergent and linear relationships. The Journal of Immunology, 2013,
191: 5603–5614.
Understanding human T cell development is important forgenerating different T subsets and designing efficacioustherapy in various clinical conditions, including cancer,
chronic infections, and autoimmunity. This topic is still beingdebated after considerable research and has not been entirely re-solved. In many previous studies, investigators had taken serialsnapshots of T cell development during in vivo infections and con-structed various differentiation models, such as (1) the divergentpathway of naıve T cells (Tnaive) → effector T cells (Teff) → ef-fector memory T cells (Tem) or central memory T cells (Tcm)separately, as well as (2) the linear pathway of either Tnaive →Teff → Tem → Tcm, or Tnaive → Teff → Tcm → Tem (1, 2).From this earlier work also emerged a common definition of Tcmas CD45RO+, CD127+, CCR7+, CD62L+, and Tem as CD45RO+,CD1272, CCR72, CD62L2 (3–5). Whereas most of these studiesfocused mainly on mapping the intermittent changes in T cellsduring in vivo viral infections; we hypothesized that if we could
replicate conditions similar to these infections and follow theexact development of a single population of naive CD8 lym-phocytes, perhaps we could better delineate the differentiationpathways and produce substantial long-term memory T cells exvivo.In our study, the primary aim was to assess the feasibility of
generating memory T cells by activating human naive CD8 throughan ex vivo culture program that simulated an acute infection. Thechoice of an acute infective cycle stemmed from reports demon-strating that memory T cells were produced after acute but notchronic infection, and the two differed primarily in allowing ac-tivated cells a complete rest after resolution in acute infection(6, 7). Unfortunately, there are inadequate data in the human in-fection literature documenting a comprehensive cytokine profile,especially in the ultra early time points of an acute infection. Wedecided to model after acute murine CMV (mCMV) infection forthe following reasons: 1) mCMV infection is similar to human CMVinfection; 2) infective agents gain entry into the host cell and arepresented as endogenous Ags, which is important for CD8 activa-tion; 3) there is adequate resolution of the acute phase, althoughlatency may develop but is maintained as replicative latency, withoutproductive infection; and 4) a detailed cytokine profile for the entireacute infective period is available (8).On the basis of the published kinetics of cytokines in acute
mCMV infection, essential factors, including IL-6, IL-12, IFN-g,glucocorticoid, TGF-b, IL-15, and IL-7, were identified and theirprofiles compiled to design our in vitro culture program, desig-nated as simulated infective protocol (SIP). In this SIP program,human naive CD8 T cells were first enriched from healthy blooddonors, cultured in different cytokine conditions with phenotypicand functional features monitored closely. The culture milieu con-sisted of a common starting condition for the first 10 d, mimickingan early acute infection, but separated into three different armsthereafter. The first central memory CD45RA+ T cell (Tcmra) armconsisted of a culture condition replicating complete resolution,the second Tem arm was maintained with persistent stimulation byanti-CD3 plus inflammatory cytokines, and the third Tcm arm had
*Department of Pathology, Singapore General Hospital, Singapore 169608;†Department of Hematology, Singapore General Hospital, Singapore 169608;‡Blood Services Group, Health Sciences Authority, Singapore 169078; xDepartmentof Clinical Research, Singapore General Hospital, Singapore 169608; {Departmentof Gastroenterology, Singapore General Hospital, Singapore 169608; ‖Department ofHaematology, St George’s Hospital and Medical School, London SW17 0QT,United Kingdom; #Cancer and Stem Cell Biology Research Program, Duke–National University of Singapore, Graduate Medical School, Singapore 169857;and **Department of Biochemistry, Yong Loo Lin School of Medicine, NationalUniversity of Singapore, Singapore 117597
Received for publication May 6, 2013. Accepted for publication September 25, 2013.
This work was supported by National Medical Research Council Grant SRG-CG 04/2010 and Singapore Cancer Syndicate Grant SGH-SCS-BMTC Cell Pro and ImmuneReconstitution.
Address correspondence and reprint requests to Dr. Liam Pock Ho, Department ofPathology, Level 7, Diagnostic Tower, The Academia, Singapore General Hospital,Outram Road, Singapore 169608. E-mail address: [email protected]
Abbreviations used in this article: mCMV, murine CMV; MFI, mean fluorescenceintensity; SIP, simulated infective protocol; Tcm, central memory T cell; Tcmra,central memory CD45RA+ T cell; Teff, effector T cell; Tem, effector memory T cell;Tim, intermediate T cell; Tnaive, naıve T cell.
Copyright� 2013 by The American Association of Immunologists, Inc. 0022-1767/13/$16.00
www.jimmunol.org/cgi/doi/10.4049/jimmunol.1301175
by guest on Novem
ber 26, 2018http://w
ww
.jimm
unol.org/D
ownloaded from

only persistent inflammatory cytokines devoid of anti-CD3 stim-ulation. For the Tcmra condition, we observed the initial conversionof Tnaive to CD45RO+, which re-expressed as CD45RA later, to-gether with other conventional Tcm phenotypes (Tcmra: CD45RA+,CD127+, CCR7+, CD62L+). In the second Tem arm, Tnaive de-veloped into conventional Tem (CD45RO+, CD1272, CCR72,CD62L2) by day 28, whereas in the final Tcm arm, Tcm (CD45RO+,CD127+/2, CCR7+, CD62L+) emerged by day 14. In addition,established Tem at day 28 were convertible to Tcm when recul-tured in persistent inflammatory cytokines without anti-CD3; andthese Tem-derived Tcm would further develop into Tcmra when theculture milieu was finally modified to a complete resting condition.We have also demonstrated better survival potential and prolifera-tive capacity in Tcmra compared with Tem; together, they displayfeatures very similar to those of the CD45RA+ stem cell memoryT lymphocytes, described recently.
Materials and MethodsSimulated infective protocol
Human PBMCs were collected from healthy donors by layering collectedperipheral blood on Ficoll-Paque Plus (GE Healthcare) in 15-ml conicaltubes followed by density gradient centrifugation for 30 min at 1350 rpm.The isolated PBMCs were then cryopreserved with 20% DMSO in com-plete medium consisting of RPMI 1640 medium (Sigma-Aldrich) supple-mented with 10% FCS (HyClone), 1% penicillin/streptomycin (PAA), 1%L-glutamine (PAA), 3% HEPES (Sigma-Aldrich), and 2.4% sodium bi-carbonate (B.Braun). For naive CD8 T lymphocyte isolation, cryopreservedcells were thawed in a 37˚C water bath and washed using complete me-dium, and the total number of viable cells was counted using trypan bluesolution (Sigma-Aldrich). Cells were then sorted first by untouched CD8+
T cell enrichment (MACS; Miltenyi Biotec), followed by another round ofuntouched CD45RA+ enrichment (MACS, Miltenyi Biotec). EnrichedCD8+CD45RA+ cells were activated with 2.5 ml/106 cells anti-CD3 Dyna-beads (Invitrogen), 15 ml/106 cells anti-human NKG2D mAb (clone 149810;R&D Systems), and 15 ml/106 cells goat anti-mouse IgG microbeads (MACS,Miltenyi Biotec) and were cultured in complete medium and a profile ofvarious cytokines: dexamethasone, IFN-g (Peprotech), TGF-b1 (Peprotech),IL-6 (Peprotech), IL-7 (US Biological), IL-12 (BD Pharmingen), and IL-15(US Biological). The cytokine dose concentrations used were IL-6 (high dose20 ng/ml, medium dose 2 ng/ml, low dose 0.04 ng/ml), IL-12 (high dose 2 ng/ml), IFN-g (high dose 1000 U/ml), dexamethasone (high dose 0.4 mg/ml),TGF-b (high dose 2.5 ng/ml, medium dose 0.2 ng/ml, low dose 0.01 ng/ml),IL-15 (high dose 10 ng/ml, medium dose 5 ng/ml, low dose 2 ng/ml), and IL-7 (low dose 2 ng/ml).
Flow cytometry analysis
Cultured cells at different time points were harvested and surface stainedwithmouse anti-humanCD8 conjugated to PC5 (clone B9.11; PC5, BeckmanCoulter), CD45RA conjugated to FITC (clone HI100; FITC, eBioscience),and various test Abs: CD127 (clone R34.34; PE, Beckman Coulter), CCR7(clone 150503; PE, R&D Systems), CD62L (clone DREG-56; PE, BDPharmingen), CD45RO (clone UCHL-1; PE, BD Pharmingen), CD25(clone M-A251; PE, BD Pharmingen), CD27 (clone M-T271; PE, BDPharmingen), CD28 (clone CD28.2; PE, BD Pharmingen), CXCR3 (clone1C6/CXCR3; PE, BD Pharmingen) CD8-b (clone 2ST8.5H7; PE, BeckmanCoulter), CD161 (clone 11B8; PE, Beckman Coulter), CD314/NKG2D(clone 1D11; PE, BD Pharmingen) and CD279/PD-1 (clone MIH4; PE,BD Pharmingen). Mouse anti-human IgG Abs were also included as FITC(clone G18-145; FITC, BD Pharmingen) and PE (clone G18-145; PE,BD Pharmingen) controls. Flow cytometry analysis was performed on aBeckman Coulter XL flow cytometer, and expression of CD45RA againstvarious test Abs was plotted for CD8 gated lymphocytes using WinMDIsoftware.
For intracellular staining, cultured cells were harvested and surfacestained first with mouse anti-human CD8-PC5 and CD45RA-FITC (cloneHI100; FITC, eBioscience) or PE (clone HI100; PE, eBioscience), fixed andpermeabilized with IntraPrep Perm reagent kit (Beckman Coulter), andstained with the following mouse anti-human Abs: BCL2 (clone 124; FITC,DakoCytomation), IL-10 (clone B-N10; FITC, IQ Products), TGF-b (clone7H7; PE, LifeSpan Biosciences), granzyme A (clone CB9; FITC, BDPharmingen), granzyme B (clone GB11; FITC, BD Pharmingen), Perforin(clone dG9; FITC, eBioscience), IFN-g (clone 4S.B3; FITC, BD Phar-
mingen), IL-2 (clone MQ1-17H1;FITC, eBioscience), TNF-a (clone MAb11;FITC, eBioscience). For intracellular staining of FOXP3 marker, fixationand permeabilization steps were done using the PE Anti-Human FOXP3Staining Set (eBioscience) and stained with rat anti-human FOXP3 Ab(clone PCH101; PE, eBioscience). The strength of various test Abs, x, isexpressed as d mean fluorescence intensity (dMFI) = MFIx 2 MFI ofcorresponding murine Ig controls.
Morphology by light microscopy
During regular intervals throughout the entire culture period, cultured cellswere removed, cytospinned at 1000 rpm for 5 min (Cytopro Cytocen-trifuge), and stained with Leishman’s stain for 5–10 min, followed by lightmicroscopic analysis. Photomicrographs were taken at 3100 magnifica-tion.
Molecular analysis
According to the manufacturer’s directions, RNeasy spin column (RNeasyMini Kit, QIAGEN) was used for RNA extraction from cultured lymphocytes.The RNase-free Dnase I (QIAGEN) was used to remove the DNA contami-nation. At the last isolation step, RNAwas eluted with 40 ml RNase-free waterfrom the column. The RNA purity and concentration were detected by aNanodrop 1000 Spectrophotometer at 260 and 280 nm. For each RNA sample,cDNA was amplified from 2 mg total RNA by reverse transcription in 20-mlreactions with the High- Capacity cDNA Reverse Transcription Kit (AppliedBiosystems). Measurements of gene expression were performed on a 7500Fast Real-Time PCR system with TaqMan real-time PCR assay (AppliedBiosystems). The probe and primer set of TaqMan real-time PCR assayincludes a pair of unlabeled PCR primers and a TaqMan probe with a FAMdye label on the 59 end and minor groove binder on the 39 end. TaqManUniversal PCR Master Mix and TaqMan probe and primers were used toquantify the two gene expressions separately (TBX-21 and EOMES gene).According to the manufacturer’s directions, the TaqMan assay amplificationconsisted of an activation step (60˚C, 2 min and 95˚C, 10 min) followed by 40cycles of denaturation (95˚C, 15 s), annealing, and elongation (60˚C, 1 min).The amount of mRNA was normalized to an internal control gene (HPRT1gene). The comparative CT (2
2DCT) method was used to calculate the relativequantitation of gene expression for each sample.
Telomere length analysis
Total DNAwas extracted from the cultured cells using a DNA extraction kit(QIAGEN). Extracted DNAwas digested with HphI and MnlI, separated by0.8% agarose gel electrophoresis with 1-DNA ladder (Invitrogen), beforebeing transferred to Hybond-XL membrane (Amersham) for Southern blotanalysis. The blot was probed with [32P]-labeled (CCCTAA)6 probe andimaged by Typhoon FLA 9500. Data and measurement of the telomerelength were analyzed by the Quantity One program (Bio-Rad). Digitizedgel blots were converted to a Spectrum image for accurate determination ofthe midpoint of each band; the midpoint was back calculated against theDNA ladder to determine the telomere length in bp.
P815 redirected flow-based cytotoxicity assay
Murine P815 cells (American Type Culture Collection), as targets in thisassay, were incubated with 50 ng/106 cells OKT3 Ab (Orthoclone; Janssen-Cilag) at 4˚C for 1 h and thereafter plated together with cultured humanCD8 lymphocytes isolated at diagnosis as effectors in a 96-well plateaccording to various E:T ratios of 0:1, 0.05:1, 0.1:1, 0.25:1, 0.5:1, and 1:1for 4 h in a 5% CO2 incubator at 37˚C. After 4 h, cell mixtures werewashed first with PBS supplemented with 1% FCS and 1% 5 mM EDTA(Research Instruments) and second with Annexin V binding buffer (BDPharmingen), then subsequently stained with mouse anti-human CD45-FITC (clone J33; FITC, Beckman Coulter), rat anti-mouse CD45 (clone30-F11; PE-Cy5, BD Pharmingen), Annexin V (PE, BD Pharmingen), and7-aminoactinomycin D (BD Pharmingen) for flow cytometric analysis.Flow-Count fluorospheres (Beckman Coulter) were added to the preparedsamples for determination of absolute counts. For analysis, all CD8 lympho-cytes were selected in region R1 and all Flow-Count fluorospheres were in-cluded in R2. Expression of 7-aminoactinomycin D versus annexin V wasplotted for gated R1 lymphocytes, with quadrant 3 (Q3) representing allliving cells and absolute (Abs) counts calculated based on the number ofrecovered fluorospheres. The percent cytotoxicity was determined by (M1-M2)/M1 3 100, where M1 = Abs Q3 (for control with target alone) andM2 = Abs Q3 (for target at different E:T ratio).
CFSE proliferation assay
Tcmra and Tem were stained with 7 mM CFSE dye (CFDA SE Cell Tracerkit; Invitrogen) before plating them into a 96-well plate, activated with
5604 THE ROAD TO MEMORY
by guest on Novem
ber 26, 2018http://w
ww
.jimm
unol.org/D
ownloaded from

CD3 Dynabeads, anti-human NKG2D, and Goat Anti-Mouse IgG Microbe-ads and cultured with medium dose concentration of IL-15. They were in-cubated for 7 d in an incubator at 37˚C with 5% CO2. Flow cytometry wasperformed on day 7 postculture to determine the proliferation of lymphocytesbased on the CFSE peaks distribution. For all analyses, CFSE histogramswere plotted for gated CD8 lymphoyctes, and the percent proliferation wasdetermined by M2 region, where M2 = all lymphocytes that had undergone atleast one round of proliferation.
CFSE suppression assay
Postsorted naive CD8+ T cells (EasySep, STEMCELL) were used as re-sponder cells and stained with 7 mM CFSE dye (CFDA SE Cell Tracer kit,Invitrogen), then activated with 50 ng/106 cells OKT3, 15 ml/106 cellsmonoclonal anti-human NKG2D, and 15 ml/106 cells goat anti-mouse IgGmicrobeads and cultured with 5 ng/ml IL-15 before plating them in a 96-well plate. Suppressor cells were then added in the suppressor-to-responderratios of 0.05:1, 0.1:1, 0.2:1, and 1:1. Responder-only 0:1 and suppressor-only 1:0 ratios were included as controls, and the plate was incubated for7 d in an incubator at 37˚C with 5% CO2. Cell mixtures were harvested onday 7 postculture and surface stained with mouse anti-human CD8 con-jugated to PC5 to determine the proliferation of lymphocytes based on theCFSE peaks distribution on CD8-PC5 gated cells. Flow-Count fluoro-spheres (Beckman Coulter) were also added to the prepared samples fordetermination of absolute counts. For analysis, all murine mastocytomacells were selected in region R1 and all Flow-Count fluorospheres wereincluded in R2. CFSE expression histograms were plotted for gated R1cells, absolute counts were calculated based on the number of recoveredfluorospheres, and percent proliferation was determined by (M2 2 M1)/M2 3 100, where M2 = absolute count of all CFSE+ Tnaive cells, M1 =absolute count of first peak of Tnaive cells on the extreme right. Sub-sequently, the calculated percent suppression = (% proliferation for S:R0:1 2 % proliferation for S:R 1:1)/(% proliferation for S:R 0:1).
ResultsSimulated infective protocol
The key factors identified for SIP were anti-CD3 as first signal,anti-NKG2D as second costimulatory signal, and the third signalfrom the cumulative culture milieu, including IL-6, IL-12, IFN-g,dexamethasone, TGF-b, IL-15, and IL-7. The entire cycle lasted∼ 35 d, with the first 10 d being identical for all three arms (Fig.1A). During these 10 d, the essential cytokine profile consisted ofa single IL12 peak on day 0, double IL-6 peaks on day 0 and day7, double IFN-g peaks on day 0 and day 8, a single dexamethasonepeak on day 1, single TGF-b peak on day 7, and gradual increasein IL-15 from day 0 to day 7 (9–15). Thus, 1) on day 0, high-doseIL-6, IL-12, IFN-g, but low-dose IL-15, were added; 2) on day 1,high-dose dexamethasone with additional medium and low-doseIL-15 were added; 3) on day 3, all cytokines were washed awayand reconstituted with only low-dose IL-15; 4) on day 4, medium-dose IL-6 and TGF-b were added but progressively increased tohigh-dose IL-6, TGF-b, and IL-15 on day 7; 5) additional anti-CD3 beads were added only on day 7 because it remained attachedfor ∼ 7 d; 6) on day 8, high-dose IFN-g and IL15 were added.After day 10, all cytokines were washed off and three differentconditions were reconstituted thereafter. In the Tcmra condition,cells were maintained in low-dose IL-6, TGF-b, IL-15, and IL-7,whereas the Tem condition was persistent stimulation by anti-CD3,high-dose IL-6 and medium-dose IL-15, and the Tcm condition wasmaintenance in high-dose IL-6 and medium-dose IL-15 only (16–21). For clarification of the reagent schedule, please refer to Fig. 1B.Longitudinally, SIP for Tcmra can also be divided into four phases:priming from day 0 to day 3, expansion from day 3 to day 10,contraction from day 10 to day 28, and resolution after day 28.
Morphology and immunophenotype
For the morphological changes during priming to activation phase,Tnaive initially divided and developed blastoid features with prom-inent nucleoli and displayed more vacuolations as well as intra-cytoplasmic granules (Fig. 2A). By day 10, before conversion to
the contraction phase, more lymphocytes began to form cyto-plasmic extensions, resulting in an elongated shape. During thecontraction and resolution phases of Tcmra development, lym-phocytes progressively reverted to round and blastoid morphology.Similarly, Tcm cultured only with inflammatory cytokines alsodemonstrated blastoid morphology with prominent nucleoli. How-ever, in Tem under the influence of continuous anti-CD3 and in-flammatory stimulations, elongated and activated cytomorphologypersisted.After priming, Tnaive (CD45RA+, CD127+, CCR7+, CD62L+,
CXCR3+) developed into Teff (CD45RA+/2, CD127+/2, CCR7+/2,CD62L+, CXCR3+) on day 3 (Figs. 2B). By day 7, Teff expandedinto intermediate T cell (Tim) 1 (CD45RO+, CD127+/2, CCR7+,CD62L+, CXCR3+) and further converted between day 7 and day10, into Tim2 (CD45RO+, CD1272, CCR72, CD62L+, CXCR3+).For the Tcmra arm between day 10 and day 21, Tim2 graduallychanged into Tim3 (CD45RO+/2, CD127+, CCR7+, CD62L2,CXCR3+). During the final resolution phase, Tim3 reverted andremained stable Tcmra (CD45RA+, CD127+, CCR7+, CD62L+,CXCR3+) by day 31 and, on longest follow-up, to day 45. How-ever, if Ag and inflammatory stimulation persisted after day 10for the Tem arm, Tim2 gradually developed into Tem (CD45RO+,CD1272, CCR72, CD62L2, CXCR3+) by day 28 (Fig. 3A).Throughout this period, Tcmra remained CD27+ and CD28+, butTem were CD27+ and lost CD28 expression progressively. Finally,for the Tcm arm, Tim2 at day 10 will convert to Tcm (CD45RO+,CD127+/2, CCR7+, CD62L+) by day 14.To assess the development of Tem in the absence of antigenic
and/or inflammatory stimulation, the Tem condition was washedoff after day 33 and changed to low-dose IL-6, TGF-b, IL-15, andIL-7, similar to the Tcmra resting condition (Fig. 3B). Over thefollowing week, Tem began to upregulate CD45RA, CCR7, andCD62L and demonstrated the ability to revert to Tcmra by day 44.Furthermore, the number of Tem surviving this Tcmra conversionwas lower than for those undergoing direct Tcmra generation.Besides subjecting Tem to the resting milieu, Tem after day 33
were also recultured in the Tcm condition, that is, high-dose IL-6and medium-dose IL-15 without anti-CD3. Similar to the Tcmgenerated directly after day 10, Tem were converted to the Tcmphenotype by re-expressing CCR7 and CD62L between days 40and 45. If these Tem-derived Tcm were further cultured in low-dose IL-6, TGF-b, IL-15 and IL-7, they will develop the Tcmraphenotype re-expressing CD45RA.
Survival potential and secondary activation
For the comparison of Eomes and Tbet expression, we observed anEomes/Tbet mRNA ratio of 0.88 6 0.32, 1.05 6 0.15, and 0.13 60.03 for day 0 Tnaive, day 33 Tcmra, and day 33 Tem, respec-tively (Fig. 4A), thus demonstrating comparable Eomes domi-nance in both Tnaive and Tcmra, but Tbet dominance in Tem.Next, we compared the relative telomere length of day 33 Tcmraand day 33 Tem against Tnaive as baseline and found Tcmra tobe 580 6 118 bp longer than Tem (Fig. 4B). BCL2 expressionwas also investigated, and the assessment of intracellular BCL2by flow analysis in day 0 Tnaive, day 33 Tcmra, and day 33 Temshowed a dMFI value of 33.6 6 11.8, 73.8 6 5.8, and 90.9 6 6.5,respectively (Fig. 4C). There was a higher BCL2 expression inboth memory subtypes of Tcmra and Tem compared with Tnaivelymphocytes.In determining the proliferative capacity, we first demonstrated
the presence of NKG2D on both day 33 populations as a suitablecostimulator for secondary activation, then proceeded to comparethe proliferative potential between day 33 Tcmra and day 33 Temby activating both populations with anti-CD3, anti-NKG2D, and
The Journal of Immunology 5605
by guest on Novem
ber 26, 2018http://w
ww
.jimm
unol.org/D
ownloaded from
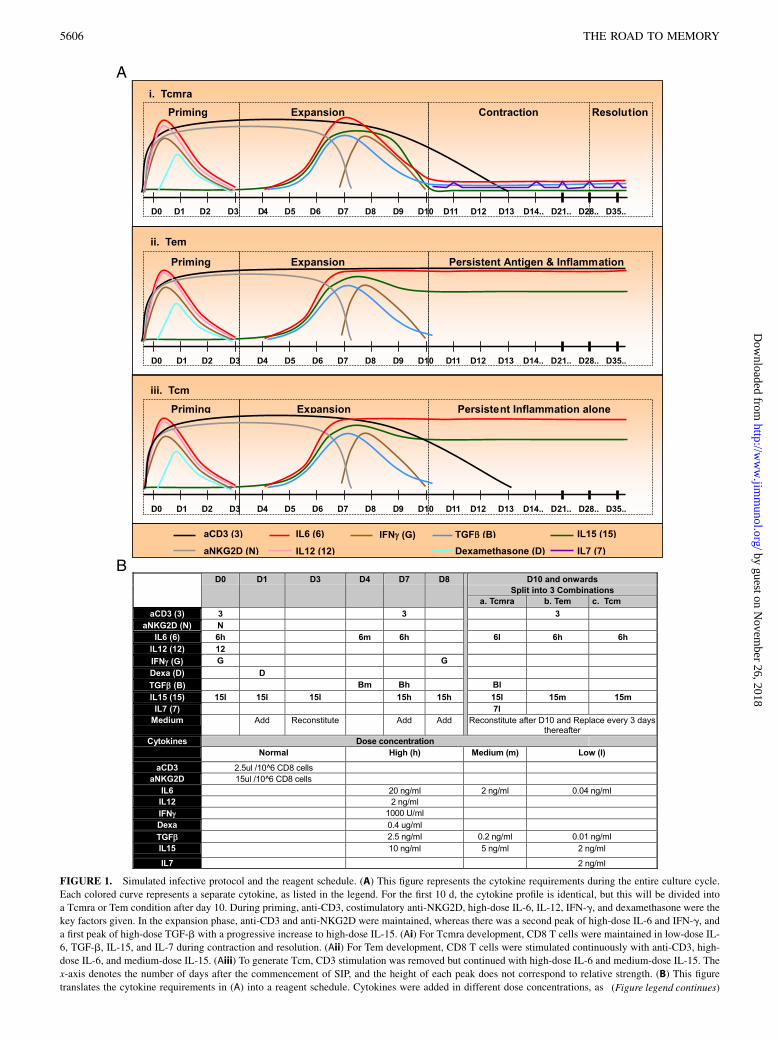
FIGURE 1. Simulated infective protocol and the reagent schedule. (A) This figure represents the cytokine requirements during the entire culture cycle.
Each colored curve represents a separate cytokine, as listed in the legend. For the first 10 d, the cytokine profile is identical, but this will be divided into
a Tcmra or Tem condition after day 10. During priming, anti-CD3, costimulatory anti-NKG2D, high-dose IL-6, IL-12, IFN-g, and dexamethasone were the
key factors given. In the expansion phase, anti-CD3 and anti-NKG2D were maintained, whereas there was a second peak of high-dose IL-6 and IFN-g, and
a first peak of high-dose TGF-b with a progressive increase to high-dose IL-15. (Ai) For Tcmra development, CD8 T cells were maintained in low-dose IL-
6, TGF-b, IL-15, and IL-7 during contraction and resolution. (Aii) For Tem development, CD8 T cells were stimulated continuously with anti-CD3, high-
dose IL-6, and medium-dose IL-15. (Aiii) To generate Tcm, CD3 stimulation was removed but continued with high-dose IL-6 and medium-dose IL-15. The
x-axis denotes the number of days after the commencement of SIP, and the height of each peak does not correspond to relative strength. (B) This figure
translates the cytokine requirements in (A) into a reagent schedule. Cytokines were added in different dose concentrations, as (Figure legend continues)
5606 THE ROAD TO MEMORY
by guest on Novem
ber 26, 2018http://w
ww
.jimm
unol.org/D
ownloaded from

IL-15 (Fig. 4D). At 7 d post–secondary activation, CD8 gatedlymphocytes showed Tcmra to be 81.5 6 3.5%, whereas Tem was51.5 6 7.5% for having undergone at least one cycle of division,thereby supporting a higher proliferative capacity after secondaryactivation in Tcmra.
Inflammatory and cytotoxic function
At 3 days after priming, Tnaive began to increase their expressionof IFN-g (18.4 6 3.3 dMFI), granzyme B (1.8 6 0.5 dMFI), andperforin (1.8 6 1.1 dMFI) (Fig. 5A), which qualified them func-tionally as Teff (3). These cytolytic granules began to declineover the next few days but demonstrated a second peak on day14. Comparison of respective dMFI of cytolytic granules amongday 0 Tnaive, day 33 Tcmra, and day 33 Tem showed values ofgranzyme A (0.1 6 0.1, 1.36 0.1, 0.7 6 0.1), granzyme B (0.0 60.0, 0.3 6 0.3, 0.1 6 0.1), and perforin (0.2 6 0.1, 0.4 6 0.3,0.3 6 0.2), respectively. These results demonstrated a comparablegranzyme A and B expression between Tcmra and Tem, as well ascomparable perforin expression between Tcmra and Tem. IFN-galso began to decrease after day 3 but plateaued from day 15 withcomparable levels moderate in both Tcmra and Tem. The dMFI ofintracellular IFN-g expression in day 0 Tnaive, day 33 Tcmra, andday 33 Tem was 7.6 6 0.5, 12.8 6 1.1, and 14.2 6 1.4, respec-tively. Furthermore, both IL-2 and TNF-a (Fig. 5A) were elevatedfrom day 7, which peaked at day 10 and declined to baseline inTcmra but remained low in Tem up to day 33. Comparative dMFIfor day 0 Tnaive, day 33 Tcmra, and day 33 Tem demonstratedvalues of IL-2 (0.0 6 0.0, 0.0 6 0.0, 0.23 6 0.15) and TNF-a(0.0 6 0.0, 0.0 6 0.0, 1.0 6 0.5), respectively.For analysis of cytotoxic function (Fig. 5B), both Tcmra and
Tem demonstrated in vitro cytotoxic capacity against P815 murinemastocytoma cells. The percent cytotoxicity for Tcmra was in-creased gradually from 27 6 8% to 47 6 3%, whereas Tem rangedfrom 456 8% to 556 8%. At lower E:T ratios, Tcmra showed lesskilling but leveled off later with Tem at a higher ratio of 1:1.
Anti-inflammatory and suppressive function
On day 3, there was an increase in the expression of FOXP3(16.2 6 5.1 dMFI), TGF-b (2.7 6 0.6 dMFI), and IL-10 (7.1 61.3 dMFI) (Fig. 6A). Upon further follow-up, FOXP3 was reducedto minimal levels in both Tcmra and Tem. TGF-b, in contrast, wasprogressively reduced to a minimal level in Tcmra by day 33 andpersisted at a moderate level in Tem. IL-10 began to decrease afterday 7 and gradually decreased to a low level in Tcmra but per-sisted in Tem by day 33. Comparing the dMFI of anti-inflammatorymarkers in day 0 Tnaive, day 33 Tcmra, and day 33, Tem showedvalues of FOXP3 (2.4 6 1.2, 1.8 6 1.5, 6.4 6 1.3), TGF-b (0.5 60.5, 1.1 6 0.1, 3.1 6 0.4), and IL-10 (2.2 6 0.2, 5.0 6 0.5, 8.0 61.5), respectively.Tnaive were PD-12, CD1612, CD8ab+, and CD252. In com-
parison with day 31 Tcmra, the latter remained PD-12, CD1612,CD8ab+, and dim CD25+, whereas day 31 Tem were PD-12, partialdim CD161, CD8ab+, and dim CD25+ (Fig. 6B). The phenotypesof both Tnaive and Tcmra were similar in almost all surfacemarkers except CD25, which was absent in Tnaive but dim pos-itive in Tcmra. Expression of CD161 in Tem on day 31 was in-teresting because of its association to the Th17 subtype.We proceeded to examine the suppressive function in both
Tcmra and Tem after secondary activation. They were activatedwith anti-CD3 and anti-NKG2D before coculturing another 7 d
with autologous Tnaive, which were similarly activated by bothsignals (Fig. 6C). At the end of coculture, Tcmra and Tem sup-pressed 45 6 28% and 26 6 13% of Tnaive proliferation at thehighest suppressor/responder ratio of 1:1, respectively.Based on our results, we have proposed a developmental model
(Fig. 7), supporting both divergent (Tnaive → Teff → Tcm or Tem)and linear (Tnaive → Teff → Tem → Tcm → Tcmra) relationships.
DiscussionCD45RA expression had been regarded traditionally as naivephenotype, but recent evidence suggested that some CD45RArevertants were in fact memory T cells observed to developafter acute infection with activated phenotype (22, 23) and stemcell–like properties (24). Eomes and Tbet mRNA gene productswere also found to be determinants for either memory or ef-fector differentiation, and shifting the Eomes/Tbet mRNA ratiotoward Eomes dominance will favor memory differentiation (25,26). Furthermore, true long-term memory T cells were known to1) re-express telomerase, which extends their telomere length forprolonged survival (27); 2) demonstrate higher proliferative po-tential compared with chronically stimulated T lymphocytes (24);and 3) express BCL2, which is a key antiapoptotic factor impor-tant for sustaining survival of memory T lymphocytes (3) In ourexperiments, when comparing Tcmra with Tnaive, the former ex-pressed an equivalent Eomes/T-bet mRNA ratio, comparable telo-mere length, higher BCL2, and similar CD28 expression. In con-trast to Tem, Tcmra expressed a higher Eomes/T-bet mRNA ratio,longer telomere length, and comparable BCL2 expression, andremained CD28+ and exhibited higher proliferative fraction aftersecondary activation. Collectively, this evidence strongly supportsbetter survival and proliferative capacity in Tcmra, which cor-roborates with aforementioned studies reporting CD45RA rever-tants as memory stem T cells. Besides, Tcmra are also competentcytotoxic T cells, displaying comparable IFN-g, granzyme A andB, and perforin, and similar ex vivo cytotoxicity at higher E:Tratio as Tem. Furthermore, post–activated Tim were polyfunctional,producing also IL-2 and TNF-a; however, these cytokines werereduced to baseline in Tcm but maintained at a low level in Tem.Superficially, Tcmra are very similar to Tnaive in all tested surfacephenotypes, with the exception of dim CD25 being expressed onlyon Tcmra, which may provide a competitive advantage for IL-2during secondary activation.Owing to the use of anti-inflammatory cytokine TGF-b and
dexamethasone in SIP, we proceeded to investigate their influencein inducing suppressive characteristics by studying the expressionof FOXP3, IL-10, TGF-b, PD-1, CD8aa, CD161, and CD25 andin vitro suppression. On day 3 postactivation, an early peak inFOXP3 expression was observed, which reduced to baseline levelsubsequently; this is in concordance with other reports demon-strating a transient FOXP3 expression shortly after activation andin itself did not indicate a conversion to regulatory T cells (28, 29).Furthermore, Tcmra remained CD8ab1; did not express signifi-cant TGF-b, PD-1, CD161, or high level of CD25; and were allin keeping with a nonregulatory and nonexhausted phenotype(30–34). The initial IL-10 peak at day 3 was similar to the tran-sient FOXP3 expression postactivation; but the gradual rather thanabrupt reduction until day 33 in Tcmra was unexpected. However,Cui et al. (35), in their study of giving i.p. injections of anti–IL-10Ab for 25 d, had shown that IL-10 via the STAT3 pathway was
depicted in the lower panel of the table. The top row represents the number of days after commencement of SIP, and the left column represents cytokines
with their respective symbols in parentheses. Cytokines were added in an identical manner until day 10, but were washed and reconstituted into three
different combinations thereafter: one for Tcmra, another for Tem, and the third for Tcm development. h, High; m, medium; l, low.
The Journal of Immunology 5607
by guest on Novem
ber 26, 2018http://w
ww
.jimm
unol.org/D
ownloaded from

FIGURE 2. Morphology and immunophenotype. (A) Microscopic morphology. This figure represents the morphological changes during Tcmra and Tem
development throughout SIP by light microscopy at original magnification 3100. The dark, round spheres in the photomicrograph are the anti-CD3 beads
used in stimulating CD8 T lymphocytes throughout culture. (B) Immunophenotypic expression. This figure represents the immunophenotypic changes in
CD45RA, CD127, CCR7, CD62L, CXCR3, CD27, CD28, and CD45RO by flow cytometry analysis during the entire culture period. The left column
displays the number of days after commencement of SIP. From day 0 to day 10, the plots are identical because the culture condition is exactly the same.
After day 10, Tcmra development is presented as the subpanel (Bi) up to day 31. These figures are representative of at least three independent experiments.
D, Number of days after commencement of SIP; SS, side scatter.
5608 THE ROAD TO MEMORY
by guest on Novem
ber 26, 2018http://w
ww
.jimm
unol.org/D
ownloaded from

FIGURE 3. Immunophenotype of other T subtypes. (A) Immunophenotypic expression. This figure represents the immunophenotypic changes in
CD45RA, CD127, CCR7, CD62L, CXCR3, CD27, CD28, and CD45RO by flow cytometric analysis during the entire culture period. The left column
displays the number of days after commencement of SIP. The initial period of day 0 to day 10 was identical to that in Fig. 2B because the culture condition
is exactly the same. After day 10, the subpanel (Ai) refers to Tem, and the subpanel (Aii) to Tcm development, with subsequent conversion to the Tcmra
condition from D28 onward. (B) The left panel demonstrates the phenotypic persistence of Tcmra until day 44; the middle panel represents the immu-
nophenotypic features after Tem were converted to Tcmra’s resting condition between day 36 and day 44; and the right panel demonstrates the partial
reconversion of Tem to Tcm, and then to Tcmra, when the culture condition was first changed to chronic inflammation, followed by resting milieu after day 43.
These figures are representative of at least three independent experiments. D, Number of days after commencement of SIP; SS, side scatter.
The Journal of Immunology 5609
by guest on Novem
ber 26, 2018http://w
ww
.jimm
unol.org/D
ownloaded from

important in CD8 maturation and memory formation. Thus, a grad-ual reduction of IL-10 expression in Tcmra during the immediatepostinfection period may have a role in CD8 memory differentiation,which will require further work to elucidate. Functionally, the sup-pression of naive T proliferation by secondary activated Tcmra wasnot surprising because this is in keeping with other reports thatdemonstrated both suppression of bystander Tnaive during sec-ondary activation and suppression of primary allogenic response byCD8+ memory cells. Incidentally, this effect of Tnaive bystandersuppression is also IL-10 dependent (36–39). Another noteworthyobservation is the CD161 expression in Tem, because more workmay be necessary to ascertain the possibility of whether such
chronically stimulated Tem are indeed precursors to the Th17lineage (40).Many studies have established the differential expression of cell
adhesion molecule CD62L, and chemokine receptors CCR7 andCXCR3, as indicators for the migratory tendencies in T lympho-cytes. Following this grand schema, T lymphocytes expressingCCR7+/CD62L+ are poised for recirculation between lymphoidtissue and peripheral blood (41). For egress from lymph node,activated T lymphocytes will lose CCR7 to minimize its retentionpotential yet maintaining CD62L+ in the efferent lymphatics, andwhen coupled with CXCR3 expression, these exited lymphocyteswill preferentially home to inflamed tissue (42–45). In reverse, those
FIGURE 4. Survival potential and secondary activation. For both charts (A) and (B), frozen mononuclear cells were thawed, sorted for Tnaive, and
analyzed together with D33 Tcmra and D33 Tem. (A) Comparison of the Eomes/Tbet ratio. Both Eomes and Tbet mRNA expression were nor-
malized with HRPT1 and expressed as 2(2DCT) where DCT = CT of Gene X(Eomes or Tbet) 2 CT of HRPT1. The chart then compares the ratio of
Eomes to Tbet normalized mRNA expression and presents a fractional value. (B) Comparison of BCL2 expression. Intracellular expression of BCL2
is determined by flow cytometric analysis. The upper plot represents the changes in dMFI of intracellular BCL2 expression throughout the 33 d of
culture, whereas the lower plot compares only the value on day 33. dMFI denotes d mean fluorescence = MFI(Tcmra or Tem) 2 MFI of corre-
sponding murine IG control. (C) Comparison of telomere length. This chart compares the telomere length between day 0 naive, day 33 Tcmra, and
day 33 Tem, which is expressed in bp. Lane 1 = Tnaive, lane 2 = Tcmra, lane 3 = Tem, and lane 4 = DNA ladder. (D) Comparison of proliferation
post–secondary activation. The upper plot demonstrates the presence of NKG2D to support the use of anti-CD3, anti-NKG2D, and IL15 in sec-
ondary activation. Seven days after activation, CD8 gated T cells were examined for their CFSE expression. The M2 fraction represents the
proliferating population, which had undergone at least one round of division. The lower plot compares the M2 fractions between Tcmra and Tem at
day 7 post–secondary activation. All data in these charts are presented as mean 6 SEM, and these figures are representative of at least three in-
dependent experiments.
5610 THE ROAD TO MEMORY
by guest on Novem
ber 26, 2018http://w
ww
.jimm
unol.org/D
ownloaded from

FIGURE 5. Inflammatory and cytotoxic function. (A) Comparison of IFN-g, cytolytic granules, IL-2, and TNF-a expression. Frozen mononuclear cells
were thawed, sorted for Tnaive, and analyzed together with day 33 Tcmra and day 33 Tem. Intracellular expression of IFN-g, granzyme A, granzyme B,
perforin, IL-2, and TNF-a was analyzed by flow cytometry. The figure comprises six corresponding pairs of charts. The graph on the left represents the
variation of intracellular cytokine expression versus time over the entire 33 d of culture, whereas the one on the right compares only the expression on day
0 versus day 33. D, number of days after commencement of SIP. dMFI, d mean fluorescence = MFI(Tcmra or Tem) 2 MFI of corresponding murine IG
control. (B) In vitro cytotoxicity of P815 murine mastocytoma cells. Gate R2 selects the Flow-Count fluorospheres; gate R1 selects all murine plasma-
cytoma cells. All data in these charts are presented as mean6 SEM, and these figures are representative of at least three independent experiments. AnnexV,
Annexin V; hCD45, anti-human CD45; mCD45, anti-murine CD45.
The Journal of Immunology 5611
by guest on Novem
ber 26, 2018http://w
ww
.jimm
unol.org/D
ownloaded from

FIGURE 6. Anti-inflammatory and suppressive function. For both charts (A) and (B), frozen mononuclear cells were thawed, sorted for Tnaive, and
analyzed together with day 33 Tcmra and day 33 Tem. (A) Comparison of IL-10, TGF-b, and FOXP3 expression. Intracellular expression of IL-10, TGF-b,
and FOXP3 was analyzed by flow cytometry. The figure comprises three corresponding pairs of charts. The graph on the left represents the variation of
intracellular cytokine expression versus time over the entire 33 d culture, whereas the one on the right compares only the expression on day 33. D, number
of days after commencement of SIP. dMFI denotes d mean fluorescence = MFI(Tcmra or Tem) 2 MFI of corresponding murine IG control. (B) Expression
of PD1, CD161, CD8b, and CD25. Expression of PD-1, CD161, CD8b, and CD25 was analyzed by flow cytometry on CD8a+ gated T cells. These dot
plots compared the expression of PD-1, CD161, CD8b, and CD25 between day 0 Tnaive, day 31 Tcmra, and day 31 Tem. The presence of CD8aa
expression is indicated by decreasing CD8b on CD8a+ gated cells. (C) In vitro suppression of activated autologous CD8 Tnaive proliferation. Gate R2
selects the Flow-Count fluorospheres; gate R1 selects all CD8 lymphocytes. All data in these charts are presented as mean 6 SEM, and these figures are
representative of at least three independent experiments. S:R, Suppressor/responder ratio.
5612 THE ROAD TO MEMORY
by guest on Novem
ber 26, 2018http://w
ww
.jimm
unol.org/D
ownloaded from

in tissues will upregulate CCR7 to return to lymphoid organs via
afferent lymphatics, and most lymphocytes in afferent lymphatics
are, in fact, CCR7+/CD62L2 (44, 46). In mirroring these phenotypic
variations after T cell activation, Tim1 that expressed CCR7+/CD62L+
would be poised for recirculation during early expansion, Tim2
that downregulated CCR7 but remained CD62L+/CXCR3+ would
suggest a tendency to home to inflamed tissue during late expansion,
whereas Tim3 that re-expressed CCR7 yet downregulated CD62L
during contraction were equipped to return to lymphoid tissues, and
finally Tcmra that coexpressed CCR7+/CD62L+ would have restored
recirculating capability after resolution.If antigenic and inflammatory stimuli persisted beyond late ex-
pansion, activated lymphocytes developed into Tem with down-
regulation of both CCR7 and CD62L, and they would be trapped in
the inflamed tissue. However, when only antigenic signal was re-
moved but the environment remained inflammatory after late ex-
pansion, activated lymphocytes were converted to Tcm expressing
both CCR7+ and CD62L+, to remain as vigilant CD45RO+ capable
of recirculating to hunt for Ags hidden in other inflamed locations.Interestingly, a similar milieu with inflammation but devoid of
antigenic stimulation would also convert Tem to Tcm phenotype.Therefore, observing such matching migratory patterns to theirfunctional requirement during the corresponding developmentalphases may indicate a substantial influence of environmental cuesin directing lymphocyte homing.Resident T cells in tumors or chronic infections were reported
to harbor a high proportion of Tem, with some specificity to
tumor-associated Ags in certain disease models. If these resident
Tem equipped with tumor specificity can be converted to long-
lasting memory T cells, they may be harnessed for long-term
control of these disorders. To assess this potential therapeutic
application, we proceeded to investigate the possibility of converting
Tem directly to Tcmra, by changing the Tem culture milieu after day
33 to the resting condition of Tcmra. In the absence of both antigenic
and inflammatory stimulations, Temwere indeed converted to Tcmra
re-expressing CD45RA, CCR7, and CD62L. To extend this obser-
vation, we are planning further studies to examine the possibility of
converting intratumor Tem to Tcmra, as well as to determine the
efficacy of such Tem-derived Tcmra in long-term disease control in
appropriate animal models.Finally, on the basis of on our data, we would like to propose
the lineage relationships as shown in Fig. 7. This model sup-
ports 1) the divergent relationship Tn →Teff → Tem or Tcm
separately, when activated T cells are differentially cultured
in either persistent stimulation or persistent inflammation, andboth subtypes will follow a final common pathway to Tcmra, aswell as 2) the linear relationship Tn→ Teff→ Tem→ Tcm→Tcmra,when persistent stimulation is abolished in steps. Overall, our modelagrees with two seemingly disparate pathways that culminate inTcmra as the final long-term memory T cell subtype. It is noteworthythat in both routes, the key to developing Tcmra is to maintainT lymphocytes in the resting condition, the earlier the better. Inother words, the transition to memory T cells (the road to mem-ory) does require early relief from both antigenic and inflamma-tory stimulations (an early rest) to enhance conversion to long-lasting memory T lymphocytes (their long journey).
AcknowledgmentsWe thank the staff of the Hematology Laboratory, Department of He-
matology, Singapore General Hospital, for use of the flow cytometer
and for valuable help, especially Dr. Lim Lay Cheng, Boey Bee Chun,
and Heng Kee Khiang; the SingHealth/Duke-National University of
Singapore Academic Medicine Research Institute for support; and
Taara Madhavan (Associate in Clinical Sciences, Duke–National Univer-
sity of Singapore Graduate Medical School) for assistance in editing the
manuscript.
DisclosuresThe authors have no financial conflicts of interest.
References1. Wherry, E. J., V. Teichgraber, T. C. Becker, D. Masopust, S. M. Kaech, R. Antia,
U. H. von Andrian, and R. Ahmed. 2003. Lineage relationship and protectiveimmunity of memory CD8 T cell subsets. Nat. Immunol. 4: 225–234.
2. Bouneaud, C., Z. Garcia, P. Kourilsky, and C. Pannetier. 2005. Lineage rela-tionships, homeostasis, and recall capacities of central- and effector-memoryCD8 T cells in vivo. J. Exp. Med. 201: 579–590.
3. Wherry, E. J., and R. Ahmed. 2004. Memory CD8 T-cell differentiation duringviral infection. J. Virol. 78: 5535–5545.
4. Lefrancois, L., and A. L. Marzo. 2006. The descent of memory T-cell subsets.Nat. Rev. Immunol. 6: 618–623.
5. Lanzavecchia, A., and F. Sallusto. 2005. Understanding the generation andfunction of memory T cell subsets. Curr. Opin. Immunol. 17: 326–332.
6. Wherry, E. J., D. L. Barber, S. M. Kaech, J. N. Blattman, and R. Ahmed. 2004.Antigen-independent memory CD8 T cells do not develop during chronic viralinfection. Proc. Natl. Acad. Sci. USA 101: 16004–16009.
7. Shin, H., and E. J. Wherry. 2007. CD8 T cell dysfunction during chronic viralinfection. Curr. Opin. Immunol. 19: 408–415.
8. Reddehase, M. J., C. O. Simon, C. K. Seckert, N. Lemmermann, andN. K. Grzimek. 2008. Murine model of cytomegalovirus latency and reac-tivation. Curr. Top. Microbiol. Immunol. 325: 315–331.
9. Biron, C. A., H. C. Su, and J. S. Orange. 1996. Function and regulation of naturalkiller (NK) cells during viral infections: characterization of responses in vivo.Methods 9: 379–393.
FIGURE 7. Developmental model of human memory CD8 T lymphocytes. This figure represents a proposed differentiation pathway based on our data. It
supports the development of (A) Tnaive→ Teff→ Tim1/2→ Tcm, or Tem separately with chronic inflammatory conditions for Tcm and chronic stimulation for
Tem, as well as (B) Tem converting to Tcm, then to Tcmra, after both chronic antigenic and inflammatory stimulations were eliminated sequentially.
The Journal of Immunology 5613
by guest on Novem
ber 26, 2018http://w
ww
.jimm
unol.org/D
ownloaded from

10. Ruzek, M. C., A. H. Miller, S. M. Opal, B. D. Pearce, and C. A. Biron. 1997.Characterization of early cytokine responses and an interleukin (IL)-6-dependentpathway of endogenous glucocorticoid induction during murine cytomegalovirusinfection. J. Exp. Med. 185: 1185–1192.
11. Pearce, B. D., C. A. Biron, and A. H. Miller. 2001. Neuroendocrine-immuneinteractions during viral infections. Adv. Virus Res. 56: 469–513.
12. Maasho, K., J. Opoku-Anane, A. I. Marusina, J. E. Coligan, and F. Borrego.2005. NKG2D is a costimulatory receptor for human naive CD8+ T cells. J.Immunol. 174: 4480–4484.
13. Joshi, N. S., W. Cui, A. Chandele, H. K. Lee, D. R. Urso, J. Hagman, L. Gapin,and S. M. Kaech. 2007. Inflammation directs memory precursor and short-livedeffector CD8(+) T cell fates via the graded expression of T-bet transcriptionfactor. Immunity 27: 281–295.
14. Alves, N. L., B. Hooibrink, F. A. Arosa, and R. A. van Lier. 2003. IL-15 inducesantigen-independent expansion and differentiation of human naive CD8+ T cellsin vitro. Blood 102: 2541–2546.
15. Dalod, M., T. Hamilton, R. Salomon, T. P. Salazar-Mather, S. C. Henry,J. D. Hamilton, and C. A. Biron. 2003. Dendritic cell responses to early murinecytomegalovirus infection: subset functional specialization and differential regula-tion by interferon alpha/beta. J. Exp. Med. 197: 885–898.
16. Okamoto, Y., Y. Gotoh, O. Uemura, S. Tanaka, T. Ando, and M. Nishida. 2005.Age-dependent decrease in serum transforming growth factor (TGF)-beta 1 inhealthy Japanese individuals; population study of serum TGF-beta 1 level inJapanese. Dis. Markers 21: 71–74.
17. Honda, M., K. Kitamura, Y. Mizutani, M. Oishi, M. Arai, T. Okura, K. Igarahi,K. Yasukawa, T. Hirano, T. Kishimoto, et al. 1990. Quantitative analysis ofserum IL-6 and its correlation with increased levels of serum IL-2R in HIV-induced diseases. J. Immunol. 145: 4059–4064.
18. Manjunath, N., P. Shankar, J. Wan, W. Weninger, M. A. Crowley, K. Hieshima,T. A. Springer, X. Fan, H. Shen, J. Lieberman, and U. H. von Andrian. 2001.Effector differentiation is not prerequisite for generation of memory cytotoxicT lymphocytes. J. Clin. Invest. 108: 871–878.
19. Benedict, C., S. Dimitrov, L. Marshall, and J. Born. 2007. Sleep enhancesserum interleukin-7 concentrations in humans. Brain Behav. Immun. 21: 1058–1062.
20. Bradley, L. M., L. Haynes, and S. L. Swain. 2005. IL-7: maintaining T-cellmemory and achieving homeostasis. Trends Immunol. 26: 172–176.
21. Tan, J. T., B. Ernst, W. C. Kieper, E. LeRoy, J. Sprent, and C. D. Surh. 2002.Interleukin (IL)-15 and IL-7 jointly regulate homeostatic proliferation of memoryphenotype CD8+ cells but are not required for memory phenotype CD4+ cells.J. Exp. Med. 195: 1523–1532.
22. Wills, M. R., A. J. Carmichael, M. P. Weekes, K. Mynard, G. Okecha, R. Hicks,and J. G. Sissons. 1999. Human virus-specific CD8+ CTL clones revert fromCD45ROhigh to CD45RAhigh in vivo: CD45RAhighCD8+ T cells compriseboth naive and memory cells. J. Immunol. 162: 7080–7087.
23. Carrasco, J., D. Godelaine, A. Van Pel, T. Boon, and P. van der Bruggen. 2006.CD45RA on human CD8 T cells is sensitive to the time elapsed since the lastantigenic stimulation. Blood 108: 2897–2905.
24. Gattinoni, L., E. Lugli, Y. Ji, Z. Pos, C. M. Paulos, M. F. Quigley, J. R. Almeida,E. Gostick, Z. Yu, C. Carpenito, et al. 2011. A human memory T cell subset withstem cell-like properties. Nat. Med. 17: 1290–1297.
25. Obar, J. J., and L. Lefrancois. 2010. Early events governing memory CD8+ T-cell differentiation. Int. Immunol. 22: 619–625.
26. Belz, G. T., and A. Kallies. 2010. Effector and memory CD8+ T cell differen-tiation: toward a molecular understanding of fate determination. Curr. Opin.Immunol. 22: 279–285.
27. Hathcock, K. S., S. M. Kaech, R. Ahmed, and R. J. Hodes. 2003. Induction oftelomerase activity and maintenance of telomere length in virus-specific effectorand memory CD8+ T cells. J. Immunol. 170: 147–152.
28. Pillai, V., S. B. Ortega, C. K. Wang, and N. J. Karandikar. 2007. Transient regulatoryT-cells: a state attained by all activated human T-cells. Clin. Immunol. 123: 18–29.
29. Ahmadzadeh, M., P. A. Antony, and S. A. Rosenberg. 2007. IL-2 and IL-15 eachmediate de novo induction of FOXP3 expression in human tumor antigen-specific CD8 T cells. J. Immunother. 30: 294–302.
30. Tang, X. L., T. R. Smith, and V. Kumar. 2005. Specific control of immunity byregulatory CD8 T cells. Cell. Mol. Immunol. 2: 11–19.
31. Wahl, S. M. 2007. Transforming growth factor-beta: innately bipolar. Curr. Opin.Immunol. 19: 55–62.
32. Cerwenka, A., and S. L. Swain. 1999. TGF-beta1: immunosuppressant and vi-ability factor for T lymphocytes. Microbes Infect. 1: 1291–1296.
33. Meloni, F., M. Morosini, N. Solari, I. Passadore, C. Nascimbene, M. Novo,M. Ferrari, M. Cosentino, F. Marino, E. Pozzi, and A. M. Fietta. 2006. Foxp3expressing CD4+ CD25+ and CD8+CD282 T regulatory cells in the peripheralblood of patients with lung cancer and pleural mesothelioma. Hum. Immunol. 67:1–12.
34. Blattman, J. N., E. J. Wherry, S. J. Ha, R. G. van der Most, and R. Ahmed. 2009.Impact of epitope escape on PD-1 expression and CD8 T-cell exhaustion duringchronic infection. J. Virol. 83: 4386–4394.
35. Cui, W., Y. Liu, J. S. Weinstein, J. Craft, and S. M. Kaech. 2011. An interleukin-21-interleukin-10-STAT3 pathway is critical for functional maturation of memoryCD8+ T cells. Immunity 35: 792–805.
36. Biron, C. A. 2010. Expansion, maintenance, and memory in NK and T cellsduring viral infections: responding to pressures for defense and regulation. PLoSPathog. 6(3, e1000816)e1000816.
37. Grinenko, T. S., E. L. Pobezinskaya, L. A. Pobezinskii, I. A. Baturina,E. S. Zvezdova, and D. B. Kazanskii. 2005. Suppression of primary allogenicresponse by CD8+ memory cells. Bull. Exp. Biol. Med. 140: 545–549.
38. Li, M. O., and R. A. Flavell. 2008. Contextual regulation of inflammation: a duetby transforming growth factor-beta and interleukin-10. Immunity 28: 468–476.
39. Saraiva, M., and A. O’Garra. 2010. The regulation of IL-10 production by im-mune cells. Nat. Rev. Immunol. 10: 170–181.
40. Maggi, L., V. Santarlasci, M. Capone, A. Peired, F. Frosali, S. Q. Crome,V. Querci, M. Fambrini, F. Liotta, M. K. Levings, et al. 2010. CD161 is a markerof all human IL-17-producing T-cell subsets and is induced by RORC. Eur. J.Immunol. 40: 2174–2181.
41. Sallusto, F., D. Lenig, R. Forster, M. Lipp, and A. Lanzavecchia. 1999. Twosubsets of memory T lymphocytes with distinct homing potentials and effectorfunctions. Nature 401: 708–712.
42. Lira, S. A. 2005. A passport into the lymph node. Nat. Immunol. 6: 866–868.43. Pham, T. H., T. Okada, M. Matloubian, C. G. Lo, and J. G. Cyster. 2008. S1P1
receptor signaling overrides retention mediated by G alpha i-coupled receptors topromote T cell egress. Immunity 28: 122–133.
44. Mackay, C. R., W. L. Marston, L. Dudler, O. Spertini, T. F. Tedder, andW. R. Hein. 1992. Tissue-specific migration pathways by phenotypically distinctsubpopulations of memory T cells. Eur. J. Immunol. 22: 887–895.
45. Sallusto, F., E. Kremmer, B. Palermo, A. Hoy, P. Ponath, S. Qin, R. Forster,M. Lipp, and A. Lanzavecchia. 1999. Switch in chemokine receptor expressionupon TCR stimulation reveals novel homing potential for recently activatedT cells. Eur. J. Immunol. 29: 2037–2045.
46. Debes, G. F., C. N. Arnold, A. J. Young, S. Krautwald, M. Lipp, J. B. Hay, andE. C. Butcher. 2005. Chemokine receptor CCR7 required for T lymphocyte exitfrom peripheral tissues. Nat. Immunol. 6: 889–894.
5614 THE ROAD TO MEMORY
by guest on Novem
ber 26, 2018http://w
ww
.jimm
unol.org/D
ownloaded from