
The Rise and Decline of Select Committees in Congress … · The Rise and Decline of Select...
43
The Rise and Decline of Select Committees in Congress Nicolas Dumas Massachusetts Institute of Technology [email protected] Charles Stewart III Massachusetts Institute of Technology [email protected] Abstract We examine the development of the committee system of the U.S. House of Representatives from the 1st to 20th Congress (1789–1829), focusing on the select committee system. The First Congress did not have any legislative standing committees, but relied instead on a series of ad hoc select committees. Across the period covered in this paper, select committees were replaced by standing committees, measured by the number of committees appointed and the percentage of House members appointed to the two types of committees. However, we find that, although membership on standing committees did not become universal until the 1820s, even by 1800 most legislative business brought before the House was removed from the select committees and channeled to standing committees. We also find, contrary to claims that the early Congress was characterized by strong norms of legislator equality, select committee appointments were more likely to be given to veteran House members, majority party members, and members with a college education. This preliminary paper reopens a strand of analysis that has gone dormant for nearly two decades about how the House eventually settled on a legislative process dominated by standing committees. Prepared for presentation at the annual History and Congress Conference, Library of Congress, Washington, DC, June 15-16, 2017. This paper was originally prepared for the annual meeting of the Southern Political Science Association, New Orleans, Louisiana, January 12–14, 2017. It was later revised and presented at the conference on the Era of Good Feelings, Lebanon Valley College, May 26-27, 2017. We thank Greg Koger and Richard Vaelley for insightful comments and suggestions. The remaining errors are our own.
Transcript of The Rise and Decline of Select Committees in Congress … · The Rise and Decline of Select...

The Rise and Decline of Select Committees in Congress
Nicolas Dumas Massachusetts Institute of Technology
Charles Stewart III Massachusetts Institute of Technology
Abstract
We examine the development of the committee system of the U.S. House of Representatives from the 1st to 20th Congress (1789–1829), focusing on the select committee system. The First Congress did not have any legislative standing committees, but relied instead on a series of ad hoc select committees. Across the period covered in this paper, select committees were replaced by standing committees, measured by the number of committees appointed and the percentage of House members appointed to the two types of committees. However, we find that, although membership on standing committees did not become universal until the 1820s, even by 1800 most legislative business brought before the House was removed from the select committees and channeled to standing committees. We also find, contrary to claims that the early Congress was characterized by strong norms of legislator equality, select committee appointments were more likely to be given to veteran House members, majority party members, and members with a college education. This preliminary paper reopens a strand of analysis that has gone dormant for nearly two decades about how the House eventually settled on a legislative process dominated by standing committees.
Prepared for presentation at the annual History and Congress Conference, Library of Congress, Washington, DC, June 15-16, 2017. This paper was originally prepared for the annual meeting of the Southern Political Science Association, New Orleans, Louisiana, January 12–14, 2017. It was later revised and presented at the conference on the Era of Good Feelings, Lebanon Valley College, May 26-27, 2017. We thank Greg Koger and Richard Vaelley for insightful comments and suggestions. The remaining errors are our own.
2
The Rise and Decline of Select Committees in Congress
Nicolas Dumas Massachusetts Institute of Technology
Charles Stewart III Massachusetts Institute of Technology
[email protected] The early institutional development of Congress has elicited regular interest among scholars
because it offers a rare glimpse into the creation of a national legislature from scratch. To be
sure, based on their own direct experience and reading, members of the earliest Congresses knew
the long history of European and North American legislatures (Harlow 1917). James Madison
was around for those who were inexperienced or behind in their reading. Still, the Constitution
provided organizational opportunities for Congress that had been foreclosed by the Articles of
Confederation. Members of the new Congress came from states with a varied set of institutional
practices. Nothing about the new American Congress was foreordained.
Among the major systems of congressional organization that developed in the early
Congress, two stand out for the attention they have received in the literature: the rules of floor
consideration and the committee system (Follett 1896; McConachie 1898; Fuller 1909; Polsby
1968; Polsby et al 1969; Cooper 1970; Leintz 1978; Hoadley 1980; Skladony 1985; Cooper and
Young 1989; Gamm and Shepsle 1989; Bach 1990; Binder 1995, 1996, 1997; Jenkins and
Stewart, 1998, 1999; Jenkins 1998; Stewart 2007; Resch et al 2016). Both are intertwined, of
course, but each represents different settings, strategic considerations, and actors. In this paper
we take up the second system, the committees.

3
The development of the congressional committee system has a long and interesting
historical arc. Despite the constitutional freedom given to the early Congress to experiment with
legislative institutions, the early Congress largely kept to the ethos inherited from the
Confederation Congress. Standing committees were eschewed in favor of ad hoc select
committees, appointed to consider each piece of legislation proposed by a member or petition
presented by a constituent. Gradually, work in both chambers migrated from the ad hoc select
committees to the standing committees. By the 1850s standing committees ruled the committee
landscape.
In the 1980s and 1990s, scholars of legislative institutionalization turned their attention to
the early history of Congress, and specifically to the transition from select committee dominance
to standing committee dominance. (See, for instance, Skladony 1985; Gamm and Shepsle 1989;
Cooper and Young 1989; Jenkins and Stewart 1998, 1999; Stewart 2007.) The literature tended
to be descriptive, aimed at documenting the workflow of the legislative process and
understanding what gave rise to critical features of committee consideration of legislation, such
as gatekeeping and agenda setting.
Scholars working on the topic of how the role of congressional committees evolved in the
first half century of American history labored under a relatively weak set of analytical tools and
data limitations. Record keeping in the early Congress was often haphazard. Press coverage of
congressional machinations was spotty and more attuned to partisanship and personality than to
questions of organizational detail.1
1 A good example of this was recounted in Jenkins and Stewart (1998, p. 34). What was probably the critical rules change that elevated standing committees over ad hoc select committees occurred in 1822, when a select committee on “modifications to the standing rules of the House” recommended that standing committees have full rights of bill referral within their jurisdiction, and that they could report bills to the floor at their own discretion. Further, the committee recommended making three select committees that had achieved the status of “quasi-standing committees” (Military Affairs, Naval Affairs, and Foreign Affairs) standing committees within the rules of the House. Niles Weekly Register, in reporting on the proceedings to change the rules, reported that debate on the

4
Many of these barriers remain to this day, but tools available to scholars to parse large
amounts of text and numbers make it worth our while to revisit the transition from select to
standing committees. The empirical focus of this paper is on the composition and workload of
House select committees from the 1st to the 20th Congress (1789–1829). Utilizing a dataset first
collected by Canon, Nelson, and Stewart (2002), we explore the use of new statistical and
computational techniques to come to a better understanding of the select committee composition
during this period. As a general matter, we conclude that the select committees did not represent
a stable division of labor, or even an incipient one, as some have surmised. Rather than embody
an egalitarian ethos of spreading the influence evenly throughout the chamber, the committee
system as a whole favored the majority party, southerners, political veterans, and those who had
attended college.
This paper is a first step in a long term project to document the evolution of committees
in Congress in the early years of its history, and the flow of legislation more generally. For the
moment, we ignore the Senate, which also developed a committee system roughly in parallel
with the House. (Indeed, it has been argued that the Senate beat the House to the practice of
privileging standing committees in its flow of legislation, which spurred the House, in turn, to
innovate on its own.)
This paper proceeds as follows. First, we review the early history of the congressional
committee system. Second, we discuss the data used in this paper and describe its basic
contours. Third, we conduct two statistical analyses on the data which are aimed at
understanding better the structure of the division-of-labor system that the select committee
system embodied. The first explores the distribution of committee assignments along party,
proposal took up nearly the entire afternoon, but that “the matters are not of interest enough to our readers to detail….” (Niles Weekly Register, Mar. 16, 1822, p. 47)

5
regional, and other lines; the second explores whether a latent division-of-labor can be discerned
through the appointment patterns of select committee members. The final section concludes and
offers closing thoughts about future research on this project.
The Historical Origins of Congressional Committees
Member of the First Congress inherited a rich history of legislative committees, reaching back to
the English Parliament in the mid-1500s and extending to state legislatures by the time the U.S.
Congress convened in 1789 (Harlow 1917, p. 3). Nonetheless, the rules adopted by the House
when it first assembled in 1789 were simple and said little about committees.2 In fact, there
were no standing committees in the original rules of the House. Speakers were made responsible
for appointing (ad hoc) committees with three or five members; the whole House was
responsible for appointing larger committees. These rules were augmented soon thereafter,
however, allowing “any member [to] excuse himself from serving on any committee, at the time
of his appointment, if he is then a member of two other committees” and establishing a standing
committee on elections (Journal, 1-1, Apr. 13, 1789, p. 13).
The requirement that the full body ballot for committees became onerous quickly. In all
likelihood, the House came to rely on the Speaker’s committee “nominations,” rather than devote
precious floor time to deliberating the composition of each and every committee (Gamm and
Shepsle 1989, p. 42). As a consequence, the House altered the floor-election provision of the
rules when it convened at the start of the second session of the First Congress, giving the Speaker
the power to appoint all committees, not just the small ones (Journal, 1-2, Jan. 13, 1789, p. 140).
In the absence of a standing committee system, the House conducted its business by
appointing ad hoc select committees to consider every piece of legislation that come before the
2 This discussion of committee development is adapted from Jenkins and Stewart 1999.

6
body. Canon, Nelson, and Stewart (2002) record the appointment of 220 select committees in
the first Congress, all but 11 of which consisted of a unique subset of the whole House.3 The
Committee on Elections investigated election disputes and reported back its findings, and thus
did not consider legislation, per se. By the 20th Congress (1827–29), the House had 26 standing
committees, with 23 select committees appointed along the way.
Figure 1 shows the number of select committees appointed each Congress during the
period covered by this paper;4 Figure 2 shows the number of standing committees. Table 1
reports the Congresses when standing committees were first appointed during this period.
[Figures 1 and 2 about here]
[Table 1 about here]
In describing the broad contours of the growth of the House standing committee system
and its eclipse of the select committees, one important detail bears mentioning. Around the 12th
Congress (1811–13), the House began regularly appointing a series of select committees,
charging them with taking under consideration broad subjects contained in the president’s annual
message. Once established, they were often referred bills and petitions that touched on the same
subject. These committees “on the president’s message” came to be reappointed routinely at the
beginning of each session, although they were never added to the standing rules. Starting with
the 14th Congress they were authorized to report by bill (Annals, 14-1, Dec. 6, 1815, pp. 376-77;
3 The data analyzed in this paper is the raw data file used to create the Canon, Nelson, and Stewart volume, and is available from the authors. 4 Figure 1 also breaks down the number of select committees appointed by session. During this period, committees expired at the adjournment of a session, not a Congress. Any committee that was still conducting business across a session break would need to be appointed in the following session. It is therefore the case that the total number of select committees appointed during a Congress includes a bit of double counting. However, as shown below in Figure 4, most select committees reported back to the House with a recommendation (and thus were dissolved) before the end of the session in which they were appointed. Among those that did not report back before the end of the session, most were not renewed in the next session. Therefore, although we have yet to quantify the number of truly unique select committees each Congress, the number of redundant committees is not large enough to affect the analysis reported here.

7
Cooper 1988, p. 58). Thus, while they were not formally standing committees, they were
practically treated as such by the House membership, earning them the label “semi-standing” by
Skladony.
The fact that the House tolerated the existence of three important committees (Foreign
Affairs, Military Affairs, and Naval Affairs) in this sort of parliamentary limbo of “semi-
standing” begs the question of whether the select-standing committee distinction was considered
all that important among early nineteenth century parliamentarians. The fact that no scholars
have been unable to find any contemporary political actor or commentator expound on the
distinction between standing and select committees in the early nineteenth century gives us at
least a little pause as we move ahead and try to understand why the early committee system
evolved as it did.
Focusing back on the select committee series in Figure 1, there are three periods, even for
such a brief moment in congressional history. The first three Congresses saw a very large
number of select committees appointed — around 200–250 per Congress, or, on average, one
every other day.5 The number of select committees then dropped precipitously in the 4th
Congress, going to about half the previous rate, and remained at around 120 per Congress until
the 14th Congress. (We attribute the spike in the 12th and 13th Congresses to the increase in
war-related matters, especially claims, associated with the War of 1812.) Following the war, the
number of select committees appointed each Congress began a steady decline, reaching a low of
23 in the 20th Congress, or an average of one new select committee every other week.
The first big drop in the number of select committees, in the 4th Congress, was most
likely caused by the creation of the Claims Committee at the end of the 3rd Congress and then
5 The first three Congresses were in session a total of 516, 314, and 309 days, respectively.

8
the creation of the committees on Commerce and Manufacturers and on Ways and Means at the
beginning of the 4th Congress. At least 233 items (bills, petitions, and memorials) were referred
to these three committees in the 4th Congress — items that most likely would have resulted in
the appointment of separate select committees had the standing committees not already been
created.6 (See Table 2 for an accounting of the number of items referred to the standing
committees from the 1st to the 20th Congress.) Throughout the period covered by this paper, the
Claims Committee, on average, received the most referrals of any House committee, while the
Commerce and Manufactures and the Ways and Means Committees received the most referrals
among committees devoted to general legislation.
[Table 2 about here]
The second big drop in the number of select committees, following the War of 1812,
coincided with the creation of the standing committee on Pensions and Revolutionary Claims, to
which were referred 137 items in the first Congress of its existence, making it one of the busiest
committees immediately upon its creation. Over the next decade other standing committees with
a regular stream of referrals were created, pulling business away from the select committee
system. Most notable was the conversion of the “quasi-standing committees” to standing
committees in the 17th Congress.
Prior research on the select committee system was impressed by the number of select
committees that continued to be appointed in the House through the 1810s, even as the number
of standing committees — and the chamber business funneled through them — grew. By
Skladony’s (1985, Table 5) accounting, the number of bills reported from standing committees
6 The number of referrals to each committee was estimated by conducting automated textual analysis on the House Journal. Because the referral of bills and petitions to committees followed stereotypical language in the Journal, it is relatively easy to tag instances in which matters were referred to standing committees. However, there are typographical errors that remain to be cleaned, and therefore the analysis presented here is preliminary.

9
drew to parity with the select committees as early as the 5th Congress. Our own analysis
suggests that as far as the referral of items to the committees is concerned, standing committees
began to dominate select committees even before then.
This point is illustrated in Figure 3, which reports where bills and petitions were referred
to by the House between the 1st and 20th Congresses. Cabinet officers dominated House
referrals in the first two Congresses, receiving about as many petitions and requests for
information as the select and standing committees combined. Referral of legislative items to the
cabinet dropped significantly in the 3rd and 4th Congresses, consistent with the Jeffersonian
suspicion of Alexander Hamilton’s role as a de facto prime minister, and the general rejection of
legislative leadership from the Federalist executive branch by a legislative branch that was
coming to be dominated by Republicans.7 At first, business that had previously been sent to the
cabinet was referred instead to select committees. However, with the coming of the 4th
Congress (and the creation of the Claims and Ways and Means standing committees) referrals to
standing committees began to vastly outpace the amount of business sent to the select
committees, eventually plateauing at about 1200 items by the 20th Congress.
[Figure 3 about here]
We have provided an accounting of the distribution of legislative inputs in the early years
of the Republic. We have not accounted for outputs, that is, where successful legislation came
from during this time. Skladony reports that by the first session of the 20th Congress, 90% of all
7 Despite attention to the role of Alexander Hamilton in guiding legislative business during this time, the Secretary of War eased out the Secretary of the Treasury for referrals in the first three Congresses, as the following table indicates:
Cong. Referred to Treasury Sec’y Referred to War Sec’y 1 90 102 2 90 112 3 37 56
10
bills reported to the House came from standing committees, and that bills reported from standing
committees were twice as likely to pass as bills reported from select committees (Skladony 1985,
Tables 5 and 7). Nothing in our research contradicts that, although we have not yet undertaken
the work to confirm it.
Related to the issue of legislative outputs is the matter of gatekeeping. In the earliest
years, committees did not have gatekeeping authority, at least in theory. In the earliest practice,
the House would first debate an issue brought before it and then, when the issue was ripe, a
motion would be entertained to refer the matter to a select committee for drafting before the bill
would be debated once more and (presumably) approved.
A good example of this flow of the legislative process occurred early in the First
Congress, when the House was deliberating the first tariff bill. Having spent considerable time
in the Committee of the Whole debating rates on a long list of items (e.g., on molasses, per
gallon, 6 cents; on Madeira wine, per gallon, 25 cents, etc.), the House passed a resolution that
“this House doth concur with the committee [of the Whole] in the said resolution [fixing tariff
rates], and that Mr. Clymer, Mr. White, and Mr. Baldwin do prepare and bring in a bill or bills
pursuant thereto (Journal 1-1, April 28, 1789, p 23). A little over a week later, “according to
order,” Clymer presented from the committee “a bill for laying a duty on goods, wares, and
merchandises, imported into the United States.” (Journal 1-1, May 5, 1789, p. 28). The next day
a motion was passed committing the bill to the Committee of the Whole, where it was further
amended, reported back to the House, passed, and sent to the Senate.8
The legislative path just described was the norm in the early Congress, but not all
committees eventually returned to the House with a bill, even when directed to. For example, on
8 The bill was finally signed into law by President Washington (Journal 1-1, July 6, 1789, p. 59).

11
June 1, 1789, a three-member committee was appointed “to prepare and bring in a bill, or bills,
to establish an [sic] uniform system on the subject of bankruptcies throughout the United States”
(Journal 1-1, June 1, 1789, p. 42). As far as can be ascertained, the committee never reported a
bill back to the House.
Figure 4 summarizes how often select committees finished their business before the end
of the session in which they were appointed. For the first decade of its history, almost nine out
of ten committees returned to the floor with a report of their deliberations and, more often than
not, a bill to be considered by the House. However, over time the fraction of committees
actually reporting back began to slip, so that by the end of the period covered by this paper,
between ¼ and 1/3 of select committees never returned a report to the House. Of course, by the
20th Congress, by far most legislation was referred to standing committees — most of which
died a quiet death. Therefore, even though select committees appeared to exercise more
gatekeeping power as time went on, it is likely that if a bill was referred to a select committee, its
chances were better than if it was referred to a standing committee.
[Figure 4 about here]
We have focused here on laying out the contours of the House committee system during
the first twenty Congress and presenting some preliminary evidence about how legislation
flowed through the committee system. For the rest of this paper, we move past these institutional
questions to explore who served on committees. Given the “Jeffersonian ethos” of equality that
surrounded norms of legislative behavior in the earliest Congresses, were committees composed
of representative cross sections of members, or did particular types of members — described by
party, ideology, experience, region, etc. — tend to dominate? Did the select committee system
evolve over time into a de facto division of labor that tended to group experienced members
12
together repeatedly to consider legislation on similar topics, or were select committees one-shot
affairs that are unlikely to lead to lead to the development of expertise? It is to questions such as
these that we turn for the remainder of this paper.
The Data
The dataset we analyze for the rest of this paper was gathered by poring over House Journals
from the first Congress to the 79th. A print version of the dataset is available in Canon, Nelson,
and Stewart (2002). The electronic version of that dataset is available from the authors.
The most important point to make about this dataset is that is it based on the House
Journal, and not accounts of debates, such as the Annals of Congress and the Register of
Debates. In modern congressional studies, it often does not matter whether one relies on the
Journal or Congressional Record to gather data about committee membership, but in the earliest
Congresses, it most certainly did. (See Resch et al 2016 on precisely this point.) Furthermore,
because the indices of the earliest Journals were haphazardly constructed, they are an unreliable
source of information about the appointment of select committees in the early days of the
Republic. (Thus, compilations that rely on the index, such as Stubbs (1985), significantly
undercount select committees.) The Canon, Nelson, and Stewart dataset was based on a page-
by-page reading of the Journal for the earliest period. One task we anticipate doing in the future
is relying on computer-based parsing of the Journal text, to catch overlooked select committees
from the earlier, low-tech data-gathering procedure.
The Structure of Individual Select Committee Membership
In this section, we focus on the structure of select committee membership, and in particular, the
number of select committees to which members were appointed each Congress. In doing so, we

13
assume that the number of select committees a member was appointed to is a valid measure of
the influence the member had over the legislative production of the House. Of course, this
assumption may be incorrect; the assumption depends critically on the substance of the matters
the committees considered. For now, we leave this point to the side, but anticipate revisiting it in
future research.
For reference, Figure 5 shows the distribution of the number of committees per member
for each Congress. Throughout this period, the mean number of committees declined, but
consistently showed significant variation within Congress.
[Section 5 about here]
In the first three Congresses (before Claims and Ways and Means became standing
committees), most members served on a large number of select committees. The member with
the most committees in the first Congress was Thomas Fitzsimons, a Pro-Administration
member from Pennsylvania who was appointed to 34 committees, of which he chaired 20. A
perusal of the committees to which he was appointed included a small number of individual
claims, and a large number of matters that were critical to the new nation, such as establishing
tariffs (mentioned above), establishing the executive departments, compensating members of the
government, governing the western territories, and measures to “settle accounts with the states.”
In several instances, he was appointed to committees that seemed to be related to
previous committees he had served on. For instance, after serving on the committee to establish
executive departments, he later served on a committee to establish the Post Office, and to a
committee amending the act establishing the Treasury Department. Having chaired the
committee to bring in a bill governing the western territories in the first session, he later served

14
on a committee in the third Congress to consider “the President’s message regarding the prospect
of frontier hostilities.”
It is unclear why Fitzsimons was so frequently used as a committee member and chair.
While he was a war hero, he was not particularly prominent in Pennsylvania politics. (In fact, he
was defeated for reelection in 1798 and never held public office again.) He was from
Pennsylvania, the home-state of the first Speaker of the House, Frederick Muhlenberg, and had
served in the Pennsylvania legislature while Muhlenberg was speaker there. The high value of
his DW-NOMINATE score (0.540) put him on the “soft” side of proto-Federalist sympathizers,
which probably means that he could work with both sides of the aisle on the most nettlesome of
issues. Unfortunately, all of these is speculation at this point.
Starting with the 4th Congress, select committee service became much less common, but
most members served on at least a couple of select committees each Congress. It was not until
the 17th Congress that the modal number of select committees became zero, marking the full
transition to the select committee system.
The effect of valence traits on select committee service: Education, seniority, and prior
experience
One theme that threads much of our analysis is an effort to distinguish between three
competing stories that can be told about the select committee system at this time. The first is the
Jeffersonian egalitarian ideal we have previously mentioned. The observable implications of this
view is that members would be roughly equally represented on committees, and that whatever
variation there is among members’ committee assignments does not appear to be systematic.
Neither of these are borne out in the data. There is substantial variation across members.
Moreover, as we show, several factors do explain much of this variation.
15
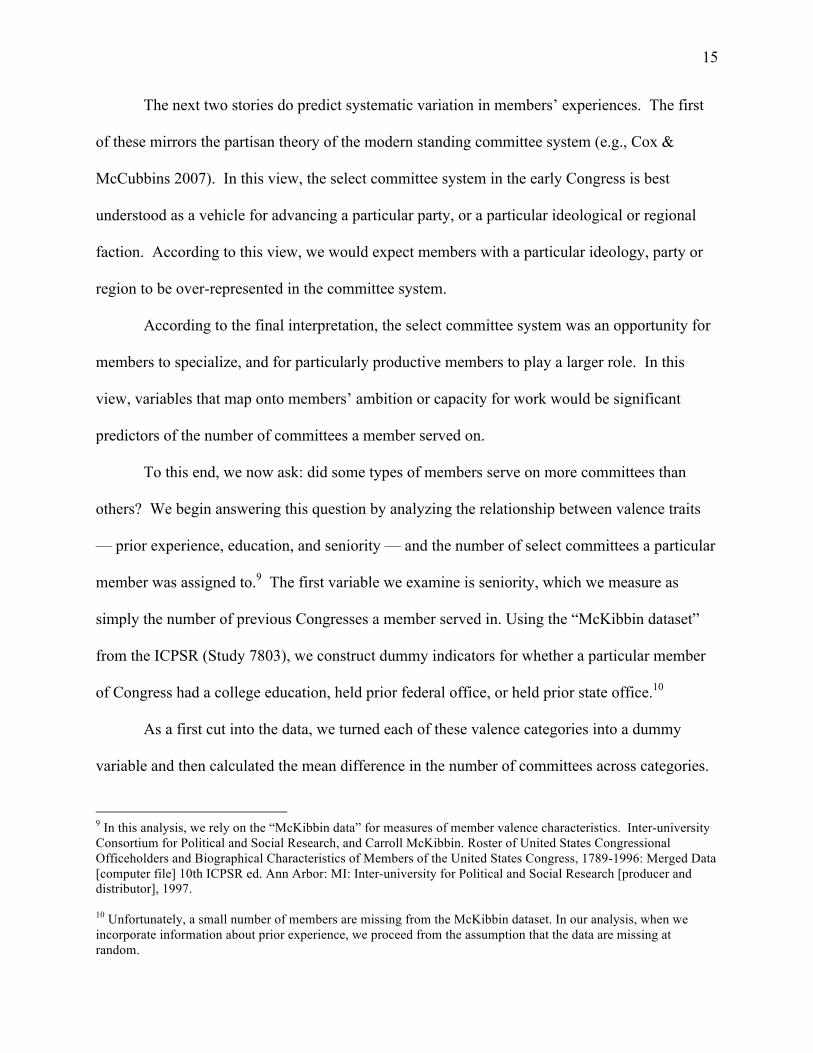
The next two stories do predict systematic variation in members’ experiences. The first
of these mirrors the partisan theory of the modern standing committee system (e.g., Cox &
McCubbins 2007). In this view, the select committee system in the early Congress is best
understood as a vehicle for advancing a particular party, or a particular ideological or regional
faction. According to this view, we would expect members with a particular ideology, party or
region to be over-represented in the committee system.
According to the final interpretation, the select committee system was an opportunity for
members to specialize, and for particularly productive members to play a larger role. In this
view, variables that map onto members’ ambition or capacity for work would be significant
predictors of the number of committees a member served on.
To this end, we now ask: did some types of members serve on more committees than
others? We begin answering this question by analyzing the relationship between valence traits
— prior experience, education, and seniority — and the number of select committees a particular
member was assigned to.9 The first variable we examine is seniority, which we measure as
simply the number of previous Congresses a member served in. Using the “McKibbin dataset”
from the ICPSR (Study 7803), we construct dummy indicators for whether a particular member
of Congress had a college education, held prior federal office, or held prior state office.10
As a first cut into the data, we turned each of these valence categories into a dummy
variable and then calculated the mean difference in the number of committees across categories.
9 In this analysis, we rely on the “McKibbin data” for measures of member valence characteristics. Inter-university Consortium for Political and Social Research, and Carroll McKibbin. Roster of United States Congressional Officeholders and Biographical Characteristics of Members of the United States Congress, 1789-1996: Merged Data [computer file] 10th ICPSR ed. Ann Arbor: MI: Inter-university for Political and Social Research [producer and distributor], 1997. 10 Unfortunately, a small number of members are missing from the McKibbin dataset. In our analysis, when we incorporate information about prior experience, we proceed from the assumption that the data are missing at random.

16
We conduct a two-sample t-test separately for each Congress, comparing members with that trait
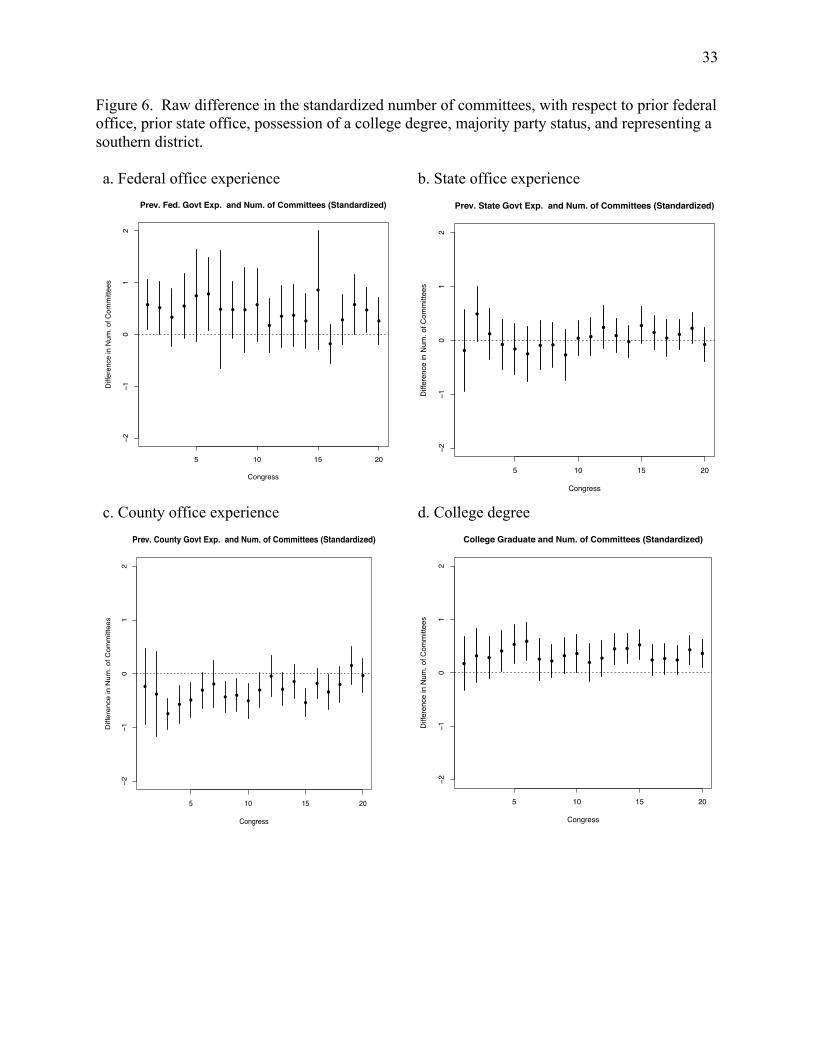
to members without it, with respect to total committees. We display the results in Figure 6. In
order for the results to be interpretable across Congress, we divide the number of committees by
the standard deviation of number of committees for each Congress. For instance, in the First
Congress, the average member with previous federal government experience served on 16.3
committees, while the average member without such experience served on 12.0 committees.11
The standard deviation for that Congress was 8.6. Dividing by the mean for each group results
in a value of 1.8 and 1.3, respectively. The difference, 0.57, is plotted as the very first point in
Figure 6a.12
[Figure 6 about here]
As a descriptive matter, House members who had had prior service in the national
government before entering the House and those who had attended college tended to serve on
more committees than those who were new to the federal government or who were less well
educated. Majority party members dominated select committees for most of the first six
Congresses.13 Those who had prior experience in state government and southerners did not have
a persistent advantage in committee service throughout this period.
However, valence variables are correlated with one another, which makes the
interpretation of the results difficult. In order to surmount this, we employ a regression-based
approach.
11 For this paper, we rely on the Martis (1989) party codes. Doing so, we recognize that the results begin to break down under the Era of Good Feelings, toward the end of the period we cover in this paper. We will address this issue in future iterations of the research. 12 For the biographical variables, we plot the data from the subset of members that have biographical background data. For the remaining variables, we plot the differences from the entire dataset. 13 The steep negative dip in Figure 6d for the 3rd Congress may be due to ambiguity over which party actually had a majority in this Congress.

17
For each Congress, we separately estimate an OLS regression of the log of the total
number of committees against dummy indicators for college education, previous state
experience, and previous federal experience.14 For each regression, we divide the outcome (log
number of committees) by its standard deviation, in order to make the effect sizes more
interpretable. Figure 7 shows the coefficients for each of those variables. As the plots show, the
effect of previous state experience is small and indistinguishable from zero, but the effects for
the other two variables are large, and frequently statistically differentiable from zero. The effect
of a college degree is often a quarter of a standard deviation increase or more, and the effect of
prior federal experience often has the largest effect, in some Congresses resulting in an increase
of over 50% of a standard deviation.
[Figure 7 about here]
On the whole, then, even under statistical controls, select committee service in the early
Congresses was correlated with prior federal experience and education. In retrospect, it is easy
to dismiss this as an obvious and expected finding. However, because of egalitarian norms at the
time, it is not obvious that such expectations would hold.
The effect of party, ideology, and region
We now turn to the effects of party, ideology and region. First, descriptively, did certain types of
members serve on more committees? Our analysis suggests that the answer is yes. Figure 6, as
discussed above, shows the raw difference in the number of committees between majority and
non-majority, northern and southern, college graduates and those without a college degree, and
those with previous office experience, and without it. As that figure shows, members of the
14 We added 0.01 to the number of committees for every member, to account for members who served on no committees.

18
majority party served on more committees, on average, than did members of minority parties.
Members from Southern states also enjoyed a slight advantage. Those with a college degree, and
those with previous experience in federal office, served on systematically more committees.
Simply comparing the means for these different groups within the population of House
members is important, in that it has implications for representation, but in order to be able to
make inferences about the committee-generating process, we return to the regression-based
approach we used above. Again, we run a series of regressions, separately for each Congress,
regressing the standardized log number of committees a member served on against his party
status, his first and second dimension DW-NOMINATE scores,15 and whether he was from a
southern state. Figure 8 shows the results.
[Figure 8 about here]
Figure 6d showed that members of the majority party often served on more committees,
and Figure 8a suggests that that pattern was unlikely to result from chance alone. Rather, it
appears that, even controlling for region and voting alignment, members of the majority party
enjoyed an advantage when it came to receiving select committee assignments up through the
sixth Congress. Likewise, Southerners enjoyed a consistent, but much smaller, advantage
starting with the Sixth Congress. Perhaps most intriguing is the pattern we find for NOMINATE
scores. In the first ten Congresses, the effect of first dimension DW-NOMINATE scores was
substantively large and distinguishable from zero, and in the second ten congresses, the second
dimension appeared to increase in importance.
15 We are cautious about interpreting DW-NOMINATE scores in this context. Rather than think about NOMINATE scores as “ideology,” we tend to think of them as distinguishing members along a strong/weak federal government dimension — at least until the onset of the “Era of Good Feeling,” when the Congress entered into what Poole and Rosenthal have called “spatial chaos.”

19
Technically, these scores are post-treatment. In order partially address this, we also
regress the number of committees against that member’s previous DW-NOMINATE score. We
can only do this for members who have already served at least one term, but among that subset
of the population, the same pattern persists.
Finally, we consolidate this analysis by estimating three additional models that explore
this analysis in a multivariate context: a Poisson GLM regression with fixed effects for Congress,
an OLS regression with the same formula, and an OLS regression with congressional and
member fixed effects. (The number of select committees is the dependent variable. The unit of
analysis is the member-Congress.) The results are reported in Table 3.
[Table 3 about here]
The first two columns of Table 3 report the same underlying model, just estimated using
different techniques. In each case, we see that majority party members, southerners, veteran
House members, college graduates, and members who had previously held federal office
appeared on more select committees. In the OLS model, the “prior state office” variable was
also significant. In general, then, select committee service was not randomly and equally
distributed during this period.
The final two columns of Table 3 attempt to leverage the fact that some members served
multiple Congresses, sometimes spanning majority and minority status, to test the robustness of
the majority-party effect in the previous two columns. We do this by estimating two two-way
fixed effects models: one regressing the standardized log number of committees against majority
party status, and another regressing the same outcome against majority party status, seniority,
and seniority squared. For both models, the majority party coefficient is virtually unchanged
20
from the pooled regression models, which serves as some evidence that party control had some
influence on select committee membership, even in this time of developing institutional parties.
One limitation with the regression approach above is that we are only examining the
partial correlations between a relatively small number of variables. In traditional regression
approaches, the number of covariates cannot exceed the number of observations, and conducting
an analysis separately by congress therefore restricts the number of variables that can be
included. However, we have a range of biographic and political variables associated with each
member.
To address this, we turn to a form of penalized regression known as Least Absolute
Shrinkage and Selection Operator, or LASSO. LASSO is a commonly-used approach in a
variety of disciplines, including increasingly political science (see Tibshirani 1996 for the
canonical discussion). LASSO functions like a standard regression approach, finding the
coefficients the minimize the sum of squared residuals, except that LASSO has an additional
constraint that the absolute value of the coefficients must fall under a certain value. In practice,
this means that LASSO can take in a very large number of covariates (larger than the number of
observations), and select a small number of covariates that best predict the outcome. As such, it
is ideal for our data, where we have a large number of variables for each member per Congress,
but a relatively small number of members per congress, and we want to pull out the variables that
are most predictive in each Congress.
We estimate LASSO separately for each congress, using the glmnet package in R. We
use a Poisson GLM regression, and use k-fold validation to select the ideal penalty parameter.
For each congress, we identify the variables that were non-zero in the model. Figure 9 shows the
results. For simplicity, we include only variables that were picked up in at least two separate

21
congresses. The color blue indicates the variable was non-zero had a positive non-zero
coefficient, white indicates a coefficient of zero, and red indicates a negative coefficient.
In line with the third theory of select committees, the most consistent predictors or the
number of committee assignments were seniority, being a lawyer, previous federal experience,
and age. However, variables associated with ideology, party or faction, including NOMINATE
scores, majority party status, and region did come up in multiple congresses.
The Structure of Aggregate Select Committee Composition
We have shown that certain types of members served on more committees than others. Did that
have an impact on the proportion of committees that were controlled by various regional and
party factions? Control, that is, holding a majority of seats on committees, is necessary for
committees to exercise agenda control or gatekeeping authority over legislation.16
Specifically, we examine whether the proportion of committees controlled by members of
the majority party, or the south, is greater than what we would expect if committees were
assigned randomly with respect to these factors.
To do this we first employ a randomization-based approach. For each Congress, we
permute the majority party status and the region (north/south) of each member. For each
permuted Congress, we calculate the proportion of committees controlled (over 50%
membership) by the majority party, and the proportion controlled by southerners. We then
compare the observed proportion to the mean of 200 simulations.
16 We enter this analysis recognizing that we have little solid knowledge of what the norms of committee voting and deliberation were during this time. In the earliest years, it is assumed that select committee members were “committee” to the course of action initially agreed to by the resolution creating the committee. However, there is a difference between agreeing to a general principle and agreeing to the details. Because select committees were expected to report back, and usually did, control of committees will be less important for gatekeeping power. However, if the purpose of committee deliberations was to put inchoate ideas onto paper, then the agenda-setting power could still be important.

22
Figure 10 shows the differences over time.17 They suggest that, beyond the individual-
level benefits we find for being in the majority party, at the aggregate level, the majority party
controlled more committees than we would expect if committee assignments were assigned
randomly. Conversely, although southerners tended to serve on more committees, at the
aggregate level, they controlled fewer committees than random selection would have entitled
them to.
[Figure 10 about here]
In addition to the fact that majority party and southern members served on more
committees on average, it could theoretically be the case that the committees were stacked in
such a way as to further increase the proportion of committees that they controlled, namely by
spreading out members across committees to gain a small majority in many committees, leaving
a few committees entirely or almost entirely composed of minority party (or northern)
members.18 To test for this, we again employ a randomization approach. For each Congress, we
permute committee assignments, holding constant the number of committees each member
served on, as well as the number of members each committee has. This allows us to test for
whether committees were effectively gerrymandered to give a particular group more benefits
beyond their members serving on more committees.
Figure 11 shows the results. After controlling for the number of committees each
member served on, the majority party and the south do not control a greater proportion of
committees than we would expect if committees were assigned randomly. If anything, they are
17 For instance, the first point on the graph may be interpreted as saying that in the First Congress, the pro-Administration (majority) party controlled 10 percentage points more select committees than would have been expected if committee composition had been determined randomly with respect to party. 18 One way of thinking about this is in the gerrymandering context. If disfavored factional members were packed into a few committees, then the favored factional members would have greater influence over a wider variety of issues.

23
under-represented. These results suggest that while majority party and southern members were
assigned to more committees, beyond that, the committees themselves were not assigned in such
a way as to gain control over the largest number of committees. If the majority party tried to use
the select committee system assignments to maximize their control over the select committee
system, they did not do a particularly effective job of it.
[Figure 11 about here]
The Overall Structure of Congressional Select Committee Networks
Thus far, we have explored the determinants of the number of committees a member
served on, as well as the implications of those findings for aggregate control over committees.
The overall level of our analysis was primarily the individual member. In this section, we focus
on the overall network structure of the select committee system. We conceptualize each
individual Congress as a social network, where each node corresponds to a member, and edges
between nodes signify that those members served on a committee together.
Our property of interest is the level of clustering for each individual Congress. Clustering is a
commonly-studied concept in networks, and it refers to, in all cases where one node links to two
other nodes, how many times do those two nodes themselves connect? It is in colloquial terms a
measure of how “cliquish” the network is.19 Clustering is typically measured as a ratio of the
amount of actual clustering divided by the amount of clustering we would expect if nodes were
connected randomly. Because members are coded as being connected if they serve on a
committee together, the committee structure itself induces some clustering, since all members on
the same committee are automatically connected to each other. To adjust for this, as is standard
19 A clique is a technical term in network analysis, but in this context, we mean cliquishness in the common sense of the word.
24
practice, we divide the clustering coefficient by the amount of clustering we would expect if the
committees were randomly assigned. To do this, we permute each Congress 200 times, holding
constant the number of committees for each member, and the sizes of each committee. We then
divide our clustering ratio by the mean of those permutations.
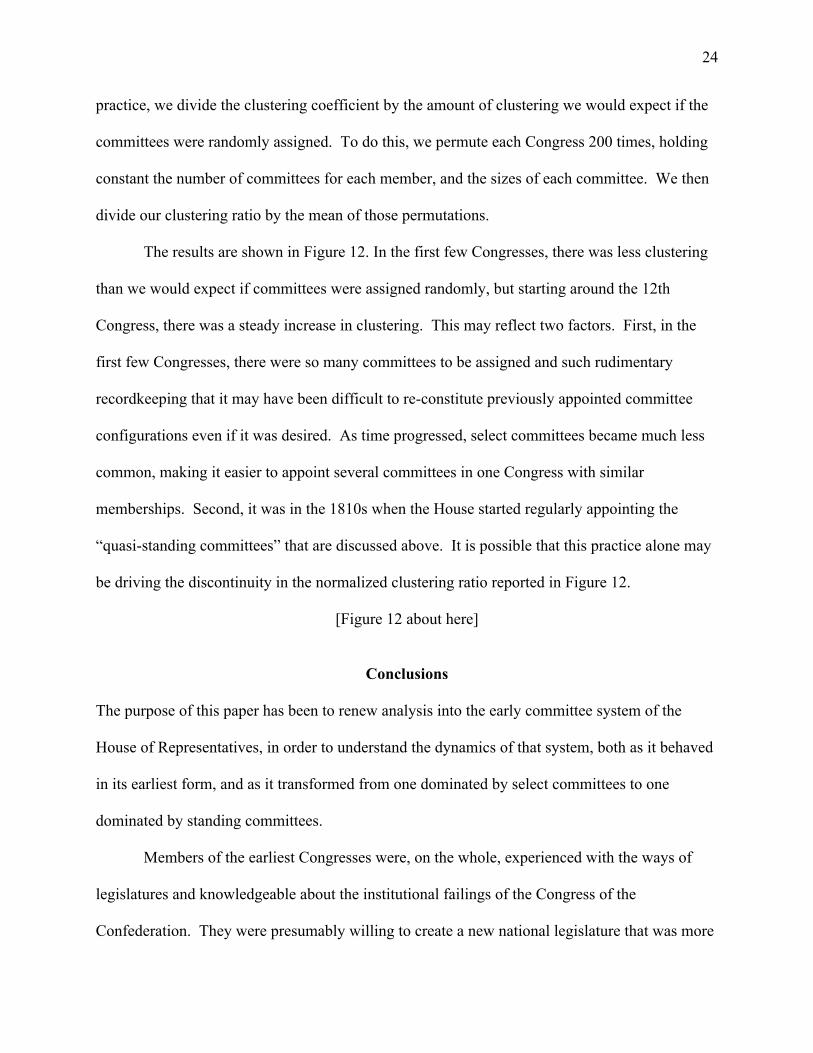
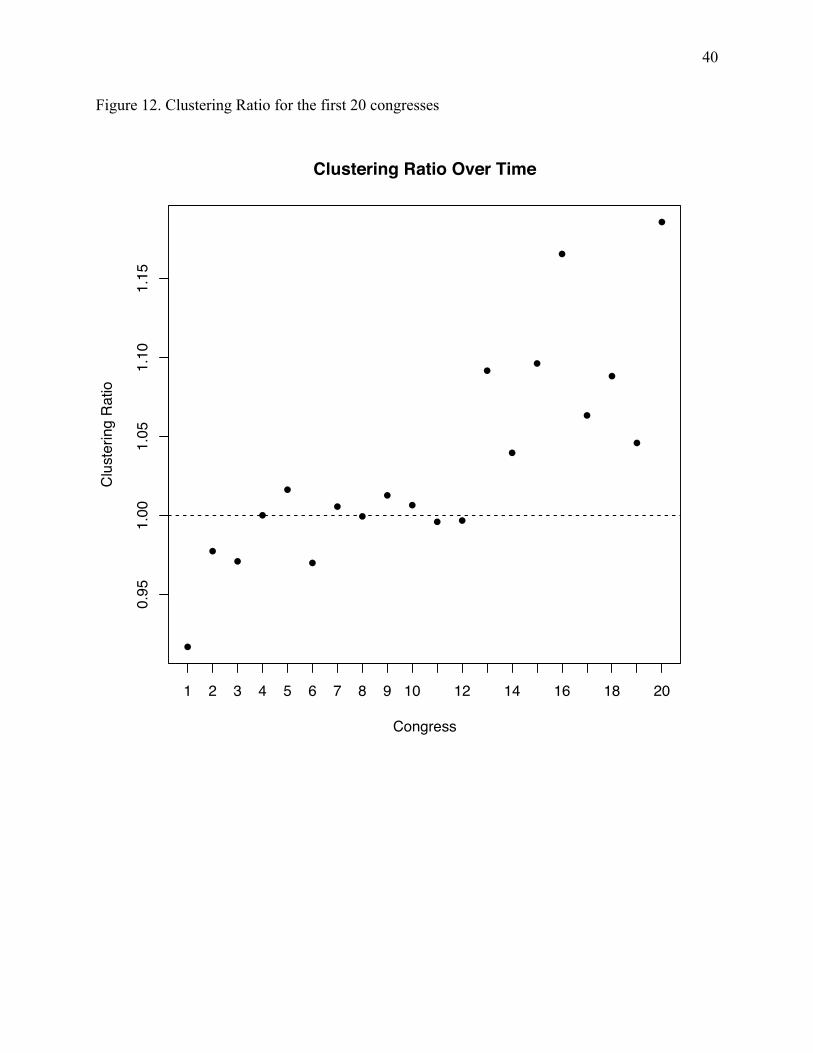
The results are shown in Figure 12. In the first few Congresses, there was less clustering
than we would expect if committees were assigned randomly, but starting around the 12th
Congress, there was a steady increase in clustering. This may reflect two factors. First, in the
first few Congresses, there were so many committees to be assigned and such rudimentary
recordkeeping that it may have been difficult to re-constitute previously appointed committee
configurations even if it was desired. As time progressed, select committees became much less
common, making it easier to appoint several committees in one Congress with similar
memberships. Second, it was in the 1810s when the House started regularly appointing the
“quasi-standing committees” that are discussed above. It is possible that this practice alone may
be driving the discontinuity in the normalized clustering ratio reported in Figure 12.
[Figure 12 about here]
Conclusions
The purpose of this paper has been to renew analysis into the early committee system of the
House of Representatives, in order to understand the dynamics of that system, both as it behaved
in its earliest form, and as it transformed from one dominated by select committees to one
dominated by standing committees.
Members of the earliest Congresses were, on the whole, experienced with the ways of
legislatures and knowledgeable about the institutional failings of the Congress of the
Confederation. They were presumably willing to create a new national legislature that was more
25
institutionally capable than the old one, and more likely to agree to practices that would
prejudice the new Congress toward action. Still, as members of Congress occupied the
institution and began to legislate, they had to decide how much inequality they were willing to
tolerate in the distribution of influence in the chamber.
The analysis in this paper is preliminary. There are some questions whose answers seem
clear even at this early stage. It is clear, for instance, that the House moved fairly quickly to
establish standing committees where they saw routinized business come before it, such as claims,
appropriations, taxing, and commercial matters. This probably means that influence over
legislation in these matters was mal-distributed from a very early point in the House’s history,
though that is a conjecture that must be tested. It is also clear that members of the House put up
with a more general mal-distribution of influence in the consideration of less routine matters, as
experienced, educated, majority-party members dominated the composition of the select
committee system for most of this period.
But, it is not clear yet how entrenched this mal-distribution was from Congress-to-
Congress. Moreover, one aspect of committee assignments that was likely important but which
we have not yet explored is the role of the speaker’s party and region. Although the speaker was
often from the majority party, in this time period, that was not always the case (Jenkins and
Stewart 2012). Comparing the power of majority party members to speaker’s party members will
shed further light into the processes that generated the committees, as well as the centers of
power in Congress. Most of our analyses still have a lot of noise in them, which suggests that
whatever social regularities were beginning to emerge were doing so slowly. That suggests that
there is quite a bit more work to be done before we settle on a complete description of how the
congressional committee system emerged from its humble beginnings.

26
Finally, there is the question of how dispersed or concentrated political influences was in
crafting legislation in the House. Because the complete time covered by this paper cover a
period when the House transformed from select committee dominance to dominance by standing
committees, the analysis will be incomplete until we combine the analysis reported here with
complementary analysis involving the standing committees. It bears noting that even as
legislation slide from being overseen by select committees to being oversee by standing
committees, a significant portion of the House was denied membership on either type of
committee. For instance, by the end of the period, only about 3/5 of House members even served
on a single standing committee. At a time when national politics was presumably democratizing,
it is not at all clear whether the evolving committee structure in the period covered here was in
step with these larger political currents.
27
Citations
Bach, Stanley. 1990. Suspension of the rules, the order of business, and the development of congressional procedure. Legislative Studies Quarterly 15(1): 49–63.
Binder, Sarah A. 1995. Partisanship and procedural choice: Institutional change in the early
Congress, 1789–1823. Journal of Politics 57(4):1093–1118. __________. 1996. The partisan basis of procedural choice: Allocating parliamentary rights in
the House, 1789–1990. The American Political Science Review 90(1): 8–20. __________. 1997. Minority rights, majority rule: Partisanship and the development of
Congress. New York: Cambridge University Press. Canon, David T., Garrison Nelson, and Charles Stewart III. 2002. Committees in the U.S.
Congress, 1789–1946: Volume 4, Select Committees. Washington: CQ Press. Cooper, Joseph. 1970. The origins of the standing committees and the development of the
modern House. Houston: Rice University Studies. __________. 1988. Congress and its committees. New York: Garland Press. Cooper, Joseph and Cheryl D. Young. 1989. Bill introduction in the nineteenth century: A study
of institutional change. Legislative Studies Quarterly 14: 67–105. Follett, Mary Parker. 1896. The Speaker of the House of Representatives. New York: Longmans. Fuller, Hubert Bruce. 1909. The Speakers of the House. Boston: Little Brown. Gamm, Gerald and Kenneth Shepsle. 1989. Emergence of legislative institutions: Standing
committees in the House and Senate, 1810–1825. Legislative Studies Quarterly 14:39–66.
Harlow, Ralph V. 1917. The history of legislative methods in the period before 1825. New
Haven: Yale University Press. Hoadley, John F. 1980. The emergence of political parties in Congress, 1789–1803. American
Political Science Review 74(4): 757–79. Jenkins, Jeffery A. 1998. Property rights and the emergence of standing committee dominance in
the 19th century House of Representatives. Legislative Studies Quarterly 23: 493–519. Jenkins, Jeffery A. and Charles Stewart III. 1998. Committee assignments as side payments: The
interplay of leadership and committee development in the era of good feelings. Paper presented at the annual meeting of the Midwest Political Science Association.

28
Jenkins, Jeffery A. and Charles Stewart III. 1999. Order from Chaos: The transformation of the committee system in the House, 1816–1822. Paper presented at the UCSD-Stanford Conference on the History of Congress, January 15–16, 1999.
Jenkins, Jeffery A., and Charles Stewart III. 2012. Fighting for the speakership: The House and
the rise of party government. Princeton: Princeton University Press. Leintz, Gerald R. 1978. House speaker elections and congressional parties, 1789–1860. Capitol
Studies 6:63-89. McConachie, Lauros G. 1898. Congressional committees. New York: Crowell. McPherson, Miller, Lynn Smith-Lovin, and James M. Cook. 2001. Birds of a feather:
Homophily in social networks. Annual Review of Sociology 27: 415–44. Patty, John W. and Maggie Penn. 2016. Network theory and political science. In Oxford
Handbook of Political Networks Eds Jennifer Nicoll Victor, Alexander H. Montgomery, and Mark Lubell. New York: Oxford.
Polsby, Nelson W. 1968. The institutionalization of the U.S. House of Representatives. American
Political Science Review 62(2):114–68. Polsby, Nelson W., Miriam Gallahar, and Barry S. Rundquist. 1969. The growth of the seniority
system in the U.S. House of Representatives. American Political Science Review 63:787–807.
Resch, Tobias, Benjamin Schneer, Maggie McKinley, and Daniel Carpenter. 2016. On the co-
development of petitions and committees in the early U.S. House. Paper presented at the annual meeting of the American Political Science Association, Philadelphia, Penn., September 2016.
Skladony, Thomas W. 1985. The House goes to work: Select and standing committees in the
U.S. House of Representatives, 1789–1828. Congress and the Presidency 12:165–87. Stewart, Charles III. 2007. Architect or tactician? Henry Clay and the institutional development
of the U.S. House of Representatives, In Party, Process, and Political Change in Congress, vol. 2, ed David W. Brady and Mathew D. McCubbins. Stanford: Stanford University Press.
Tibshirani, Robert. 1996. Regression shrinkage and selection via the lasso. Journal of the Royal
Statistical Society. Series B (Methodological): 267-288.

29
Figure 1. Number of select committees appointed, 1st–20th Congress
Figure 2. Number of standing committees appointed, 1st–20th Congress
0
50
100
150
200
250
Num
ber o
f sel
ect c
omm
ittee
s
5 10 15 20Congress
Total for Congress1st sess. 2nd sess. 3rd sess
5
10
15
20
25
30
Num
ber o
f sta
ndin
g co
mm
ittee
s
5 10 15 20Congress

30
Figure 3. Referrals to select and standing committees, 1st–20th Congress
0
500
1000
1500
Ref
erra
ls
5 10 15 20Congress
Cabinet Select committee Standing committee

31
Figure 4. Percentage of select committees that reported back to the House before the end of the session appointed, 1st–20th Congress.
50
60
70
80
90
100
Pct.
5 10 15 20Congress

32
Figure 5. Distribution of the number of select committees served on by members of the House, 1st–20th Congress.
0
20
40
60
0
20
40
60
0
20
40
60
0
20
40
60
0 5 10 15 20 0 5 10 15 20 0 5 10 15 20 0 5 10 15 20 0 5 10 15 20
1 2 3 4 5
6 7 8 9 10
11 12 13 14 15
16 17 18 19 20
Freq
uenc
y
Number of select committee assignmentsGraphs by cong
33
Figure 6. Raw difference in the standardized number of committees, with respect to prior federal office, prior state office, possession of a college degree, majority party status, and representing a southern district. a. Federal office experience
b. State office experience
c. County office experience
d. College degree
5 10 15 20
−2−1
01
2
Prev. Fed. Govt Exp. and Num. of Committees (Standardized)
Congress
Diff
eren
ce in
Num
. of C
omm
ittee
s
●●
●
●
● ●
● ● ●●
●
● ●
●
●
●
●
●
●
●
5 10 15 20
−2−1
01
2
Prev. State Govt Exp. and Num. of Committees (Standardized)
Congress
Diff
eren
ce in
Num
. of C
omm
ittee
s
●
●
●
●●
●
● ●
●
● ●
●
●
●
●
●
●●
●
●
5 10 15 20
−2−1
01
2
Prev. County Govt Exp. and Num. of Committees (Standardized)
Congress
Diff
eren
ce in
Num
. of C
omm
ittee
s
●
●
●
●●
●
●
● ●●
●
●
●
●
●
●
●
●
●
●
5 10 15 20
−2−1
01
2
College Graduate and Num. of Committees (Standardized)
Congress
Diff
eren
ce in
Num
. of C
omm
ittee
s
●
● ●
●
●●
● ●● ●
●●
● ●●
● ● ●
●●

34
e. Region (North/South)
f. Majority party status
5 10 15 20
−2−1
01
2Being a Southerner and Num. of Committees (Standardized)
Congress
Diff
eren
ce in
Num
. of C
omm
ittee
s
●
●
●●
●
●
●
●
●
●
●
●
●
●
●
●●
●●
●
5 10 15 20
−2−1
01
2
Majority Party Status and Num. of Committees (Standardized)
CongressD
iffer
ence
in N
um. o
f Com
mitt
ees
●
●
●
●
●
●
●
●
●
●
●
●
●●
●
●
●
●●
●

35
Figure 7. The effect of a college degree, prior federal office, and prior state office on the number of committees (logged and standardized), controlling for those other covariates. a. College degree
b. Federal office experience
c. State office experience
5 10 15 20
−1.0
−0.5
0.0
0.5
1.0
Effect of College Degree
Index
Effect
● ●
●
●●
●
●
●
●●
●●
●
●
●
●● ● ● ●
5 10 15 20−1.0
−0.5
0.0
0.5
1.0
Effect of Prior Fed. Office
Index
Effect ●
●
●
● ●
●
●
●
●
●
●
●
● ●
●
●
●●
●
●
5 10 15 20
−1.0
−0.5
0.0
0.5
1.0
Effect of Prior State Office
Index
Effect
●
●
●
●
●
●
●
●
●
●●
●
●
●
●
●
●
●
●
●

36
Figure 8. The effect of majority party status, being from the South, and DW-NOMINATE scores on the number of committees (logged and standardized), controlling for those other covariates. a. Majority party
b. South vs. non-south
c. DW-NOMINATE dimension 1
d. DW-NOMINATE dimension 2
5 10 15 20
−1.0
−0.5
0.0
0.5
1.0
Maj. Party Advantage
Index
Effe
ct o
f Bei
ng M
aj. P
arty
●
●
●
●
●
●
●
●
●●
●
●
●
●
●
●
●
●
●
●
5 10 15 20−1
.0−0
.50.
00.
51.
0
Southern Advantage
Index
Effe
ct o
f Bei
ng S
outh
ern
●
●
●●
●
●
●
●
● ●
●
●
●
●
●
●
● ●
●
●
5 10 15 20
−1.0
−0.5
0.0
0.5
1.0
1.5
2.0
Nominate 1 Advantage
Index
Effe
ct o
f Nom
. 1 s
core
●
●
● ●
●
●
●
● ●
● ●●
●
●
●
●
●
●
● ●
5 10 15 20
−1.0
−0.5
0.0
0.5
1.0
Nominate 2 Advantage
Index
Effe
ct o
f Nom
inat
e 2
scor
e
●
●
● ●
●
●
●
● ●● ●
●
●
●
●
●
●
●
●
●

37
Figure 9. The results of the LASSO regression
Variables selected by LASSO per Congress
Congress
2 4 6 8 10 12 14 16 18 20
AgePrev. County Office
Prior Occup: BusinessPrior Occup: Agric.
Prev. Local OfficeMid−Atlantic
SouthMajor/Lieutenant
Prior Occup: misc.Colonel/Captain
Military non−officerNew England
Captain/LieutenantLieutenant/ColonelLieutenant/EnsignPrior Occup. Prof.
Prior Munic. OfficeMajority Party
West North CentralMilitary Service
Prior Occup: EducatorPrev. State OfficePriv. High SchoolAdmiral/General
Ivy League CollegeEast North Central
SeniorityOther CollegeBorder State
Prev. Fed. OfficeLawyer

38
Figure 10. The proportion of committees controlled by the majority party or the south, compared to the mean of permuted Congresses.
●
●
●
●
●
●
●
●
●
●
●
●
●
●
●
●
●●
●
●
1 2 3 4 5 6 7 8 9 10 12 14 16 18 20
−0.2
−0.1
0.0
0.1
0.2
0.3
0.4
0.5
Committee Control
Congress
Prop
ortio
n co
ntro
lled −
expe
cted
pro
porti
on c
ontro
lled
●
●
●●
●
●
●
●
●●
● ●
●
●
●●
●
●
●
●
●
●
Maj. PartySouth

39
Figure 11. The proportion of committees controlled by the majority party or the south compared to random assignments, holding the total number of committees per member and committee size constant.
0 5 10 15 20
−0.2
0.0
0.1
0.2
Proportion of Committees Controlled by Maj. Party
True
Pro
p. c
ompa
red
to 9
5% S
im. i
nter
val
0 5 10 15 20
−0.2
0.0
0.1
0.2
Proportion of Committees Controlled by South
True
Pro
p. c
ompa
red
to 9
5% S
im. i
nter
val
40
Figure 12. Clustering Ratio for the first 20 congresses
●
●●
●
●
●
●●
●●
● ●
●
●
●
●
●
●
●
●
1 2 3 4 5 6 7 8 9 10 12 14 16 18 20
0.95
1.00
1.05
1.10
1.15
Clustering Ratio Over Time
Congress
Clu
ster
ing
Rat
io

41
Table 1. Standing committees created in the House, 1st–20th Congress
Cong. Speaker Housekeeping/
Internal Claims/
Private legislation General legislation Executive oversight 1 Muhlenberg Elections 2 Trumbull 3 Muhlenberg Claims 4 Dayton Revisal & Unfinished
Business -Commerce & Manufactures*
-Ways & Means
5 Dayton/Dent 6 Sedgwick 7 Macon 8 Macon Accounts 9 Macon Public Lands
10 Varnum District of Columbia Post Office & Post Roads 11 Varnum 12 Clay 13 Clay/Cheves Pensions & Revolutionary
Claims** Judiciary Public Expenditures
14 Clay Private Land Claims Expenditures in the Departments of State, Treasury, War, Navy, P.O. and in Public Buildings (6 committees)
15 Clay 16 Clay/Taylor Agriculture 17 Barbour -Indian Affairs
-Foreign Affairs -Military Affairs -Naval Affairs
18 Clay 19 Taylor Military Pensions Territories 20 Stevenson
*Separate committees on Commerce and Manufactures were appointed in the 16th Congress **Name changed to Revolutionary Claims in the 19th Congress.

42
Table 2. Referrals to standing committees in the House Journal, 1st–20th Congress.
Congress
Committee 1 2 3 4 5 6 7 8 9 10 11 12 13 14 15 16 17 18 19 20
Elections 4 0 5 9 4 1 3 20 3 12 10 3 9 11 10 8 6 8 9 1
Claims - - 69 134 92 98 84 124 140 121 232 249 251 178 193 173 191 120 138 124
Commerce and Manufactures - - - 83 60 63 71 76 79 111 143 133 53 109 105 83 118 60 - -
Revisal And Unfinished - - - 0 2 5 0 0 0 2 0 0 1 0 0 0 0 0 0 0
Ways and Means - - - 16 19 14 31 34 54 36 33 92 182 157 136 95 94 94 91 104
Accounts - - - - - - - 0 2 2 0 0 1 0 0 2 1 0 1 1
Public Lands - - - - - - - - 73 59 82 103 107 136 96 84 111 95 114 107
District of Columbia - - - - - - - - - 27 35 33 29 29 17 25 34 23 29 28
Post Office and Post Roads - - - - - - - - - 100 98 72 135 114 95 89 84 63 69 79
Judiciary - - - - - - - - - - - - 17 30 43 66 69 60 68 79
Pensions and Revolutionary Claims - - - - - - - - - - - - 137 169 155 133 109 101 - -
Public Expenditures - - - - - - - - - - - - 1 5 1 0 0 1 2 0
Expenditures in the Executive Departments* - - - - - - - - - - - - - 0 0 3 6 0 4 3
Private Land Claims - - - - - - - - - - - - - 28 94 57 43 59 69 62
Agriculture - - - - - - - - - - - - - - - 2 3 2 2 7
Foreign Affairs - - - - - - - - - - - - - - - - 7 33 26 44
Indian Affairs - - - - - - - - - - - - - - - - 20 17 35 27
Military Affairs - - - - - - - - - - - - - - - - 76 60 79 45
Naval Affairs - - - - - - - - - - - - - - - - 38 41 47 51
Commerce - - - - - - - - - - - - - - - - - - 101 106
Manufactures - - - - - - - - - - - - - - - - - - 12 28
Military Pensions - - - - - - - - - - - - - - - - - - 92 120
Revolutionary Claims - - - - - - - - - - - - - - - - - - 75 70
Territories - - - - - - - - - - - - - - - - - - 9 11 *Includes referrals to all six committees with jurisdictions to oversee expenditures in the executive departments.

43
Table 3. Regression of the number of select committees on party and valence factors. (Standard errors in parentheses)
Poisson regression OLS OLS OLS Majority party member
0.10 (0.02)
0.22 (0.08)
0.17 (0.05)
0.17 (0.05)
From the South 0.062 (0.019)
0.20 (0.07)
— —
Years of House service
0.13 (0.02)
0.17 (0.05)
— 0.077 (0.032)
Years of House service squared
-0.020 (0.003)
-0.025 (0.007)
— -0.005 (0.003)
Attended college 0.26 (0.02)
0.55 (0.08)
— —
Prior federal office 0.28 (0.03)
0.52 (0.12)
— —
Prior state office 0.02 (0.02)
0.18 (0.08)
— —
Constant 2.23 (0.05)
1.36 (0.27)
— —
N 2,987 2,987 2,996 2,996
llf -7289 — — — R2 — .29 .008 .008 Congress fixed eff. Yes Yes Yes Yes Member fixed eff. No No Yes Yes


