The Returns to Hedge Fund Activism fileAbstract Hedge fund activism is a new form of arbitrage....
35
Law Working Paper N°.098/2008 March 2008 Alon Brav Duke University Wei Jiang Columbia University Frank Partnoy University of San Diego Randall Thomas Vanderbilt University © Alon Brav, Wei Jiang, Frank Partnoy and Randall Thomas 2008. All rights reserved. Short sections of text, not to exceed two paragraphs, may be quoted without explicit permission provided that full credit, including © notice, is given to the source. This paper can be downloaded without charge from: http://ssrn.com/abstract=1111778. www.ecgi.org/wp The Returns to Hedge Fund Activism
Transcript of The Returns to Hedge Fund Activism fileAbstract Hedge fund activism is a new form of arbitrage....

Law Working Paper N°.098/2008
March 2008
Alon Brav Duke University
Wei JiangColumbia University
Frank PartnoyUniversity of San Diego
Randall ThomasVanderbilt University
© Alon Brav, Wei Jiang, Frank Partnoy and Randall
Thomas 2008. All rights reserved. Short sections of
text, not to exceed two paragraphs, may be quoted
without explicit permission provided that full credit,
including © notice, is given to the source.
This paper can be downloaded without charge from:
http://ssrn.com/abstract=1111778.
www.ecgi.org/wp
The Returns to Hedge Fund Activism

ECGI Working Paper Series in Law
Working Paper N°.098/2008
March 2008
Alon Brav Wei Jiang
Frank PartnoyRandall Thomas
The Returns to Hedge Fund Activism
This article is an augmented version of “Hedge Fund Activism, Corporate Governance, and Firm
Performance,” forthcoming in the Journal of Finance. We have added additional analysis on hedge
fund performance and present some results that are not contained in our earlier work.
© Alon Brav, Wei Jiang, Frank Partnoy and Randall Thomas 2008. All rights reserved. Short
sections of text, not to exceed two paragraphs, may be quoted without explicit permission provided
that full credit, including © notice, is given to the source.
Abstract
Hedge fund activism is a new form of arbitrage. Using a large hand-collected data set from
2001 to 2006 we fi nd that activist hedge funds in the U.S. propose strategic, operational,
and fi nancial remedies and attain success or partial success in two-thirds of the cases. The
abnormal stock return upon announcement of activism is approximately seven percent,
with no reversal during the subsequent year. Target fi rms experience increases in payout,
operating performance, and higher CEO turnover after activism. We also fi nd large positive
abnormal return to the self-reported hedge fund activists during our sample period. The
abnormal return signifi cantly exceeds the returns to all hedge funds, the returns to equity-
oriented hedge funds and is robust to alternative risk adjustments and selection biases.
Keywords: Hedge Fund, Activism, Governance
JEL Classifications: G14, G23, G3
Alon BravDuke University - Fuqua School of Business
Box 90120
Durham, NC 27708-0120
United States
phone: 919-660-2908
fax: 919-684-2818
e-mail: [email protected].
Wei JiangColumbia Business School - Finance and Economics Division
3022 Broadway
New York , NY 10027
United States
phone: 212-854-9679
fax: 212-316-9180
e-mail: [email protected].
Frank PartnoyUniversity of San Diego - School of Law
5998 Alcala Park
San Diego , CA 92110-2492
United States
phone: 619-260-2352
fax: 619-260-4180
e-mail: [email protected].
Randall ThomasVanderbilt University - School of Law
131 21st Avenue South
Nashville , TN 37203-1181
United States
phone: 615-343-3814
fax: 615-322-6631
e-mail: [email protected].
1
The Returns to Hedge Fund Activism
Alon Brav, Wei Jiang, Frank Partnoy, and Randall Thomas1
Hedge fund activism is a new form of arbitrage. Using a large hand-collected data set from 2001 to 2006 we find that activist hedge funds in the U.S. propose strategic, operational, and financial remedies and attain success or partial success in two-thirds of the cases. The abnormal stock return upon announcement of activism is approximately seven percent, with no reversal during the subsequent year. Target firms experience increases in payout, operating performance, and higher CEO turnover after activism. We also find large positive abnormal return to the self-reported hedge fund activists during our sample period. The abnormal return significantly exceeds the returns to all hedge funds, the returns to equity-oriented hedge funds and is robust to alternative risk adjustments and selection biases.
In this paper, we analyze the most extensive and thoroughly documented dataset of hedge
fund activism to date, extending from the beginning of 2001 through the end of 2006. We find
that hedge funds increasingly engage in a new form of shareholder activism and monitoring that
differs fundamentally from previous activist efforts by other institutional investors. In particular,
we find that hedge fund activism is a new form of arbitrage that generates large positive
abnormal returns for both shareholders in the target companies and those in the activist hedge
funds. This strong performance is robust against a range of asset pricing models including
controls for size, book to market, and momentum effects.
When we compare the returns to self-reported activist hedge funds with those to the S&P
500 index, we find that our activism index tracks the S&P 500 index very closely through mid-
2000, but then departs significantly upward. Moreover, since 2003, activist funds have
outperformed not only the S&P, but also equity-oriented hedge funds.
1 Brav is with Duke University, Durham, NC 27708, Tel: (919) 660-2908, email: [email protected]. Jiang is with Columbia University, New York, NY 10027, Tel: (212) 854-9002, email: [email protected]. Partnoy is with University of San Diego, San Diego CA 92110, Tel: (619) 260-2352, email: [email protected]. Thomas is with Vanderbilt University, Nashville TN 37203, Tel: (615) 343-3814, email: [email protected]. Author Note: This article is an augmented version of “Hedge Fund Activism, Corporate Governance, and Firm Performance,” forthcoming in the Journal of Finance. We have added additional analysis on hedge fund performance and present some results that are not contained in our earlier work.

2
Some, but not all, of the positive returns are from the market’s favorable reaction to the
announcement of activism, which is consistent with the view that activism creates value. The
filing of a Schedule 13D revealing an activist fund’s investment in a target firm results in large
positive average abnormal returns, in the range of 7 percent to 8 percent, during the (-20,+20)
announcement window. The increase in both price and abnormal trading volume of target shares
begins about 10 days prior to the 13D’s filing. We find that these positive returns at
announcement are not reversed over time. Activism that targets the sale of the company or
changes in business strategy, such as refocusing and spinning-off noncore assets, is associated
with the largest positive abnormal partial effects.
We examine hedge fund strategies in detail in order to analyze the factors that contribute
to the large returns. Hedge fund activists tend to target companies that resemble “value” firms,
with low market value relative to book value, although they are profitable with sound operating
cash flows and return on assets. Payout at these companies before intervention is lower than that
of matched firms. Target companies also have more takeover defenses and pay their CEOs
considerably more than comparable companies. Relatively few targeted companies are large-cap
firms. Targets exhibit significantly higher institutional ownership and trading liquidity. These
characteristics make it easier for activists to acquire a significant stake quickly.
Finally, we find that hedge fund activists are not short-term in focus, as some critics have
claimed. Their median holding period for completed deals is about one year, calculated as from
the date a hedge fund files a Schedule 13D to the date when the fund no longer holds a
significant stake (5 percent) in a target company. Analysis of portfolio turnover rates of the
funds in our sample suggests holding periods of closer to 20 months.
The paper proceeds as follows. Section I provides the institutional background, a brief
review of the literature on shareholder activism, and the key characteristics of the sample.
Section II looks at the stock market’s reaction to hedge fund activism and target firm average
return subsequent to announced activism. Section III analyzes the profitability of activism by
measuring fund abnormal return. We present our conclusions in Section IV.
3
I. Hedge Funds and Shareholder Activism
What is a hedge fund? Although there is no generally agreed-upon definition of a hedge
fund, hedge funds usually are identified by four characteristics: (1) they are pooled, privately
organized investment vehicles; (2) they are administered by professional investment managers
with performance-based compensation and significant investments in the fund; (3) they are not
widely available to the public; and (4) they operate outside of securities regulation and
registration requirements.2 Most crucially, hedge funds avoid much regulation, including the
Investment Company Act of 1940, by having a relatively small number of sophisticated
investors.
Hedge fund activists have four important advantages over other types of engaged,
monitoring investors. First, unlike other institutional investors, hedge fund managers have
sharper incentives to generate positive returns than their counterparts at other institutions.3 A
typical hedge fund charges its investors a fixed annual fee of two percent of its assets plus a
twenty percent performance fee based on the fund’s annual return. Second, hedge funds may
hold undiversified portfolios consisting of large block holdings in individual companies and may
use leverage and derivatives, strategies that are prohibited for many institutional investors.
Third, hedge funds may require that investors agree to “lock-up” their funds for period of two
years or longer, whereas mutual funds are required by law to sell securities within one day of an
investor redemption request. Finally, hedge fund managers are unregulated and typically suffer
fewer conflicts of interest than managers at other institutions. Each of these factors gives hedge
fund managers more freedom to engage in activism than other categories of investors.
The lack of a central database of activist hedge funds has hindered research on hedge
fund shareholder activism. Private hedge fund databases include primarily non-activist funds,
and exclude some activist funds. As a result we were forced to create our own database.
2 A Securities and Exchange Commission roundtable discussion on hedge funds considered fourteen different definitions. See SEC Roundtable on Hedge Funds (2003), http://www.connectlive.com/events/sechedgefunds/. Partnoy and Thomas (2007) describe the distinguishing characteristics of hedge funds in greater detail. 3 Although private equity and venture capital funds also have powerful incentives to generate positive returns, those funds are distinguished from hedge funds because of their focus on particular private capital markets. Private equity investors typically target private firms or going private transactions, and acquire larger percentage ownership stakes than hedge fund activists. Venture capital investors typically target private firms exclusively, with a view to selling the company, merging, or going public, and therefore they invest at much earlier stages than both private equity and activist hedge funds. There is overlap among private equity, venture capital, and hedge funds, and some funds pursue multiple strategies.

4
Fortunately, we were able to take advantage of two securities law requirements that apply to
hedge funds which require them to publicly disclose their holdings in their portfolio firms. First,
Section 13(d) of the Securities Exchange Act of 1934 requires that any investor, including a
hedge fund, must file a Schedule 13D with the SEC within ten days of acquiring more than five
percent of any class of securities of a publicly traded company if they have an interest in
influencing the management of the company.4 Second, Section 13(f) of the Securities Exchange
Act of 1934 provides that institutional investors who manage more than $100 million must file a
Form 13F each calendar quarter setting forth the number of shares they hold in exchange-traded
companies. Hedge fund activists with significant assets under management must make quarterly
Form 13F filings to report their holdings.
To construct a comprehensive, independent sample of hedge fund activism based on
these securities filings, we first purchased a list of all 11,602 Schedule 13D filers during the
period 2001-2006 from LiveEdgar. We culled hedge funds from that list by inspecting the
names and descriptions of the filers as reported on these filings, searching the internet, and then
telephoning remaining filers we were unable to categorize initially. We excluded filers who
made only one Schedule 13D filing during the sample period and did not indicate an explicit
purpose, and we also excluded events focused on bankruptcy, risk arbitrage, and closed-end
funds.5
Given the amount of capital required to acquire a 5 percent stake in a large-cap company,
the Schedule 13D-based search could bias the sample toward smaller targets. At very large firms,
some hedge funds have engaged in activism with less than a 5 percent stake in the target
company. We therefore used the Thomson Financial Form 13F database to add events involving
companies with market value of greater than $1 billion (roughly the median market capitalization
of NYSE listed firms during the relevant times), and with ownership by a hedge fund in our
sample of greater than two percent.
Our final sample consists of 236 hedge funds we had identified, and their 1,059 events
involving 882 target companies. For each event we gathered information about the filing date,
4 In particular, Item 4 of Schedule 13D requires the filer to declare its reasons for acquiring the shares, particularly if the intention is to engage in merger and acquisition activity, seek a sale of any material amount of the issuer’s assets, pursue a change in its capitalization or dividend policy, or propose other types of corporate changes. 5 This study was focused on hedge fund activism in regular corporations. See Bradley, Brav, Goldstein, and Jiang (2007) for an exclusive study on shareholder activism in closed-end funds.

5
ownership, purchase cost, and purpose from the Schedule 13D filings of the fund. We
supplemented this data with extensive news searches in Factiva using the hedge fund and target
company names as key words. From the news articles, we gathered information that was
frequently not available in the securities filings, such as the hedge fund’s motive, the target’s
response, and the development and resolution of the events. At various stages during this process,
we have also shown our list of hedge funds to participants in the hedge fund industry and
obtained comments and suggestions for additions or deletions. We also used additional SEC
filings, such as the Schedule 14A, when they were available to obtain further information on
some of the interventions.
A. Objectives of Hedge Fund Activism Table I summarizes the stated objectives that the activist funds provide when they
announce activism in their target firms as well as the associated success (and partial success)
rates. Hedge fund activists’ professed motives can be classified into five major categories, each
containing multiple subcategories. With the exception of the first category, where the hedge
fund makes only the general statement that it seeks to maximize shareholder wealth, the
objectives are not mutually exclusive as one activist event can target multiple issues. We
classify an event as successful if the hedge fund achieves its main stated goal, or as a partial
success if the hedge fund and the company reach some settlement through negotiation that
partially meets the fund’s original goal.
[Insert Table 1 here]
The last four overlapping categories in Table 1 describe four specific objectives: changes
to firm capital structure; altering firm business strategy; seeking a sale of the target company;
and making improvements to firm corporate governance. The first grouping includes activists
pursuing objectives related to payout policy and capital structure. In 12.7 percent of all events,
they seek to reduce the target’s excess cash, increase leverage, or increase dividends and share
repurchases. In an additional 6.1 percent of events, activist hedge funds pursue debt
restructuring or recapitalization, or try to stop or reduce new equity offerings.

6
Category two covers activists seeking changes in business strategy, which we break out
into five subcategories. The first of these subgroups covers operational efficiencies, such as cost
cutting, which is present in 12.4 percent of events, and goes on to report on activism seeking
restructuring and spinoffs in another 9.1 percent of events. Roughly ten percent of the sample
involves activists targeting merger decisions, by both acquirers and targets. These events differ
from risk arbitrage in that the activist intervenes to press for better terms or to try to stop a deal.
Finally, subgroup number five illustrates that in a small number of events, activists make
proposals to improve the firm’s growth strategy.
The third very important group relates to activists pursuing the sale of the target company.
Most of these cases, 14.0 percent of the sample, involve efforts to sell the company or its assets
to a third party. A smaller number (4.2 percent) involve a buyout or going private transaction
where the activist is the potential acquirer.
The last and biggest category covers events where the activist targets one or more of a
range of governance objectives. The most common focus is on the board independence, where
hedge funds seek to install more independent directors, or better investor representation, at
targeted firms. This happens in 15.0 percent of all cases in the sample. Other less common
corporate governance goals include rescission of takeover defenses, improved disclosure, and
improved compensation policies, each of which is found in about 5 percent of the events. Finally,
hedge fund activists state that they are seeking to oust the targeted firm’s CEO or chairman in 5.6
percent of all events.
Overall, hedge fund activism achieves full or partial success in roughly two-thirds of
events. Activists achieve their major stated goals in 40.6 percent of cases, and obtain partial
success 25.8 percent of the time. Although not shown in the table, overall success rates in non-
hostile cases are roughly comparable to those in hostile cases, although complete success is more
likely and partial success is less likely in non-hostile situations. These results suggest that a
negotiated compromise is the likely outcome in hostile cases.

7
B. Targets of Hedge Fund Activism Turning next to the characteristics of the firms targeted by hedge fund activists, Table 2
shows that hedge fund activists resemble “value investors.” The first three columns of Table 2
provide descriptive statistics for selected characteristics of firms targeted by activist hedge funds,
while the remaining three columns show the differences between targeted firms and a set of
industry/size/book-to-market matched firms for each of these variables. The targets of activism
were firms with lower market value relative to book value, better ROA, lower payouts to
shareholders, and more takeover defenses, than comparable non-targeted firms. These firms had
greater institutional investor ownership and more analyst coverage, indicating that their shares
tend to be in more sophisticated hands and trade in more liquid markets than comparable non-
targeted firms. Target firms were profitable with sound operating cash flows and returns, and
tended to have low levels of R&D spending plus a higher degree of diversification than non-
targeted firms.
[Insert Table 2 here]
Overall, the potential problems that hedge funds identify at targeted firms are more often
issues that are generalizable to all firms, such as changes in governance and payout policies,
rather than issues that are specific to one or a small number of target firms, such as slipping sales
of a particular product. Targeted firms do not seem to suffer from serious operational
difficulties. 6 They are actually profitable and enjoy handsome cash flows. The potential
problems that these companies face are likely related to the agency problem of free cash flows,
such as relatively low dividend yield and diversifying investments that might not be in the best
interest of shareholders. Governance issues, including rescinding takeover defenses, ousting
CEOs, promoting board independence, and curtailing executive compensation, are also
commonly cited as reasons for activism.
These characteristics are important to the results presented here, because they suggest
that hedge fund activists are implementing general strategies at well understood firms that
market participants are likely to appreciate. Focusing on issues that are generalizable to other 6 We exclude from our sample firms where the hedge funds are engaging in distress-related activism.

8
potential target firms also helps hedge funds lower the marginal cost of launching activism at a
new company (Black (1990)). Hedge funds generally avoid “opaque” and complicated
businesses, such as those with high levels of R&D, to avoid delays in the resolution in the market
price of the intervention’s impact. This is consistent with the predictions of Kahn and Winton
(1998) that investor intervention is most likely at firms where improvements will rapidly be
reflected in the share price.
Hedge fund activists almost never acquire control blocks. Instead, the overwhelming
majority of our events involved purchase of between 5-10 percent of target shares. For the entire
sample, the median initial stakes of activists are roughly 6 percent of target firm equity securities,
costing about $12 million dollars, in constant 2006 terms. Although some investors prefer to
keep their ownership stakes below the 5 percent trigger for Schedule 13D filings (these events
are included in our sample if are mentioned in news articles), hedge fund activists generally seek
to exceed that level of ownership, in part because Schedule 13D filings frequently generate
media interest and publicity, but also because the act of filing, and the potential legal liability
associated with any disclosures made in a Schedule 13D, reinforce an activist hedge fund’s
credibility with investors. Conversely, hedge fund activists generally prefer not to acquire stakes
of 10 percent or more, because 10 percent ownership triggers the short swing profit provisions in
section 16 of the 1934 Exchange Act as well as presenting other issues.
Finally, median hedge fund activist holding periods are in the range of one year or more.
Focusing on the subsample of the completed events where the fund is reported to have
significantly reduced its ownership level below the five percent level of ownership, we find that
the median duration from the first Schedule 13D filing to “exit” is 369 days. The 25th and 75th
percentile figures for the full sample are 169 days and 647 days. This, however, excludes 47.6
percent of the sample for which we are unable to find exit information because of the recent
nature of the investments. Focusing solely on the events in which hedge funds have exited
grossly underestimates the unconditional duration of hedge funds’ investment in the target
companies. However, even this one-year investment horizon is longer than the short-term trading
periods claimed by early critics of hedge fund activism. We do an additional analysis using the
Form 13F quarterly filings of holdings and find that the median annualized equity long position
turnover rate is 55 percent for our sample hedge funds, implying an average holding period of 22
months.

9
II. Short- and Long-Run Market Reactions to Hedge Fund Activism
A crucial question about hedge fund activism is whether it achieves its stated goal of
creating value for shareholders. In this section, we examine stock market returns, both short-
term announcement event-day returns and the long-run returns. Our analysis addresses the
question of how the market perceives the effect of hedge fund activism on shareholder value and
whether the long-run measures are consistent with the market’s perception.
A. Short-Run Market Reactions Figure 1 plots the average abnormal buy-and-hold return during the (-20, 20) window
surrounding the activist hedge funds’ Schedule 13D filings.7 The average abnormal return is 7.2
percent. Sixty-two percent of the events have a positive abnormal return in the (-20, 20) window.
[Insert Figure 1 here]
About half of the total abnormal return, approximately 3.5 percent, is achieved during the
ten days prior to filing, which means it takes place before public disclosure of the activist’s five
percent investment stake, or the public announcement of an activist campaign (for events with
less than the five-percent stake). Likewise, abnormal share turnover also is high during this pre-
disclosure period. The abnormal return on the filing day and day after filing is another
approximately 2.0 percent. Thereafter, the abnormal return increases steadily to a total of 7.2
percent by twenty days after the filing date. On average, information related to hedge fund
activism appears to begin to be reflected in share prices and trading volumes before the Schedule
13D filing date.
Some hedge funds file a Schedule 13D after publicly announcing their activist intentions
while they hold fewer shares, while other funds do not begin engaging in activism until after they
have filed a Schedule 13D. To test whether the Schedule 13D filing date is an accurate proxy for
the date when activism first becomes publicly known, we separately examined a subsample of
246 events in which the Schedule 13D disclosed new information not previously available. The
7 The abnormal return is the return in excess of the buy-and-hold return on the value weighted NYSE/AMEX/NASDAQ index from CRSP, from 20 days prior to the Schedule 13D filing date to 20 days afterwards the filing date.

10
returns of this sample were similar to those depicted in Figure 1, with a slightly higher abnormal
return of 8.4 percent.
The early stock price increases are consistent with the timing of purchases by hedge fund
activists who buy during the ten-day window before the filing date, because investors are not
required to file Schedule 13Ds until ten days after the transaction that causes them to breach the
five percent ownership threshold. However, some critics of hedge fund activism have suggested
that the pattern of early abnormal returns, before the filing date, stems from “tipping,” in which
the hedge fund activist tells a small numbers of investors about its plans before the filing date, or
“wolf pack” investing, in which several hedge funds, which do not formally coordinate, learn
about the lead hedge fund’s activities before its 13D is filed and buy into the target firm early.
Hedge fund activists deny engaging in these activities, and our data and analysis does not permit
us to test either theory.8
These short-term abnormal returns necessarily underestimate the value of ex post success
by hedge fund activists. If share prices increased by the full expected benefit of activism, hedge
fund activists would have no incentive to continue to hold their stakes and expend resources on
activist strategies. Instead, they would simply sell. Yet hedge fund activists indeed continue to
hold and engage in activism. Accordingly, the initial abnormal return reflects the “partial”
expected value of activism based on investors’ estimate of the probability that the hedge fund
will implement its activist plans. Later, as the hedge fund activist achieves (or fails to achieve)
its goals, the target share price will increase (or decrease) accordingly.
B. Longer-Term (One Year) Market Reactions We next examine whether the short run price reaction is permanent as it is possible that
the (-20, 20) abnormal returns are a manifestation of a temporary spike in prices, caused by
buying pressure. We do so by running calendar-time portfolio regressions around the Schedule
13D filing date. If the longer-term market reaction is positive and permanent, it is unlikely that
the short-term price impact was merely the result of buying pressure from the filing hedge fund
or other hedge funds. In other words, if the announcement abnormal returns were due to trading
8 The hedge fund managers that we have spoken with point out that to do so would drive up their costs of accumulating their stake prior to announcing their activism.

11
friction, those returns should be reversed during longer windows. Yet, as we show below, they
are not.
Table 3 sets forth the results of our calendar-time portfolio regressions. We form
portfolios that buy shares of all firms that will be targeted by a hedge fund in the indicated period
and then hold those shares throughout the specified window. For example, we form a (-3, -1)
portfolio by buying all firms that will be targeted by a hedge fund in three months’ time, and the
firms are held for three months before selling. Similarly, we form a (1, 3) portfolio by buying all
firms that were targeted by hedge funds one month earlier, and these firms are held for three
months before selling. For each such portfolio we estimate a regression of the portfolio excess
returns on the Fama-French RMRF, SMB, and HML factors and the momentum factor, MOM.9
Panels A and B of Table 3 set forth the results based on four-factor models with equal and value-
weighting of firms’ returns. We focus on the regression intercept, the alpha, as evidence for
possible mean reversion in prices. Portfolios formed during pre-event windows are not
implementable strategies, and are presented for purposes of comparing to the post-event stock
return patterns.
[Insert Table 3 here]
The equal-weight model in Panel A shows a statistically significant event month alpha of
5.10 percent. The following (1, 3) month window alpha of 1.09 percent is also significant. The
alphas are positive and revert to near zero during the nine months after filing. The pre-event
alphas are negative, but not statistically significant. The 13D-filing month alpha for the value-
weight model in Panel B is lower and not statistically significant, whereas the pre-event alphas
are negative and significant. These results suggest that larger firms receive a less favorable
response than smaller targets. The value weighted alphas revert to near zero during the year after
filing.
Overall, the calendar time regressions suggest that the short-term abnormal returns are
not market overreactions. Instead, the price that incorporates the event-window abnormal returns 9 We include the Fama and French RMRF, SMB, and HML factors and the momentum factor, MOM. We obtain these factor returns and monthly risk-free rates from Ken French’s web site at Dartmouth College.

12
is sustained during longer periods of time. The positive market reaction is also consistent with ex
post evidence of overall improved performance at target firms. This is supported by Brav, Jiang,
Partnoy and Thomas (2008) findings of ex post real long term improvement in return on assets
and operating profit margins at target firms two years after intervention, as well as total payout
increases and book value leverage increases on average, from the year before to the year after an
announcement.
III. Aggregate Returns to Hedge Fund Activists
In addition to examining market reactions to activism, we also consider the returns
activists earn. Given that activist funds bear most of the cost of intervention but only receive a
small proportion of the direct gain (the typical holdings of these funds in the target companies
are 5-10 percent), it is natural to ask whether such activities are also profitable to the activist
funds (and, as a result, to the investors in these hedge funds). If one views activist investing as a
new form of arbitrage, this question is interesting for at least two reasons: First, profitability by
activist hedge funds is a necessary condition for their survival and long-term viability. Like any
other arbitrage strategy, profitability tends to decrease with competition, as the number of hedge
funds engaging in activism has been increasing steadily over the past few years. A finding of
equilibrium level of profitability ensures that hedge fund activism will remain a staple of
corporate governance in the foreseeable future.
Second, if markets are efficient, abnormal returns to an investment strategy should persist
only when activists have private information. In the conventional setting, superior information is
about the value of the firm that is assumed to be out of the control of the investors (and unknown
to the market). In the context of activist investing, the value of the firm could be potentially
affected by the activist’s action. As a result, the player’s superior information about his own
intention to intervene becomes valuable. Such information, in contrast to the conventional
informed trading, is not proprietary about the firm. Though there is some recent theoretical work
analyzing the intervention-related informed trading (Cornelli and Li (2002), Bond and Eraslan
(2007)), there is little empirical evidence on the sources of superior returns in this setting.

13
A. The Alpha Generated by Activism We explore two sources of data to analyze the returns to our sample of activist hedge
funds. We begin by merging two major hedge fund databases. The first is the CISDM, a hedge
fund database (covering 8,589 funds) maintained by the University of Massachusetts and
available through WRDS to accredited universities. The second is purchased from
HedgeFund.net, owned by Channel Capital Group Inc., which is a leading source for hedge fund
news and performance data. This database covers 11,530 funds, which is among the largest of
all hedge fund data vendors. At the moment this paper is written, the CISDM data has been
updated through the end of 2005 and the HedgeFund.net has been updated to June 2007. In
order to maximize data coverage, we first match our sample hedge funds to HedgeFund.net. For
all remaining unmatched funds after this first round, we then match to CISDM. Altogether we
are able to match 103 unique funds that have at least 12 months of return data, 95 of which are
covered by the HedgeFund.net. We retrieve hedge fund returns from January 1995 (or the
earliest available date) through June 2007 (or the latest reporting date). Both databases keep a
separate file for funds that stopped reporting (including defunct funds and funds that voluntarily
stop reporting). The reported portion of these funds is included in our sample whenever possible.
To analyze the performance of activist hedge funds, we measure their CAPM and four-
factor alphas using both all-sample factor loadings and 36-month rolling window factor loadings.
Specifically, the first method uses the full-sample return data of a fund to estimate the loadings
on the factors and the intercept (alpha). The second method allows time-varying factor loadings
on the factors by the hedge funds. For each month we compute the residuals of a fund’s monthly
returns net of the risk-free rate and returns attributed to the factors, where the estimates of the
loadings on the factors are obtained from the previous 36 months of data (or as many months as
possible, subject to having at least 12 months of data). The resulting time-series average of this
residual is interpreted as the alpha of the fund.
Since our performance measures condition on coverage by the data providers, we seek to
benchmark activist performance against that of other self-reported, non-activist, hedge funds. We
therefore repeat the measurement of fund alphas for two additional hedge fund samples: the first
includes all hedge funds covered by HedgeFund.net; and the second includes all equity-oriented
14
hedge funds in HedgeFund.net.10 The latter group includes the following three categories of
hedge funds: Equity long-only; equity long-short; and equity market neutral. About 70 percent
of our sample activist hedge funds fall into these categories. Other categories that include some
of our sample funds include “Event driven”, “Special situation,” etc. To allow flexibility, we
keep the comparison with all hedge funds.
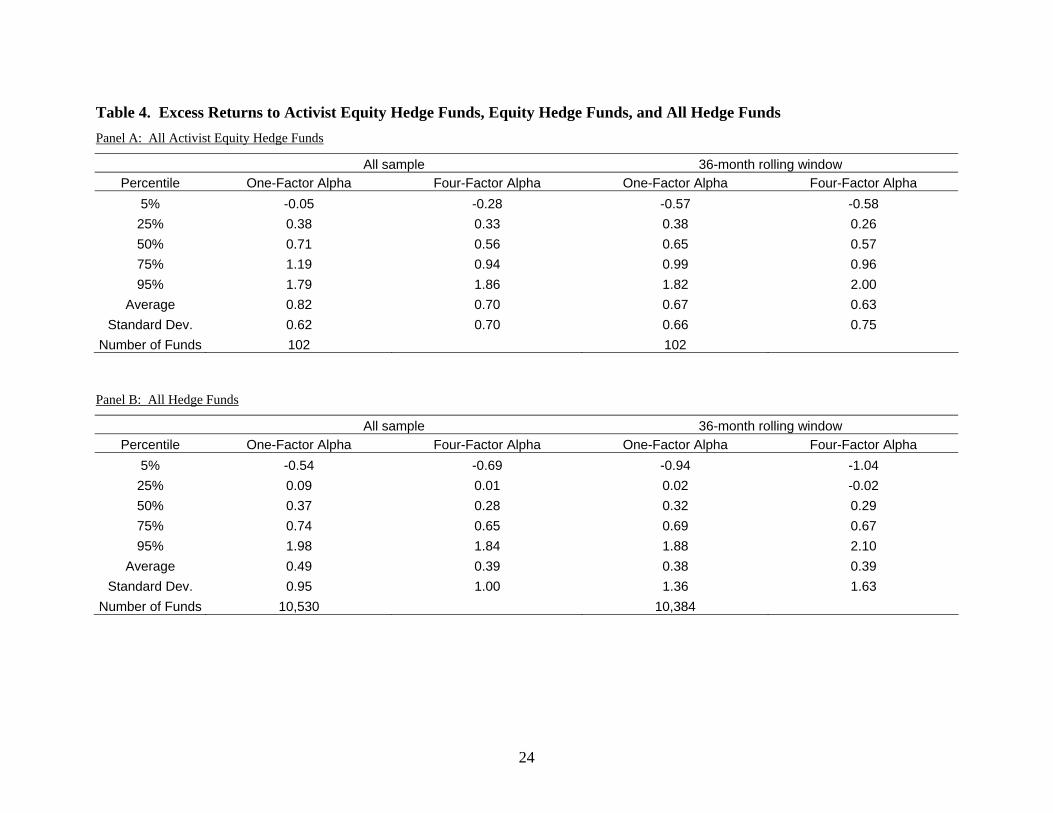
Table 4 Panels A to C show the alphas at the 5th, 25th 50th (median), 75th, and 95th
percentiles of activist hedge funds, all hedge funds and all equity-oriented hedge funds covered
by HedgeFund.net. Examining the date, activist hedge funds on average perform better than the
full sample of self-reported hedge funds (and the subset of equity-oriented hedge funds) by both
the one-factor and four-factor alpha measures. The results are qualitatively similar whether we
use all-sample factor loadings, or 36-month rolling window factor loadings. Specifically, the
average (median) of one- and four-factor monthly alpha of the sample activist hedge funds is
0.82 percent (0.71 percent) and 0.70 percent (0.56 percent), as compared to 0.49 percent (0.37
percent) and 0.39 percent (0.28 percent). The average loadings on the market, size, value, and
momentum factors are 0.33 (t-statistic = 8.71), 0.27 (t-statistic = 6.86), 0.17 (t-statistic = 3.74),
and 0.04 (t-statistic = 1.38), respectively, indicating that most activist hedge funds over-weight
small and value firms, but are not momentum players. Further, the relatively low loading on the
market factor indicates that activists probably hold positions beyond purely long-positions in
common stocks. The size and value tilt is consistent with the characteristics of the target
companies described in Section II. We also conduct the seven-factor analysis as proposed by
Fung and Hsieh (2004), and find that our sample funds have virtually zero loadings on the non-
equity factors.
[Insert Table 4 here.]
Aggregating the returns of all activist funds into an “activism index” provides a simple
overview of the time series of these funds’ returns. Figure 2 displays the equal-weighted activist
10 We compare our sample hedge funds to the HedgeFund.net, rather than the CISDM database, because the great majority of our sample funds are matched to HedgeFund.net. Further, HedgeFund.net also covers more hedge funds, and is updated to more recent period, than CISDM. However, the summary statistics from the two databases are very similar. Our conclusion does not change if we use CISDM for comparison.

15
funds monthly return index from January 1995 to June 2007.11 The activism index tracks the
S&P 500 index very closely up to mid-2000 (during which period open activist activities were
much less common), and then departs significantly from the S&P afterwards. During the whole
period, activist funds that reported to the two hedge fund databases significantly outperformed
the S&P, and have also outperformed the average equity-oriented hedge funds in the databases
since 2003.
[Insert Figure 2 here.]
B. Testing For Selection Bias Return analyses based on self-reported hedge fund databases are often subject to criticism
for potential selection bias issues, the most serious bias being the correlation between the
propensity to report (to a hedge fund data vendor) and return performance (Baquero, ter Horst
and Verbeek (2005)). To date there is no general agreement on the direction of the bias, or the
sign of the correlation. To the extent that the self-reporting bias is no more favorable to activist
hedge funds than to other equity hedge funds, Figure 2 and Table 4 indicate that activist hedge
funds are among the better performers relative to the sample of self-reporting hedge funds.
We attempt to address the self-reporting issue using two additional data sources. First, as
noted above, the market response to announced activism is an informative indicator for the
perceived success of the activist fund. In a rational market, the abnormal return during the
announcement window should be an unbiased estimate for the value creation brought about by
the hedge fund (adjusted for the probability that the hedge fund will carry out the stated agenda
and succeed). Among our 229 sample funds, the 103 reporting funds see a 3.90 percent average
announcement window abnormal return, while the announcement return for the 126 non-
reporting funds is 6.81 percent.12 The difference is not statistically significant at the 5 percent
level due to a high standard deviation of abnormal returns. However, there is no evidence that
11 In unreported results we find that larger funds perform better than small funds, and therefore equal-weighting fund returns is conservative. 12 Note that the abnormal return averaged at the fund level is lower than the returns averaged at the event level. This is because funds that are involved in more events generate higher announcement window returns.

16
reporting funds are disproportionately successful funds in terms of generating favorable market
reactions upon intervention.
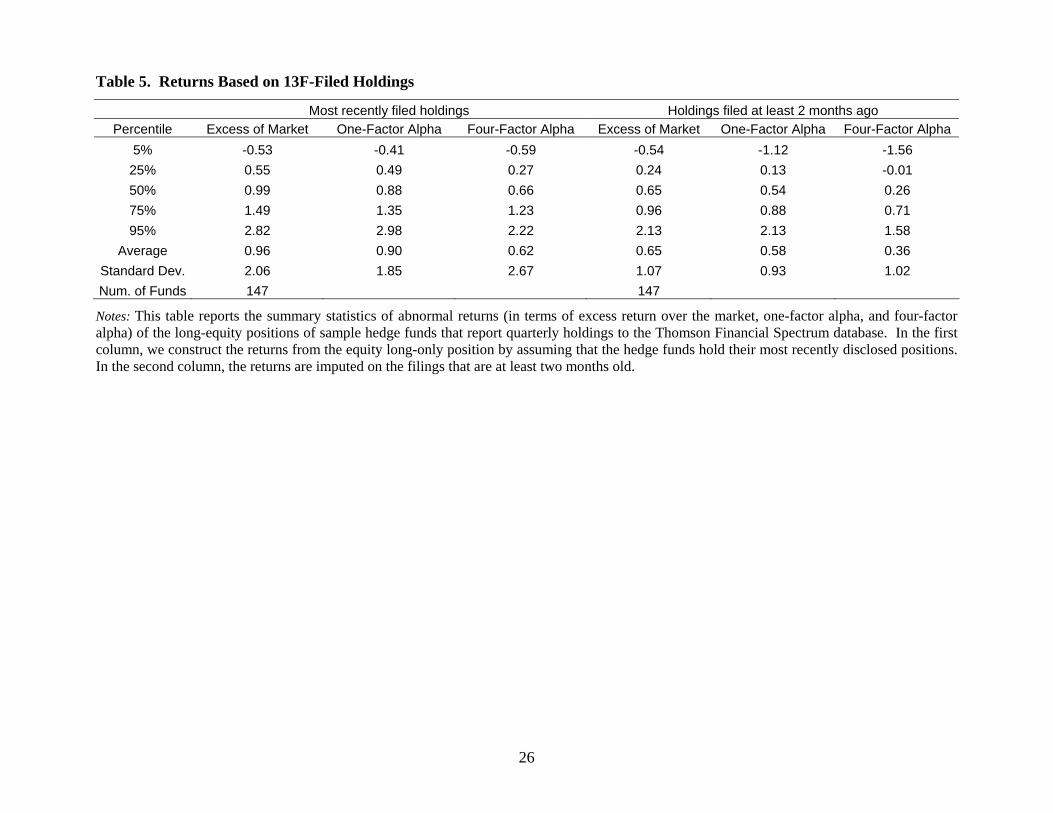
Second, the Thomson Financial 13F filings provide quarterly long equity positions of 147
of our sample funds. We construct the returns from the equity long-only position of our sample
funds by assuming that they hold the most recently disclosed positions. This strategy is meant to
capture the returns to the insider information possessed by the activist funds, and is not
implementable for outside investors given the time lag between the quarter end and filing date
(45 days). Table 5 (first column) shows that our sample funds on average outperform by 0.6
percent to 0.9 percent per month (significantly different from zero at the 1 percent level), a
sizable premium given the lack of abnormal performance of 13F holding returns for hedge funds
(see Griffin and Xu, (2007)). This is consistent with the previous evidence from the returns of
self-reporting hedge funds that activist hedge funds are among the better performers.
[Insert Table 5 here.]
Interestingly, a tradable “copy cat” strategy that holds the most recent publicly available
hedge funds’ 13F holdings yields positive but less impressive alphas. Given that institutions
have 45 days after the quarter end to file their 13F forms, we define the most recent publicly
available filings as the one with a filing date of at least two month earlier. The copy-cat strategy
based on our sample funds would deliver average one- and four-factor alphas in the range of 0.3
percent to 0.6 percent (see the second column of Table 5). The difference between the returns of
the copy-cat strategy and the hedge funds’ long positions indicates that some of the superior
returns can be attributed to non-public information, and this advantage dissipates as the
information is disseminated through the 13F filings.
Among the 147 13F-filing funds, 64 also report to at least one of the two hedge fund
databases mentioned earlier. We find that reporting funds on average have somewhat lower
returns: their average return in excess of the market is 0.70 percent lower (t-stat = -1.91), their
one-factor alpha is 0.63 percent lower (t-stat = -1.78), and their four-factor alpha is 0.73 percent
lower (t-stat = -1.40). Again, the differences between the two groups of funds (self-reporting
17
ones and non-reporting ones) are not statistically significant. What we can conclude, however, is
that the more successful funds (in terms of returns from the long positions in common stocks) are
no more likely to report to hedge fund databases.
Finally, we analyze the cross-sectional variations in the returns of activist hedge funds,
and results are reported in Table 6. The dependent variables are four- and one-factor alphas, as
well as the average announcement window excess returns (the average of which is plotted in
Figure 1). All variables are constructed at the fund level. The first two variables are highly
correlated (with a correlation coefficient of 0.86), and are weakly positively correlated with the
third (about 0.06). There are two sets of independent variables: those capturing the style of
launching activism, and those describing the characteristics of the funds. Variables in the first
group include: the number of companies that the fund targeted during the 2001-2006 period (in
logarithm); the proportion of events launched by the fund that are hostile; and the proportion of
events launched by the fund that aim at the sales of the target companies. The last two variables
are included because we find that that hostile tactics and sales-motivated activism are
particularly well-received by the market. Fund characteristics variables include fund age (in
number of years as of 2006); average assets under management (in logarithm); management fees
(in percentage points); incentive fees (in percentage points); minimum investment (in logarithm);
and the adoption of a high watermark.
[Insert Table 6 here.]
Table 6 indicates that fund performance is very difficult to predict from observed
characteristics. Most of the independent variables are insignificant except that high-fee firms
tend to deliver better performance (after fees). Such a pattern is predicted in theoretical work
(Berk and Green (2004)) and confirmed by empirical evidence (Liang (2001)).

18
IV. Conclusions
This paper examines hedge fund activism using a large-scale sample over the time period
2001 through 2006. We document the heterogeneity in hedge fund objectives and identify
common features of targeted firms. We find positive market reactions to announced hedge fund
intervention. Moreover, although critics of hedge fund activism have argued that activists are
overly short-term in focus, the median holding period of hedge fund activists has been in the
range of one-year.
When we compare the returns to hedge fund activism with those to the S&P 500 index,
we find our activism index tracks the S&P 500 index very closely up to mid-2000, and then
departs significantly upward from the S&P afterwards. Overall, activist funds generate a large
abnormal return, once we control for standard risk factors. Activist funds outperformed the S&P,
and have also outperformed the average equity-oriented hedge funds in the databases since 2003.

19
REFERENCES Amihud, Yakov, 2002, Illiquidity and stock returns: cross-section and time-series effects, Journal
of Financial Markets 5, 31-56.
Baquero, Guillermo, Jenke ter Horst, and Marno Verbeek, 2005, Survival, Look-Ahead Bias and
the Persistence in Hedge Fund Performance, Journal of Financial and Quantitative Analysis
40, 493-517.
Berk, Jonathan, and Richard Green, 2004, Mutual fund flows and performance in rational
markets, Journal of Political Economy 112, 1169—1295.
Black, Bernard S., 1990, Shareholder passivity reexamined, Michigan Law Review 89, 520-608.
Black, Bernard S., 1998, Shareholder activism and corporate governance in the United States, in
Peter Newman, ed., The New Palgrave Dictionary of Economics and the Law (Palgrave
Macmillan).
Bond, Philip and Hülya Eraslan. 2007. “Information-Based Trade.” Working paper, University
of Pennsylvania.
Bradley, Michael, Alon Brav, Itay Goldstein and Wei Jiang, 2007, Shareholder activism and
price dynamics: Evidence from closed-end funds, working paper, Duke University,
University of Pennsylvania, and Columbia University.
Brav, Alon, Wei Jiang, Frank Partnoy, and Randall Thomas. 2008. “Hedge Fund Activism,
Corporate Governance, and Firm Performance.” Journal of Finance, forthcoming.
Cornelli, Francesca and David D. Li. 2002. “Risk Arbitrage in Takeovers.” Review of Financial
Studies, vol. 15: 837-868.
Fung, William and David Hsieh. 2004. "Hedge Fund Benchmarks: A Risk-Based Approach."
Financial Analyst Journal, vol. 60: 65-80.
Griffin, John and Jin Xu. 2007. “How Smart are the Smart Guys? A Unique View from Hedge
Fund Stock Holdings.” Review of Financial Studies, forthcoming.
Kahn, Charles, and Andrew Winton, 1998, Ownership structure, speculation, and shareholder
intervention, Journal of Finance 53, 99-129.

20
Liang, Bin, 2001, Hedge Fund Performance: 1990-1999, Financial Analyst Journal 57, 11-18.
Partnoy, Frank, and Randall Thomas, 2007, Gap Filling, Hedge Funds, and Financial Innovation,
in New Financial Instruments and Institutions, Brookings Institution Press.

21
Table 1. Summary of Hedge Fund Activism: 2001-2006
(1) (2) (3) (4) (5)
All Events Objective categories:
Num. of Events % of Sample % Success % Partial Success
Num. of Hostile Events
1. General undervaluation/maximize shareholder value 511 48.3% -- -- --
2. Capital Structure
-- Excess Cash, under-leverage, dividends/repurchases 134 12.7% 32.0% 32.0% 65
-- Equity issuance, restructure debt, recapitalization 65 6.1% 37.3% 35.6% 38
3. Business Strategy
-- Operational efficiency 131 12.4% 35.6% 27.6% 63
-- Lack of focus, business restructuring and spinning off 96 9.1% 27.8% 38.9% 62
-- M&A: as target (against the deal/for better terms) 79 7.5% 36.7% 19.0% 42
-- M&A: as acquirer (against the deal/for better terms) 25 2.4% 20.0% 52.0% 22
-- Pursue growth strategies 12 1.1% 44.4% 0.0% 0
4. Sale of Target Company
-- Sell company or main assets to a third party 148 14.0% 37.0% 26.7% 93
-- Take control/Buyout company and/or take it private 44 4.2% 43.2% 25.0% 34
5. Governance
-- Rescind takeover defenses 60 5.7% 21.7% 43.3% 43
-- Oust CEO, chairman 59 5.6% 39.7% 29.3% 59
-- Board independence and fair representation 159 15.0% 34.4% 35.7% 114
-- More information disclosure/potential fraud 58 5.5% 42.1% 26.3% 42
-- Excess executive compensation/pay for performance 50 4.7% 20.4% 44.9% 38
Sum of categories (2) through (5): 548 51.7% 40.6% 25.8% 286 Notes: The sample includes 1,059 events, sorted by hedge funds’ stated objective. Columns (1) and (2) report the number of events, and the percentage among all events, in each category. Columns (3) and (4) list the rate of success (including partial success) and number of hostile events within each category. Column (5) reports the number of hostile events. Percentages sum up to more than 100% since one event can have multiple objectives (The first category and the other four categories are mutually exclusive).

22
Table 2. Characteristics of Target Companies
(1) (2) (3) (4) (5) (6) Summary Statistics Difference with matched firms
Firm Characteristic Mean Median Std Dev Avg. Diff. t-stat of Diff. Wilcoxon
Market Cap ($Mil) 726.56 160.07 1669.17 -63.54 -1.52 -2.05
Book-to-Market 0.773 0.615 0.914 0.081 4.28 3.93
Sales Growth 0.084 0.041 0.357 -0.057 -4.44 -7.72
ROA (Ebitda/Assets) 0.054 0.085 0.201 0.020 3.12 4.18
Stock Return 0.195 -0.010 1.200 -0.073 -3.11 -5.15
Debt-to-Capital 0.348 0.327 0.297 0.028 2.91 1.70
Dividend Yield 0.007 0.000 0.016 -0.001 -2.13 -5.48
R&D/Assets 0.079 0.029 0.114 -0.010 -2.21 -4.51
HHI(Business Segment) 0.800 1.000 0.251 -0.034 -3.64 -1.93
#Takeover Defense 9.005 9.000 2.702 0.353 2.27 2.33
#Analyst 4.387 2.000 5.959 0.547 3.01 0.99
%Institutional Ownership 0.447 0.447 0.274 0.083 9.57 8.82
Trading Illiquidity 0.466 0.193 0.699 -0.075 -3.99 -7.65
Notes: This table reports the characteristics of target companies and a comparison to a set of matched companies. The first three columns report the mean, median, and standard deviation of the characteristic for the target companies. Columns (4) through (6) report the average difference between the sample firms and the industry/size/book-to-market matched firms, the t-statistic for the average difference, and the Wilcoxon signed rank statistic, which is asymptotically normal, for the median difference. Size matching is dropped for Market Cap comparison, and book-to-market matching is dropped for Book-to-Market analysis. Most variables are self-explanatory. HHI is the Herfindahl-Hirschman index of sales in different business segments as reported by Compustat. Trading illiquidity is proxied by a measure developed in Amihud (2002), defined as the yearly average (using daily data) of 1000 |Return|/(Dollar Trading Volume) .

23
Table 3. Long-Term Returns of Target Company Portfolios Panel A: Equal-weight four-factor model
Window Alpha Beta(-1) Beta SMB HML MOM R2 (months) Estimate t-statistic Estimate t-statistic Estimate t-statistic Estimate t-statistic Estimate t-statistic Estimate t-statistic (-12,-10) -1.023 -1.82 0.123 1.04 0.976** 6.81 0.663** 4.40 0.421** 2.41 -0.278** -3.14 0.578
(-9,-7) 0.283 0.54 0.078 0.67 0.671** 4.94 0.913** 6.69 0.17 1.01 -0.493** -5.88 0.657 (-6,-4) -0.513 -1.02 0.252 2.27 0.805** 6.22 0.851** 6.15 0.322* 1.91 -0.243** -2.84 0.648 (-3,-1) -0.664 -1.30 -0.057 -0.50 0.57** 4.44 0.906** 5.20 0.333* 1.88 -0.164* -1.79 0.516 Event 5.095** 6.72 0.371** 2.00 0.401* 1.90 0.644** 2.45 0.205 0.72 -0.274* -1.77 0.302 (1,3) 1.093** 2.01 0.157 1.23 0.339** 2.26 0.611** 3.26 0.400* 1.74 -0.609** -4.85 0.540 (4,6) 0.237 0.52 0.195* 1.71 0.727** 5.24 0.989** 5.99 0.428** 2.34 -0.092 -0.84 0.651 (7,9) -0.093 -0.19 0.118 0.77 0.902** 5.45 0.655** 3.41 0.387 1.48 -0.163 -1.10 0.599
(10,12) 1.124 1.84 0.008 0.04 0.776** 3.65 0.602** 2.41 0.009 0.03 -0.019 -0.10 0.395
Panel B: Value-weight four-factor model Window Alpha Beta(-1) Beta SMB HML MOM R2 (months) Estimate t-statistic Estimate t-statistic Estimate t-statistic Estimate t-statistic Estimate t-statistic Estimate t-statistic (-12,-10) -2.377** -3.18 -0.06 -0.38 1.18** 6.17 0.413** 2.06 0.723** 3.10 -0.177 -1.50 0.383
(-9,-7) -0.261 -0.42 0.161 1.17 1.025** 6.46 0.482** 3.03 0.145 0.74 -0.193** -1.97 0.54 (-6,-4) -2.122** -3.34 0.054 0.39 1.032** 6.34 0.834** 4.79 1.054** 4.98 0.025 0.23 0.46 (-3,-1) -1.663** -2.33 0.159 0.99 0.731** 4.07 0.235 0.96 0.486* 1.96 -0.301** -2.35 0.323 Event 1.616 1.18 0.820** 2.44 0.663* 1.74 0.678 1.43 0.112 0.22 -0.021 -0.07 0.173 (1,3) 0.141 0.28 0.211* 1.78 0.522** 3.75 0.450** 2.60 0.604** 2.84 -0.419** -3.61 0.508 (4,6) -0.683 -1.24 0.033 0.24 1.005** 6.04 0.959** 4.84 0.99** 4.52 -0.268** -2.05 0.625 (7,9) -0.005 -0.01 0.089 0.60 0.742** 4.57 0.587** 3.12 1.03** 4.03 -0.692** -4.74 0.685
(10,12) -0.041 -0.08 -0.132 -0.82 0.985** 5.50 0.778** 3.69 0.666** 2.181 -0.165 -1.05 0.61 Notes: The table reports regression estimates and t-statistics from equal- and value-weighted calendar-time portfolio regressions. “Window” indicates the buying time relative to the event (hedge fund activism targeting) and the holding period in months. “Alpha” is the estimate of the regression intercept from the factor models. “Beta(-1)” and “Beta” are the factor loading on the lagged and concurrent market excess return (the Fama and French RMRF). “SMB,” “HML,” and “MOM” are the estimates of factor loading on the Fama-French size and book-to-market factors, and the Carhart momentum factor. “R2” is the R-squared from the regressions. * and ** indicate statistical significance at the 10% and 5% levels.
24
Table 4. Excess Returns to Activist Equity Hedge Funds, Equity Hedge Funds, and All Hedge Funds Panel A: All Activist Equity Hedge Funds
All sample 36-month rolling window Percentile One-Factor Alpha Four-Factor Alpha One-Factor Alpha Four-Factor Alpha
5% -0.05 -0.28 -0.57 -0.58 25% 0.38 0.33 0.38 0.26 50% 0.71 0.56 0.65 0.57 75% 1.19 0.94 0.99 0.96 95% 1.79 1.86 1.82 2.00
Average 0.82 0.70 0.67 0.63 Standard Dev. 0.62 0.70 0.66 0.75
Number of Funds 102 102
Panel B: All Hedge Funds
All sample 36-month rolling window Percentile One-Factor Alpha Four-Factor Alpha One-Factor Alpha Four-Factor Alpha
5% -0.54 -0.69 -0.94 -1.04 25% 0.09 0.01 0.02 -0.02 50% 0.37 0.28 0.32 0.29 75% 0.74 0.65 0.69 0.67 95% 1.98 1.84 1.88 2.10
Average 0.49 0.39 0.38 0.39 Standard Dev. 0.95 1.00 1.36 1.63
Number of Funds 10,530 10,384

25
Panel C: All Equity Hedge Funds
All sample 36-month rolling window Percentile One-Factor Alpha Four-Factor Alpha One-Factor Alpha Four-Factor Alpha
5% -0.77 -0.97 -1.28 -1.24 25% 0.09 -0.01 -0.03 -0.07 50% 0.46 0.38 0.40 0.38 75% 0.92 0.82 0.84 0.87 95% 2.34 2.16 2.25 2.65
Average 0.58 0.47 0.42 0.48 Standard Dev. 1.17 1.36 1.71 2.07
Number of Funds 3,986 3,563
Notes: The table reports the summary statistics of alpha estimates from the CAPM and the four-factor (defined in Table 3) models for the sample of self-reported activist hedge funds, all hedge funds, and equity-oriented hedge funds. In the “All-sample” column, alpha and beta loadings on the factors are estimated using the full sample. In the “36-month rolling window” column, the same beta loadings are estimated using the 36 months prior to the current month. Monthly alphas are calculated using the time-varying beta loadings, and then averaged at the fund level.
26
Table 5. Returns Based on 13F-Filed Holdings
Most recently filed holdings Holdings filed at least 2 months ago Percentile Excess of Market One-Factor Alpha Four-Factor Alpha Excess of Market One-Factor Alpha Four-Factor Alpha
5% -0.53 -0.41 -0.59 -0.54 -1.12 -1.56 25% 0.55 0.49 0.27 0.24 0.13 -0.01 50% 0.99 0.88 0.66 0.65 0.54 0.26 75% 1.49 1.35 1.23 0.96 0.88 0.71 95% 2.82 2.98 2.22 2.13 2.13 1.58
Average 0.96 0.90 0.62 0.65 0.58 0.36 Standard Dev. 2.06 1.85 2.67 1.07 0.93 1.02 Num. of Funds 147 147
Notes: This table reports the summary statistics of abnormal returns (in terms of excess return over the market, one-factor alpha, and four-factor alpha) of the long-equity positions of sample hedge funds that report quarterly holdings to the Thomson Financial Spectrum database. In the first column, we construct the returns from the equity long-only position by assuming that the hedge funds hold their most recently disclosed positions. In the second column, the returns are imputed on the filings that are at least two months old.

27
Table 6. Cross-Sections of Activist Hedge Fund Returns
Four-Factor Alpha One-Factor Alpha Avg. Announcement Ex. Return COEF t-stat COEF t-stat COEF t-stat
Log(#Targets) 0.049 0.93 0.021 0.37 2.496** 2.50 Hostile Tactics 0.060 0.41 0.087 0.5 -0.348 -0.10 Objective: Sale 0.089 0.46 0.063 0.28 9.085** 2.83 Fund Age 0.002 -1.45 0.002 -1.41 -0.005** -1.99 Log(AUM) 0.05 0.95 0.076 1.33 1.002 1.02 Management Fee (%) 0.179* 1.78 0.034 0.28 -5.444 -1.62 Incentive Fee (%) 0.052** 3.90 0.062** 3.98 0.364 0.91 Log(Min Invest) -0.11 -1.21 -0.208* -1.73 -1.293 -0.31 Watermark 0.042 0.15 -0.012 -0.04 4.687 1.07 Constant -0.33 -1.09 -0.056 -0.16 0.993 0.11
R-sqr and # of Obs 0.20 103 0.19 103 0.17 103
Notes: The dependent variables are four- and one-factor alphas, as well as the average announcement window excess returns (the average of which across all funds is plotted in Figure 1). All variables are constructed at the fund level. * and ** indicate statistical significance at the 10% and 5% levels.

28
Figure 1. Buy-and-Hold Abnormal Return Around The Filing of Schedule 13Ds
-1%
0%
1%
2%
3%
4%
5%
6%
7%
8%
9%
t-20
t-18
t-16
t-14
t-12
t-10 t-8 t-6 t-4 t-2
13D Filin
gt+2 t+4 t+6 t+8t+10 t+12 t+14 t+16 t+18 t+20
Abn
orm
al B
uy-a
nd-H
old
Ret
urn
0%
20%
40%
60%
80%
100%
120%
140%
160%
180%
200%
Abn
orm
al S
hare
Tur
nove
r Rel
ativ
e to
(t-1
00,t-
40)
Abnormal Share Turnover (Right) Abnormal Buy&Hold Return (Left)
Note: The solid line (left axis) plots the average buy-and-hold return around the Schedule 13D filing, in excess of the buy-and-hold return of the value-weight market, from 20 days prior the 13D file date to 20 days afterwards. The bars (right axis) plot the increase (in percentage points) in the share trading turnover during the same time window compared to the average turnover rate during the preceding (-100, -40) event window.

29
Figure 2. Returns to Activism Indices, January 1995- June 2007 (Beginning from 100% in January 1995)
0%
100%
200%
300%
400%
500%
600%
700%
800%
900%
1000%
1995
0119
9509
1996
0519
9701
1997
0919
9805
1999
0119
9909
2000
0520
0101
2001
0920
0205
2003
0120
0309
2004
0520
0501
2005
0920
0605
2007
01
Cum
ulat
ive
retu
rns
Activist Funds (EW) Equity Hedge Funds (EW) S&P 500
Notes: This figure plots the Activist Fund Index by aggregating the returns of all activist funds on an equal-weight basis. As a comparison, also plotted are the HedgeFund.Net all hedge fund equal-weight index and the S&P 500 index.

about ECGI
The European Corporate Governance Institute has been established to improve corpo-
rate governance through fostering independent scientific research and related activities.
The ECGI will produce and disseminate high quality research while remaining close to
the concerns and interests of corporate, financial and public policy makers. It will draw on
the expertise of scholars from numerous countries and bring together a critical mass of
expertise and interest to bear on this important subject.
The views expressed in this working paper are those of the authors, not those of the ECGI
or its members.
www.ecgi.org

www.ecgi.org\wp
ECGI Working Paper Series in Law
Editorial Board
Editor Guido Ferrarini, Professor of Law, University of Genova & ECGI
Consulting Editors Theodor Baums, Director of the Institute for Banking Law,
Johann Wolfgang Goethe University, Frankfurt & ECGI
Paul Davies, Cassel Professor of Commercial Law,
London School of Economics and Political Science & ECGI
Henry B Hansmann, Augustus E. Lines Professor of Law, Yale
Law School & ECGI
Klaus J. Hopt, Director, Max Planck Institute for Foreign Private
and Private International Law & ECGI
Roberta Romano, Allen Duffy/Class of 1960 Professor of Law,
Yale Law School & ECGI
Eddy Wymeersch, Professor of Commercial Law, University
of Ghent & ECGI
Editorial Assistant : Paolo Casini, “G.d’Annunzio” University, Chieti & ECARES,
Lidia Tsyganok, ECARES, Université Libre De Bruxelles

Electronic Access to the Working Paper Series
The full set of ECGI working papers can be accessed through the Institute’s Web-site
(www.ecgi.org/wp) or SSRN:
Finance Paper Series http://www.ssrn.com/link/ECGI-Fin.html
Law Paper Series http://www.ssrn.com/link/ECGI-Law.html
www.ecgi.org\wp


![THE TENSION BETWEEN HEDGE FUND ACTIVISM AND CORPORATE … · 2018. 4. 12. · 2016] HEDGE FUND ACTIVISM AND CORPORATE LAW developing their own statutory and case law.6 Therefore,](https://static.fdocuments.net/doc/165x107/6047ae787673463ca9070291/the-tension-between-hedge-fund-activism-and-corporate-2018-4-12-2016-hedge.jpg)