The response of China, India and Brazil to climate change - a perspective for South Africa
88
Written by Smith School of Enterprise and the Environment University of Oxford November 2012 THE RESPONSE OF CHINA, INDIA AND BRAZIL TO CLIMATE CHANGE: A perspective for South Africa One of a series of three expert papers on aspects of climate change and economic development commissioned by the Centre for Development and Enterprise
-
Upload
centre-for-development-and-enterprise -
Category
Documents
-
view
217 -
download
3
description
http://www.cde.org.za/climate-change-mitigation-an-emerging-market-perspective/ South Africa’s commitments to mitigate climate change, though qualified and conditional, may affect the pursuit of its other developmental goals. In a series of papers commissioned by CDE, experts present evidence and analysis looking at the interaction between socio-economic development and climate change policies in South Africa. The papers look at (i) what the transition to a green economy would look like, (ii) how global climate change negotiations might proceed over the next two decades and how this will affect South Africa, and (iii) what Brazil, China and India are saying and doing about climate change. A fourth paper will look at South Africa’s energy needs and policies in light of our climate change policies.
Transcript of The response of China, India and Brazil to climate change - a perspective for South Africa

Written by Smith School of Enterprise and the Environment University of Oxford
November 2012
THE RESPONSE OF CHINA, INDIA AND BRAZIL TO CLIMATE CHANGE: A perspective for South Africa
One of a series of three expert papers on aspects of climate change and economic development commissioned by the
Centre for Development and Enterprise

Report commissioned by the Centre for Development and Enterprise
Authors: Sir David King, Megan Cole, Sally Tyldesley, Ryan Hogarth With thanks to: Lavanya Rajamani, Juan Anel, Peter Collecott, Tim Gore, Ranjit Barthakur, José Goldemberg and Martin Lees. This report was produced for the Centre for Development and Enterprise (CDE) by the Smith School of Enterprise and Environment, University of Oxford.
About the Smith School The Smith School is an interactive research hub within Oxford University that engages with, educates and equips public and private enterprise with the solutions, knowledge and networks needed to address the major environmental challenges facing our planet. The School strongly believes that the only way to address the environmental challenges we face is by convening and partnering with both public and private enterprise. The Smith School helps public enterprise with policies that create opportunities for private enterprise to develop solutions to address the major environmental challenges. It does this by playing three roles: a translator and integrator, an intelligent user of research and an interdisciplinary hub. This project has been funded by Friedrich Naumann Foundation for Freedom. The funder does not necessarily agree with the views expressed in this report.
ISBN: 978-1-920653-01-9 Cover image: by Gallo Images

CDE Series Introduction
Report commissioned by the Centre for Development and Enterprise
Climate Change Mitigation: An emerging market perspective Series Introduction The South African government has voiced a clear commitment to mitigating the impact of climate change by reducing green house gas emissions and facilitating the development of low-carbon growth. In 2009, President Zuma outlined an ambitious trajectory for emissions reductions, subject to international financial assistance. Ahead of last year’s COP17 in Durban, cabinet approved the National Climate Change Response White Paper, which includes a proposal for a carbon tax that could come into effect as early as the next financial year. Government has already begun to invest heavily in renewable energy, and the recently-released National Development Plan envisions the ‘transition to an environmentally sustainable, climate-change resilient, low-carbon economy’ to be well underway by 2030.
By international standards, these are relatively ambitious commitments to fighting climate change. But, as a developing country with high levels of poverty and perhaps the world's most serious crisis of unemployment, South Africa needs its economy to grow as rapidly as possible. In light of this, it is necessary to consider whether our economic development goals are compatible with our climate change commitments. Is it possible for South Africa to meet the potentially contradictory goals of promoting industrial development and employing millions of people while at the same time committing to the reduction of carbon emissions? Do we have the necessary policies in place to facilitate this and are they aligned with each other? What other countries can we look to as models for aligning these two agendas? What potential is there for low-carbon growth in South Africa?
With support from the Friedrich Naumann Foundation, CDE has commissioned four papers from international and local experts to address some of these questions. These papers are intended to promote a more informed debate regarding the interaction of our climate change mitigation strategies and our developmental challenges. The views presented in these papers are those of the authors and do not necessarily agree with those of CDE or the Friedrich Naumann Foundation.
• Paper one: Future Trajectories of Climate Change Negotiations by Oxford University’s Smith School of Enterprise and the Environment.
This paper describes United Nations Convention on Climate Change (UNFCCC) negotiations to date and presents possible scenarios for future global or bilateral agreements. Although South Africa’s emissions are high relative to our GDP, we contribute less than 2 per cent of global emissions. It is necessary, therefore, to consider our position within global negotiations and how decisions taken by other countries and in global forums might impact our development goals. This paper situates South Africa within the complex terrain of global mitigation agreements and considers which possible scenarios would be in our best interest.
• Paper two: The Response of China, India and Brazil to Climate Change, also written by the Smith School.
This paper addresses the approaches of other emerging economies toward climate change mitigation and adaptation. With South Africa, these countries make up the BASIC negotiating group in the UNFCCC and share similar concerns regarding poverty alleviation and economic growth. The authors describe actions being taken in each of these countries, analyse the strengths and weaknesses of each approach, and suggest lessons South Africa can learn from their experiences.

CDE Series Introduction
Report commissioned by the Centre for Development and Enterprise
• Paper three: Growing a Green Economy authors Dr Nick Segal and Brent Cloete
This paper examines the rationale and potential consequences of ‘greening’ the South African economy in line with the government’s climate change mitigation goals. This think piece reviews the alignment of the country’s economic development and climate change objectives, and consider to what extent green growth is feasible in South Africa. The authors assess the trade-offs and economic costs of mitigation, as well as the coherence of policies governing the transition to a green economy.
• Paper four: provisionally titled South Africa's Energy Needs by Dr Emily Tyler.
This paper assesses policies that impact on energy planning and carbon emissions in South Africa. Dr Tyler highlights the convergences and inconsistencies in these policies, as well as their costs and consequences. The paper profiles the country’s energy supply and consider the feasibility of lowering its carbon intensity. It examines how the government’s energy plans might affect energy-intensive sectors of the economy, such as mining and minerals, and, in turn, economic growth.

Contents
Report commissioned by the Centre for Development and Enterprise
Contents
Executive Summary .................................................................................................................................. i
Acronyms and Abbreviations ................................................................................................................. iv
1. Introduction ........................................................................................................................................ 1
2. Climate Change Agendas .................................................................................................................... 3
3. Drivers for Action .............................................................................................................................. 8
4. India’s Response to Climate Change ................................................................................................ 12
4.1 Drivers for Action ...................................................................................................................... 13
4.2 Action Taken ............................................................................................................................... 17
4.3 International Negotiations .......................................................................................................... 29
4.4 Conclusion .................................................................................................................................. 30
5. China’s Response to Climate Change ............................................................................................... 31
5.1 Drivers for Action ...................................................................................................................... 32
5.2 Action .......................................................................................................................................... 36
5.3 UNFCCC Negotiations .............................................................................................................. 45
5.4 Conclusion .................................................................................................................................. 46
6. Brazil’s Response to Climate Change ............................................................................................... 48
6.1 Drivers for Action ...................................................................................................................... 49
6.2 Action Taken ............................................................................................................................... 54
6.3 UNFCCC Negotiations .............................................................................................................. 65
6.4 Conclusion .................................................................................................................................. 66
7. Potential Developed Country Responses ......................................................................................... 68
7.1 European Union .......................................................................................................................... 68
7.2 United States ............................................................................................................................... 69
8. Lessons for South Africa ................................................................................................................... 70
9. Conclusions ....................................................................................................................................... 72
References............................................................................................................................................. 73

Executive Summary
Report commissioned by the Centre for Development and Enterprise i
Executive Summary This paper addresses the approach that India, China and Brazil are taking in tackling the demands of mitigation and adaptation to climate change. The actions and attitudes of these countries towards climate change is important due to their increasing political power globally, their quickly growing economies and to their rapidly rising greenhouse gas emissions.
Together with South Africa, these three countries make up the BASIC group – a negotiating group in the United Nations Convention on Climate Change (UNFCCC). Their actions therefore will have large implications for South Africa. In the UNFCCC, the BASIC group’s primary aim is to ensure that they have ‘equitable access to sustainable development’. Their primary concern is poverty-alleviation over emissions reductions. They require that developed countries – with greater historical responsibility for climate change and a greater capacity to act – should take the lead in dealing with climate change. They argue for the principles of equity and common but differentiated responsibilities and respective capabilities to be upheld. In the UNFCCC, the BASIC group often pushes for support for developing countries from developed in the form of climate finance, technology transfer, and capacity building along with more stringent mitigation targets for developed countries.
In recent years, largely due to the rapid growth of both their economies and emission levels, the BASIC group have come under increasing international pressure to mitigate their greenhouse gas (GHG) emissions. It is argues that attempts to mitigate climate change will be futile unless the major developing countries are involved. This argument is not without substance; in 2007 China overtook the US to become the world’s largest emitter. It is likely that India will become the second biggest emitter in a few years time.
In 2009, India, China and Brazil, along with a number of other developing countries, put forward mitigation pledges for the first time. India and China pledged to reduce the emissions intensity of their economies (the amount emitted per unit of GDP) by 20-25% and 40 – 45% by 2020 relative to 2005 levels, respectively. Brazil pledged to reduce its GHG emissions 36.1 – 38.9% below projected emissions by 2020. These were voluntary pledges that have been taken note of under the UNFCCC process. It is therefore useful to assess whether each country intends to meet its pledge by looking at policies put in place at domestic level – is the institutional, technical and policy capacity being put in place.
At a national level India, China and Brazil are all taking action to both mitigate and adapt to climate change. We identify a number of drivers for action, both domestic and international, to better understand the motivation of the three countries: climate change impacts, global pressure to mitigate, energy security, economic opportunities, natural resource management and political will. These drivers vary across the three countries. However, it seems that they are causing Brazil, India and China to take significant action on climate change. This action is reflected in both the climate specific national plans and their economic and development plans.
India is taking action on many fronts to address poverty, natural resource management and climate change mitigation. Progress has been made in the energy sector and the country is now a global leader in renewable energy. The government has been successful in encouraging the operation of the Clean Development Mechanism (CDM) in the country and is one of the main destinations for CDM projects globally. A carbon tax on coal has also been implemented, the revenues from which

Executive Summary
Report commissioned by the Centre for Development and Enterprise ii
go towards funding renewable energy projects. However, there are no plans to phase out fossil fuels in the next 20 years. Greater ambition from India on mitigation is unlikely before 2020. The Government of India has recently begun to focus more heavily upon adaptation. Detailed climate change assessments are being undertaken, the results of which show that there are significant risks to food security, water security and livelihoods. There is clearly a need for India to do much more towards becoming climate resilient.
China is also taking significant action to address climate change at a national level and appears to be serious in meeting its international mitigation pledge. Action on climate change has been embedded in China’s national strategic development policy, the Five-Year Plan (FYP). The most recent FYP, covering the period from 2011 to 2015, includes a number of environmental targets including carbon intensity goals that will put it on the path to meet the UNFCCC pledge. The FYP also addresses a number of other sustainability issues such as pollution, energy efficiency and the percentage of non-fossil fuel sourced energy in the energy mix. China is one of the leaders in the global renewable energy sector; for a number of years China has led world new investment in renewable energy. Despite progress in sustainability over the last few years, the benefits have been marginalised by the negative environmental impacts of rapid economic growth. This is something that China appears to have recognised and there are signs that there may be a move towards ‘higher quality growth’ rather than fast growth. In regards to adaptation, China’s National Climate Change Policy Programme identifies a number of areas in which the country is vulnerable; climate change will present severe difficulties in terms of food and water security. A wide range of policies and practices to address these areas are being put in place.
For Brazil, the ability to combat deforestation will be the main factor determining whether or not it is able to achieve its relatively ambitious mitigation target. The country controls over 70% of the Amazon Rainforest. While Brazil has made admirable progress in reducing deforestation rates over the previous decade, a controversial bill that would relax Brazil’s Forest Code is expected to be signed into law this year. The most controversial clauses of the bill were vetoed by President Dilma Rousseff. However, environmentalists remain concerned that the gains that Brazil has made in reducing deforestation rates will be reversed. In other sectors, Brazil has been a world leader, particularly in low carbon agriculture and biofuels. However, with the boom of Brazil’s oil and gas industry, its GHG emissions from fossil fuels are projected to increase rapidly. The fact that the Government of Brazil’s own mitigation scenario foresees an increase in emissions from the oil and gas sector of 75% between 2005 and 2020 suggests that this is an area in which the country will not compromise. As a result, after 2020 it is likely that Brazil’s downward trending GHG emission levels will begin to rise.
There are a number of lessons that can be learnt from India, China and Brazil’s experiences in dealing with the demands of climate change. From a governance perspective, it is clear that buy-in at all levels is required, particularly at the top. To prevent action on climate change from being relegated to the side-lines it must be integrated with a countries central development strategy. All three countries addressed here have implemented, or are in the process of implementing, some form of carbon pricing. As increasingly important players in the global economy, this could have implications for trade in high carbon commodities in the future. Both India and Brazil have national funds to finance climate change activities and policies or mechanisms to encourage renewable energy. All three countries have clearly identified renewable energy as an economic opportunity, and there is likely to be further growth in this sector in each country. All three countries’ voluntary pledges under the UNFCCC are in the realms of what is required by science by 2020. However, differences in what is included in each target make direct comparisons difficult. With these three

Executive Summary
Report commissioned by the Centre for Development and Enterprise iii
developing countries moving to reduce their emissions, other high emitting developing countries are also likely to be under increased pressure to reduce their impact on the climate. However, the most pressure should be placed back on developed countries to increase the stringency of their pledge

Acronyms and Abbreviations
Report commissioned by the Centre for Development and Enterprise iv
Acronyms and Abbreviations
ALGAS Asian Least-Cost Greenhouse Gas Abatement Strategy AOSIS Alliance of Small Island States AWG-DPEA Ad Hoc Working Group on Durban Platform for Enhanced Action BASIC Brazil, South Africa, India, China BAT Best Available Technology BAU Business as Usual BCRI-NCAP Black Carbon Research Initiative National Carbonaceous Aerosols Programme BEE Bureau of Energy Efficiency (India) BNDES National Economic and Social Development Bank (Brazil) BRICS Brazil, Russia, India, China, South Africa CBDRRC Common But Differentiated Responsibilities and Respective Capabilities CCAS Climate Change Assessment Studies CCICED China Council for International Cooperation on the Environment and Development CCS Carbon Capture and Storage CDM Clean Development Mechanism CEBDS Brazilian Business Council for Sustainable Development CER Certified Emissions Reduction CERC Central Energy Regulatory Commission (India) CFU Climate Funds Update CII Confederation of Indian Industry CIMGC Interministerial Commission on Climate Change (Brazil) CMN National Monetary Council (Brazil) CNI National Confederation of Industry (Brazil) CONPET National Labelling Programme for Stoves and Heaters (Brazil) COP Conference of the Parties CS-NECC Coordinated Studies in North Eastern Region on Climate Change DC Designated Consumers DNA Designated National Authority E&P Exploration and Production EE Energy Efficiency EIB European Investment Bank ERI Energy Research Institute ETS Emissions Trading Scheme FBMC Brazilian Climate Change Forum FBMSONG Brazilian Forum of Social Movements and NGOs FICCI Federation of Indian Chambers of Commerce and Industry FIESP Federation of Industries of Sao Paulo State FIT Feed-in Tariff FNMC National Climate Change Fund (Brazil) FYP Five year plan GCF Green Climate Fund GDP Gross Domestic Product GEFS GE Financial Services GHG Greenhouse Gas GoB Government of Brazil GoI Government of India

Acronyms and Abbreviations
Report commissioned by the Centre for Development and Enterprise v
GVFL Gujurat Venture Finance Ltd GW Gigawatt HDI Human Development Index ICAR Indian Centre for Agricultural Research ICMR Indian Council of Medical Research ICZM Integrated Coastal Zone Management IEA International Energy Agency IEPP Integrated Pricing Policy (India) IIOE International Indian Ocean Experiment IIT Indian Institutes of Technology IMD Indian Meteorological Department INCCA Indian Network for Climate Change Assessment INDOEX Indian Ocean Experiment INPE Brazilian National Institute for Space Research INR Indian Rupees IPCC Intergovernmental Panel on Climate Change IPRs Intellectual Property Rights IREDA Indian Renewable Energy Development Agency kWh Kilowatt-hour LDC Least Developed Country LPG Liquefied petroleum gas LTERO Long-Term Ecological Research Observatory LTES Long-Term Ecological Sites LULUCF Land Use, Land Use Change and Forestry MCT Ministry of Science and technology (Brazil) MFI Microfinance Institute MMA Ministry of Environment (Brazil) MME Ministry of Mines and Energy (Brazil) MNES Ministry of New Energy Sources /Ministry of Non-Conventional Energy Sources
(India) MNRE Ministry of New and Renewable Energy (India) MoEF Ministry of Environment and Forestry (India) MONEX Monsoon Experiment MoP Ministry of Power (India) MoWR Ministry of Water Resources (India) MRE Ministry of Foreign Affairs (Brazil) Mt Million tonnes MW Megawatt MWh Megawatt-hour NAMA Nationally Appropriate Mitigation Actions NATCOM NAPA National Adaptation Programme of Action NAPCC National Action Plan on Climate Change (India) NATCOM Initial Nation Communication (India) NCCCC National Coordination Committee on Climate Change (China) NDMA National Disaster Management Authority (India) NDRC National development and Reform Commission (China) NFAP National Forest Action Programme (India) NGIMA National Greenhouse Gas Inventory Management Authority (India) NGIMS National Greenhouse Gas Inventory Management System (India) NGO Non-governmental organisation NICRA National Initiative on Climate Resilient Agriculture (India) NIDM National Institute of Disaster Management (India) NPDRR National Platform on Disaster Risk Reduction (India) NPP Net Primary Productivity

Acronyms and Abbreviations
Report commissioned by the Centre for Development and Enterprise vi
ODA Official Development Assistance PAC 2 Growth Acceleration Program (Brazil) PAT Perform Achieve Trade (India) PBMC Brazilian Panel on Climate Change PCG Partial Credit Guarantee PNMC National Plan on Climate Change (Brazil) PPCDAM Action Plan for the Prevention and Control of deforestation in the Legal Amazon
Region PRODEEM Programme for Energy Development of States and Municipalities (Brazil) PROINFA Incentive Programme for Alternative Electric Energy Sources (Brazil) PV Photovoltaic R&D Research and Development RE Renewable energy REC Renewable Energy Certificate (India) REC Renewable Energy Credits (India) REDD+ Reducing Emissions from Deforestation and Forest Degradation REEEP Renewable Energy and Energy Efficiency Partnership (Brazil) RGGI Regional Greenhouse Gas Initiative (US) RPO Renewable Purchase Obligation SAPCC State Action Plan on Climate Change (India) SDGs Sustainable Development Goals SECI Solar Energy Corporation of India SERC State Energy Regulatory Commission (India) SIDS Small Island Developing States SMEs Small and Medium Enterprises SoE State of Environment (India) tCO2e Tonne of carbon dioxide equivalent UNEP United Nations Environment Programme UNFCCC United Nations Framework Convention on Climate Change UNU-IHDP United Nations University’s International Human Dimensions Programme on Global
Environmental Change USEID United States Energy Information Administration WCI Western Climate Initiative (US) WEO World Energy Outlook

Chapter 1: Introduction
Report commissioned by the Centre for Development and Enterprise 1
1. Introduction
Large developing countries, or ‘emerging economies’, have an increasingly influential role in the global economy, geopolitics and trade. China, the second largest economy in the world after the US, leads the group of emerging economies, followed by India and Brazil. Together with Russia they form the influential BRIC group, which cover more than a quarter of global land mass, more than 40% of the world’s population and hold over 40% of foreign reserves. South Africa joined this group in December 2010, at the invitation of China, to create the BRICS. While this group has allowed India and Brazil to emerge independently of their region and to engage globally without the burdens of regional commitments, South Africa’s role as an emerging economy is tied to Africa and its role in the continent (IGD, 2011).
A number of other large developing countries (such as the ‘Next 11’ - Bangladesh, Egypt, Indonesia, Iran, Mexico, Nigeria, Pakistan, Philippines, Turkey, South Korea and Vietnam) have the potential to become, along with the BRICS, the world's largest economies in the 21st century. Key characteristics of the BRICS, Indonesia and Mexico are shown in Table 1.1. This table highlights that South Africa is a junior player in terms of GDP, which is partly due to its relatively small land area and natural resources.
Table 1.1 Population, Land and GDP of selected countries in 2010 9 (Source data: World Bank, 2012)
Country
GDP GDP growth Land area Population
billion USD
Global Rank
GDP per capita in
USD
Annual %
Global Rank
million km2
Global Rank millions Global
Rank Growth
rate
Brazil 2,518.0 7 10,710 7.4 38 8.5 5 203.4 5 0.9
China 5,926.6 2 4,428 10.4 5 9.3 3 1,338.3 1 0.5
India 1,727.0 9 1,475 8.8 14 3.0 7 1,170.0 2 1.3
Indonesia 706.6 18 2,946 6.1 61 1.8 15 239.9 4 1.0
Mexico 1,034.8 13 9,123 5.5 73 1.9 14 113.4 11 1.2
South Africa 363.7 28 7,275 2.9 143 1.2 25 49.9 24 1.4
Russia 1,479.8 11 10,440 4.0 105 16.3 1 141.8 8 -0.1
Emerging economies also have an increasing role in contributing to climate change as well as international climate negotiations and global mitigation. Their absolute annual greenhouse gas (GHG) emissions are now at similar levels to developed countries although their cumulative GHG emissions (and therefore historical responsibility) are still below developed countries. Their large populations with lower levels of development equate to much lower per capita emissions, as shown in Table 1.2.
The data shown in Table 1.2 is from 2005, the most recently available, and includes all GHG emissions, including those from land use, land use change and forestry (LULUCF).1
1 GHG emissions are often quoted excluding LULUCF as not all countries have the data available. LULUCF usually increases GHG emissions and therefore its inclusion affects the global rankings.

Chapter 1: Introduction
Report commissioned by the Centre for Development and Enterprise 2
Table 1.2 GHG Emissions and Development indices (Data sources: (WRI, 2011, UNDP, 2011)
Country
Annual GHG Emissions in 2005 including LULUCF Development Indices in 2011
MtCO2e2 global ranking
% of global total
per capita
per capita
ranking
Human Development Index (HDI)
Poverty (% population
below poverty line)
Brazil 2,840.5 4 6.6% 15.3 19 0.718 21.4
China 7,194.8 1 16.7% 5.5 94 0.687 2.8
India 1,865.0 7 4.3% 1.7 152 0.547 27.5
Indonesia 2,035.5 5 4.7% 9 58 0.617 13.3
Mexico 671.0 11 1.6% 6.3 82 0.717 47.4
South Africa* 422.6 23 0.98% 9 59 0.619 23
Russia 1,997.6 6 4.6% 14 23 0.755 11.1
*data for LULUCF not available
The emerging economies have come under increasing pressure from other countries to reduce their GHG emissions. In the lead up to the fifteenth Conference of the Parties (COP15) in Copenhagen in December 2009 the BASIC group – Brazil, South Africa, India and China - was created. It was aimed at developing common negotiation positions in the United Nations Framework Convention on Climate Change (UNFCCC) to counter the pressure from other countries. The emerging economies also pledged voluntary mitigation targets for the first time. COP15 was a significant milestone in climate negotiations and saw a fundamental shift in power. President Obama struck a deal not with the EU but with the heads of government of China, Brazil, South Africa and India. This was unexpected in two ways – firstly, the Americans thought they would be meeting with China alone but instead had to negotiate with an emerging economy block. Secondly, the EU was sidelined for the first time in the negotiations. Since then, the EU reclaimed its influence at COP17 and is exerting international pressure through recent new emissions requirements for global aviation. The BASIC countries have continued to play a large role and are crucial to understanding the future global response to climate change.
In this paper, Chapter 2 will provide further understanding of the climate negotiations and will explore the tension between development and climate change while Chapter 3 will give an overview of what is driving countries to hinder progress or take action. Chapters 4, 5 and 6 will review the responses of India, China and Brazil to the challenge of climate change while Chapter 7 will look at the potential response of developed countries to the BASIC countries actions. Chapter 8 will draw key lessons for South Africa and Chapter 9 will conclude.
2 Million tonnes carbon dioxide equivalent – i.e. all GHG gases are included

Chapter 2: Climate Change Agendas
Report commissioned by the Centre for Development and Enterprise 3
2. Climate Change Agendas
Since the start of the industrial revolution, the large-scale combustion of fossil fuels and changes in land use (including deforestation) enabled many countries to develop rapidly and drastically reduce poverty. The negative consequence however was accelerated GHG emissions, causing a rise in global average temperature of almost 1 ºC above pre-industrial levels. The recognition of the risk posed by the resultant climate change has led to international climate change negotiations through the UNFCCC. There is consensus among the parties that the atmospheric concentration of GHG must not exceed 450 ppmv CO2e3 to limit global warming to 2 ºC, the level necessary to avert catastrophic climate change (IPCC, 2007). The Alliance of Small Island States (AOSIS), along with a number of Non-Governmental Organisations (NGOs) and scientists (Rockstrom et al., 2009) have called for an even more ambitious target of 350 ppmv CO2e, which equates to 1.5 ºC, to stay within safe planetary boundaries and protect those most vulnerable.
In the first two decades of the UNFCCC, the focus was on mitigation action by so-called Annex I (developed) nations who are responsible for 73% of the CO2 emitted to date (WRI, 2011). Figure 2.1 shows the top 20 CO2 emitters, measured from 1850 to 20084, dominated by the US (28.5%) and the EU (26%). Recent economic growth in China has increased its historical responsibility to 9.4%.
Figure 2.1 Cumulative emissions of top 20 countries 1850-2008 Source: (WRI, 2011)
3 Parts per million by volume of carbon dioxide equivalent 4 Historical emissions are only estimated for CO2 not GHG emissions due to the complexity of GHG emissions

Chapter 2: Climate Change Agendas
Report commissioned by the Centre for Development and Enterprise 4
The 450 ppmv target cannot be achieved however without large emission reductions by developing countries (Stewart et al., 2009) who have become responsible for some of the biggest annual GHG emissions. Figure 2.2 shows the top 20 GHG emitters (including LULUCF) in the year 2005, with China leading with 7,194.8 MtCO2e or 16.7% followed by the US and EU. Brazil and Indonesia rank in the top five in Figure 2.2 because of their high rates of deforestation.
Not only are developing countries now big emitters but many of the most economically efficient measures to abate emissions are in developing countries. Emerging economic powers are currently investing in new large-scale infrastructure, which presents low-cost mitigation opportunities, because installing efficient technologies at the outset is cheaper than retrofitting existing infrastructure (McKinsey, 2009a). Moreover, emissions from agriculture, forestry and land-use – 90% of which occur in the developing world – represent 46% of global potential GHG emission reductions (Bettelheim, 2009). This has led to increased focus and pressure on large developing countries, particularly the BASIC group.
Figure 2.2 The world’s biggest annual GHG emitters in 2005 including LULUCF Source: CAIT 9.0 (WRI, 2011) *LULUCF data not available
The BASIC countries support the objective of keeping global temperature increase well below 2 ºC but maintain that ‘social and economic development and poverty eradication are the first and overriding priorities of developing countries’ (Winkler et al., 2011). As Figure 2.3 shows, apart from South Africa, per capita GHG emissions of the BASIC group are much lower than that of developed nations. Mitigation targets are perceived to threaten development and BASIC countries maintain that ‘equitable access to sustainable development will be the core of and foundation for any climate change agreement and that this will be the prerequisite for setting up any global emission reduction target’. This is supported by Costa, Rybski and Kropp (2011) who found that a country’s per capita CO2 emissions from fossil fuels are exponentially correlated with its human development index (HDI) (Figure 2.4). However, others argue that through innovation, technology transfer, and

Chapter 2: Climate Change Agendas
Report commissioned by the Centre for Development and Enterprise 5
financial support from developed countries, developing countries will be able to decouple development and emissions, and pursue a ‘low carbon development path’.
Figure 2.3 Per capita CO2 emissions in 2009. Source: (EIA, 2010)
Figure 2.4 Correlation between countries’ CO2 emissions per capita and Human Development Index in the year 2000. “The dashed line represents a least squares fit through all values. Vertical lines represent the HDI values of 0.8 and 0.9, representative of high and very high development standards respectively, as expressed in the United Nations Development Report 2009. The horizontal line shows the 2 tonnes per capita CO2 emission target to limit global warming at 2 °C by 2050.” Source: (Costa et al., 2011)
At COP17 there were fierce arguments about the inclusion of the UNFCCC principle of common but differentiated responsibilities and respective capabilities (CBDRRC). Developed countries unanimously insisted that any reference to CBDRRC must be qualified with a statement that this principle must be interpreted in the light of ‘contemporary economic realities’ and that the future regime must be ‘applicable to all’ (Rajamani, 2011b). Developing countries, particularly the BASIC countries, argued that this would be a significant amendment to the convention which was not negotiable. Developing countries argue that because industrialised countries historically bear the primary responsibility for creating climate change, and because countries’ capabilities to respond vary due to different levels of economic development, industrialised countries must take a leadership role within the climate regime by being the first to take on emission reduction targets.
Despite their low per capita emissions, large developing countries have made voluntary mitigation commitments, as shown in Box 1. There is significant variation in the nature of the pledges, making it difficult to determine how ambitious they really are. China and India, the biggest emitters, commit only to emissions intensity of GDP, rather than absolute emissions reductions. The others refer to reductions from business as usual (BAU) which assumes continued economic growth. All the targets therefore will result in increasing GHG emissions. Indonesia and South Africa

Chapter 2: Climate Change Agendas
Report commissioned by the Centre for Development and Enterprise 6
specifically mention international support, but all six countries imply this by the fact that they are voluntary pledges, partly contingent on finance and technology transfer from developed nations.
Despite the limitations of the developing country targets, there is broad agreement that developing country pledges amount to more mitigation than developed country pledges against BAU trends, as indicated in Figure 2.5 (SEI, 2011). Different studies also found that the Annex 1 pledges could be significantly diminished by several factors, such as lenient accounting rules on the use of surplus allowances, double-counting of offsets, and accounting methodologies for LULUCF (SEI, 2011). In addition, the US has refused to take on legally-binding emission reduction targets without symmetry from heavily polluting developing countries and Canada has recently withdrawn from the Kyoto Protocol to avoid legally binding targets. Only the EU, Norway and Switzerland appear serious about meeting their legally-binding mitigation targets under the Kyoto Protocol. Although the lack of ambition of developed countries is a big concern, lack of ambition of emerging economies is equally so, as together the result will be global warming and significant climate change. At COP17, the Durban Platform outlined a roadmap for major emitters from both the developing and developed world to sign a deal in 2015 which would come into effect in 2020. This is significant progress but is still not enough.
Figure 2.5 Comparison of country mitigation pledges in UNEP 2011 (SEI, 2011)
Although mitigation has been the main focus of negotiations, adaptation has become much more urgent as lack of mitigation ambition locks the world into accelerated global warming. United Nations Environment Programme’s (UNEP) The Emissions Gap Report (2010) concluded that
Box 1. Mitigation pledges under the Copenhagen Accord by large developing countries China Reduce CO2 emissions intensity of GDP by 40-45% by 2020 compared to 2005 Brazil Reduce GHG emissions by 36.1-38.9% from BAU by 2020 India Reduce GHG emissions intensity of GDP by 20-25% by 2020 compared to 2005 Indonesia Reduce GHG emissions by 26% from BAU by 2020, with unilateral action only, or 41% with
international support Mexico Reduce GHG emissions by 30% from BAU by 2020 South Africa Reduce GHG emissions by 34% from BAU by 2020 and 42% from BAU by 2025, with
international support

Chapter 2: Climate Change Agendas
Report commissioned by the Centre for Development and Enterprise 7
temperature increases of 2.5-5 °C by 2100 are likely. Similarly Climate Action Tracker calculates increases of 2.6-4.0 °C and Climate Interactive calculates increases of about 3.5-4.5 °C (SEI, 2011). These studies all use different methodologies for calculating projected GHG emissions, and therefore temperature, but all conclude that much greater ambition is needed to keeping warming below the 2 °C or 1.5 °C target (Figure 2.3). Least developed countries (LDCs) and small island developing states (SIDS) are the most vulnerable to the impacts of climate change as their economies are disproportionately based on natural resources and they have low adaptive capacity. Although the BASIC countries have high growth rates and large economies, they are also vulnerable to climate change. They are still dependent on natural resources and have large populations of rural poor. Their long coastlines and large coastal cities are vulnerable to sea level rise and storm surges, which could damage infrastructure and negatively affect trade, tourism and fishing revenues. Agricultural production could be reduced by increased temperatures, unpredictable and reduced rainfall and the spread of pests, causing food insecurity and trade imbalances.
While progress towards binding emission reduction targets is slow, significant progress has been made in the areas of ‘climate finance’ and ‘technology transfer’, which have emerged as key bargaining chips in climate negotiations. Developing countries argue that it is the responsibility of developed countries to cover the full ‘incremental costs’ of mitigation actions in developing countries, and that they will not consider emission reduction targets until mechanisms are in place for the transfer of necessary resources. Moreover, they argue that States should be liable for the damage caused by their historical emissions, and thus developed countries should compensate developing countries by paying for adaptation to climate change (Grasso, 2010, UNFCCC, 2009a). With the Copenhagen Accord, and subsequently the Cancun Agreements, developed countries agreed to provide developing countries with ‘new and additional’ resources approaching USD 30 billion in ‘fast-start finance’ for the period 2010–2012; to mobilise USD 100 billion per year by 2020 from a mix of public and private resources; and to establish a Green Climate Fund (GCF) to manage a ‘significant proportion’ of the committed funds. This finance is available to the BASIC countries but they agree BASIC agree on principle to provide preferential treatment to the LDCs for funds from the GCF. They see COP18 in Qatar as an important milestone for achieving the finance goals and the technology mechanism operationalisation.

Chapter 3: Drivers for Action
Report commissioned by the Centre for Development and Enterprise 8
3. Drivers for Action
As outlined in Chapter 2, there are a number of reasons for large developing countries to both prevent action on climate change and to take proactive steps to address climate change. The main barrier to action is the imperative for economic development and poverty reduction. We can identify six key drivers for taking action to prevent climate change:
1. Impacts of climate change on development
The vulnerability of large developing countries to climate change is a major incentive for them to reduce emissions. The direct impacts of climate change include sea level rise, ocean acidification, glacial melt, changing rainfall patterns, increased temperatures and more extreme events (cyclones, floods, storms and droughts). These can negatively impact water supply and quality, agricultural production and arable land, human and animal health, and can cause damage to infrastructure and ecosystems. In turn, water security, food security, energy security and ultimately people’s livelihoods and economic growth are threatened. The Stern Review estimated that the overall costs and risks of climate change will be 5-20% of global GDP if action is not taken to address climate change. In contrast, the cost of action was estimated at 1% of global GDP (Stern, 2006). 2. Global responsibility to reduce GHG emissions
Large developing countries are now major emitters of GHGs (Figure 2.2) and have a responsibility to reduce the risk of climate change. By reducing emissions intensity alone the impacts will be significant, however it will require reductions in absolute emissions in the future. Least developed countries have recently called for solutions that encourage all countries to take on the ‘highest possible levels of mitigation ambition commensurate with some degree of differentiation for emerging economies, middle income countries and the most vulnerable and least developed countries based on agreed criteria’ (LDC, 2012).
3. Energy Security
Much of the economic growth in large developing countries has been fuelled by oil. Despite being large producers of oil, oil consumption is increasing faster than their ability to meet the demand domestically (Figure 3.1). Oil imports are therefore increasing, making these economies vulnerable to oil price spikes, geopolitical events in oil-producing countries, and future oil scarcity. Similarly, large developing countries are becoming more dependent on coal and gas imports, threatening energy security. The increasing scarcity of conventional oil and its increasing price could spur increased investment in green substitutes or alternatively, increasing fuel prices may limit the ability of governments to put a price on carbon. A number of alternative energy sources – hydro, biofuels, nuclear, solar, wind, and geothermal – offer an opportunity to both increase energy security and reduce GHG emissions. Recent analysis by the International Energy Agency (IEA) shows that for every one US dollar that countries do not spend on cleaner fuel, they will have to spend USD 4.3 within the next two decades to make up for their reliance on fossil fuels (Harvey, 2012).
Chapter 3: Drivers for Action
Report commissioned by the Centre for Development and Enterprise 9
Figure 3.1 Oil production and consumption of selected countries. Source: (CIA, 2012)
4. Natural Resource Management
While rapid exploitation of natural resources may pay off in the short term, it can cause severe long term economic harm due to soil erosion, nutrient leaching, reduced water quality, biodiversity and habitat loss, reduced pollination and pest control, flash flooding and desertification. Sustainable natural resource management is not only in a county’s long term economic interests, it is an essential component of global efforts to mitigate and adapt to climate change due to the carbon sequestration of biomass and soil, and the vital role played by ecosystems in water resource management. A new initiative by UNEP and United Nations University’s International Human Dimensions Programme on Global Environmental Change (UNU-IHDP) seeks to provide a new measure of progress or wellbeing that addresses the shortcomings of GDP and HDI. The ‘inclusive wealth’ indicator is a combination of national stocks of assets – ‘wealth’ – natural capital (natural resources, land and ecosystem services, etc.), produced capital (machinery, buildings, etc.), human capital (education, health, skills, etc.), and social capital (institutions, social networks, etc.). The first Inclusive Wealth Report (to be launched at Rio+20 in June 2012) will provide indicators for 20 large economies for the period 1990-2008. The aim is to enable policy makers to make more informed decisions that benefit society and not merely GDP. Preliminary results (Figure 3.2) illustrate how emerging economies are rapidly growing their GDP but degrading their natural capital, resulting in low increases in inclusive wealth. This trend has been recognised by many countries and is likely to be exacerbated by climate change.

Chapter 3: Drivers for Action
Report commissioned by the Centre for Development and Enterprise 10
Figure 3.2 Inclusive Wealth Indicators for Brazil and India (UNU-IHDP, 2012)
5. Economic Opportunities
A low carbon development path presents emerging economies with the opportunity to be world leaders in an emerging and growing sector - low carbon technology innovation. The huge task of reducing global emissions to safe levels requires a massive shift in our energy system away from fossil fuels and towards renewable energy. This will require large-scale manufacturing and export of equipment such as wind turbines and solar panels, which will generate foreign exchange and create jobs. There has been increasing investment in renewable energy in the past decade (Figure 3.3) and this is unlikely to slow down.
Figure 3.3 Global investment in renewable energy vs conventional energy, 2004-2010, USD billion (Bloomberg, 2011)
With the right incentives in place, emission reduction measures that are not yet financially viable can also become valuable economic opportunities. The Clean Development Mechanism (CDM) has provided significant finance, most suited to large emitters, through the sale of Certified Emission Reductions (CERs) to countries and businesses aiming to comply with emission reduction targets. There are numerous bilateral and multilateral funds set up to disburse climate finance to developing countries to reducing emissions from deforestation and forest degradation (REDD+) and to promote renewable energy and energy efficiency.

Chapter 3: Drivers for Action
Report commissioned by the Centre for Development and Enterprise 11
6. Political Will
Increasing public activism and engagement with the challenge of climate change is increasing action on climate change in some countries. Civil society’s demand for action gives leaders the mandate to make bolder commitments in terms of both emission targets and financial transfers. At present there is a growing youth movement on climate change concerned with inter-generational equity. In addition to civil society lobbying, businesses can also play a role. At the last three COPs, businesses have called for government to commit to legally binding agreements in order to provide them with the regulatory certainty to make the necessary investment decisions to play their part in addressing climate change.
The emergence of political and country leadership on climate change action could increase the ambition of wider action. In the past, the EU has been one of the central drivers of the UNFCCC negotiations, pushing for timelines and ambitious pledges. It has also taken unilateral action, for example in expanding the EU Emission Trading Scheme (EU ETS) to include aviation emissions, which utilises its own economic strengths to prompt actions from others. Bold commitments from LDCs and AOSIS have also produced pressure on developed and large developing countries to increase ambition.

Chapter 4: India’s Response to Climate Change
Report commissioned by the Centre for Development and Enterprise 12
4. India’s Response to Climate Change India is a key global player with its huge population, set to become the largest in the world by 2025, and rapidly growing economy. The Government of India (GoI) has been involved in addressing climate change since the 1970’s although the key drivers were energy security and natural resource management. Key events are listed in Box 2 below, showing both international and domestic action. They will be discussed in detail in this chapter.
Box 2. India’s Timeline of Action
1976 Solar PV R&D programme started Oct 1980 Forest Conservation Act 1987 India Renewable Energy Development Agency (IREDA) established Dec 1988 National Forest Policy published and National Forestry Action Programme
(NFAP) established Jun 1992 Participated in the Rio Conventions 1992 Ministry of Non-Conventional Energy Sources (MNES) created Nov 1993 Ratified UNFCCC Sep 2001 Energy Conservation Act passed Mar 2002 Bureau of Energy Efficiency (BEE) established Aug 2002 Acceded to the Kyoto Protocol 2002 State of Environment reporting started Dec 2003 Established its Designated National Authority and National CDM Authority Jun 2004 Initial National Communication (NATCOM) submitted to UNFCCC 2005 New and Renewables Energy Policy published Aug 2006 Integrated Energy Policy published May 2007 Energy Conservation Building Code launched Jun 2007 Prime Minister’s Council on Climate Change constituted Jun 2007 Commits to never exceeding developed country per capita emissions levels Jun 2008 India’s National Action Plan on Climate Change (NAPCC) published Jun 2009 India Climate Portal launched Oct 2009 Indian Network for Climate Change Assessment (INCCA) launched Nov 2009 Jawaharlal Nehru National Solar Mission launched Dec 2009 Commit to 20-25% reduction in emissions intensity – Copenhagen Accord May 2010 INCCA published ‘India: Greenhouse Gas Emissions 2007’ Jul 2010 Carbon tax introduced on domestic and imported coal Nov 2010 INCCA published ‘Climate Change and India: A 4X4 Assessment - A sectoral
and regional analysis for 2030s’ Feb 2011 National Initiative on Climate Resilient Agriculture (NICRA) launched Mar 2011 Tradable market in solar power generation credits, the Renewable Energy
Certificates (RECs) created May 2011 Interim Report of Expert Group on Low Carbon Growth Strategies Apr 2011 National Clean Energy Fund approved by Cabinet Oct 2011 First State Action Plan on Climate Change (SAPCC) published by Orissa Jan 2012 Solar Energy Corporation of India (SECI) set up under Ministry of New and
Renewable Energy (MNRE) 2012 National REDD+ Coordinating Agency and National Forest Carbon Accounting

Chapter 4: India’s Response to Climate Change
Report commissioned by the Centre for Development and Enterprise 13
4.1 Drivers for Action
Climate Change Impacts
India has a unique climate system dominated by the monsoons, which are driven by its location, topography and the oceans surrounding the region (INCCA, 2010a). Most of India’s rain falls during the South-West monsoon season from June to October. Analysis of India’s monsoons from 1871 to 2009 indicates increasing and decreasing trends in annual rainfall in different parts of India and rainfall intensity has been increasing across the country in recent decades. Climate projections indicate a 3-7% overall increase in all-India summer monsoon rainfall in the 2030’s with respect to the 1970’s. However rainfall is expected to decrease in winter and pre-summer periods, except in the Himalayan region (INCCA, 2010a).
The annual mean surface temperature in India increased significantly by 0.51°C per 100 years, during the period 1901–2007 (Kothawale et al., 2010). Warming accelerated from 1971 to 2007, particularly since 1998, increasing by 0.2 °C per decade. Annual mean temperatures are predicted to rise by 1.7-2.0 °C by the 2030’s (INCCA, 2010a). The north Indian Ocean basin has an average of 5.5 tropical cyclones per year, mostly in the Bay of Bengal due to its higher surface temperatures. The frequency of cyclones has been decreasing since the 1880’s however the intensity has been increasing (Mandke and Bhide, 2003). Climate projections indicate that this trend is likely to continue with more intense storms in the 2030s (INCCA, 2010a).
India’s extensive coastline, stretching 7,517 km is home to more than 40 million people, including the mega-cities of Mumbai, Chennai and Kolkata. It is vulnerable to sea level rise and storm surges, which will impact the numerous ports and livelihoods of farmers and fishermen, as well as fragile ecosystems. The lower lying areas on the East Coast risk inundation if sea level rises by 1-2 m. Model projections indicate a sea level rise of 0.18-0.59 m by 2100 (Meehl et al., 2007), though they do not fully take into account the effects of ice sheet flow, and are global rather than regional projections.
Droughts and floods are likely to become more frequent due to climate change, impacting on water yield. This may reduce groundwater quality, increase runoff and reduce recharge affecting irrigation, which uses 83% of rainfall. In addition, Himalayan glaciers, whose melt water ensures that India’s rivers run throughout the year, are receding. This will increase summer river flows in the next few decades, followed by reduced river flow (IPCC, 1998).
To meet the growing population’s demand for food, crop yields needs to increase by almost 30-50% in the next 20 years. Climate change impacts vary across India with rice productivity projected to change by -35% to +35%, maize and sorghum productivity is projected to decrease by up to 50% while coconut yields are projected to increase by up to 30%, by the 2030s (INCCA, 2010a). Fisheries could see increasing catches due to a change in distribution of sardines, mackerel and bream fish caused by increased water temperatures. Preliminary estimates indicate that global
Figure 4.1 Physical map of India (worldmaps, 2012)

Chapter 4: India’s Response to Climate Change
Report commissioned by the Centre for Development and Enterprise 14
warming is likely to lead to a loss of 1.5-2 Mt in milk production by 2020 and 15Mt by 2050 (GoI, 2011a). Coral reefs in the Indian seas are predicted to decline from 2040 with annual bleaching of corals almost a certainty from 2050.
India has more than 70 Mha of forest cover and over 200 million Indians are dependent on forests for their livelihoods. By 2030, 8-56% of the forests are likely to experience a change in vegetation type with respect to those observed in 1970s. There is likely to be an increase in Net Primary Productivity (NPP) ranging from 20–57% (INCCA, 2010a). Human health will also be affected by climate change, with increased probability of malaria and cholera due to increased temperatures and flooding. Changing weather patterns and more disasters will also lead to increased poverty and therefore reduced overall health.
Greenhouse Gas Emissions
Estimating anthropogenic GHG emissions began on a limited scale in India in 1991 when the National Physical Laboratory conducted methane measurement campaign on rice paddies. The first definitive report for the base year 1990 was published in 1998 and since then several papers have been published on GHG emissions for 1990 at national level (Mitra et al., 2004) and district level. A comprehensive inventory of emissions of CO2, CH4 and N2O for the year 1994 was reported in India’s NATCOM to the UNFCCC in 2004. More recently, the INCCA programme has made a rapid assessment of GHG emissions by sources and removal by sinks for the year 2007 (INCCA, 2010b).
In 2007 India had the world’s 5th largest aggregate GHG emissions (excluding LULUCF) of 1,727.71 MtCO2e. Per capita emissions in 2007, however, were 1.5tCO2e - a fraction of that of developed countries. India’s GHG emissions have increased by 690.58MtCO2e from 1994 to 2007, growing at 3.5% per year. All sectors show an increase in emissions, except for agriculture, with highest rates in cement, electricity and waste. In India’s 2007 GHG emissions inventory, GHG emissions (Figure 3.2a) are dominated by electricity (37.8%) which is 90% coal-based, and agriculture (17.6%). Transport emissions were dominated by road (87%), agriculture emissions were dominated by enteric fermentation from livestock (63.4%) – unsurprising as India has the most cattle in the world - and rice cultivation (20.9%) while cropland was the biggest carbon sink. Forests neutralised ~11% of India’s GHG emissions (GoI, 2010a). CO2 emissions (1,221.76Mt CO2) were dominated by electricity generation (51%) with other large contributors being the cement (9%) and iron and steel industries (8%) as shown in Figure 3.2b.
Figure 3.2 a) India’s GHG emissions inventory and b) India’s carbon emissions in 2007 (INCCA, 2010b)
India’s dependence on coal is unlikely to change for many years as it provides domestic energy security and employment. India does have potential storage sites for Carbon Capture and Storage (CCS) in two main geological formations: 1) the depleted oil and gas fields, unmineable coal

Chapter 4: India’s Response to Climate Change
Report commissioned by the Centre for Development and Enterprise 15
seams and saline aquifers in sedimentary basins; and 2) the basalt rocks of the Deccan traps in (IEA, 2011). Estimated potential in the sedimentary basins is 65 GtCO2 (IEAGHG, 2008). It is uncertain whether basalt can store CO2, so estimates are more speculative but sit at 300 GtCO2 (Sonde, 2007).
Proactive steps by the government have reduced the emissions intensity of India’s GDP by more than 30% from 1994 to 2007 (INCCA, 2010a) and India’s energy intensity of GDP has halved since 1970 (IEA, 2010a). If India is to sustain its planned 8-9% real GDP growth rate over the next decade, despite its efforts at improving emission intensities, the total GHG emissions in 2020 are expected to be at least double the absolute levels in 2007. As climate impacts become more severe and India’s emissions increase, so too will international pressure to reduce emissions.
Energy Security
India’s primary energy consumption is dominated by fossil fuels – together coal, oil and natural gas account for 93% of consumption. Nuclear energy only provides 1% of energy consumption in India although it has a domestic reserve of 80–112 Mt of uranium and 360 Mt of high quality thorium reserves (32% of global reserves) which could be used for power generation (IIR, 2010). Despite having the world's fourth-largest coal reserves (7% of global reserves) and large crude oil and natural gas reserves (GoI, 2011c), India imports additional coal, oil and gas to meet growing demand. The gap between supply and demand has been growing over the past decade, resulting in increasing import dependence and reduced energy security (Figure 4.3). The Middle East and North Africa supply 60% of India’s oil and recent geopolitical instability resulted in an increase in oil price. According to Goldman Sachs a USD10/barrel increase in oil price could slow India's GDP growth by 0.2%, may increase the current account deficit by 0.4% and could result in foreign exchange reserves fluctuations (BusinessStandard, 2011).
Figure 4.3 a) India’s fossil fuel resources and b) India’s fossil fuel reserves and consumption
Fossil fuels are heavily subsidised by the government, with 20% for diesel, 50% for Liquid Petroleum Gas (LPG) and 70% for kerosene. Gas is subsidised indirectly through a fertiliser subsidy, as the majority of India’s gas production is used to manufacture fertiliser, and domestic coal prices are also 30-50% below imported price equivalents. Electricity prices are also state controlled and Government-owned electricity distribution entities had combined operating losses of some USD 14 billion in 2011. In 2009, India’s cabinet approved the Integrated Energy Pricing Policy (IEPP) which seeks to align fuel prices with global averages but it has not yet been enforced (Buckley, 2012).
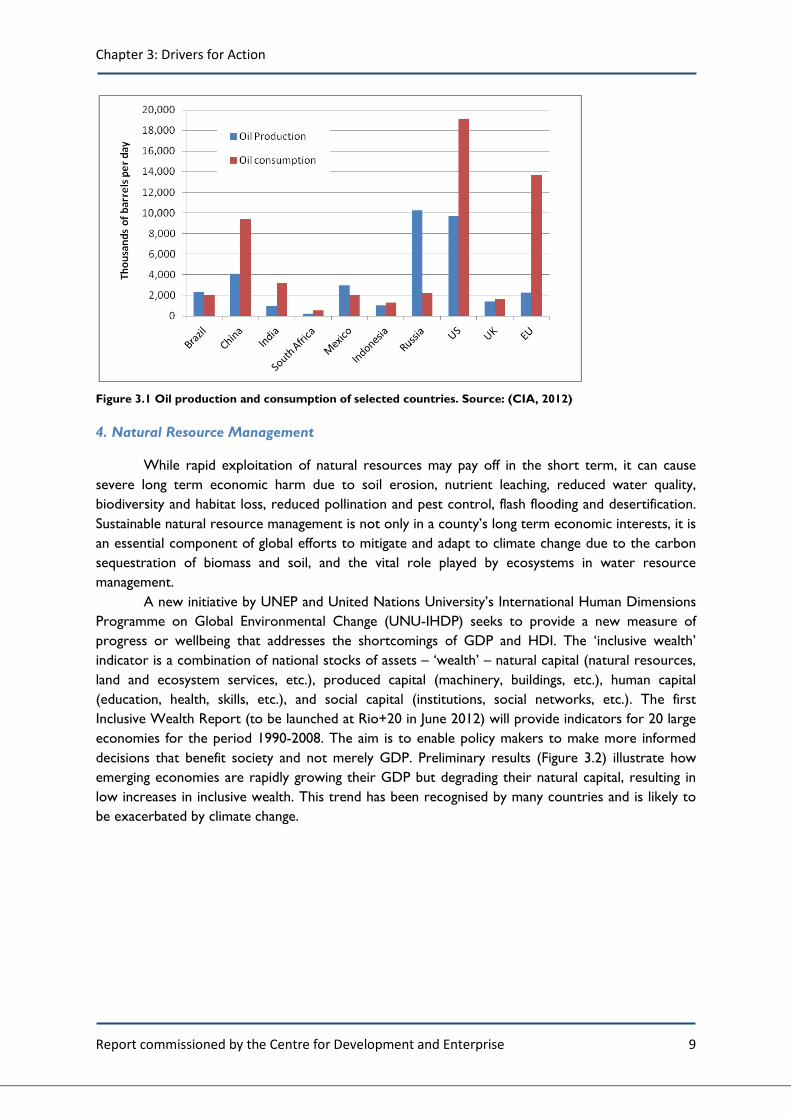
India has 187.5 GW of installed power generation capacity (Figure 4.4), the 5th largest in the world. This is dominated by coal-fired (56%), hydro (21%), natural gas (9%) and wind (6%) power generation (GoI, 2011c). Despite this capacity, 404 million Indian citizens (36%) do not have access to electricity (IEA, 2010b) and per capita consumption is among the world's lowest (IEA, 2011). The
Chapter 4: India’s Response to Climate Change
Report commissioned by the Centre for Development and Enterprise 16
government has ambitious plans provide universal access to electricity by 2012, which the International Energy Agency (IEA, 2009) estimates requires investment of USD 135 billion. In 2006, India’s Integrated Energy Policy projected an energy demand 778-960 GW by 2031/32 to cater for 8-9% GDP growth, six times larger than current capacity (GoI, 2006). More recently, the IEA predicted a demand of 1,277 GW by 2050 based on 6.3% annual GDP growth rate (IEA, 2011).
Figure 4.4 Current electricity generation capacity in India in GW
India’s draft 12th Five Year Plan (FYP) forecasts energy demand to grow by 6% per annum and electricity capacity to expand by 100 GW (20 GW per annum). Critical to the new plan is the focus on measures to combat the continued rise in India’s dependence on imported energy. Oil imports are forecast to rise from 76% of total consumption in 2011 to 80% by 2017; coal imports will rise from 20% in 2011 to 22% by 2017 and gas imports from 19-28%. Energy security is a central issue for India.
To address this energy insecurity, India does have large renewable energy potential, with up to 150 GW hydropower (7th largest exploitable potential globally), 60 GW onshore wind, 20 GW offshore wind, 40 GW biomass, 10 GW geothermal, 15 GW tidal power and huge solar power potential with 300 sunshine days per year and annual solar irradiation of 200 W/m2 (IEA, 2011). In addition, India’s electricity distribution network is inefficient with network losses of over 32% in 2010, compared to world average of less than 15% (Remme et al., 2011). Loss reduction technologies could add ~30 GW of electrical power – avoiding the expense of new power plants.
Natural Resource Management
India’s most recent State of Environment (SoE) report has highlighted the key concerns of land degradation, biodiversity loss, air pollution, water scarcity, hazardous waste from industries, food security, climate change, energy security and managing urbanisation (GoI, 2009). An estimated 146.82 Mha of land suffer from land degradation, India's urban air quality ranks among the world's worst, and it is estimated that at least 10% of India’s recorded wild flora, and possibly the same percentage of its wild fauna, are threatened, many of them on the verge of extinction. Population growth, from 361 million in 1951 to 1.13 billion in 2007, has reduced per capita water availability by 68% to 1,654 m3/year (GoI, 2010b). Rapid economic growth is increasing pressure on the natural environment, reducing its ability to support the plants, animals and people living in India. Strategies for addressing each environmental concern have been developed by the Ministry of Environment and Forestry (MoEF), all of which contribute to addressing climate change.
Economic Opportunities
As a developing country, India is able to access climate finance and has done so successfully to date. It has the advantage of scale in carbon markets, unlike many smaller developing countries, which allows it to register CDM projects. It also has a greater capacity than many developing countries to apply for funds and implement projects. In 1961 the government created seven Indian

Chapter 4: India’s Response to Climate Change
Report commissioned by the Centre for Development and Enterprise 17
Institutes of Technology (IITs) to train scientists and engineers in order to develop a skilled workforce to support the socio-economic development of India. They were seen as ‘institutions of national importance’ and are governed by the Institutes of Technology Act, which was amended in 2011 to add nine new existing institutes to the list (GoI, 2011c). This strategic initiative has given India a strong academic base with expertise in science and technology. This enables the country to adopt new technology quickly and to develop the skills to design and build new technology required by a low carbon economy.
4.2 Action Taken
As the timeline in Box 2 indicates, India has been taking steps to address climate change for many years. Initially though, these actions were aimed at energy security and economic growth, not mitigation or adaptation. Natural resource management has been driven by sustainable development goals and population pressure. This specific focus on climate change has only emerged in recent years and builds on the work of the previous years. Climate change targets are still voluntary for developing countries but India was the first to make a mitigation commitment – to never exceed developed country per capita emissions – in 2007. Under the Copenhagen Accord, India pledged to reduce the emission intensity of its GDP by 20-25% by 2020 relative to 2005 levels. The pledge is voluntary, assuming provision of financial resources and technology transfer from developed countries, and excludes emissions from agriculture (IEA, 2010a).
Energy
Growing concern for energy security since the oil shocks of the 1970s has raised the profile of the new and renewable energy, resulting in the Energy Conservation Act, the Bureau of Energy Efficiency, and the MNRE. The New and Renewables Energy Policy (2005) and the Integrated Energy Policy (2006) promoted energy efficiency in all sectors, mass transport, renewable, accelerated development of nuclear and hydropower, and R&D for climate related technologies. Energy markets were reformed with the Electricity Act of 2005, the Tariff Policy of 2003 and the Petroleum and Natural Gas Regulatory Board Act in 2006. These policies include removing entry barriers, raising competition, price reform, tax reform, feed-in-tariffs and strengthening independent regulation. A clean coal technology roadmap (IIR, 2010) has been developed which is seen as a technology transfer opportunity. Current plans for clean energy capacity by 2022 are shown in Table 4.1.
Table 4.1 India’s planned on-grid power generation capacity
Energy source Target capacity by 2022
Nuclear 17.5GW
Wind 38.5GW
Small hydro 6.6GW
Biomass/cogeneration 7.3GW
Solar 22GW
Geothermal 5MW
Source data: (GoI, 2011c)
India has made significant progress in wind, solar and hydropower and grid transmission efficiency. In 2011 India achieved a record USD 10.3 billion in clean energy investments, up 52% year-on-year, to have the fastest growth of any major country globally. This included USD 4.2 billion for grid-connected solar projects and USD 4.6 billion in the wind sector (Buckley, 2012). India ranks 5th globally in terms of grid-connected wind installations (MNRE, 2012). Off-grid electricity capacity

Chapter 4: India’s Response to Climate Change
Report commissioned by the Centre for Development and Enterprise 18
has been developed in recent years and there were 608 kW of wind-solar hybrid systems and 1,180 water pumping windmills has been installed by mid 2010 and 6.6 MW of biogas and 38.5 MW of solar power installed by March 2011 (MNRE, 2012).
The Ministry of Power (MoP) plans to increase effective capacity by 25 GW though efficiency improvement. The barriers to meeting this target are economic constraints, political barriers, technical challenges and institutional shortcomings (IIR, 2010). The Electricity Act of 2003 gives state energy regulatory commissions (SERCs) with the authority to issue directives that promote energy efficiency and demand side management – most states have not done so yet. Decentralised distributed generation using local feedstock and renewable sources will play a big role in rural electrification of the 78 million households currently without access. The renewable energy (RE) portion has 45-50 MtCO2 mitigation potential – or 6% of power sector emissions. Barriers are low access to credit and poor coordination between the multiple agencies involved.
Despite the progress made in India on reducing dependence on fossil fuels and improving energy efficiency, and therefore reducing emissions, India continues to expand its fossil fuel base. The potential to increase domestic production of fossil fuels faces many challenges including regulatory uncertainty, subsidised petroleum prices, regulated gas prices, skills shortages and inadequate and ageing infrastructure (FICCI, 2011). The Co-Chairman of the Federation of Indian Chambers of Commerce and Industry (FICCI) Hydrocarbons Committee has said, "Our national policies and business initiatives must be tailored around the reality that there is no alternative to oil for India for the next 20 years. India must give every possible support to both public and private oil companies to speedily acquire E&P (exploration and production) assets wherever they can in various continents. India must learn from China on how to secure energy for now and future" (AABC, 2012). From January 2010 to September 2011, Indian national oil companies bought USD 8.3 billion oil and gas assets. While Indian companies have assets in Sudan and Syria their strategy is to acquire low-risk oil reserves in other countries.
Climate Change Assessments
The key climate change agency in India is the Ministry of Environment and Forests (MoEF) while the India Meteorological Department (IMD) observes climatic parameters at surface and upper air observatories throughout the country. The Indian Institute of Tropical Meteorology, Pune, and the Indian Institute of Technology, Delhi, have been engaged in developing climate change scenarios for India. India has a strong scientific community and has played a key role in national and international climate research efforts such as the International Indian Ocean Expedition (IIOE), MONEX (Monsoon Experiment), INDOEX (Indian Ocean Experiment), World Climate Research Programme, Global Observing System, and International Geosphere-Biosphere Programme and the Indo-UK Climate Change Impacts Programme.
In 2009 the MoEF launched the Indian Network for Climate Change Assessment (INCCA) as a network-based programme consisting of over 120 institutions and over 250 scientists country-wide, to improve the knowledge and understanding of the implications of climate change in India. The scope of the INCCA covers short, medium and long-term projections at sub-regional scales; impacts on key economic sectors; the anthropogenic drivers of climate change; and the processes through which GHGs and pollutants interact with the climate system and change the biophysical environment
The INCCA undertakes scientific research, publish biannual climate change assessments, develop decision support systems, and build capacity. In 2010, the INCCA published a ‘4x4 assessment’ of the four major regions in India, namely, Himalayan region, the North-Eastern region,

Chapter 4: India’s Response to Climate Change
Report commissioned by the Centre for Development and Enterprise 19
the Western Ghats and the Coastal Region in regard to observed climate and climate change projections for the year 2030 on the four key sectors such as the Agriculture, Water, Natural ecosystem and biodiversity and Human health.
National Action Plan on Climate Change (NAPCC)
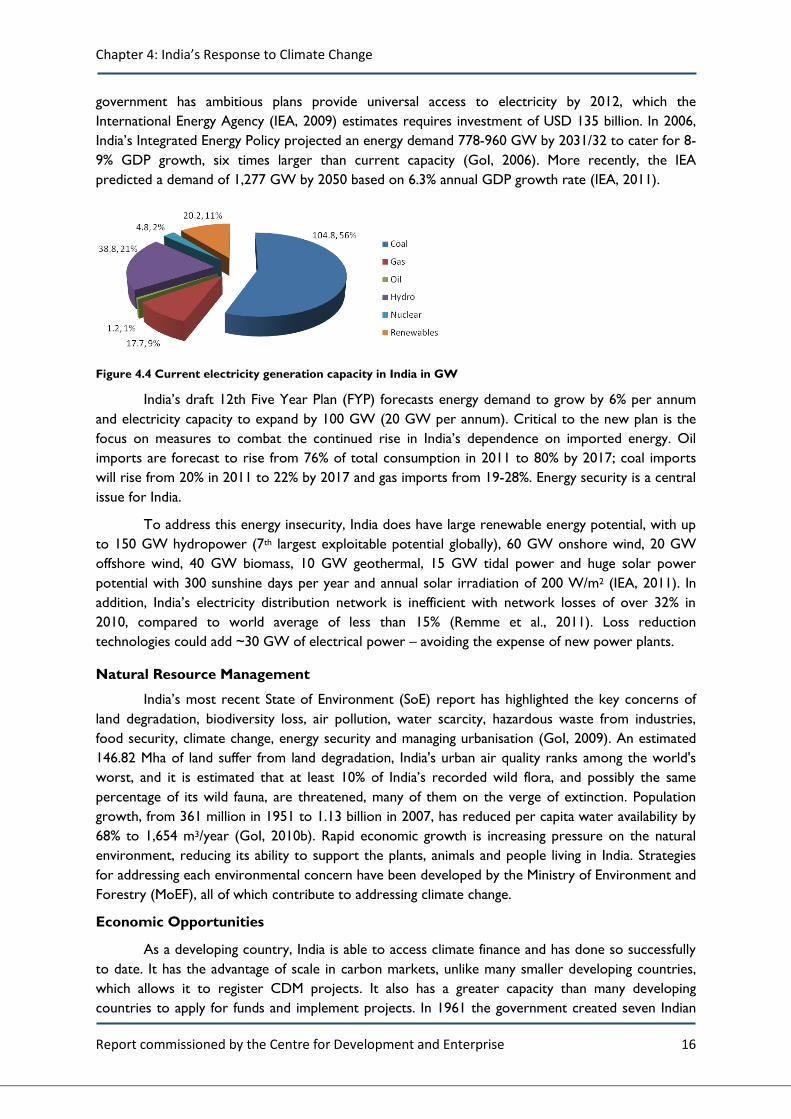
In 2008, India published its NAPCC, led by the Prime Minister’s Council for Climate Change. It has a strong focus on historical responsibility of developed countries and equity but India views itself as being a ‘responsible and enlightened member of the international community, ready to make our contribution to the solution of a global challenge’. It identifies the drivers of the NAPCC as the need to adapt and to ‘further enhance the ecological sustainability of India's development path.’ India recognises that ‘climate change may alter the distribution and quality of India's natural resources and adversely affect the livelihood of its people. With an economy closely tied to its natural resource base and climate-sensitive sectors such as agriculture, water and forestry, India may face a major threat because of the projected changes in climate.’ India supports the concept of equal entitlement to the global atmospheric resource and has committed to keeping its per capita GHG emissions below that of developed countries. Key targets are shown in Box 3.
India’s vision in the NAPCC is ‘to create a prosperous, but not wasteful society, an economy that is self-sustaining in terms of its ability to unleash the creative energies of our people and is mindful of our responsibilities to both present and future generations.’ The NAPCC has seven Guiding Principles, which include protecting the poor, mitigation of GHGs, demand side management, technology deployment, market mechanisms, partnerships with civil society and private sector and international cooperation. The NAPCC outlines 8 National Missions (Table 3.2) to be undertaken in parallel until 2017. It acknowledges that ‘while several of these programmes are already part of our current actions, they may need a change in direction, enhancement of scope and effectiveness and accelerated implementation of time-bound plans.’ The most progress has been made on the first two Missions – focused on renewable energy and energy efficiency – while others are in the early stages or yet to be established. This shows that India’s key drivers continue to be energy security and economic growth.
Other initiatives of the NAPCC include mitigation technologies, disaster management and international cooperation. The NAPCC recognises that the role of state governments is vital for implementation and State Action Plans on Climate Change (SAPCC) are now being developed. Orissa state was the first to develop its action plan in October 2011 but all states are preparing their SAPCCs based on a MoEF template which covers impacts and vulnerability assessments, identification of adaptation and mitigation options, prioritisation of options, and financing options. This is the main focus of activity in India on climate change in India at the moment, however, it is still to be seen whether these drive action or remain as plans.
Box 3. India’s NAPCC - Key Targets
• Cover one third of the country with forests or trees • Reduce energy use by 10GW by 2012 • Increase renewable energy supply to 6% of total energy mix and 10% of the total
electricity mix by 2022 • Supply 10.5GW of new wind power capacity by 2012 • Increase solar PV and solar thermal power generation by at least 1GW each year
Chapter 4: India’s Response to Climate Change
Report commissioned by the Centre for Development and Enterprise 20
Table 4.2 India’s National Missions
Mission Summary of Aims
National Solar Mission
• 20 GW of grid‐connected solar power, 2 GW of off‐grid solar applications, 20 million m2 of solar water collectors, and 20 million solar lighting systems by 2022
• strengthen manufacturing capability for PV modules (4-5 GW by 2020) • major R&D programme to improve the efficiency of existing applications
National Mission for Enhanced Energy Efficiency
• market‐based mechanism for energy‐intensive large industries and facilities, through certification of energy savings that could be traded.
• shift to energy efficient appliances through innovative measures to make the products more affordable.
• Mechanisms created to help finance demand side management programmes in all sectors by capturing future energy savings
• Fiscal instruments developed to promote energy efficiency. National Mission on Sustainable Habitat
• make cities sustainable through improvements in energy efficiency in buildings, management of solid waste and increasing use of public transport.
• extend existing energy conservation building code • improve recycling of material and urban waste management, with a special
focus on development of technology to produce power from waste. • major R&D programme focusing on bio‐chemical waste conversion, waste
water use, sewage utilisation and recycling options wherever possible. National Water Mission
• ensure integrated water resource management to conserve water, minimise wastage and ensure more equitable distribution both across and within states.
• take into account the provisions of the National Water Policy • develop a framework to optimise water use by increasing water use efficiency
by 20% through regulatory mechanisms with differential entitlements and pricing.
National Mission for Sustaining the Himalayan Ecosystem
• understand the complex processes affecting the Himalayan glacier and mountain ecosystem and to develop suitable management and policy measures for sustaining and safeguarding it.
National Mission for a Green India
• increase in forest/tree cover of 5 million ha; • improved quality of forest cover; • improved provision of ecosystems services by treatment of 10 million ha • increased forest‐based livelihood income for about 3 million households living
in and around the forests; • annual CO2 sequestration increased by 50-60Mt by the year 2020.
National Mission for Sustainable Agriculture
• support adaptation to climate change in agriculture, through the development of climate-resilient crops and adapted agricultural practices.
• support expansion of weather insurance mechanisms.
National Mission on Strategic Knowledge on Climate Change
• establishment of a climate science research fund • improved climate modelling capacities • increased international collaboration • encourage private sector initiatives to develop both mitigation and adaptation
technologies through venture capital funds.
Five-Year Plans
India uses FYPs to guide economic development in the medium term. The Eleventh FYP was the first to incorporate climate change related targets (Box 4). The plan considered development to be the most important adaptation measure with rapid economic growth as a key element in
Chapter 4: India’s Response to Climate Change
Report commissioned by the Centre for Development and Enterprise 21
adaptation. The energy capacity target of 92.97 GW is unlikely to be reached – instead 74.18 GW are likely to be achieved (IEA, 2011), or 80% of the target. This gives an indication of the likelihood of India achieving its newer targets.
India’s draft 12th FYP was approved by State Cabinet in May 2012. The Planning Commission has identified "Twelve Strategy Challenges" - core areas that require new approaches - to facilitate consultations with all stakeholders. Climate change is mentioned under ‘Managing the Environment’ but is also relevant to many of the 11 other challenges such as ‘Securing the Energy Future’ and ‘Accelerated Development of Transport Infrastructure’. In October 2011 the Sub-Group on Climate Change produced a report on climate change and the FYP. It highlights the need to integrate the NAPCC into sector plans and state level implementation, the need to develop Nationally Appropriate Mitigation Actions (NAMA) and the need to update the GHG inventory on a regular basis for National Communications to the UNFCCC.
India’s NATCOM outlined the country’s vulnerability to climate change and proposed policies and strategies for adaptation in agriculture, forestry, natural ecosystems, water resources, coastal zones and health. These built on years of work already being done on these areas and highlighted where climate change would exacerbate the situation. These adaptation policies are being updated in the 12th FYP and are summarised in Box 5.
The recommendations for the 12th FYP acknowledge work already underway. In agriculture, the Indian Council for Agricultural Research (ICAR) has recommended adaptation actions and in February 2011, the National Initiative on Climate Resilient Agriculture (NICRA) was launched with three objectives: to enhance resilience of Indian agriculture, to demonstrate site specific technology and to build capacity of scientists and other relevant stakeholders. Integrated Water Resource Management is provided for in the National Water Policy. The Indian Institute of Science has conducted an assessment of climate change impacts on forest ecosystems and the National Afforestation Programme helps to rehabilitate degraded forests. The Integrated Coastal Zone Management (ICZM) policies are in place and coastal zone construction regulations have recently been updated to incorporate the risk of long-term sea level rise. The Indian Council of Medical Research (ICMR) has set up Task Force Groups for vector-borne diseases and climate change, respiratory diseases and air pollutants and eye health and environment. Each task force is undertaking a detailed assessment of the impact on climate change on health.
The Climate Change Sub-group also made recommendations on institutional arrangements. It recommended that four research organisations are set up – the Black Carbon Research Initiative National Carbonaceous Aerosols Programme (BCRI-NCAP), Long-term Ecological Research Observatory (LTERO) for Climate Change, Coordinated Studies in North Eastern Region on Climate Change (CS-NECC) and Climate Change Assessment Studies (CCAS) – and that a National Strategic Fund for Climate Change R&D is set up.
Box 4. India’s 11th 5-Year Plan (2007-2012) - relevant targets
• Accelerate GDP growth to 10% to double per capita income by 2016–17 • Create 70 million new work opportunities • Increase forest and tree cover by 5% • Increase energy efficiency by 20% • Increase energy capacity by 92.97GW

Chapter 4: India’s Response to Climate Change
Report commissioned by the Centre for Development and Enterprise 22
Both the NAPCC and the Climate Change Sub-group recognise the need for improving disaster management. India has a National Disaster Management Authority (NDMA) and a National Institute of Disaster Management (NIDM) which was established by the Disaster Management Act of December 2005. The First session of the National Platform on Disaster Risk Reduction (NPDRR) will be held from 25-26 April 2012.
The report also recommends that the 12th FYP should incorporate costs of preventative adaptation. These are indicated in the 8 NAPCC Missions but need to be assessed more rigorously
Box 5 Adaptation and Mitigation recommendations for India’s 12th 5-year plan (Oct, 2011) Agriculture • Strengthen surveillance of pest and diseases • Develop mechanisms for integrated management of rainwater, surface and groundwater • Provide weather-based insurance products to increasing number of farmers • Establish a science-based Agricultural Intelligence System • Establish Weather Watch groups for climate sensitive commodities • Support community partnerships in developing food and forage banks to manage scarcity • Improve GHG inventories • Evaluate carbon sequestration potential of different land use systems • Evaluate mitigation potential of biofuels and their enhancement • Identify cost-effective opportunities for reducing methane emissions in ruminants • Renew focus on nitrogen fertilizer use efficiency with added dimension of nitrous oxides mitigation Water • Review data collection networks • Create a framework to enable mapping of hydrological units • Create an inventory of available data series • Enrich the GIS-based Water Resources Information System • Develop scenarios of future impacts of climate change Forestry • Expand Protected Areas, promote migration of species, forest conservation and mixed species forestry • Anticipatory planting of species along latitude and altitude • Promote assisted natural regeneration • Develop and implement fire protection and management practices • Adopt thinning, sanitation and other silvicultural practices • Develop temperature, drought and pest resistance in commercial tree species • Develop and adopt sustainable forest management practices • Adopt of energy efficient fuel wood cooking devices • Undertake systematic forest observations and employ terrestrial laser scanners to assess productivity • Implement 20-25 Long Term Ecological Sites (LTES) and plan for protecting ecological hotspots Coastal Areas • Integrate Climate Change Impact Assessment into environmental impact assessments • Prioritise ICZM • Estimate flood inundation for megacities and other vulnerable regions along the coast • Strengthen monitoring mechanisms through installation of tide gauges, HF radars, etc. along the coast • Incorporate sea level rise into infrastructure development planning and Coastal Regulatory Zone rules • Plant mangroves as natural protection from extreme events • Ensure land-use control and dissemination of information • Undertake scientific evaluation of potential changes in the coastal zone Health • Research into climate change impacts on diarrheal and viral diseases, heat stress and cancer • Multi-disciplinary long term studies in partnership with IMO, Central Pollution Control Board and Indian Space Research Organisations Infrastructure • Sectoral and regional risk assessments for Indian infrastructure due to climate change • Create and analyse alternative development pathways

Chapter 4: India’s Response to Climate Change
Report commissioned by the Centre for Development and Enterprise 23
to inform planning and budgeting. As an indication, in 2006/7, 12% of government expenditure (or 2.63% of GDP) was spent on programmes directly related to climate variability.
Low Carbon Growth Strategies
One of the key pillars of the 12th FYP will be low carbon inclusive growth, which implies that all households are electrified and have access to clean cooking fuels such as natural gas or LPG. This involved a shift from traditional biomass (which is mostly carbon neutral) to modern commercial energy which will result in increased energy consumption and GHG emissions.
An Expert Group on Low Carbon Strategies and Inclusive Growth was formed in early 2011 by India’s Planning Commission to feed into the 12th Five Year Plan. An interim report was produced in May 2011 and a final report is due in the coming months. The interim report provides options for emissions reductions in critical sectors of the economy - power, transport, industry, buildings and forestry (see Box 6), based on the National Missions of the NAPCC. Two scenarios are given - with Determined Efforts, India can reduce the emission intensity of India’s GDP by 23-25% by 2020 from 2005 and with Aggressive Efforts (upper limit of feasibility) reductions of 33-35% by 2020 from 2005 levels are possible (GoI, 2011a). These are detailed in Table 4.3. The Aggressive Efforts option still represents low ambition compared to other emerging economies and does not really produce low carbon growth.
Table 4.3 Projected emission intensity reduction by 2020 from 2005 (GoI, 2011b)
Scenarios 2005 8% GDP growth 9% GDP Growth Determined
Effort Aggressive
Effort Determined
Effort Aggressive
Effort Power generation capacity (TWh) 0.76 1.8 1.7 2.1 1.9 Emissions at 2005 levels (MtCO2e) 1,433 4,571 4,571 5,248 5,248 Absolute emissions (MtCO2e) 1.433 3,537 3,071 4,016 3,521 Emissions intensity (gCO2e/Rs GDP) 56.2 42.5 36.9 42.8 37.5 Reduction in emissions intensity (%) - 24.4 34.4 23.9 33.3
The costs and knock-on effect on the economy were not determined in the interim report but will be covered in the final report. The final report will suggest the best options to meet the targets, estimate the associated costs, and identify barriers to adoption and required policies to overcome them. India’s emphasis is on measures that encourage stakeholders to adopt a low carbon growth path, so that inclusive growth is guaranteed. The low carbon policies chosen will take into account the transaction costs of implementation and livelihood considerations such as income generation and poverty alleviation will take priority over mitigation.
In order to address the uncertainty in the emissions inventory and projections, the interim report recommends that a National Greenhouse Gas Inventory Management Authority (NGIMA) and a National GHG Inventory Management System (NGIMS) are set up and mechanisms for voluntary disclosure of GHGs from installations managed by the private sector are designed.
In order to understand how India’s targets relate to its BAU emissions and mitigation required by science, Figure 4.5 has been drawn. India’s ‘BAU Emissions Trajectory’ is based on the Government of India’s (2011b) Interim Report of the Expert Group on Low Carbon Strategies for Inclusive Growth. Each assumes a central scenario under an 8% economic growth rate. Note that India’s voluntary pledge, to reduce the emission intensity of its GDP by 20-25% relative its 2005 level, does not include emissions from the agriculture sector. The ‘Required by Science’ scenario is based on IPCC’s conjecture that non-Annex 1 countries should reduce emissions 15-30% below a BAU baseline by 2020, the UK Energy and Climate Change Select Committee’s estimate that in a

Chapter 4: India’s Response to Climate Change
Report commissioned by the Centre for Development and Enterprise 24
world of 9.2 billion people in 2050 emissions caps should converge at 2.1 to 2.6 tonnes CO2e per capita to limit the chance of global warming surpassing 2 °C, and the US Census Bureau’s (USG, 2012) prediction that India’s population will equal 1,656,554,000 in mid-2050. The line is dashed because it is a cap on global emissions that is required by science. The level of individual countries’ emissions will need to be a political decision made by the Conference of the Parties, and based on equity, as well as economic and technological realities.
Figure 4.5 India’s GHG Emissions, 2010 – 2050, not including emissions from agriculture

Chapter 4: India’s Response to Climate Change
Report commissioned by the Centre for Development and Enterprise 25
Finance
India has taken a number of actions in attracting and providing finance for low carbon development and climate adaptation work. India has been very successful in the carbon market, with a total of 1,998 CDM projects and 775 registered projects. As of 1 February 2012, India has 14% of current projects at validation globally (CD4CDM, 2012a). Of the 1,998 CDM projects in India, 19.1% are for biomass energy, 9.6% are for hydro, 38.2% are for wind projects and 21.5% are for energy efficiency projects (CD4CDM 2012a). They are spread across the states but concentrated in Tamil Nadu (26%), Maharashtra (12.9%), Gujarat (11.8%), Karnataka (11.4%) and Rajasthan (9.1%) largely due to the wind potential in those states. CDM has not been effective at a grass-roots level due to high transactions costs and lack of scale. In September 2011 the fifth annual India Carbon Market Conclave - the largest platform to engage with the Indian carbon market – was held in New Delhi, organised by the Federation of Indian Chambers of Commerce and Industry (FICCI). The event provides an opportunity for global carbon market stakeholders to engage with Indian project developers, and other carbon market stakeholders, and a forum for domestic and international policy dialogue on climate change and the carbon market.
Under the Electricity Act 2003, the State Electricity Regulatory Commissions (SERCs) set targets for distribution companies to purchase a set percentage of their total power from renewable energy sources - termed the Renewable Purchase Obligation (RPO). This state-specific approach was flawed due to the varying renewable energy potential in different states hindering some states from meeting their targets. To address this problem, RECs were proposed and REC trading was
Box 7. India’s Low Carbon Growth Strategies – options for 12th Five-Year Plan Power Supply • adopt super‐critical technologies in coal-based thermal power generation • use gas in combined heat and power systems in large establishments • invest in renewable technologies, particularly solar, wind and second generation bio‐fuels • develop hydropower in a sustainable manner
Power Demand • accelerate adoption of super-efficient electrical appliances through market and regulatory mechanisms • enhance energy efficiency by facilitating adoption of best available technology in industry • modernise transmission and distribution systems to reduce technical and commercial losses
Transport • increase share of rail in overall freight transport (improve efficiency, make competitive) • complete dedicated rail corridor • improve share and efficiency of public transport system • improve fuel efficiency of vehicles through market based and regulatory mechanisms
Industry • greenfield plants in Cement and Iron and Steel sectors adopt best available technology • existing plants modernize and adopt green technology • financing mechanisms set up in equitable and transparent manner.
Buildings • change the design and structure of building to reduce energy demand • be evolve and institutionalize Green Building Codes at all levels of Government
Forestry • regenerate at least 4 million hectares of degraded forest; • increase density of cover on 2 million hectares of moderately dense forest • overall, increase the density of forest and tree cover on 10 million hectares

Chapter 4: India’s Response to Climate Change
Report commissioned by the Centre for Development and Enterprise 26
launched in India in February 2011. A REC is created when one MWh of electricity is generated from an eligible renewable energy resource. Clean energy producers are allowed to trade in RECs through Central Energy Regulatory Commission (CERC)-approved power exchanges and obligated entities can purchase RECs to meet their RPO. RECs are split into solar and non-solar RECs. Non-solar RECs have a floor price of 1,500 Indian Rupees (INR) per MWh and a forbearance price of INR3,300/MWh. Solar RECs have a floor price of INR9,800/MWh and a forbearance price of INR13,690/MWh. As of March 2012, 1,181 renewable energy generators had signed up and over one million RECs had been issued and redeemed (REC-Registry, 2012).
Figure 4.5 India’s Renewable Energy Certificates registry (REC Registry of India, 2012)
On 30 March 2012 the GoI launched the Perform Achieve Trade (PAT) trading scheme aimed to reduce energy consumption in industries across India using market oriented mechanisms. The scheme is being implemented by the Bureau of Energy Efficiency under the National Mission for Energy Efficiency. An amendment to the Energy Conservation Act in 2010 gave PAT a legal mandate and participation in the scheme is mandatory for Designated Consumers (DCs). The initial 3-year phase includes 478 DCs in eight industrial sectors – predominantly from the power sector (144), the textile sector (90) and the cement sector (85). PAT imposes mandatory energy targets on the participating companies and allows participants to purchase energy savings from other participants in the form of white certificates for compliance. PAT will create a domestic market for white certificates and will secure cost-effectiveness in meeting the total energy savings target under the system. At the end of the initial phase, certificates will be checked and financial penalties will be issued for non-compliance. The targets for 2015 are a 5% reduction in energy consumption which equates to 10 million Mtoe of energy and 27 MtCO2 (IIP, 2012).
In September 2009 CERC launched Feed-in-Tariffs (FIT) for renewable energy in India. The tariff for solar PV projects is fixed at 17.90 INRs or USD 0.397 per kilowatt-hour (kWh) while the tariff for solar thermal projects is INR15.40 (or USD 0.342)/kWh. An overwhelming response from project developers to the feed-in tariff led India to set up a reverse auction process where developers have to compete for business. In December 2011 over 100 producers bid to sell solar-power to a state owned company. The lowest bid was INR7.49 (USD 0.15) /kWh and the average bid price was 8.77 INR (USD 0.18) /kWh – cheaper than Germany, the world’s biggest solar-power user. This auction process has sidelined the subsidy framework and could be a more sustainable and viable method for increasing solar power (Mandhana, 2012).
In July 2010, India introduced a carbon tax on domestic and imported coal, at the rate of INR 50/t (USD 1.07/t). For coal used in power generation, this tax represents a price increase of 5-

Chapter 4: India’s Response to Climate Change
Report commissioned by the Centre for Development and Enterprise 27
10% based on run‐of‐mine prices in October 2010, depending on the coal quality. The income from the tax goes into a National Clean Energy Fund for funding research, innovative projects in clean energy technologies, and programmes to repair environmental damage (IEA, 2011). Almost USD 2.1 billion was transferred into the Fund in the financial year 2011-2012 (ClimateConnect, 2012).
Limited depth in the domestic financial sector and high interest rates makes accessing debt capital in India difficult. Private sector involvement in the Indian electricity sector is relatively limited. Bilateral agreements could play a more material role in accelerating India’s renewable sector and building on the current base (Buckley, 2012). India has already received support from development partners including:
- The Asian Development Bank has extended USD 100 million of loans to the Gujarat Power Corporation and provided USD 150 million of funding for a Partial Credit Guarantee (PCG) to provide private financial institutions some cover against legal, political, commercial risks evident in the initial solar infrastructure projects.
- The World Bank has helped the Gujarat state government launch the Gujarat Venture Finance Ltd (GVFL) with the aim of establishing a USD 500 million green energy fund dedicated to attracting Chinese firms to invest in Gujarat to encourage the deployment of Chinese technology.
- The US Export-Import Bank extended USD 103 million of loans in November 2011 to aid MiaSola, First Solar and SolarWorld in financing Phase 1 solar projects in India. In January 2012 the US Export-Import Bank also said it was considering over USD 2 billion of loans into India, tied to US export contracts. Many of these are renewable energy based.
- The European Investment Bank (EIB) granted a €200 million loan to ICIBI Bank of India for renewable energy lending in 2011.
- KfW funded a €250 million loan to Maharashtra State Power Generation for a 150MW solar project in New Delhi, due for completion by December 2012.
- Greenko Group signed a deal with GE Financial Services (GEFS) whereby GEFS invested USD 50 million in a new 65 MW wind farm in India in October 2011.
Lastly, India’s afforestation and related programmes could also be a source of funding. It is estimated that a REDD+ programme for India could sequester over 1 billion tonnes of CO2 over the next 3 decades and provide more than USD 3 billion (GoI, 2010a).
Private Sector
The key players of India’s economy are the biggest companies. 57 Indian companies were listed in Forbes’ Global 2,000 companies in 2011 and 9 were in the Forbes 500. India’s top 10 companies in 2011, with a market value of USD 177.5 billion, were Reliance Industries (121), the State Bank of India (136), ONGC - Oil and Natural Gas Corporation (172), Indian Oil (243), ICICI Bank (288), NTPC - National Thermal Power Corporation (348), Coal India (418), Bharti Airtel (453), Larsen and Toubro (499) and Tata Motors (512). India’s private sector is dominated by companies involved in extracting and burning fossil fuels, which does not bode well for efforts to mitigate climate change. These companies are all taking some action on climate change, but it involves expanding the fossil fuels industry. Reliance Industries believes that India can fulfill its agenda for climate change with natural gas (Reliance Industries, 2012), ONGC has adopted a ‘Green agenda’ which involves frontier Clean Coal Technologies and a Methane to Market project (ONGC, 2012) and Indian Oil is developing biofuels and wind power capacity on a small scale. Although these large
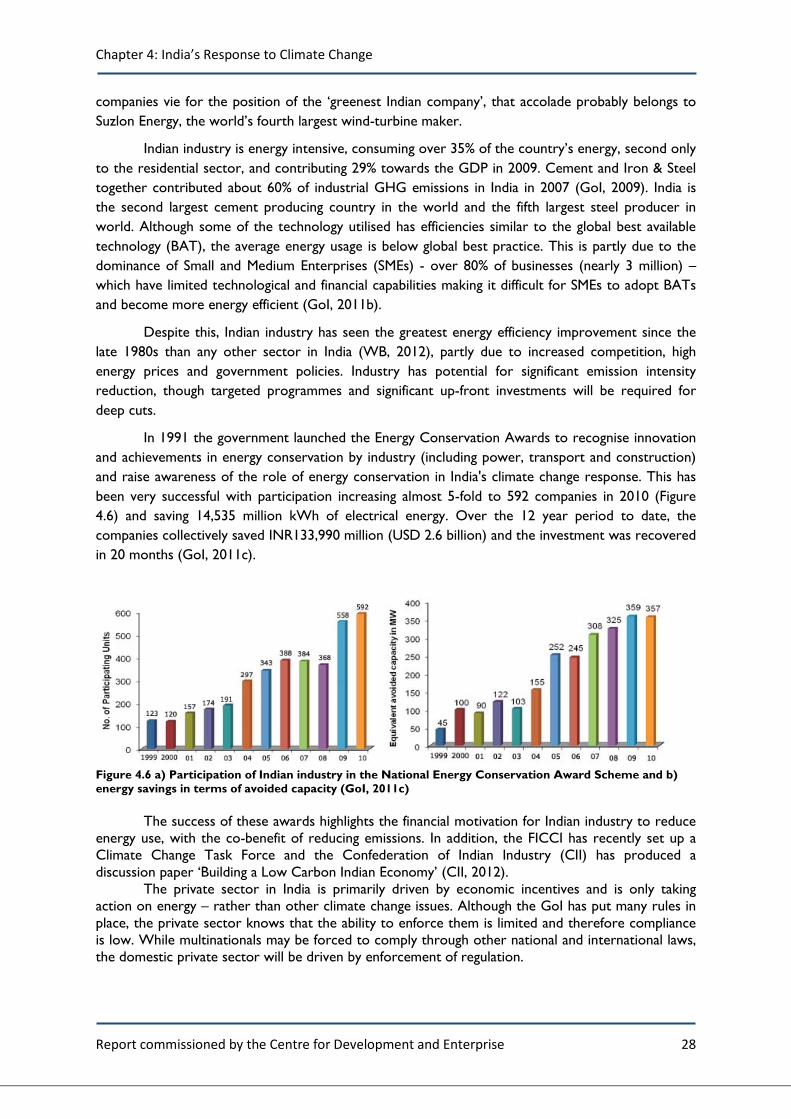
Chapter 4: India’s Response to Climate Change
Report commissioned by the Centre for Development and Enterprise 28
companies vie for the position of the ‘greenest Indian company’, that accolade probably belongs to Suzlon Energy, the world’s fourth largest wind-turbine maker.
Indian industry is energy intensive, consuming over 35% of the country’s energy, second only to the residential sector, and contributing 29% towards the GDP in 2009. Cement and Iron & Steel together contributed about 60% of industrial GHG emissions in India in 2007 (GoI, 2009). India is the second largest cement producing country in the world and the fifth largest steel producer in world. Although some of the technology utilised has efficiencies similar to the global best available technology (BAT), the average energy usage is below global best practice. This is partly due to the dominance of Small and Medium Enterprises (SMEs) - over 80% of businesses (nearly 3 million) – which have limited technological and financial capabilities making it difficult for SMEs to adopt BATs and become more energy efficient (GoI, 2011b).
Despite this, Indian industry has seen the greatest energy efficiency improvement since the late 1980s than any other sector in India (WB, 2012), partly due to increased competition, high energy prices and government policies. Industry has potential for significant emission intensity reduction, though targeted programmes and significant up-front investments will be required for deep cuts.
In 1991 the government launched the Energy Conservation Awards to recognise innovation and achievements in energy conservation by industry (including power, transport and construction) and raise awareness of the role of energy conservation in India's climate change response. This has been very successful with participation increasing almost 5-fold to 592 companies in 2010 (Figure 4.6) and saving 14,535 million kWh of electrical energy. Over the 12 year period to date, the companies collectively saved INR133,990 million (USD 2.6 billion) and the investment was recovered in 20 months (GoI, 2011c).
Figure 4.6 a) Participation of Indian industry in the National Energy Conservation Award Scheme and b) energy savings in terms of avoided capacity (GoI, 2011c)
The success of these awards highlights the financial motivation for Indian industry to reduce energy use, with the co-benefit of reducing emissions. In addition, the FICCI has recently set up a Climate Change Task Force and the Confederation of Indian Industry (CII) has produced a discussion paper ‘Building a Low Carbon Indian Economy’ (CII, 2012).
The private sector in India is primarily driven by economic incentives and is only taking action on energy – rather than other climate change issues. Although the GoI has put many rules in place, the private sector knows that the ability to enforce them is limited and therefore compliance is low. While multinationals may be forced to comply through other national and international laws, the domestic private sector will be driven by enforcement of regulation.

Chapter 4: India’s Response to Climate Change
Report commissioned by the Centre for Development and Enterprise 29
4.3 International Negotiations
India ratified the UNFCCC in 1993, acceded to the Kyoto Protocol in 2002 and submitted its NATCOM to the UNFCCC in 2004. NATCOM was focused on climate vulnerability and adaptation, however the growing pressure to address mitigation led the government to commit to never exceeding developed country per capita emissions levels in June 2007. Under the Copenhagen Accord, India committed to a 20-25% reduction in emissions intensity of GDP by 2020 from a 2005 baseline. This commitment is dependent on finance and technology transfer, although it is likely that India will achieve it without support. India supports the question of raising mitigation ambition being based on the IPCC 5th assessment report (AR5) due in 2014/5, the outcomes of the 2013-2015 review of UNFCCC, and the work of subsidiary bodies. India believes that the increased mitigation ambition for the 2012-2020 period should come from Annex I countries and be based on the science presented in the IPPC’s AR4. India has recommended that Annex I Parties reduce their emissions by 25-40% by 2020, and make an unconditional decision before COP18 (GoI, 2012). India is therefore unlikely to increase its mitigation targets before 2020.
Lack of capacity prevented India from engaging very deeply in the negotiations until recently. In 2011, India submitted a number of recommendations to the UNFCCC. India’s June 2011 submission called for less onerous requirements for NATCOMs for non-Annex I countries and for financial, technological and capacity building support for non-Annex I countries in preparing the NATCOMs. This is specifically aimed at mitigation actions which India states should be measured and verified at the domestic level and ‘will not look at the appropriateness of the actions’. Also, India recommended that the UNFCCC registry of mitigation actions should ‘provide information on the matching of mitigation actions with the support received’.
India’s October 2011 submission (UNFCCC, 2011b) requested three additional agenda items at COP17:
• Accelerated access to critical mitigation and adaptation technologies and related intellectual property rights
• Equitable Access to Sustainable Development • Unilateral Trade Measures
India argued that previous COP agreements did not address the issue of access to intellectual property rights (IPRs) for climate friendly technologies, which along with prohibitive costs make it very difficult for developing countries to address climate change. India wants an IPR regime that ‘balances rewards for the innovators with the common good of humankind’. This has been resisted by countries like the US who are already concerned about the economic growth and strength of China and India and do not want to help them before the new superpowers.
India’s second point was that negotiations will falter without a shared understanding on an equitable basis for climate action and sought a constructive discussion at COP17. India’s third point, which was supported by many other countries, was that developed countries must commit that they will not resort to unilateral trade measures, such as carbon border adjustment and taxes. This was directly aimed at the controversial EU aviation emissions tax which violates and undermines the UNFCCC and has implications for global trade. At the most recent BASIC Ministers meeting in New Delhi in February 2012, India's Environment Minister Jayanthi Natarajan criticized the EU carbon tax as "unilateral trade measures disguised and taken in the name of climate change". This is likely to remain a contentious issue.
At COP17 in December, India help up negotiations by insisting that its cabinet had not given a mandate for agreeing to a legally binding instrument – which the EU, AOSIS, the LDCs, ALBA, and even India’s BASIC allies, Brazil and South Africa, were seeking in the Durban Platform. Nearly 36 hours after the official end of the conference, India agreed to substitute the term “legal outcome” with a marginally less ambiguous term, “agreed outcome with legal force”, which resulted in the EU

Chapter 4: India’s Response to Climate Change
Report commissioned by the Centre for Development and Enterprise 30
and its allies accepting a second Kyoto Protocol commitment period (Rajamani, 2011a). Since then, India has said that the Durban Platform needs adjustment and is calling for a process and mandate for the Durban platform.
India’s primary objective is to ensure equity in any legally binding agreement, where historical responsibility of the developed countries is acknowledged and addressed. If India is to sustain its planned 8-9% real GDP growth rate over the next decade, despite its efforts at improving emission intensities, the total GHG emissions in 2020 are expected to be at least double of the absolute levels in 2007. India’s view is that ‘this carbon space must be made available to it to achieve inclusive growth and eliminate poverty’ (GoI, 2011b).
4.4 Conclusion
India has multiple reasons for responding to climate change – it is highly vulnerable to the impacts of climate change, it is becoming more and more dependent on imported fossil fuels and it has the ability to take advantage of the economic opportunities and climate finance that is now available. It also places high importance on preserving ecosystems and its unique biodiversity. Its rapid economic development has improved the lives of many Indians however it has been at the cost of India’s natural capital. And there is still a very large population living in poverty who expects their government to do the same for them.
India is taking action on many fronts to address poverty alleviation, natural resource management and climate change mitigation however it is falling far short of what is required. India has made the most progress in the energy sector and is now a global leader in renewable energy and CDM projects. The government has introduced carbon trading and has successfully piloted the world’s first auction for feed-in tariffs. Indian industry is also increasing its engagement with climate change and taking steps to follow a lower carbon path. But there are no plans to phase out fossil fuels in the next 20 years and India is likely to become the second largest GHG emitter in the world in the next few years. The government has recently increased its attention on adaptation with more detailed climate change assessments being undertaken but it still has a long way to go to properly deal with the impacts of climate change. The results show the significant risks to food security, water security and livelihoods and India needs to do much more to become climate resilient.
India’s stance in the climate negotiations is partly dependent on what the BASIC group agree, but it will continue to argue for equity and that developed nations increase their mitigation ambition to meet the level required by science, based on their historical responsibility. Progress on greater ambition in India is unlikely before 2020.

Chapter 5: China’s Response to Climate Change
Report commissioned by the Centre for Development and Enterprise 31
5. China’s Response to Climate Change
China is rapidly emerging as the new superpower, rivalling the United States. Their response to climate change is therefore particularly important for all countries. The timeline below lists the key events related to climate change in the past few decades.
Box 9. China’s Timeline of Action Taken 1989 Environmental Protection Law passed 1991 China Council for International Cooperation on Environment and Development
(CCICED) established 1992 Signed the UNFCCC 1993 Ratified the UNFCCC 1994 Agenda 21- White Paper on China's Population, Environment and Development
in the 21st Century Nov 1997 Law on Energy Conservation of the People's Republic of China approved 1998 Signed the Kyoto Protocol Sept 2000 Law of the People's Republic of China on the Prevention and Control of
Atmospheric Pollution came into force Aug 2001 Law of the People's Republic of China on Desert Prevention and Transformation
adopted 2002 Ratified the Kyoto Protocol 2004 Initial National Communication on Climate Change submitted to UNFCCC 2005 11th Five-Year-Plan for National Economic and Social Development published Feb 2005 Renewable Energy Law of the People's Republic of China approved 2006 Set out goal of reducing per-unit GDP energy consumption in 2010 by 20% from
2005 levels 2007 China’s National Climate Change Programme produced Jan 2010 Submitted pledge to Copenhagen Accord 2010 China sets up National Energy Commission headed by Premier 2011 Registered a NAMA 2011 12th Five-Year-Plan for National Economic and Social Development

Chapter 5: China’s Response to Climate Change
Report commissioned by the Centre for Development and Enterprise 32
5.1 Drivers for Action
Climate Change Impacts
Given China’s large size and variations in the topography, China’s climate is naturally very varied. The country is divided into five climatological regions from south to north; tropical monsoon, subtropical, warm temperate, temperate and sub-arctic (SDPC, 2004). Over the past century annual average air temperature has increased by 0.5–0.8°C, most of this change being in the last 50 years (Kan, 2011). This warming has been felt most strongly in western, eastern and northern China, rather than in the south, and has been most significant during winter (Zhai and Pan, 2003). Changes in precipitation patterns have also been observed with annual rainfall decreasing in the North-East and North China whilst western and south-eastern coastal China has experienced an increase (Zhai et al., 2004). The changes in rainfall distribution are acting to exacerbate current trends of droughts in the north and flooding in the south (NDRC, 2007). China has experienced an increase in both floods and droughts, with a seven-fold increase in the frequency of floods observed since the 1950s (Zhai et al., 2004). The frequency of extreme rainfall has increased in western and southern parts of China. The Changjiang river has experienced more frequent flooding in the past decade. In northern regions decreases in rainfall have led to an increase in the area affected by drought to over 6.7 Mha since 2000, an increase in dust storms in the affected area has also been observed (Chen et al., 2002). An increase in sea level has been observed along China’s coast during the past 50 years, slightly higher than the global average at 2.5 mm/a (NDRC, 2007). Mountain glaciers in China have retreated and this trend is increasing (NDRC, 2007).
The Intergovernmental Panel on Climate Change (IPCC) climate change projections split China into two regions; the western Tibetan Region and the eastern region. Temperatures are projected to increase over the 21st century by 3.3 °C in Eastern China and 3.8 °C in western Tibetan region, based on the medium scenarios (Trenberth et al., 2007). A large majority of individual years and seasons are projected to be extremely warm compared to the present day in the late 21st century (Trenberth et al., 2007). It has been predicted that the highest altitudes of the Himalayas will experience the greatest warming due to the decrease in surface albedo associated with melting snow and ice (Trenberth et al., 2007).
China’s varied environment and numerous ecosystems are highly vulnerable to changes in climate. The country’s extensive coastline is vulnerable to sea level rises, with the Yangtze delta particularly at risk. Coastal areas are at risk from seawater intrusion and soil salinisation as well as coastal erosion. Marine fishing resources are at risk from sea temperature rise and acidification.
The agriculture sector will be negatively affected by changes in temperature and precipitation. It is estimated that there will likely be a drop in the yield of the three major crops – wheat, paddy rice and corn. In addition, the scope of crop diseases and insect pests is likely to grow. There is also an increased risk of livestock epidemics. It has been reported (Erda et al., 2008) that
Figure 5.1 Map of China and its states

Chapter 5: China’s Response to Climate Change
Report commissioned by the Centre for Development and Enterprise 33
the combined effects of the increase in temperature, decrease in agricultural water resources and arable land will cause China’s overall food production to fall by 14 – 23% by 2050 from 2000 levels. Overall, climate change will have a negative effect on China’s society and economy. Increased chances of disease occurrence and spread, adverse effects on natural and cultural tourism resources, and losses to the national economy are likely to occur.
GHG Emissions
China’s economy has grown rapidly at ~10% per year over the past 30 years since the transformation from a closed, centrally planned system to a more market-oriented one, and is now the world’s second largest economy. Rapid economic growth has been combined with a huge increase in GHG emissions, as shown in Figure 5.2, and in 2007 China overtook the US to become the world’s biggest CO2 emitter. From 1994 to 2004 the annual average growth rate of GHG emissions was around 4% (NDRC, 2007).
Figure 5.2 Total amount of CO2 in million metric tons emitted from the consumption of fossil-fuels. Source: CDIAC (Carbon Dioxide Information Analysis Center)
Although China’s total emissions are the highest in the world, on a per capita basis they have only recently exceeded the global average and are still low in comparison to developed countries. In 1950, China’s cumulative emissions accounted for only 1.13% of the world total. From 1950 to 2002 China’s emissions from fossil fuel combustion have accounted for only 9.33% of the total. When ranked per capita, this placed China 92nd in the world over that time period (NDRC, 2007). China submitted its first national communication on climate change to the UNFCCC in 2004. This document outlined the scale and distribution of emissions across the sectors of the economy in 1994 (SDPC, 2004). Energy and industrial processes were the largest sources of carbon dioxide emissions in China in 1994 making up 90.95% and 9.05% of total CO2 emissions, respectively. Land use change and forestry were net sinks of CO2. The large part that energy and industry play in generating emissions has not changed greatly since 1994. China remains highly dependent on coal for its energy production. In 2008 coal made up 71% of China’s total energy consumption (Figure 5.4). Oil, in second place, made up 19% of China’s total energy consumption. Figure 5.4 illustrates the increase in China’s energy use by fuel-type since 2004. The industrial sector is the biggest user of energy in China, accounting for around 70% (Figure 5.5) (Jiang et al., 2011). The largest companies consume around half of the energy used by industry.

Chapter 5: China’s Response to Climate Change
Report commissioned by the Centre for Development and Enterprise 34
Figure 5.4 China’s energy use by fuel type, 2004 – 2008. (USEIA, 2010)
Figure 5.5 China’s energy consumption by sector. (Jiang et al., 2011)
Figure 5.3 Total Energy Consumption in China by Type in 2008. (USEIA, 2010)

Chapter 5: China’s Response to Climate Change
Report commissioned by the Centre for Development and Enterprise 35
Energy Security
As outlined above, China is largely dependent on coal and oil for primary energy consumption. China’s conventional energy resources (including coal, oil, gas and hydro-energy) that are available for development technologically exceed 823 billion tons of coal equivalent - around 2.5% of global resources. The reserves that can still be developed economically represent around 139.2 billion tons of coal equivalent - around 10.1% of the world’s total (SDPC, 2004). Per person, China’s conventional energy resources are less than half of the world average and are dominated by coal, which makes up 87.4% of the total proven resources. Crude oil makes up 2.8%, natural gas 0.3% and hydro-energy 9.5% (SDPC, 2004). China’s economy has become increasingly dependent on imported energy, in particular imported oil (Figure 5.6). This increasing dependence represents one of the key drivers for action on energy efficiency and the search for fossil-fuel alternatives. China is the world’s second-largest consumer of oil behind the US, however, it does not have the oil production capacity to meet its demand domestically. China became the second-largest net importer of oil as of 2009 (EIA, 2010). This has undesirable consequences for China’s energy security, making it reliant upon a resource with an increasing and highly variable price. Furthermore this dependence makes the country’s economy vulnerable to international political events. The country therefore has a strong incentive to move away from oil use. China’s desire to lower its dependence on imported oil can be seen in its ambitious targets for electric vehicles.
Figure 5.6 China’s net energy imports since 1982 as a percentage of total energy use. Source: (WB, 2012)
Environmental Pollution
China has substantial environmental problems associated with the extremely fast growth of the economy. China’s problems with air pollution, acid rain and water pollution are well documented. These environmental problems, in particular air and water pollution, are currently a major source of morbidity and mortality in China (Zhang et al., 2010). It is estimated that poor environmental conditions cause around 2.4 million premature deaths every year. Air quality in China’s cities is among the worst in the world. Significant attention was drawn to this by the 2008 Beijing Olympics (Harper, 2009). In addition, industrial water pollution has become widespread. Half of China’s water resources have been classified as too polluted for human use. Although China’s economic growth has improved health and quality of life indicators, it has also increased the release of chemical toxins and the rate of environmental disasters (Zhang et al., 2010). In 2004 China developed a measure of overall economic output that discounted GDP by the costs of

Chapter 5: China’s Response to Climate Change
Report commissioned by the Centre for Development and Enterprise 36
environmental damage and resource consumption. The ‘green GDP’ that was produced revealed that, at a conservative estimate, environmental pollution and resource extraction cost the economy USD 64 billion (at the official 2004 exchange rate) annually. This was around 3% of GDP at the time (Remais and Zhang, 2011). Unfortunately the ‘green GDP’ measure was soon abandoned due to political pressures (Remais and Zhang, 2011).
The number of civil disobedience incidences concerned with environmental problems is increasing. The number of complaints to the environmental authorities has increased by 30% every year since 2002. In 2004 there were around 600,000 complaints registered. The number of mass protests caused by environmental issues has also grown each year by around 29% (Jun, 2007).
Economic Opportunities
China is currently extremely successful as one of the fore-runners in the green technology race. The last few years have seen China dominate in renewable energy investment. In 2009 China had the greatest aggregate investment in clean energy with an investment level of USD 34.6 billion. Its nearest competitor, the US, had an overall investment level of USD 18.6 billion. In 2010, China again attracted the most new financial investment in renewable energy reaching USD 49.8 billion (BNEF, 2011). This figure is just over a third of the total of global new investment. In 2011, the country slipped to second place in new investment with the US edging past to first place with USD 48.1 billion compared to USD 45.5 billion in China (The Pew Charitable Trust, 2012). China has made huge progress in domestic innovation and no longer merely replicates what is designed in other countries. Published patent applications increased by 26.7% between 2006 and 2010 (Thomson Reuters, 2010) – largely as a result of government incentives such as reductions in corporate tax. This has provided a good enabling environment for further innovation in green technology and development.
5.2 Action
China has come under increasing international pressure to limit its GHG emissions. In 2009, China submitted its first national mitigation target to the Copenhagen Accord following COP15. This target has now been officially registered on the developing country NAMA database. China’s pledge outlined that it would undertake to lower its CO2 emissions per unit of GDP by 40 – 45% by 2020 compared with a 2005 base level (UNFCCC, 2011a). The pledge refers to emission intensity rather than absolute emission reductions to ensure that any actions taken will not impact upon the country’s economic growth. China’s pledge also stated that it would aim to increase the share of non-fossil fuels in primary energy consumption to around 15% by 2020. It would also increase forest coverage by 40 Mha and increase forest stock volume by 1.3 billion m3 by 2020 compared with 2005 levels (UNFCCC, 2011a).
China’s emissions intensity target provokes a number of questions. Will China take its voluntary emissions target seriously and aim to meet it regardless of international action on climate change? Does the target reflect a genuine attempt on the behalf of China to mitigate its emissions? How ambitious is the target? The drivers outlined above indicate that China has significant incentive to act to both mitigate and adapt to climate change. These drivers are not primarily international pressures but are dominated by national considerations (Jotzo, 2010). China’s national policy is a good place to discover whether China will follow through on its voluntary emissions targets. Below we review China’s national policies that address climate change and the capacity that is being developed to respond to the challenge.

Chapter 5: China’s Response to Climate Change
Report commissioned by the Centre for Development and Enterprise 37
National Climate Change Policy Programme
China’s National Climate Change Policy sets out a series of strategic goals to be reached through adopting institutional, legal, economic and technological instruments. The strategic goals are:
• To make significant achievements in controlling GHG emissions • To enhance the capability of continuous adaptation to climate change • To promote climate change related science, technology and R&D to a new level • To raise public awareness on climate change • To further strengthen the institutions and mechanisms on climate change
Notably, the policy states that action on climate change will take place within the context of the implementation of its national and regional economic and social development plan (NDRC, 2007). This indicates that China recognises that adaptation to climate change and mitigation of GHG involves many aspects of the social and economic sectors. The integration of climate change policy into the central development strategy is key to ensuring meaningful action on climate change.
The policy provides for a number of adaptation responses to climate change in areas including agriculture, forestry, water management, coastal zones and monitoring. The policies range from increased monitoring to increasing forestation. Wider policies such as increasing public awareness are also being pursued. Box 9 outlines the various adaptation measures to be implemented for each of these areas. Although adaptation has received much less funding internationally than mitigation a few projects have been funded in China. These have been in line with the country’s adaptation strategy and have been split between the prevention of flooding and soil erosion and developing livestock resistance to extreme cold.
China’s National Climate Change Policy Programme outlines several areas of mitigation response to climate change:
• Restructuring the economy, promoting technology advancement and improving energy efficiency;
• Optimizing energy mix by developing low-carbon and renewable energy; • Launching national wide tree-planting and afforestation campaign and enhancing ecology
restoration and protection; • Controlling the growth rate of population through family planning; • Strengthening laws and regulations, and policies and measures relevant to addressing climate
change; Further improving institutions and mechanisms; • Attaching great importance to climate change research and capacity building; and • Strengthening education, training and public awareness on climate change.
Adapting to Climate Change in China (ACCC) As China gains experience in integrating climate change policy and adaptation into its development strategy the country is sharing its lessons internationally. ACCC was set up in 2009 as a collaboration between China, the UK and Switzerland. The ACCC works with the National Development and Reform Commission (NDRC), the institution in China responsible for the formulation of the country’s development strategy. ACCC addresses climate science advances as well as adaptation planning in three pilot provinces; Guangdong, Ningxia and Inner Mongolia. The lessons learnt from these pilot provinces are being shared in a process of South-South learning.

Chapter 5: China’s Response to Climate Change
Report commissioned by the Centre for Development and Enterprise 38
Five-Year Plans
China’s National Climate Change Policy states that it will integrate climate change policies into the national development strategy. In China, this national policy comes in the form of its Five-Year Plans (FYP) for Economic and Social Development. China’s FYPs are the strategic roadmaps for the country’s development and have been used since 1953. The FYP sets goals for economic growth, health and social services, national defence, energy use as well as the environment and emissions. The 12th FYP for the period of 2011 – 2015 was approved by the National People’s Congress and released on March 14th 2011. In the FYPs a number of the goals are mandatory and government officials and executives at state-owned companies are held responsible for meeting the targets. The FYPs are also translated in regional strategies. Action on climate change was embedded in both the 11th and 12th FYPs, however, the 12th FYP increased the number of mandatory environment-related targets. Table 5.1 outlines the key environment-related goals in the 12th and 11th FYPs while Box 10 outlines the main targets for the key sectors of transport and energy. Table 5.1 Key Environmental Goals in China’s Five-Year Plans 12th Five-Year Plan 11th Five-Year Plan Indicators Mandatory
Targets Guiding Targets
Targets Actual
Energy Intensity Reduction 16% - 20% 19.1% Carbon Intensity Reduction 17% - Not Set - Non-Fossil Fuel Energy Share 11.4% - Not Set 8.3%
Box 9: China’s Adaptation Measures Agriculture ‐ Improve agriculture infrastructure, notably increase water-saving irrigation ‐ Promote adjustment of agricultural and cropping systems ‐ Breed stress-resistant, high-yield varieties of crop and animals ‐ Prevent aggravation of grassland desertification ‐ Strengthen research and development of new technologies Forests and Other Natural Ecosystems ‐ Formulate, amend and implement laws and regulations, notably the Forest Law of the People’s
Republic of China and Law of the People’s Republic of China on the Protection of Wildlife, Law of Nature Reserve and Regulations on Wetland Protection of the People’s Republic of China.
‐ Strengthen the protection of existing forest resources and natural ecosystems ‐ Strengthen science and technology development and extension:
o Forest fire, forest insect and disease control o Cold-resistant, drought-resistant and pest and disease resistant species
Water Resources ‐ Enhance water resource management ‐ Strengthen infrastructure planning and construction ‐ Promote the development and extension of technologies for water allocation, water-saving and sea
water utilisation Coastal Zones and Coastal Regions ‐ Establish and improve relevant laws and regulation ‐ Establish integrated coastal zone management system ‐ Promote technology development and extension for protection and restoration of marine
ecosystems ‐ Accelerate construction of marine natural reserves ‐ Improve capability in marine environmental monitoring and early-warning ‐ Strengthen adaptation strategies to address sea level rise

Chapter 5: China’s Response to Climate Change
Report commissioned by the Centre for Development and Enterprise 39
Annual GDP Growth Rate - 7% 7.5% 11.2% R&D Investment as share of GDP - 2.2% 2% 1.75% Major Pollutant Reduction: Sulphur Dioxide 8% - 10% 14.29% Chemical Oxygen Demand 8% - 10% 12.45% Nitrogen Oxides 10% - Not Set - Ammonia Nitrogen 10% - Not Set - Total Forest Coverage 21.66% - 20% 20.36% Decrease in Water Consumption Per Unit of Value-Added Industrial Output
30% - - -
As can be seen from Table 5.1, the 11th FYP target of reducing the energy intensity of the economy by 20% was very nearly met with an actual energy intensity reduction of 19.10%. The 12th FYP has a mandatory energy intensity reduction target of 16%. It also goes further and includes for the first time a mandatory reduction in the carbon intensity of the economy of 17%. Another new inclusion is a mandatory target for the non-fossil fuel share in the energy mix of 11.4%. The 12th FYP has also added mandatory reduction targets for major pollutants NOx and Ammonia Nitrogen on top of those for Sulphur Dioxide and Chemical Oxygen Demand which were included in the 11th FYP. A mandatory target to increase forest coverage by 1.3% to 21.66% has also been included.
A notable target in the 12th FYP is the guiding target for GDP growth which has been set at 7%, 0.5% lower than the target for the 11th FYP. This could indicate the recognition by the Chinese government of the need to slow economic growth to balance it with environmental concerns. It must be noted, however, that although the target GDP growth level for the 11th FYP was 7.5% the actual average growth rate over this period was 11.2%. Industry analysts predict a GDP growth rate of at least 8% (Lin, 2011). Aside from the new environmental targets that have been included in the 12th FYP, it also shows a decision to change the pattern of growth in China, emphasising ‘higher quality growth’ over fast growth. The economy will be shifted to have a greater focus on the services sector and more value-added production. The 12th FYP identifies seven key sectors for development (Box 11), three of which are aligned with sustainable growth – clean energy, clean energy vehicles and energy conversation.
Box 10: Mitigation Objectives in China’s 12th FYP Transport ‐ Passenger vehicle fuel economy standards of 7 litres/100 km (33.6 miles per gallon) ‐ Fuel economy improvements of 11% for heavy-duty vehicles and 15% for light-duty commercial vehicles ‐ Vehicle pollution supervision centres in 31 provinces ‐ Expansion of the high-speed rail network from 10,000 km to 45,000 km, connecting all cities with a
population larger than 500,000 ‐ Expand bus rapid transit lines from 350 km to 3000 km, and bus-only lanes from 2,500 km to 10,000 km ‐ Increase number of people who use public transport, especially in cities Energy ‐ Expand Total Installed Capacity to at least 100 GW wind, 10 GW solar, 13 GW biomass, 290 GW hydro, including 30 GW of pump storage
‐ Build 200,000 km of transmission lines (330 kilovolts or more) and expand development of ultra-high-voltage transmission lines
‐ A cap on domestic coal production and consumption in 2015 of 3.9 billion tonnes – nearly 10% higher than 2011 levels

Chapter 5: China’s Response to Climate Change
Report commissioned by the Centre for Development and Enterprise 40
Finance
China has been one of the main recipients of climate finance. The country has hosted over 3,000 CDM projects to date (CD4CDM, 2012b). The vast majority of climate finance directed at China has supported mitigation activities, particularly wind (36%) and hydropower (40.6%). Funds are dispersed mainly through the Climate Investment Funds and the Global Environmental Facility. Many multilateral development banks deliver funds to China, most notable the World Bank Group and the Asian Development Bank. Bilateral funds come from a few dominant countries including Japan, Australia, Germany and the US (Nakhooda et al., 2011). The Climate Funds Update (CFU) estimates that USD 5.4 billion bilateral funds were directed to Asia in climate finance by 2010, this represents 68.9% of total bilateral climate finance reported in that time. The top funds recipient was China with USD 1.09 billion (Nakhooda et al., 2011).
Carbon Pricing
It was announced in 2011 that a pilot scheme for carbon emission rights trading would be launched in seven Chinese municipalities and provinces. These include Beijing, Shanghai, Tianjin, Chongqing, Hubei, Shenzhen and Guangdong. Should these pilots prove to be successful there is the intention to expand the trading scheme to a national level (Han et al., 2012). The government is also considering the adoption of an environmental tax (Lin, 2011). The use of carbon markets to reduce CO2 emissions marks a change in approach to mitigation in China. Previously, China’s mitigation targets have been met largely through regulatory policies. Economic tools have played a much smaller role (Han et al., 2012). A national carbon market in China would have big implications internationally. If implemented it would mean that two major economic blocs, China and EU, have a carbon price in place. This could generate a tipping point at which many other economies also implement a carbon price.
China faces a number of hurdles in implementing carbon markets. There is a lack of reliable emission data available at present. Furthermore, there are big differences between provinces in terms of economic structure, growth, energy consumption and carbon intensity (Han et al., 2012). In addition, although China has undergone economic reforms liberalising its economy, it is still not quite a mature free-market economy. There remains to be government intervention and control, a significant share of state-owned enterprises, a non-liberalised control system and widespread corruption. It is unclear if market-based mechanisms will work effectively in this environment (Han et al., 2012).
A number of these issues are being addressed. The Chinese government stated in October 2010 that it was building a publically available national and provincial GHG emissions database. In addition, its attitudes towards measurement, reporting and verification is becoming more positive (Han et al., 2012). To ensure the carbon markets operate effectively, the country will also need to
Box 11: Seven Strategic Investment Areas of China’s 12th Five Year Plan ‐ Clean Energy: Nuclear, wind and solar ‐ Energy Conservation ‐ Clean Energy Vehicles ‐ Biotechnology: Drugs and medical devises ‐ New Materials: Rare earths and high-end semiconductors ‐ New IT: Broadband networks, internet security infrastructure, network convergence ‐ High-End Equipment Manufacturing: Aerospace and telecom equipment

Chapter 5: China’s Response to Climate Change
Report commissioned by the Centre for Development and Enterprise 41
develop a better legal infrastructure with clearly defined emission rights, allocation systems and trading rules (Han et al., 2012).
Institutional Capacity
China has developed and strengthened a number of institutions that will be of central importance to its climate adaptation and mitigation strategy. One of the key institutions is the National Coordination Committee on Climate Change (NCCCC). The NCCCC, set up in 1998, is made up of representatives from 17 ministries and agencies. It is chaired by Mr. Zeng Peiyan, Chairman of the State Development and Planning Committee. It has done a great deal of work in the formulation and coordination of China’s climate change related policies and measures by providing guidance for central and local governments’ response to climate change (NDRC, 2007). The NCCCC was responsible for the development of China’s Initial National Communication on Climate Change which was presented to the UNFCCC in 2004. Other institutions involved in the production of China’s national GHG inventory are the Energy Research Institute (ERI) of the NDRC, the Institute of Atmospheric Physics of the Chinese Academy of Sciences, the Forest Ecology and Environment Institute of the Chinese Academy of Forestry, the Centre for Climate Impact Research, the Chinese Research Academy of Environmental Sciences and the Agrometerology Institute of Chinese Academy of Agricultural Sciences. The project steering committee was made up of members from NDRC, Ministry of Foreign Affairs, Ministry of Science and Technology, Ministry of Finance, State Environmental Protection Administration and the China Meteorological Administration.
Another key institution is the China Council for International Cooperation on the Environment and Development (CCICED). This organisation is made up of eight working groups comprised of both Chinese and international representatives. The working groups address scientific issues related to climate change. The CCICED was set up by a group of 12 leading ministries and is chaired by the leader of the Chinese State Council. The recommendations are implemented by the NDRC, one of the organisations central to development and planning in China, responsible for the production of the FYPs. It is the integration of these two organisations across ministries central to the running of China that makes them so effective.
Industry and the Private Sector
In 2011, 121 Chinese companies were listed in the Forbes’ Global 2000 companies and 25 were in the Forbes 500. China’s top 10 largest companies in 2011 with a market value of USD 1468 billion, were PetroChina (6), ICBC (7), China Construction Bank (17), Bank of China (21), Sinopec-China Petroleum (22), Agricultural Bank of China (25), China Life Insurance (68), Bank of Communications (124), China Shenhua Energy (145) and Ping An Insurance Group (147). Two of the top ten companies are within the oil and gas sector and another in the mining sector, with its major activities being associated with coal. However, the remaining seven companies are in the services sector with five banking and two insurance sector companies. This could reflect China’s move to develop its services sector. PetroChina, Sinopec-China Petroleum and China Shenhua Energy all have
Box 12: Climate-related institutions established during China’s 11th FYP
‐ The Energy Conservation Leading Committee ‐ The Climate Change Leading Committee ‐ The National Energy Commission ‐ The National Climate Change Expert Pool ‐ Local government also established similar organisations

Chapter 5: China’s Response to Climate Change
Report commissioned by the Centre for Development and Enterprise 42
environmental protection and low carbon development plans though at the same time are expanding their production of fossil fuels (PetroChina, 2011, China Shenhua Energy, 2011, Sinopec-China Petroleum, 2008).
The average energy intensity of major industrial processes in China’s industrial sector is around 15-20% higher than international best practices. Given that the industrial sector in China accounts for around 70% of the nations’ energy use, there is therefore opportunity for this sector to deliver energy and emission intensity reductions (Jiang et al., 2011). This opportunity has been recognised by the Chinese government; in 2006 the ‘Top-1000 Program’ was launched. This voluntary programme set energy saving targets for the 1,008 highest energy consuming enterprises. Overall the programme aimed to produce energy savings of 100 Mtce (Price and Xuejun, 2007). This initiative proved to be one of the key policies used to reach the 11th FYP energy intensity goal of a 20% reduction by 2010. The 12th FYP outlines the expansion of the Top-1000 Program to include smaller energy-intensive firms. Small and medium enterprises received little support under the previous program and experienced difficulty in improving their energy efficiency. The ‘Top-10,000 Program’ will mean that enterprises accounting for over 80% of industry’s energy use are enabled to employ more efficient processes and equipment (Jiang et al., 2011). The 12th FYP outlines a further two main objectives for the industry sector: firstly, to reduce water consumption per unit of industrial value-added output by 30% and secondly, to improve the implementation of mandatory energy efficiency standards for major industrial products. These are not the only initiatives and policies that are likely to affect business in China; its national carbon and emissions targets are likely to impact the way many businesses operate, forcing them to consider the sustainability of their business model. These targets have now been made mandatory rather than simple guidelines. A carbon price at a national level will introduce new risks to the private sector as a whole. It is for these reasons that businesses are increasingly putting in monitoring and reporting systems to ensure their efficiency targets are met. The build-up of this enabling environment is a key indicator that businesses are taking action on climate change within China seriously (Lin, 2011). In 2006 only 77 Chinese companies and subsidiaries of multinational companies in China released sustainability reports. In 2009 this figure had increase to 663 (Figure 5.7) (Lin, 2011).
Figure 5.7 Private sector sustainability disclosures in China from 2006-2009 (Lin, 2011)

Chapter 5: China’s Response to Climate Change
Report commissioned by the Centre for Development and Enterprise 43
Ambition Level and Potential Difficulties
A question that arises when considering China’s international pledge is its ambition level. Some observers have commented that the intensity target represents little more than business as usual (BAU) (Levi, 2009, Houser, 2010). These analyses are usually based upon reference case projections by the International Energy Agency (IEA) and the US Energy Information Administration (USEIA). Describing these projections as BAU is problematic as they assume that all the existing policies are implemented as part of BAU, for China, these include a number of ambitious policies and programmes for reducing energy use and carbon intensity (Jotzo, 2010). Without these energy efficiency and carbon intensity policies in place China’s BAU would be characterised by a much higher level of emissions. Using these policies in a BAU emissions trajectory effectively punishes countries that implement climate-friendly policies. This explains why a number of other observers have commented that significant further policy effort will be necessary to meet both the 2020 carbon intensity target and the 12th FYP emissions and energy intensity targets (Jotzo, 2010, Chandler and Wang, 2009).
From 1980 to 2002 the energy intensity of China’s economy decreased by an average of 5% each year (Figure 5.8). Again, from 2006 to 2010 there was an overall decrease of 19.1% in energy intensity. However, this marked renewed attention on the issue from the Chinese government following the increase in energy intensity from 2002 to 2005 at an average of 2% a year. This worrying trend would have necessitated huge increases in energy use to support economic growth had it continued. The energy intensity target in the 12th FYP of a 16% reduction has left some disappointed on the grounds that they believe the target will be insufficient to generate the pressure for provinces and industries to act (Greenpeace, 2011).
Figure 5.8 The energy intensity of China’s economy from 1980 to 2010. Source: (Jiang et al., 2011)
China faces significant challenges in meeting both its FYP target and the UNFCCC pledge for
2020 (Jotzo, 2010). Firstly, given the rapid pace of industrialisation and economic growth, the total energy consumption is necessarily increasing. With an increasing total energy demand, it will be hard for renewable and low-carbon energy sources to increase their share. Secondly, much of the ‘low-

Chapter 5: China’s Response to Climate Change
Report commissioned by the Centre for Development and Enterprise 44
hanging fruit’ in energy efficiency have already been picked. The marginal costs of energy conservation and carbon reduction will therefore be increasingly higher. A third barrier to the implementation of the targets is that many local and provincial governments still view economic growth as the most important goal. This can result in perverse decision-making at this level with respect to energy and carbon intensity targets. On this point though, local and provincial decision-makers are increasingly being judged on whether or not they meet environmental targets. Their ability to do so is increasingly affecting their own political careers (Jiang et al., 2011). Finally, China has already experienced difficulty in reaching its 20% energy efficiency reduction target of the 11th FYP, resorting to measures such as the closure of industrial plants and the rationing of electricity supply (Jotzo, 2010, Fielding, 2010).
Figure 5.9 compares the CO2 emissions trajectory for China with full NAMA implementation to the BAU CO2 and CO2e emission trajectories as well as the emission reductions as recommended by science. This figure highlights the ambition of China’s submission to the Copenhagen Accord. Although it should be noted that China’s NAMA only affects CO2 emissions, it still appears to put China’s emissions below those recommended by science in 2020. The two trajectories are, however, not directly comparable. Looking forward to 2050, in order to limit temperature rise to below 2 °C above pre‐industrial levels, global CO2e emissions will need to have fallen to around 2.1 tonnes CO2e per capita. Given China’s expected population in 2050, this equates to a total emission level of around 3 GtCO2e per annum. The dashed line in figure 5.9 depicts one trajectory to this level of emissions, however, the real trajectory would be decided by a political decision based upon equity, economic, technological and scientific considerations. The end goal does highlight the scale of the challenge ahead.
Figure 5.9 China’s CO2 and CO2e emission trajectories for BAU, NAMA implementation and as recommended by science, 2010 – 2050. China’s ‘BAU Emissions Trajectory for all GHGs’ is based on Moltmann et al.

Chapter 5: China’s Response to Climate Change
Report commissioned by the Centre for Development and Enterprise 45
(2011), and its ‘BAU Trajectory for carbon dioxide emissions only’ is based on China’s Energy and Carbon Emissions Outlook to 2050 (Zhou et al., 2011). China’s voluntary pledge submitted to the UNFCCC refers exclusively to lowering carbon dioxide emissions per unit of GDP by 40-45% by 2020 compared to the 2005 level. The estimate of this pledged reduction relative to BAU is based on the Jotzo’s (2010) central scenario. The ‘Required by Science’ scenario is based on IPCC’s conjecture that non-Annex 1 countries should reduce emissions 15-30% below a BAU baseline by 2020, the UK Energy and Climate Change Select Committee’s estimate that in a world of 9.2 billion people in 2050 emissions caps should converge at 2.1 to 2.6 tonnes CO2e per capita to limit the chance of global warming surpassing 2 °C, and the US Census Bureau’s (USG, 2012) prediction that China’s population will equal 1,303,723,000 in mid-2050. The line is dashed because it is a cap on global emissions that is required by science. The level of individual countries’ emissions will need to be a political decision made by the Conference of the Parties, and based on equity, as well as economic and technological realities.
5.3 UNFCCC Negotiations
China has become increasingly active in the international climate change negotiations since their inception 20 years ago. The country’s rapid rise to be one of the major global powers and its place as biggest GHG emitter in the world have meant that it must take a lead role in the negotiations. China is allied with the other large developing economies in pushing for developed country leadership on climate change mitigation. The country’s position has evolved over time with the negotiations. Initially, China’s involvement in the negotiations was limited; it viewed climate change and its mitigation as something that developed countries were responsible for and should therefore solve. This viewpoint has changed subtly over time. The central view that developed countries should lead action remains. China views its own priority as being development and poverty alleviation. In the country’s submission on the work plan of the Ad Hoc Working Group on Durban Platform for Enhanced Action (AWG-DPEA) developed country responsibility, the importance of equity and the principle of CBDRRC, and developing country social and economic development priorities were central themes (China, 2012). As such some of the key objectives that China is pushing for at the negotiations are technology transfer and climate finance. The submission on the work plan stressed that the platform should be a comprehensive process, covering mitigation, adaptation, finance, technology and capacity building including issues related to equity, trade and technology-related IPRs in a balanced and coordinated manner (China, 2012). The submission states that ‘developing countries will, in the context of sustainable development, take enhanced mitigation and adaptation actions supported and enabled by the provision of finance and technology transfer by developed countries’. However, in recent years it has become clear that China is very vulnerable to climate change impacts and, as outlined above, China is clearly taking steps domestically to mitigate and adapt to climate change. Public statements from premier Wen Jaibao indicate that ‘China gives top priority to meeting the challenge of climate change’ (China Daily, 2009).
China’s position in the international negotiations remains more complex. The involvement of China in the international climate change negotiation must be understood in the context of wider global politics. Climate politics is only one aspect of fundamental international political problems. Central to this is the duality that exists within the Chinese government in respect to its attitude towards the US and the West. The attitudes of those within the Chinese government are not homogenous and generally there exist two strands of thought that dominate. The first strand can be described as the ‘peaceful rise’ stance. The second strand of thought held by the People’s Liberation Army, among other, represents a stance that is much more sceptical of the West and what China can expect from it. This strand holds that a ‘peaceful rise’ may not be possible.
On the international climate negotiations stage China’s main economic rival, the US, is reducing its credibility through a lack of action. Though China, in general, is usually reluctant to take a lead role on the international stage it may respond by itself stepping into a leadership role. It is

Chapter 5: China’s Response to Climate Change
Report commissioned by the Centre for Development and Enterprise 46
very difficult to predict the future role of China in the negotiations. A great deal depends upon the interactions of the two strands of thinking within the Chinese government. The end of this year will see the once-in-a-decade leadership transition of the country’s top leaders, including Premier Wen Jiabao and President Hu Jintao. The position of the next generation of leaders will be of great importance to the future position of China in the international climate change negotiations. Li Keqiang has been identified as the probable successor to Premier Wen Jiabao. Earlier this year at the Fifth Session of the 11th National People’s Congress he stated “providing basic environmental quality for its people is an essential public service for any government. It is necessary to improve the quality of life and provide a favourable environment with clear water, blue skies and uncontaminated soil.” This indicates a positive position on climate change. However, it is unlikely that, as imminent successor to the Premier, he would make any statements that go against China’s current environmental policy.
5.4 Conclusion
On the international stage, China’s stance on action on climate change is in line with that of developing countries and the BASIC group; developed countries should take the lead on mitigating emissions and support developing countries in their adaptation and mitigation measures, developing countries must focus on lifting their populations from poverty. However, as China is, since 2007, the world’s biggest emitter it has come under increasing pressure to reduce its emissions. In 2009 China announced for the first time a mitigation target in the international climate negotiations; to reduce the emissions intensity of its economy by 40–45% below 2005 levels by 2020. This is a significant and ambitious commitment.
China appears to be serious in meeting this commitment. Climate change action has been embedded in China’s national strategic development policy, the Five-Year Plan. The FYP for the period of 2011 – 2015 includes a number of environment-related goals, including a carbon intensity goal that will put China on the path to meeting its UNFCCC submission. The 12th FYP also includes an energy intensity reduction target plus reduction targets for pollutants, and a target for non-fossil fuel share of the energy mix. Three of seven strategic investment areas are aligned with sustainable growth – clean energy, clean energy vehicles and energy conservation. The annual GDP growth target has also been revised downwards, in line with China’s stated ambition to generate higher quality growth rather than fast growth. China has also announced a pilot scheme for carbon emission rights trading to be launched in seven Chinese municipalities and provinces. If successful the trading system could be expanded to a national level. There are a number of hurdles facing China in the implementation of carbon trading systems. Progress will need to be made in ensuring reliability of emissions data and strengthening the legal structure needed to deal effectively with defining emission rights, allocation systems and trading rules. Industry is one of the biggest users of energy in China and has an average energy intensity around 15-20% higher than international best practice. China has implemented programmes directly addressing this opportunity for efficiency improvements. The country is building its institutional, technical and societal capacity to deal with climate change. Two notable institutions that have been established to deal with climate change are the CCICED and the NCCCC. Both are formed by a number of different ministries and report back to a high level representative involved in central policy making. The CCICED utilises international and national leading scientific research to identify and address scientific issues related to climate change.
China has significant internal drivers for action on climate change. China appears to have recognised both the risk that climate change poses to its future prosperity and the opportunities in growing climate-friendly sectors. Improvements in sustainability in China have largely been masked

Chapter 5: China’s Response to Climate Change
Report commissioned by the Centre for Development and Enterprise 47
by the rapid rate at which the economy has grown in the past three decades. In the future China may have to increase its ambition if it wants to effectively mitigate and adapt to climate change. Much of the ‘low hanging fruit’ in emissions intensity reductions have already been utilised. In addition, there is divergence between national policy and that implemented at a regional level where the focus remains on high economic growth.
The likely route that China will take at an international and national level is difficult to predict due to the duality of opinions within the Chinese government. In addition, imminent leadership changes within the regime could create unforeseeable alterations to their stance.

Chapter 6: Brazil’s Response to Climate Change
Report commissioned by the Centre for Development and Enterprise 48
6. Brazil’s Response to Climate Change
Brazil has a leading role to play in global efforts to mitigate climate change due to its emissions from LULUCF. McKinsey (2009a) estimates that Brazil is one of the top five countries in potential to reduce emissions, primarily due to emission reduction potential in the forestry sector. However, Brazil has also been a world leader in low carbon agriculture and renewable energies, including hydropower and biofuels. The key events in Brazil’s climate policies and actions are listed in Box 13 below.
Box 13. Brazil’s Timeline of Action
1975 National Alcohol Programme mandates that gasoline be blended with ethanol 1985 National Energy Conservation Programme 1991 National Programme for Energy Efficient Use of Petroleum and Natural Gas
Derivatives Jun 1992 Signed the UNFCCC Feb 1994 Ratified the UNFCCC May 1994 UNFCCC Entered into Force 1996 National Programme for Energy Development of States and Municipalities (PRODEEM) April 1998 Signed the Kyoto Protocol 1999 Interministerial Commission on Climate Change (CIMGC) 1999 National Rural Electrification Programme 2000 Brazilian Climate Change Forum 2000 Integrating Environmental Strategies – Research Programme Aug 2002 Ratified the Kyoto Protocol 2002 Renewable Energy & Energy Efficiency Partnership (REEEP) 2002 Programme of Incentives for Alternative Electricity Sources 2003 Luz para Todos (Light for All) electrification programme 2004 Brazil National Climate Change Plan 2004 First National Communication to the UNFCCC Feb 2005 Kyoto Protocol Entered into Force 2007 India-Brazil-South Africa Declaration on Clean Energy 2008 Mandatory Biodiesel Requirement 2008 CONPET – National labelling programme for stoves and heaters 2008 Amazon Fund 2009 Energy Expansion Plan 2010-2010 Dec 2009 National Climate Change Policy Law and the National Climate Change Fund (FNMC) Jan 2010 Submitted Nationally Appropriate Mitigation Actions to UNFCCC 2010 Second National Communication to the UNFCCC Dec 2010 Federal Decree no 7390 regulating the articles of the National Climate Change Policy Law

Chapter 6: Brazil’s Response to Climate Change
Report commissioned by the Centre for Development and Enterprise 49
6.1 Drivers for Action
Climate Change Impacts
Brazil’s climate varies a great deal across its vast territory (Figure 5.1). Historically, the Amazon has experienced droughts and associated wildfires linked to El Niño, the prolonged warming of at least 0.5°C in the surface temperatures of the east-central tropical Pacific Ocean. This anomaly occurs irregularly, at intervals of 3 to 7 years, and lasts between nine months and two years (NOAA, 2005). More recently, droughts have occurred in years not associated with El Niño. Droughts and floods can have significant economic impacts. In 2004/5 low rainfall resulted in record low river levels which isolated communities and disrupted fishing, freight, transport, and tourism. Ensuing forest fires produced extensive smoke that closed airports, school and business and negatively impacted human health. For Acre State, in the far west of Brazil, the fires alone cost an estimated USD 87 million, about 10% of the State’s GDP. Flooding displaced 376,000 people, killed 44, washed out bridges, roads, crops, and homes, and cost the government USD 435 million in aid. They were attributed to the simultaneous occurrence of two climate phenomena: La Niña, the cooling of the surface of the tropical east Pacific Ocean; and atypically warm surface waters of the tropical Atlantic. (Marengo, 2009).
The climate in central Brazil is heavily influenced by ocean temperatures in the tropical Pacific and South Atlantic. El Niño events can triple the discharge of both the Paraná and Uruguay rivers, and present a risk of flooding year round. In contrast, droughts can severely reduce Brazil’s capacity to generate hydroelectricity. In 2001, rainfall deficits reaching up to 40% in most of central, north-eastern and south-eastern Brazil led to an energy crisis, forcing the government to impose energy conservation measures to avoid total blackout (Marengo, 2009, Marengo et al., 2011).
The southeast coast of Brazil was considered ‘hurricane free’, until the landfall of the first documented hurricane, Catarina, in March 2004 (Pezza et al., 2009). It left nine dead and cost the Brazilian economy an estimated USD 1 billion (Marengo, 2009). Pezza et al. (2009) argue that it is reasonable to expect that climate change may further increase the potential for hurricanes to develop in these latitudes due to the widening of the tropical belt. In 2009 southern Brazil experienced the driest year in 80 years. In Rio Grande do Sul State, the drought killed crops of soybeans, maize, and beans, prevented feeder crops from being planted, and reduced milk production. Ninety-six municipalities declared a state of emergency. As a result, Marengo (2009) forecast a 30% reduction in exports for 2009, equating to USD 8-9 billion.
Marengo et al. (2011) modelled the impact of climate change in Brazil for years 2011-2100. The high GHG scenario projects an annual mean temperature increase of 3-5.5°C by 2100, with greatest warming in the Amazon and Paraná River basins. Annual rainfall is expected to decrease across Brazil. The most severe reductions are expected to occur in the Amazon (mean annual change of -1 mm/day, varying between -0.7 and -1.2 mm/day) and the São Francisco (-1 mm/day, varying between -0.5 and -1.5 mm/day) regions, leading to an increase in the risk of drought. Annual rainfall in the Paraná -La Plata basin is projected to remain more stable (-0.2 mm/day, varying
Figure 6.1 Map of Brazil

Chapter 6: Brazil’s Response to Climate Change
Report commissioned by the Centre for Development and Enterprise 50
between +0.5 and-0.5 mm/day), however the frequency and intensity of extreme rainfall events in southern Brazil is projected to increase.
These projections are particular concerning in light of the potential positive feedback loop induced by global warming, which could lead to an effective reversal of the carbon cycle in the Amazon Rainforest. Using a global climate-carbon cycle model, Cox et al. (2000) simulated that a 3°C warming of global temperatures was associated with a dieback of the forest due to changes in precipitation. Instead of absorbing CO2, the vegetation and soil would release it in large quantities leading to an acceleration of global warming.
The climate change projections are also concerning in regards to the potential impact on agriculture, which represents 30% of Brazil’s GDP. Pinto (2009) modelled the potential impacts of future temperatures on the growing areas of the nine cultivated plants collectively responsible for 85% of Brazil’s agribusiness: cotton, rice, coffee, sugarcane, beans, sunflowers, cassava, corn and soybeans. The results are presented in Table 6.1. By 2020, only the potential cultivation area for sugarcane would increase while it would decrease for all other analysed crops, with soybeans experiencing the worst decrease at 24%. Despite these potential impacts, a 2009 US cable leaked through Wikileaks states, “The Government of Brazil (GoB) does not consider climate change an immediate threat to Brazil, and is not willing to sacrifice other priorities to address the problem” (USG, 2009).
Table 6.1 Variation of the potential planting areas for Brazil’s major crops in present conditions (2007/2008), and in 2020, 2050, 2070 (Pinto, 2009)
Greenhouse Gas Emissions
Brazil’s First and Second National Communications, submitted to the UNFCCC in 2004 and 2010, outlined Brazil’s historical emissions. These and projections of Brazil’s future emissions are outlined in Table 6.2. In 2005, Brazil produced an estimated total of 2,193 MtCO2e of GHG emissions.5
5 The document takes issue with the use of the conventional measurement CO2e, because it tends to exaggerate the importance of methane (CH4) emission reduction and shift the focus away from CO2 emissions. The UNFCCC assigns a 100-year global warming potential to CH4 of 21, which means that methane will trap 21 times more heat in the atmosphere over 100 years than an equivalent mass of CO2.

Chapter 6: Brazil’s Response to Climate Change
Report commissioned by the Centre for Development and Enterprise 51
Table 6.2 Brazil’s GHG emissions 1990-2005 and Emission Scenarios to 2020 (all figures are in millions of tonnes of CO2e)
Sector 19906
19943 20003 20057 Preliminary 2020 BAU Scenario3
Inventory 2020 BAU Scenario8
Nationally Appropriate Mitigation Action9 Estimated reduction against Preliminary 2020 BAU rate
Land use Change 746 790 1,247 1,329 1084 1,404 669 Reduction in Amazon deforestation 564 Reduction in savannah deforestation 104 Agriculture / Husbandry 347 378 401 416 627 730 133-166 Restoration of degraded pastures 83-104 Expansion of integrated crop-livestock-forest 18 to 22 Expansion no-till farming practice 16 to 20 Replacement of N2 fertiliser with biological N2 fixation 16 to 20 Energy 215 256 328 329 901 868 165-207 Energy efficiency 12 to 15 Increase the use of biofuels 48 to 60 Increase hydroelectric energy supply 79 to 99 Increase in small hydro, biomass, and wind 26-33 Industrial Processes / Waste
55 61 76 119 92 234 8-10
Iron and steel (replace charcoal from deforestation with charcoal from planted forests)
8-10
Total 1362 1485 2052 2,193 2,703 3,236 975-1,052 (36.1-38.9%)
6 ROVERE, E. 2011. Mitigation Action in Developing Countries: Country Study for Brazil. Rio de Janeiro: MAPS. 7 MCT 2010. Brazilian Inventory of Anthropogenic Emissions by Sources and Removals by Sinks of Greenhouse Gases not Controlled by the Montreal Protocol. Brasília: Ministry of Science and Technology. 8 GOB 2010. Decree No. 7390, of December 2010. Brasília: Presidency of the Republic of Brazil. 9 UNFCCC. 2010. Letter from the Embassy of the Federative Republic of Brazil including nationally appropriate mitigation actions [Online]. Berlin: United Nations Framework Convention on Climate Change. Available: http://unfccc.int/files/meetings/cop_15/copenhagen_accord/application/pdf/brazilcphaccord_app2.pdf [Accessed 15 March 2012].

Chapter 6: Brazil’s Response to Climate Change
Report commissioned by the Centre for Development and Enterprise 52
As seen in Figure 6.2, the largest source of GHGs, contributing about 61% of its emissions, is land use change from deforestation. In Brazil, deforestation is driven primarily by encroachment of agricultural frontiers onto the Amazon rainforest. Agriculture and animal husbandry represent Brazil’s second largest source of emissions at 19%. Brazil is the second largest soybean producer in the world, after the US, and has the second most head of cattle in the world, after India. Cattle produce significant quantities of methane through the process of enteric fermentation in their digestive tracts.
Figure 6.2 Brazil’s GHG emissions inventory in 2005 measured in CO2e (MCT, 2010)
Unlike other large economies, Brazil’s energy sector is only its third largest source of GHG emissions at 15%. This is primarily due renewable sources, particularly hydropower and renewable biomass, which, as illustrated in Figure 6.3, contribute 45.4% of its energy supply. None-renewable sources of energy contribute 54.6% of total energy production(Reis, 2012).
Figure 6.3 Total energy production in Brazil, 2010, measured in million tonnes of oil equivalency units (Mtoe) (Reis, 2012)
Due to a booming oil & gas sector and increasing consumption of fossil fuels, driven by economic growth, urbanisation and road transport, Brazil’s energy sector is projected to experience the most growth in emissions of any sector by 2020.
Brazil’s industrial sector (cement, steel, chemicals, oil & gas, etc) contributes a relatively small share of the national emissions. This is largely a result of two factors. First, due to the type of

Chapter 6: Brazil’s Response to Climate Change
Report commissioned by the Centre for Development and Enterprise 53
crude oil and environmental measure implemented by the GoB, Brazil’s domestic crude oil production produces only 18 kgCO2e per barrel compared with up to 70kgCO2e per barrel in other countries. Second, Brazil’s steel industry produces about 35% of its pig iron from charcoal rather than coke, which when sourced from sustainably managed sources is environmentally benign.
Energy Security
Energy security has been the primary driver behind Brazil’s hydropower and biofuels industry. After the first global energy crisis in 1973, Brazil mandated that automobile gasoline be blended with ethanol, which is produced domestically from sugar cane. Since then, Brazil has emerged with one of the most advanced biofuels market in the world. Brazil currently produces more oil than it consumes (Figure 3.1) and therefore does not face the same challenges as the other BASIC countries.
Economic Opportunities
McKinsey & Co (2009b) estimated the potential for Brazil to reduce emissions against a BAU trend using technical measures. Each technical emission abatement measure is represented by a bar in Figure 6.4. The height of the bar shows the cost of avoiding one tonne of emissions (in Euros) from a societal point of view, and the width shows the potential quantity that the initiative could negate (in GtCO2) per year. McKinsey found that the costs for Brazil to reduce its projected emissions are relatively low: “Whereas the world average for 2030 is around €18 per tCO2e abated for initiatives with a positive cost, in Brazil the average cost of such alternatives is €9 per tCO2e.” Brazil’s largest technical emission abatement opportunities exist in its forestry sector (72%), followed by its agriculture (14%), industrial (7%) and energy (4%) sectors, respectively.
Figure 6.4 Brazilian GHG Marginal Abatement Cost Curve to 2030 (McKinsey, 2009a)
Those measures on the left of the figure that are below the horizontal axis represent economic opportunities because they are cheaper than the BAU trend. Of particular note are waste recycling, no-till agriculture, and the biofuels industry. Though it is already the largest exporter of
Chapter 6: Brazil’s Response to Climate Change
Report commissioned by the Centre for Development and Enterprise 54
ethanol in the world, the economic opportunity of Brazil’s biofuels industry would be compounded were it to increase its export market. Efforts are currently impeded by the United States, potentially the largest export market, which applies a tariff of $0.54 per gallon of Brazilian ethanol in order to encourage domestic production. However, the US Environmental Protection Agency’s 2010 Renewable Fuel Standard labelled Brazilian ethanol as an advanced biofuel, giving hope that the tariff will be lifted.
International financial support represents a further economic opportunity for Brazil, and can increase the viability of those measures that are not yet cost-effective, such as reducing deforestation. Brazil has already received substantial international support for REDD+. Norway granted USD 170 million to the Amazon Fund in 2011 and has pledged up to USD 1 billion for the period up until 2015. While reforestation and afforestation projects are eligible for the CDM, REDD+ projects are not. Were a scheme to credit REDD+ projects incorporated into the UNFCCC, it could represent a large financial opportunity for combating deforestation in Brazil.
Natural Resource Management
The Brazilian Amazon is one of the most biologically diverse parts the world and is home to numerous indigenous peoples, some of whom are the most isolated in the world. Deforestation of the Amazon threatens countless species with extinction and these indigenous communities way of life. Not only is deforestation of the Amazon one of the greatest sources of GHG emissions, it could have severe long-term socioeconomic consequences for Brazil resulting from water pollution, desertification, flash flooding, nutrient leaching, erosion, etc. International political pressure and pressure from civil society have been major drivers behind efforts to curb deforestation. NGOs focused on human rights, biodiversity, forestry conservation, and REDD+ have been active in project implementation and research, and have had political influence at the highest levels. For example, pressure from environmental NGOs over a lack of civil society representation in the Interministerial Commission on Climate Change (CIMGC), led then President Fernando Henrique Cardoso to establish the Brazilian Climate Change Forum (FBMC). Brazilian NGOs are organised under an umbrella organisation called the Brazilian Forum of Social Movements and NGOs (FBMSONG), which was established prior to the1992 United Nations Conference on Environment and Development, held in Rio de Janeiro.
6.2 Action Taken
In the 1992 United Nations Conference on Environment and Development, hosted in Rio de Janeiro, the Ministry of Environment (MMA) was responsible for Brazil’s negotiations pertaining to the Biodiversity Convention, while the Ministry of Science and Technology (MCT) focused on those to establish the UNFCCC. Through the 1990s, MCT continued its role as the central body responsible for fulfilling the commitments to the UNFCCC, which consisted mainly of preparing the National Communications, and MMA played only an indirect role through its efforts to combat deforestation. After signing the Kyoto Protocol in 1998, the GoB created the CIMGC, a technical body composed of representatives from different government departments, with those from MCT and MMA serving as Executive Secretariat and Vice President respectively. To this day, CIMGC coordinates climate change-related initiatives across the government and acts as the Designated National Authority (DNA) to the CDM. The Ministries of Foreign Affairs; Agriculture; Transport; Mines and Energy; Planning, Budget and Management; Industry, Trade and Development; Cities; and Economy; and the Civil House of the Presidency of the Republic are also represented on the Interministerial Commission (Rovere, 2011).
Chapter 6: Brazil’s Response to Climate Change
Report commissioned by the Centre for Development and Enterprise 55
Other key government institutions include the Ministry of Foreign Affairs (MRE), which leads Brazilian delegations in the COP and other international negotiations related to climate change; the Ministry of Mines and Energy (MME), which is responsible for Brazil’s energy policy and implementing initiatives relating to renewable energy and energy efficiency; and the National Economic and Social Development Bank (BNDES), which manages the USD 1 billion Amazon Fund for REDD+ and the USD 142 million FNMC (Rovere, 2011).
In 2000, the GoB launched FBMC to expand participation in the debate on climate change and build national consensus on action and pledges. The Forum is chaired by the President, and comprises the eleven ministers of the ministries belonging to CIMGC, the 27 governors of Brazil’s states, the 27 mayors of the states’ capital cities, and several representatives of the business sector, the scientific community, and environmental NGOs (Rovere, 2011).
To improve domestic climate science, MMA established a Brazilian Panel on Climate Change (PBMC) in 2010, which will bring together approximately 200 scientists to produce a Brazilian Climate Change Assessment Report in time for the Rio+20 conference in June 2012 (Rovere, 2011).
Adaptation
The GoB’s strategy to mitigate and adapt to climate change is elaborated in the 2008 National Plan on Climate Change (PNMC). Its adaptation goals can be summarised as Box 14 below.
Brazil has also taken a number of adaptation initiatives that are not mentioned in the PNMC. Since 1995, the GoB has developed a climatic risk zoning programme, which produces municipal maps that demonstrate the appropriate cultivation area for major crops, as well as the potential future shifts in these areas due to increases in temperature. Not only does this programme indicate to farmers “what to plant, where to plant and when to plant,” but the National Monetary Council (CMN) has mandated that only farmers from municipalities that opt to grow crops deemed appropriate for their area are eligible for rural credit and insurance (Pinto, 2009). Brazilian institutions have been actively investing in genetically enhancing crops to improve tolerance against dry spells and temperatures. For instance, Embrapa Soja and the Agronomy Institute of Parana have created varieties of soybean tolerant to dry spells and heat, and the company Empresa de Pesquisa Agropecuária e de Extesnão Rural de Santa Catarina has made advances in more temperature resilient climate fruits (Pinto, 2009). The Brazilian National Institute for Space Research (INPE) has developed a state-of-the-art forest fire early warning system using real-time satellite imagery (http://sigma.cptec.inpe.br/queimadas/). Finally, to mitigate the vulnerability faced by its energy sector due to an overreliance on hydroelectricity, Brazil’s expansion of power generation through alternative energy can be interpreted as adaptation, as well as mitigation (Lucena et al., 2009).
Box 14. Brazil’s National Plan on Climate Change Adaptation Goals (2008)
• Strengthen the network of climate change-related research centres and promote research on the impacts of climate change, vulnerabilities and adaptation measures, and public policy
• Improve modelling of regional climate change scenarios and hydro-climatic systems for large river basins
• Establish an early warning system for droughts and desertification • Prepare for public health emergencies: incentivise research and training related to the impact
of climate change on human health, increase technical capacity of public health workers, establish early warning systems, and develop prevention, preparation and response plans.

Chapter 6: Brazil’s Response to Climate Change
Report commissioned by the Centre for Development and Enterprise 56
Mitigation Brazil’s NAMA submitted to the UNFCCC in 2010, declared an emission reduction target of
36.1-38.9% against projected emissions. Based on the preliminary projections outlined in Table 6.2 above, the NAMA stated that this would constitute a reduction of 975-1,052 tCO2e per annum against BAU. With the release of the Second National Communication later that year it was revealed that to adhere to the 36.1-38.9% target, Brazil will need to abate 1,168-1,259 MtCO2e per annum by 2020. Although this target is voluntary, the government incorporated it into national law with the Federal Decree No. 7360. The Decree left more flexibility than the NAMA by not setting specific emission reduction targets for each source of emissions, but did list a number of mitigation actions, shown in Box 15. Mitigation measures in Brazil’s largest emitting sectors – forestry, agriculture, and energy – are discussed in more detail below.
As seen in Figure 6.5, with Brazil’s voluntary pledge to the UNFCCC, emissions are projected to decline significantly to 2020 due to gains from avoided deforestation. However, they are projected to increase post-2020 as the economy begins to rely more on carbon-intensive energy (Rovere and Raubenheimer, 2011).
Box 15. Brazil’s Mitigation Targets
I. An 80% reduction in the annual rates of deforestation in the Amazon compared to the average between the years 1996 to 2005
II. A 40% reduction in the annual rates of deforestation in the Cerrado (savannah) biome in relation to the average between 1999 and 2008
III. An increase in the supply of energy from hydropower and alternative renewable sources, particularly wind farms, small hydropower, bio-electricity, and biofuels; and an increase in energy efficiency
IV. Recovery of 15 million hectares of degraded pastures V. An expansion of integrated crop-livestock-forest of 4 million hectares VI. Expansion of the practice of no-till agriculture of 8 million acres VII. An increase in the practice of biological nitrogen fixation in 5.5 million hectares of farmland,
in replacement of nitrogen fertiliser VIII. Expansion of plantation forests of 3 million hectares IX. An increase in the use of technologies to treat 4.4 million cubic meters animal manure X. An increase in the use of charcoal sourced from planted forests in steel production, and
improvements to the carbonisation process.

Chapter 6: Brazil’s Response to Climate Change
Report commissioned by the Centre for Development and Enterprise 57
Figure 6.5 Brazil’s GHG Emissions, 2005 – 2050. Brazil’s ‘BAU Emissions Trajectory’ and ‘Voluntary Pledge’ are based on its Second National Communication to the UNFCCC (MCT, 2010). The lines depicting projected emissions from forestry and energy are based on Rovere and Raubenheimer (2011). The ‘Required by Science’ scenario is based on IPCC’s conjecture that non-Annex 1 countries should reduce emissions 15-30% below a BAU baseline by 2020, the UK Energy and Climate Change Select Committee’s estimate that in a world of 9.2 billion people in 2050 emissions caps should converge at 2.1 to 2.6 tonnes CO2e per capita to limit the chance of global warming surpassing 2 °C, and the US Census Bureau’s (USG, 2012) prediction that Brazil’s population will equal 260,692,000 in mid-2050. The line is dashed because it is a cap on global emissions that is required by science. The level of individual countries’ emissions will need to be a political decision made by the Conference of the Parties, and based on equity, as well as economic and technological realities.
Forests
Brazil has ambitious targets to reduce deforestation over the next decade. As seen in Figure 6.6, the Action Plan for the Prevention and Control of Deforestation in the Legal Amazon Region (PPCDAM) already achieved a 59% reduction in annual deforestation between 2004 and 2007. By 2020, Brazil aims to achieve a further 80% reduction in the annual deforestation rates of the Amazon against 1996-2005 baseline. It aims to develop plans similar to the PPCDAM for other biomes, and achieve a 40% reduction in the savannah deforestation. Moreover, Brazil aims to eliminate net loss of forest cover by doubling the area of forest plantation to 11 Mha by 2020.

Chapter 6: Brazil’s Response to Climate Change
Report commissioned by the Centre for Development and Enterprise 58
Figure 6.6 Trends in deforestation in the Amazon (GoB, 2008)
The PNMC lays out a number of initiatives that Brazil is implementing to combat deforestation. It is completing a National Public Forests Registry that will identify the forests to be protected, preserved and managed. It will eliminate illegal deforestation in these areas by increasing and strengthening the technical team responsible for enforcement, continuing satellite monitoring programmes, and preventing the use of illegal lumber in the construction industry.
Strengthening the institutions to combat illegal deforestation is only half the battle. Brazil will also attempt to alter the socio-economic forces driving the destruction of forests by creating value in standing forests, forest plantations, and sustainably harvested forests. It has set a minimum price for seven non-timber forest products to promote the exploitation of standing forests by traditional communities. By 2009, it had stipulated the concession of 4Mha of forest to private actors for sustainable exploitation of legal timber and other products, such as charcoal used in steel production instead of coke. In 2006, Brazil also instated a moratorium on soybean plantations, the expansion of which were a driving force for much deforestation.
Another potential opportunity to create value in standing forests are payments-for-ecosystem services projects. One example is the Juma Project, a joint initiative of the government of the state of Amazonas and the Sustainable Amazon Foundation. The Juma Sustainable Development Reserve is a legally protected forest area of 589,612ha. The project remunerates the 339 families living in the area roughly USD 28 per month for conserving the forest, a cost which is voluntarily covered by the Marriot International hotel chain. The project estimates that it will avoid the degradation of 366,000ha of rainforest and 211MtCO2 by 2050.
Despite Brazil’s progress in reducing deforestation rates, deforestation is still occurring at the alarming rate of over 6000 km2 per year. Recently, a controversial bill that would amend the 1965 Forest Law passed through Congress that would have significantly reduced the amount of protected areas in the Amazon and granted amnesty to those who had illegally cleared land prior to 2008. The bill had strong support from the ruralista lobby, made up of farmers whose economic interests lay in expanding the agricultural frontier. . Under significant domestic and international pressure, President Rousseff vetoed 12 of the most controversial clauses of the bill, and amended numerous others. Selected provisions are listed in Table 6.3.

Chapter 6: Brazil’s Response to Climate Change
Report commissioned by the Centre for Development and Enterprise 59
Table 6.3 Brazil’s Forest Code, Selected Provisions (Economist, 2012)
Current law As approved by Congress As promulgated by the President
Specially protected areas
• Riverbanks protected to 30-500 metres depending on the river’s width
• Other biodiverse or erosion-prone areas also protected
• Most special protections reduced; some removed entirely
• Riverbanks still protected, but in narrower strips: 5-100 metres
• Mangrove swamps protected, but activities such as shrimp farming allowed around their edges
Compulsory forest reserve
• Amazon: 80% • Cerrado (savannah): 35% • Everywhere else: 20% • Specially protected areas
cannot count towards the total percentage
• Specially protected areas count towards the total
• Amazonian states with little overall deforestation can cut the reserve to 50%
• Smallholders exempt from reforesting areas cleared before June 2008
• Specially protected areas count towards the total
• Small farmers who deforested illegally, in whatever region, need only reforest 20% of their land
• Others must comply in full
Amnesty na • All penalties from before June 2008 written off
• No new penalties for farmers who sign up for a vague and leisurely compliance process
• Only small farmers have any exemption from reforestation
• Everyone else can escape fines only by complying
Environmental Registry
na • Landowners must register their properties, but infractions largely penalty-free
• Landowners must register and comply with the code within five years or face fines and denial of bank loans
Among the clauses that the President amended were those that would grant a blanket amnesty to those who committed illegal deforestation prior to 2008 from billions of dollars owed in fines; decrease the buffer zone of protected forest areas near rivers; reduce the amount of deforested land that farmers are required to replant; and reduce the amount of land that Amazon landholders must maintain as forest reserves. She also vetoed a controversial clause that would have transferred more decision-making power over forest management to the states, which are traditionally more supportive of the ruralistas (Goldemberg, 2012). The President did not veto the clause that will allow landowners to plant exotic species including Eucalyptus, oil palm, pine, and coffee to restore forest cover to the legal requirement. The bill will now be returned to the Chamber of Deputies, Senate and House for approval. Certain clauses may be challenged, but the bill is expected to pass more or less in its current form (Mongabay, 2012).
The bill’s supporters point out that the previous 1965 law was widely disobeyed and poorly enforced. Environmentalists, whom had called for complete veto of the bill, are concerned that despite the amendments, the new Forest Code will reverse the gains in combating deforestation that Brazil has made over the last decade. However, given the strong ruralista control over the lower house of Congress, many see the President’s decision to veto clauses selectively as pragmatic (Goldemberg, 2012).

Chapter 6: Brazil’s Response to Climate Change
Report commissioned by the Centre for Development and Enterprise 60
Agriculture
To reduce emissions from agriculture, Brazil aims to expand the practices of no-till agriculture and integrated crop-livestock-forestry; increase the use biological nitrogen fixation instead of nitrogenous fertiliser; and recover the current 100Mha of degraded pasture. Brazil currently practices no-till agriculture in 23Mha. Direct planting increases the quantity of organic matter and water in the soil, thereby sequestering an estimated 500kgCO2e/ha annually. Moreover, it reduces the quantity of imputs (machinery, manures, pesticides, fertilisers, and labour). In Brazil, no-till farming sequester an estimated 12MtCO2 annually (Pinto, 2009).
Integrating land used for animal husbandry with planting and/or forestry reduces erosion, recycles nutrients, and increases the production of biomass, thereby increasing the support capacity of the land from 0.5 to 2.5 animals per hectare. Moreover, the practice sequesters an estimated 2.5 hectares per hectare annually (Pinto, 2009).
Energy
As seen above in Figure 6.3, renewable energy contributed a 45.4% share of Brazil’s total energy production in 2010: 14.2% from hydropower, 9.6% from charcoal, 17.7% from sugarcane ethanol, and 3.9% from other renewable sources such as solar and wind (Reis, 2012). The PNMC aims to add a further 7,000MW of renewable energy from biogas cogeneration, mini-hydro and wind; 136TWh from biogas cogeneration; and a further 34,460MWh from hydro. In 2008, Brazil had installed 237MW generating capacity of wind power, only 0.24% of national electrical generation (Pimenta et al., 2008). However, its potential for wind power has been estimated to be a total of 143,000GW (Reis, 2012). Pimenta et al. (2008) estimated the potential for offshore windpower off the highly populated southern and south-eastern coasts to be 102GW, approximately equal to the electricity demand of the entire country. As part of its Incentive Programme for Alternative Electric Energy Sources (PROINFA) the GoB held an auction for 89 long-term contracts for wind, biomass and small hydro projects that will commence in 2013 and produce an estimated 2,892.2MW. Seventy of the 89 contracts were for wind energy generation. The market for photovoltaic solar energy is less developed, and Brazil currently has no feed-in tariff. However, the PNMC aims to increase production in rural areas. Brazil’s first solar energy plant began operations in 2011 in the rural Northeast. It is generating 1MW, and is expected to expand to 50MW (Reis, 2012).
Brazil also aims to increase energy efficiency by 106TWh per year by 2030, thereby avoiding approximately 30 MtCO2e. Approximately 2,200GWh of this target will be achieved through solar water heating, a market which is already well developed and expanding with support from policies related to public housing projects.
As stated, Brazil has one of the most advanced biofuels markets in the world due to its National Alcohol Programme, which in 1975 mandated that gasoline be blended with ethanol produced domestically from sugar cane. The mandatory blend has fluctuated from 10-25% ethanol. In 2008, over 90% of all vehicles sold in Brazil were flex-fuel, capable of using any combination of ethanol and gasoline (Reis, 2012). The same year, Brazil consumed over 20 billion litres of ethanol, more than a fifth of the world’s total consumed as fuel. The GoB projected that this demand could surpass 50 billion litres by 2017 (Figure 6.7). Brazil aims to cooperate with other countries to stimulate the international ethanol market and expand ethanol exports. It also aims to increase its biodiesel industry. The National Biodiesel Programme begun in 2003, mandated that diesel be mixed with 2% biodiesel. The mandatory blend has now increased to 5%.

Chapter 6: Brazil’s Response to Climate Change
Report commissioned by the Centre for Development and Enterprise 61
Figure 6.7 Domestic Demand for Ethanol (GoB, 2008)
The relationship between Brazil’s biofuels programme and GHG emissions is debated. Life-cycle analyses have found that replacing gasoline with ethanol produced from sugarcane will result in an 86% reduction of GHGs. If the sugarcane is grown on tropical grazing land, as is predominantly the case in Brazil, then the carbon released into the atmosphere during conversion of the land will be ‘paid back’ in only four years, and further emission reductions will be net gains (Searchinger et al., 2008). In contrast, the equivalent payback period for soybean biodiesel, which is the most common variety of biodiesel in Brazil’s biodiesel, is 35 years due a lower annual per hectare carbon savings. Expansion of soybean plantations has been a significant cause of deforestation in the past. However, the 2006 moratorium on soybean expansion has slowed this trend. In the last five years, the vast majority of sugarcane and soybean expansion has occurred on land previously used as rangeland, although the proximity of soybean plantations to the Amazon and sugarcane plantations to the threatened Atlantic forest in the southeast of Brazil remains a concern (Lapola et al., 2010).
Less understood is the indirect land-use change caused by the cascade effect caused by the expansion of biofuels feedstock crops pushing the agricultural and cattle ranching frontier. Lapola et al. (2010) found that to fill the biofuel production targets for 2020, sugarcane and soybean would require an additional 57,200 km2 and 108,100 km2, respectively. Approximately 88% of this expansion, 145,700 km2, would displace rangeland, which Lapola et al. (2010) argues could in turn push grazing land into forests. Lapola et al. (2010) estimate that which carbon emissions from indirect land-use changes are taken into account the payback period for sugarcane ethanol is increased to 44 years, and for soybean biodiesel is increased to 246 years. However, Goldemberg (2012) contends this reasoning is too simplistic, because, rather than expanding into forested land, there is significant potential for Brazilian cattle ranching to become more intensive. Where Brazil generally produces one head of cattle per hectare, Argentina produces five. A better understanding of the relationship between the cattle ranching, forestry, and biofuels sectors is needed to determine the actual GHG emission reductions of Brazil’s biofuels programme.
Mainstreaming Climate Change Policies into National and Sectoral Plans
Brazil aims to mainstream its climate change policies by incorporating them into sectoral plans. The mitigation targets listed in Box 16 have already been mainstreamed into existing plans:
I. Plan of Action to Prevent and Control Deforestation in the Amazon II. Action Plan for Prevention and Control of Fires and Deforestation in the Cerrado III. Ten Year Plan for Energy Expansion IV. Plan for the Consolidation of Low Carbon Emission Economy in Agriculture V. Plan for Reducing Emissions from Steel

Chapter 6: Brazil’s Response to Climate Change
Report commissioned by the Centre for Development and Enterprise 62
Federal Decree No. 7390 mandated that mitigation plans for other sectors included in the PNMC be established by 16 April 2011. These sectors include public urban transportation, insterstate transport of cargo and passengers, transformation industry, durable consumer goods industry, chemical industry, pulp and paper industry, mining, civil construction, and the health sector. Each of these plans must include emission reduction targets to 2020 with three year intervals; specific actions to be implemented; indicators for monitoring and evaluation; proposed regulatory tools and incentives for implementation; and cost benefit analyses of the mitigation plans’ impact on sectoral competitiveness (Rovere, 2011).
Hints that climate change is being taken into consideration in Brazil’s more mainstream planning documents can be found in the second phase of Brazil’s Growth Acceleration Program (PAC 2), a large-scale infrastructure investment programme launched in March 2010, that will see an estimated USD 526 billion (R$ 958.9 billion) invested over the period 2011 to 2014 (Loudiyi, 2010). Similar to the first phase of the program, PAC 2 focuses on investments in the areas of logistics, energy and social development, organized under six major initiatives shown in Box 16. The Better Cities urban infrastructure programme will see USD 2.2 billion invested in urban drainage in 64 municipalities, which will help prevent flooding, and USD 9.8 billion in public transport in cities with populations greater than 700,000. The USD 39.5 billion ‘My House, My Life’ social housing programme, will fit houses built for low income families with solar water heaters to save energy. Finally, the Energy initiative will aim to ‘secure reliable supply of energy through a mix of clean, renewable sources.’ Despite these ‘climate friendly’ initiatives, the Energy initiative, worth USD 255.3 billion from 2011-2014 and USD 343.9 billion post-2014, will also see the large-scale expansion of the oil and gas industry, which will necessarily see emissions grow exponentially from this sector.
A number of sub-national governments have also enacted climate change-related legislation. The states of Rio de Janeiro, Minas Gerais, São Paulo, and Espírito Santo have, or are in the process of undertaking GHG emissions inventories. In 2009, the state of São Paulo established a mandatory 20% emission reduction from 2005 levels by 2020. The city of Rio de Janeiro has stated the same target, though voluntary (Reis, 2012), and the state of Rio de Janeiro is expected to establish mandatory targets in 2012 (Murphy, 2011).
Finance
To finance its climate-related initiatives, Brazil established the FNMC in 2009. FNMC is capitalised through both international climate grants and a 60% cut of the royalties paid to the government by companies working the country’s oil fields. In 2011, the first year of disbursal, it distributed USD 142.6 million. Although it is housed in the Ministry of Environment, 86% of the funding (USD 122.3 million) was transferred to Brazil’s National Development Bank to extend lines of credit to financially viable adaptation and mitigation projects including the development of
Box 16. Brazil’s Growth Acceleration Program (PAC 2) 2011-2014 • Better Cities (urban infrastructure) • Bringing Citizenship to the Community (safety and social inclusion) • My House, My Life (housing) • Water and Light for All (sanitation and access to electricity) • Energy (renewable energy, oil and gas) • Transportation (highways, railways, airports)

Chapter 6: Brazil’s Response to Climate Change
Report commissioned by the Centre for Development and Enterprise 63
irrigation reservoirs, REDD schemes, and low carbon technologies. The Ministry of Environment dispersed the remaining 14% (USD 20.6 million) to public sector climate change initiatives including training and education, research and development, environmental conservation, and a USD 6 million prevention and early warning system for drought, floods and landslides (Kepp, 2011)
The GoB has also launched the Amazon Fund to secure international funds for projects that prevent deforestation and promote the sustainable use of the Amazon forest. Resources for this fund come mostly from donations of developed countries. In 2011 Norway donated USD 170 million to the fund and has pledged up to USD 1 billion for the period up until 2015. As of January 2012, the Amazon Fund had approved USD 139 million in funding to 23 projects, an average of USD 6 million per project (ODI, 2012).
To date, 469 CDM projects have been proposed, and 201 have been registered, 5% of the world’s total, which have been issued a total of 62.9 million CERs (CD4CDM, 2012a, UNFCCC, 2012). Most relate to renewable energy, with 131 hydropower, 76 biomass and 64 wind power projects proposed. A further 131 of the proposed projects were for methane avoidance, and the rest involved recovery of landfill gases, energy efficiency, waste management, industrial processes, N20 reduction, reforestation, etc (CD4CDM, 2012a, UNFCCC, 2012).
The Federal Decree No. 7390 provides for the establishment of a Brazilian Emission Reduction Market for trading of securities representing certified GHG emission reductions (Reis, 2012). The state of Rio de Janeiro is set to launch Brazil’s first carbon exchange in 2013, which will allow businesses to trade emission allowances to comply with the states’ expected mandatory emission limits (Murphy, 2011).
Private Sector Brazil has 33 companies in the Forbes’ Global 2000 list of the world’s biggest companies. Its top 10 are listed in Table 6.4. A number of large Brazilian companies, including Petrobras, Electrobras, and Vale, have adopted internal guidelines to address climate change, ranging from corporate GHG emission inventories to mitigation policies (Rovere, 2011). Brazil’s largest company, the state-owned oil giant Petrobras, is also its single biggest carbon emitter. In 2008, its emitted emissions totalled 51 million tCO2, approximately 2.3% of Brazil’s total emissions. Many of these emissions were produced during the extraction of deepwater subsalt oil, during which five times as much CO2 is estimated to be emitted than during extraction of ordinary oil (Glickhouse, 2011). Subsalt oil provides just 2% of Petrobras’ production today, but this is projected to increase to 40% by 2020 (Phillips, 2011), a major reason why GHG emissions from fossil fuels are projected to increase by 75% between 2005 and 2020 even within its mitigation scenario (Rovere, 2011).
Table 6.4 Brazil’s 10 largest companies (Forbes, 2010)
Forbes Ranking
Company Industry Market Value (USD Billion)
18 Petrobas-Petroléo Brasil Oil & Gas, Energy, Biofuels 190.34 51 Banco Bradesco Banking 54.5 52 Banco do Brasil Banking 42.78 80 Vale Mining, Coal, Energy 145.14 82 Itaúsa Conglomerates 28.74 235 Eletrobrás Utilities 15.95 478 CSN-Cia Siderurgica Materials 25.3 620 Usiminas Materials 14.26 658 Tele Norte Leste Telecommunications 7.99 698 JBS Food, Drink & Tobacco 12.18

Chapter 6: Brazil’s Response to Climate Change
Report commissioned by the Centre for Development and Enterprise 64
The attitude of Brazil’s private sector in regards to climate change, and its performance in mitigating GHG emissions, has been relatively mixed. The National Confederation of Industry (CNI) and the Brazilian Business Council for Sustainable Development (CEBDS) produce regular statements on climate change and hold side events at the COPs (Rovere, 2011). A 2010 report CNI highlights Brazilian industries’ successes (CNI, 2010): - Biogas from accounts for 18% of Brazil’s energy supply. - More than 90% of all light vehicles sold in Brazil are flex-fuel, and run on a mix of gasoline and
domestically produced ethanol. The report estimates that 824MtCO2 emissions will be avoided by 2019 due to the use of biofuels in Brazil.
- Planted, rather than old growth forests, are used to produce all of the paper produced in Brazil, as well as a significant portion of the charcoal used in the iron and steel industry. If these planted forests are managed sustainably, this practice can contribute to reducing emissions.
- Brazil ranks third among countries in implemented CDM projects. It also outlines CNI’s position on the UNFCCC negotiations: - Agreements should be based on the Principle of CBDRRC. - More funding should be made available by developed countries for climate change adaptation,
REDD, and NAMA implementation in developing countries, and the CDM should be maintained, expanded, and improved particularly in regards to forestation and reforestation projects.
- A formal private sector consultative form should be linked to the UNFCCC to help develop technical proposals and recommendations.
- Countries should not use unilateral measures to avoid “carbon leakage” should for protectionist purposes
- Emissions from air and maritime transportation should be mitigated only in cases where there is a need for additional mitigation to complement the commitments under the Bali Action Plan and efforts should be based CBDRRC.
In 2009, prior to the COP15 in Copenhagen, 22 large Brazilian companies including Vale, submitted an "Open Letter to Brazil on Climate Change", which urged the government to take on a leading position in the negotiations and push for the creation of incentive mechanisms for REDD. The companies committed to publishing a GHG inventory and mitigation actions each year, and to work with their supply chain to promote emissions reduction from suppliers and clients (Ethos, 2009). At the other end of the spectrum, the Federation of Industries of São Paulo State (FIESP), referred to as “The most powerful business association in Brazil” and comprising 132 industry associations representing an estimated 150,000 companies, urged the GoB not to assume commitments, arguing that the responsibility lay with developed countries to take the lead.
It is difficult to determine the impact that lobbying has on Brazilian politics. However, it is widely purported that lobbying from agribusiness in particular helped to pass the above mentioned controversial 2011 Forest Law through Congress. In total, agribusinesses donated USD 8.3 million to 50 congressmen considering the bill, representing a 42% increase in agribusiness campaign spending from the 2006 elections (Glickhouse, 2011). The International Consortium of Investigative Journalists conducted a review of campaign contributions in the 2006 general election. It found that at least 719 candidates, including 20 of Brazil’s 27 governors and 183 of its 594 congressmen, received campaign contributions from companies in carbon-intensive industries (agribusiness, energy, beef, pulp and paper, cement, big energy consumers, mining, vegetable oils, cereal exporters, fertilier, steel, and petrol). The contributions totalled $28.3 million, or 3% of total campaign financing that year (Rodrigues and Soares, 2009).

Chapter 6: Brazil’s Response to Climate Change
Report commissioned by the Centre for Development and Enterprise 65
6.3 UNFCCC Negotiations
In 1992, Brazil hosted the UN Conference on Development and the Environment, and was the first country to sign the UNFCCC. It has been active in the negotiations ever since. In 1994, Brazil proposed that each country’s future responsibility to mitigate GHG emissions under the UNFCCC should correspond to their historical contribution to global warming. This so-called Brazilian proposal was based on the fact that it is the cumulative global stock of GHG emissions that cause climate change, rather than “an instantaneous ‘snapshot’ of [emission levels] in an arbitrary calendar year,” It was designed to counter the emerging understanding that the principle of CBDRRC could be addressed by simply dividing Parties into Annex I and non-Annex I countries, and ascribing emission reduction commitments to the former under the Kyoto Protocol, and to institutionalise the concept of historic responsibility into the UNFCCC process (Miguez and Oliveira, 2011). Although the Brazilian Proposal was not adopted into the Kyoto Protocol, it was supported by developing countries, and COP3 assigned the Subsidiary Body on Scientific and Technical Advice the task of further analysing the proposed methodology to measure historical responsibility for climate change (Elzen et al., 2005). Allocating emission reduction obligations based on historic responsibility has been the core of Brazil’s stance at the UNFCCC ever since.
Brazil is convinced that the top-down mandatory structure of the Kyoto Protocol is the most appropriate legal instrument for directing global efforts to mitigate climate change, and that a bottom-up approach, by which each developed country would select the size and nature of its own commitments, “would not suffice to ensure comparability or the level of mitigation ambitou needed from developed countries as a whole” (UNFCCC, 2009b). However, it non-Annex I countries should voluntarily propose NAMAs, and that these should be supported through financing and technology transfer by Annex I countries. Brazil also introduced the idea of the CDM, and it is concerned with the implications that the expiration of the first phase of the Kyoto Protocol will have for the CDM (GoB, 2007). After COP17, President Dilma Rousseff expressed support for the Durban Platform, stating that Brazil considers it “essential” to agree on a second commitment period for the Kyoto Protocol.
In December 2009, Brazil became one of the first emerging economies to adopt a relatively ambitious emissions reduction target. Unlike India and China, which submitted targets based emission intensity their economic output, Brazil’s target is based on quantified emission reductions relative to BAU trends. Although these different metrics make it difficult to compare the ambition of each target, by converting each into absolute reductions, per capita reductions, reductions against BAU and reductions in emissions intensity, Jotzo (2010) found that Brazil’s target was much more ambitious than the others. In fact, whereas Brazil’s target could represent a reduction in absolute and per capita emissions by 2020 relative to 2005 levels, India and China’s targets represent in the range of 60-100% for each category (Jotzo, 2010).
On adaptation, Brazil argues that efforts must be country-driven and should take into account local, national and regional vulnerability assessments. It states that a distinction should be made between adaptation programmes that are integrated with development planning and stand-alone programmes that are additional to national development planning, and that the latter should be financed at full cost. Brazil pushes for programmes that enable technology development, deployment, diffusion and transfer; capacity-building for operational planning of adaptation; and knowledge sharing through public awareness-raising activities, professional exchanges, professional development opportunities, and national or regional centres that coordinate and disseminate information on best

Chapter 6: Brazil’s Response to Climate Change
Report commissioned by the Centre for Development and Enterprise 66
practices. Moreover, it has called for a “package of assistance to support the implementation of National Adaptation Programme of Actions (NAPA) including financial, technical, capacity building and institutional support” (UNFCCC, 2009b).
On climate finance, Brazil pushes for “new, additional and predictable financial resources separate and apart from Official Development Assistance (ODA),” and for developing countries to have “direct access” to such financial resources (UNFCCC, 2009b). Brazil’s negotiator Ambassador Luiz Alberto Figueiredo stated that one of Brazil’s goals in Durban was to agree on a clear timeline and funding structure for the Green Climate Fund: "We cannot have an empty shell. It is important to have the structure in place, but it is also important to have a clear commitment for funding... Some feel that certain countries are trying to outsource their responsibilities to the private sector...” (Goldenberg, 2011). Brazil has long resisted international efforts to include REDD+ in a global project-based carbon offset market, arguing that such a programme would allow countries and industries to shirk their responsibilities to reduce GHG emissions. Instead, Brazil pushes for a direct financing mechanism, in which funds are transferred directly to its national Amazon Fund to support a national framework to combat deforestation, and no offsets are awarded.
Brazil’s stance against REDD+ is indicative of what many see as an internal divide within the government. At the UNFCCC negotiations, Brazil is represented by the Itamaraty, the Ministry of Foreign Relations, which does not always see eye-to-eye with the Ministry of Environment. Where the Ministry of Environment is primarily focused on conservation of the Amazon, and may be more open to negotiations over REDD+, the Itamaraty is highly suspicious of what is views as foreign influence in the Amazon.
In June 2012, Brazil will host the Rio+20 Earth Summit, 20 years after the first one in 1992 in which the UNFCCC was created. Brazil is expected to push for the adoption of global Sustainable Development Goals (SDGs), modelled on the Millennium Development Goals. However, it is unlikely that the SDGs will include quantified targets. They are more likely to comprise broad declarations of shared sustainable development principles, and a commitment to work towards quantified targets for 2015.
6.4 Conclusion
Brazil is a central figure in global efforts to mitigation climate change due to its control over 70% of the Amazon Rainforest. Its ability to combat deforestation will be the main factor determining whether or not it is able to achieve its relatively ambitious mitigation target of reducing GHG emissions 36.1-38.9% against projected emissions by 2020. Brazil has made admirable progress in reducing deforestation rates over the previous decade. However, a controversial bill heavily lobbied for by agribusiness that would relax Brazil’s Forest Code is expected to be signed into law this year. The most controversial clauses of the bill were vetoed by President Dilma Rousseff. However, environmentalists remain concerned that the gains that Brazil has made in reducing deforestation rates will be reversed.
In other sectors, Brazil has been a world leader, particularly in low carbon agriculture and biofuels. The GHG emissions saved per litre of sugarcane-produced ethanol substituted for gasoline is significantly higher than other prominent biofuels, such as corn-based ethanol in the US. However, with the boom of Brazil’s oil and gas industry, its GHG emissions from fossil fuels are projected to increase rapidly. The fact that the GoB’s own mitigation scenario foresees an increase in emissions from the oil and gas sector of 75% between 2005 and 2020 suggests that this is an area in which the

Chapter 6: Brazil’s Response to Climate Change
Report commissioned by the Centre for Development and Enterprise 67
country will not compromise. As a result, after 2020 it is likely that Brazil’s downward trending GHG emission levels will begin to rise.
In UNFCCC negotiations, Brazil has pushed hard for emission reduction targets to be based on historic emission levels and has stood strongly against REDD+ being included in international carbon offset markets. It believes that the top-down structure of the Kyoto Protocol is the best legal framework to allocate responsibility to developed nations, and that developing countries should voluntarily submit bottom-up targets. However, with adequate financial and technical support in place, Brazil may be convinced to adopt a legally binding target in a post-2020 framework if the target is reciprocated by other large emitters.

Chapter 7: Potential Developed Country Responses
Report commissioned by the Centre for Development and Enterprise 68
7. Potential Developed Country Responses
It is now well understood that the mitigation actions pledged by countries under the Copenhagen Accord and Cancun Agreements are not ambitious enough to avoid dangerous climate change. There is broad agreement in four different reports that developing country pledges amount to more mitigation against BAU trends than developed country pledges (SEI, 2011). That conclusion applies across all the various cases of the four studies, despite the diversity of assumptions and methodologies employed and the substantial differences in their quantification of the pledges (SEI, 2011). There is therefore a strong case for developed countries to take more action, without developing countries pledging more ambitious mitigation targets.
7.1 European Union
Of all the developed countries, the EU group has played the biggest role in the UNFCCC negotiations and has been most committed to taking action. Despite being sidelined at COP15, while the US and BASIC countries came to an agreement, the final Copenhagen Accord included many EU positions taken well in advance. Up to that point, the EU had focused its efforts on the US – believing that it was the key to progress in the negotiations. Since then the EU has shifted its focus to the BASIC countries, who it believes are more likely to take action. As the only block with legally binding agreements to reduce GHG emissions through the Kyoto Protocol, the EU has a strong bargaining chip. The EU’s success story at COP17 in Durban was the alliance that it built with developing countries – the AOSIS, LDC and ALBA groups - which pushed the BASIC countries to agree to a legally binding agreement that would come into force in 2020. This was a significant step forward in the negotiations and resulted in the EU committing to a second commitment period of the Kyoto Protocol after 2012. The EU now is focusing on expanding that alliance to include the BASIC countries. Increased actions by the large developing countries will encourage the EU, and other developed countries, to be bolder in their commitments.
An EU-BASIC alliance may be prevented by unilateral trade measures. The EU has shown its intention to move forward regardless of other country commitments with the introduction of the aviation into the EU ETS. This requires all airlines landing in the EU to pay for their GHG emissions from 1 January 2013. It has caused much controversy and is strongly objected to by developing countries as it undermines the multilateral negotiations and does not accommodate the CBDR principle. The EU is proceeding in spite of this, with the hope that it will spur other countries to implementing their own emissions taxes. The response of the BASIC countries will play a key role in how this initiative proceeds.
In addition to the action in the negotiations, the activity happening at a domestic level in BASIC countries is also likely to cause the EU to take further action. In the low carbon technologies sector, developed countries will have to increase the incentives for growth within the sector if they do not want to be left behind. Germany and Italy have been overtaken by China as the largest wind and solar power producers, and India is not far behind. To maintain their competitive advantage they will need to continually research and develop improved technology.

Chapter 7: Potential Developed Country Responses
Report commissioned by the Centre for Development and Enterprise 69
7.2 United States
Not all developed countries will react in the same way to the increased involvement of BASIC countries in the international negotiations. Although the need for ‘symmetry’ between developed and developing country action is depicted as the core reason for inaction on the behalf of some developed countries, the analysis of mitigation pledges shows that this is simply a front, as the ambition of developed countries is so low. Canada, for one, is unlikely to be able to reduce emissions at the level recommended by science whilst developing its significant tar sand and shale oil resources. Japan and Russia may require not only ‘symmetry’ from the major developing nations but substantially increased action from the US before altering their positions within the negotiations.
In the US, a lack of political support may be the ultimate barrier. Whilst the Obama administration supports action on climate change the political situation within the country has not allowed leadership on the issue at an international level. There is a lack of political support within the country for action on climate change regardless of the actions of other nations. US action on climate change is driven largely by domestic political factors such as the overall economic situation, the price of fuel and the strength of the two political parties relative to each other. The presidential elections to be held later this year will have a large impact on the latter factor. As shown in Figure 2.1, the US consumes far more oil than it produces, making it oil dependent and energy insecure. This is more likely to drive action than goodwill.
Despite the inertia at national level, action on climate change at a state and sub-national level is occurring in the US. Twenty-three US states have actively participated in the design and/or implementation of three regional cap-and trade programs to reduce greenhouse gas emissions: the Regional Greenhouse Gas Initiative (RGGI), the Midwestern Greenhouse Gas Reduction Accord (Midwestern Accord), and the Western Climate Initiative (WCI). Together, the active US state participants represent 51% of national GHG emissions, 61% of national GDP, and 67% of national population. Stronger outside stances on climate change are likely to strengthen the position of these actors in pushing for change.
The increasing influence of the BASIC group seems to have pushed the US to engage more in the UNFCCC negotiations. Opinion is divided over their usefulness at the COPs and some feel that the rest of the world should move on without the US. The BASIC group are unlikely to sign any legally binding agreement, however, without the largest GHG emitter also signing up, and the US is unlikely to sign up without China making a commitment. The proactive steps taken by China in particular may be the catalyst for the US to increase its ambition; however there is an understanding between China and the US that they will not apply pressure to increase ambition before 2020.
Energy security and economic opportunities are likely to be the real driving forces in the US. As with the EU, inaction may result in the US being left behind in low carbon technologies, scientific research and innovation.

Chapter 8: Lessons for South Africa
Report commissioned by the Centre for Development and Enterprise 70
8. Lessons for South Africa
There are a number of actions taken by India, China and Brazil that South Africa could learn from.
Governance
• All three countries have a High Level Committee on Climate Change chaired by the President or Prime Minister. This indicates buy-in at the highest level and encourages action at lower levels.
• All three countries are addressing climate change at sub-national levels. In India each State has to develop a State Action Plan on Climate Change; in Brazil individual cities and states are developing GHG inventories and setting targets; and in China, guidance has been provided to local governments.
• In Brazil civil society plays a big role in driving change and is actively involved in policy development. Much of the gains that Brazil has made in reducing deforestation rates in the Amazon are due to policies promoted by domestic and international environmental NGOs. South African citizens are not that aware of the threat of climate change but that may change and could become a driver for change in South Africa.
Finance and Trading
• Brazil, India and China all have some form of carbon trading in place or about to be set up. India’s renewable energy certificates have been in place for 18 months; China is piloting an emissions trading scheme in 7 municipalities and provinces; and Brazil’s federal decree provides for the establishment of an emissions reduction market.
• India and Brazil have set up national funds to finance climate change activities. India introduced a tax on imported and domestic coal which supports the Clean Energy Fund, while Brazil has the National Climate Change Fund and the Amazon Fund.
• After introducing feed-in tariffs, India found that reverse auction actually worked far better, and this model may be implemented in other countries to encourage private sector involvement.
Private Sector
• China and India both have programmes to encourage the private sector to take action. China’s Top 1,000 Programme set voluntary energy saving targets for the biggest energy consumers; it was so successful that it has been being expanded to the Top 10,000 Programme. India’s Energy Conservation Awards have resulted in USD 2.6 billion energy cost savings for their biggest industries and emissions reductions for the country.
• Brazil has a strong business lobby on climate change that it is divided into ‘for’ and ‘against’ action. The agribusiness lobby has been particularly influential in pushing for Congress to relax laws on deforestation.
• The type and level of governance plays a big role in private sector compliance. China’s Communist Party can enforce laws more effectively while India’s bureaucracy struggles to do so.

Chapter 8: Lessons for South Africa
Report commissioned by the Centre for Development and Enterprise 71
• The private sector generally is only focused on energy and not the broader implications of climate change.
Adaptation
• China has recognised the threat of climate change to its agricultural base and food security and has taken steps to improve governance, R&D and environmental restoration to support adaptation. Brazil has done detailed modelling of its climate impacts on food production which is useful for policy makers and the private sector. India is only starting to understand the impacts of climate change and has a long way to go on adaptation.
• India and China have significant water resource challenges and are not adequately addressing them.
• None of the countries have a comprehensive Risk and Vulnerability Atlas like South Africa does. There is an opportunity for South Africa to take on a leadership role in the BASIC group on adaptation. This would improve relations with the Africa group and other developing countries and provide a way for South Africa to support their fellow developing countries in a more meaningful way.
Mitigation
• As mitigation continues to fall short of what is required by science to avert catastrophic climate change, the economic impacts will become increasingly important and will drive change in the future.
• China and India have become world leaders in renewable energy challenging the US and Germany. They have shown that developing countries can produce and operate green energy systems and that a lower carbon development pathway is possible.
• Brazil offers a successful example of how replacing fossil fuels with biofuels can reduce GHG emissions. However, it also demonstrates that the potential for success is context specific. The indirect impacts of expanding biofuel feeder crops on food prices and land-use must be considered. State-owned Brazilian company Petrobras is currently considering an investment in sugarcane ethanol production in Mozambique. There may be further opportunities for partnership between South Africa and Brazil in the biofuels sector.
International Negotiations
• China and India’s targets are based on emissions intensity of GDP, not absolute emissions. However, the level of intensity that they have pledged equates to reductions below BAU in the region of that recommended by science, though differences in accounting make direct comparisons difficult. South Africa may be protected from criticism by being more ambitious than they are or by ensuring clarification of accounting.
• South Africa is under pressure from the Africa group to fight for higher mitigation ambition – from both developed countries and the emerging economies. It is also under pressure from the BASIC group to block high ambition for developing countries. This tension may become increasingly apparent as the impacts of climate change are felt.
• South Africa is likely to get a legally binding target that it is less equipped to meet compared to the BASIC countries, despite it being the junior player in the group. With fewer natural resources, serious skill shortages and less diversified economy, South Africa may need to take a stronger stance on finance and capacity building than they do.

Chapter 9: Conclusions
Report commissioned by the Centre for Development and Enterprise 72
9. Conclusions
This paper has provided an overview of the climate change response of China, India and Brazil – three key countries in the climate change arena due to their size and resources - and the context within which they are taking action. In order to understand the motivation for the past, present and future action, six drivers were highlighted - climate change impacts, global pressure to mitigate, energy security, economic opportunities, natural resource management and political will. These vary across the emerging economies but are all real concerns for the countries. These drivers are causing the BASIC countries to take significant action on climate change which is reflected both in the climate specific national plans and their economic plans. Their actions and commitments are summarised in the previous chapters. China is probably moving as fast as is possible for a developing country, but developing renewable energy and fossil fuels at the same pace. Similarly, India is focused on energy supply and security to alleviate poverty but has taken significant steps in encouraging private sector action through financial incentives. Brazil is less concerned with energy and has the challenge of saving the Amazon rainforest, a global commons that it is under huge pressure to protect. Despite powerful drivers for action, these three countries are contributing 28% of global GHG emissions and their development plans will result in increasing GHG emissions in the next 2 decades.
In the climate negotiations, the focus has shifted from the US to the emerging economies, the BASIC group. The BASIC countries primary aim is to ensure 'equitable access to sustainable development' – i.e. that they are allowed to continue emitting in order to develop to developed country levels. Their push for finance is aimed at supporting other developing countries, their real interest lies in technology transfer (particularly intellectual property rights) as that is what will help their economies the most. The EU-BASIC relationship is most interesting as hope now lies in an EU-led alliance with the BASIC group. The US and China are unlikely to increase mitigation ambition without the other signing a legally binding agreement – which they may together decide not to do. The BASIC group is both an opportunity and a threat for South Africa. The four countries are very different but are treated the same in the negotiations. As the junior in the group, South Africa may find itself committing to mitigation targets that it cannot meet. On the other hand, it has the opportunity to influence three of the most powerful countries in the world, and can use it for the global good.

References
Report commissioned by the Centre for Development and Enterprise 73
References AABC 2012. India's Energy Security Under Threat. AfroAsian Business Chronicle. BETTELHEIM, E. 2009. Forest and Land Use Programs Must Be Given Financial Credit in Any Climate Change
Agreement. In: STEWART, R., KINGSBURY, B, AND RUDYK, B (ed.) Climate Finance: Regulatory and Funding Strategies for Climate Change and Global Development. New York: New York University Press.
BLOOMBERG 2011. Global Trends in Renewable Energy Investment 2011 - Analysis of Trends and Issues in the Financing of Renewable Energy. United Nations Environment Programme and Bloomberg New Energy Finance.
BUCKLEY. 2012. Can India take a lead in clean energy? Reneweconomy, 20 March. BUSINESSSTANDARD. 2011. Oil price rise to impact India's GDP growth: Goldman Sachs. Business Standard,
24 April 2011. CD4CDM. 2012a. Capacity Development for the Clean Development Mechanism [Online]. Roskilde United
Nations Environment Program. Available: http://cd4cdm.org/ [Accessed]. CD4CDM. 2012b. http://cd4cdm.org/ [Online]. Available: http://cd4cdm.org/ [Accessed]. CHANDLER, W. & WANG, Y. 2009. Memo to Copenhagen: Commentary is Misinformed – China’s
Commitment is Significant. Carnegie Endowment for International Peace. CHEN, M., XIE, P. & JANOWIAK, J. E. 2002. Global land precipitation: a 50-yr monthly analysis based on gauge
observations. Journal of Hydrometeorology, 3, 249–266. CHINA 2012. China’s Submission on Options and Ways for Further Increasing the Level of Ambition In:
UNFCCC (ed.) FCCC/CP/2011/L.10, paragraph 8. CHINA DAILY. 2009. Wen: China all out to tackle climate change. Available:
http://www.chinadaily.com.cn/china/2009-02/02/content_7439615.htm. CHINA SHENHUA ENERGY 2011. 2011 CSR Report: From Industrial Civilization to Ecological Civilization.
Beijing: China Shenhua Energy Company Limited,. CIA. 2012. The World Factbook [Online]. Washington, DC: Central Intelligence Agency. Available:
https://www.cia.gov/library/publications/the-world-factbook/rankorder/2174rank.html [Accessed]. CII. 2012. Confederation of Indian Industry [Online]. [Accessed 13 March 2012]. CLIMATECONNECT. 2012. Over $2 billion transferred through India's tax on coal, 20 projects apply for
fuding. Climate Connect News. CNI 2010. Contributions by the Brazilian Industry to the 16th Climate Conference. Brasília: National
Confederation of Industry. COSTA, L., RYBSKI, R. & KROPP, J. 2011. A Human Development Framework for CO2 Reductions. PLoS ONE,
6. COX, P., BETTS, R., JONES, C., SPALL, S. & TOTTERDELL, T. 2000. Acceleration of global warming due to
carbon-cycle feedbacks in a coupled climate model. Nature, 408, 184-187. ECONOMIST 2012. Environmental law in Brazil: Compromise or deadlock? The Economist Newspaper. EIA 2010. Country Analysis Briefs: China. ELZEN, M., FUGLESTVEDT, J., HOHNE, N., TRUDINGER, C., LOWE, J., MATTHEWS, B., ROMSTAND, B.,
CAMPOS, C. & ANDRONOVA, N. 2005. Analysing countries' contribution to climate change: scientific and policy-related choices. Environmental Science & Policy, 8, 614-636.
ERDA, L., HUI, J., WEI, X., SHIMING, M., XIU, Y., CHUNSEN, M., ZHANYUN, M., HERAN, W., YINGCHUN, L., XUE, H., YINGYU, H., LIYONG, X. & LIJUN, L. 2008. Climate Change and Food Security in China. Beijing: Greenpeace China,.
ETHOS 2009. Open Letter to Brazil on Climate Change. Ethos Institute. FICCI 2011. India's energy security: Key issues impacting the Indian oil and gas sector. FICCI and Ernst &
Young. FIELDING, R. 2010. China launches emission-cutting factory closure programme. businessgreen.com. FORBES. 2010. The Global 2000 [Online]. Available: http://www.forbes.com/lists/2010/18/global-2000-10_The-
Global-2000_Counrty.html [Accessed]. GLICKHOUSE, R. 2011. Brazil Urges Climate Consensus Abroad as Environmental Concerns Loom at Home.
Council of the Americas.

References
Report commissioned by the Centre for Development and Enterprise 74
GOB. 2007. Embassy of Brazil in London: Climate Change Policy [Online]. London. Available: http://www.brazil.org.uk/environment/climatechange.html [Accessed 3 April 2012].
GOB 2008. National Plan on Climate Change: Decree No. 6263 of November 21, 2007. In: INTERMINISTERIAL COMMITTEE ON CLIMATE CHANGE, G. O. B. (ed.). Brasília.
GOB 2010. Decree No. 7390, of December 2010. Brasília: Presidency of the Republic of Brazil. GOI 2006. Integrated Energy Policy: Report of the Expert Committtee. New Delhi: Indian Planning
Commission, Government of India. GOI 2009. State of Environment Report, India 2009. New Delhi: Ministry of Environment and Forestry,
Government of India. GOI 2010a. India's Forests and REDD+. New Delhi: Ministry of Forestry and Environment, Government of
India. GOI 2010b. The National Water Mission under National Action Plan on Climate Change. New Delhi: Ministry
of Water Resources, Government of India. GOI 2011a. Climate Change and the 12th Five Year Plan Report of Sub-group on Climate Change. New Delhi:
Planning Commission, Government of India. GOI 2011b. Interim Report of the Expert Group on Low Carbon Strategies for Inclusive Growth. New Delhi:
Planning Commission, Government of India. GOI 2011c. Power sector at a glance: All India data. Ministry of Power, Government of India. GOI 2012. Increasing Ambition Level Under Durban Platform for Enhanced Actions. Submission by
Government of India to the UNFCCC,. GOLDEMBERG, J. 6 June 2012 2012. GOLDENBERG, S. 2011. Climate aid disupute 'would jeopardise Durban conference'. Guardian, 21 November
2011. GRASSO, M. 2010. An ethical approach to climate adaptation finance. Global Environmental Change-Human and
Policy Dimensions, 20, 74-81. GREENPEACE 2011. China's 12th Five-Year Plan. Greenpeace Insights & Commentary. Greenpeace China. HAN, G., OLSSON, M., HALLDING, K. & LUNSFORD, D. 2012. China’s Carbon Emission Trading: An
Overview of Current Development. Stockholme: Fores. HARPER, A. 2009. The Olympic Legacy: What Were the Effects of the Pollution Controls During Beijing
Summer Olympics? Atmospheric Sciences Newsletter of the AGU, 4, 7-8. HARVEY, F. 2012. Overseas aid to Africa being outweighed by hefty costs of importing oil: Sub-Saharan states
need to move to renewable energy sources as $15 bn in aid is outstripped by $18bn in oil imports, says IEA. The Guardian, 1 April 2012.
HOUSER, T. 2010. Copenhagen, the Accord, and the Way Forward. Policy Brief PB 10-5. Washington DC: Peterson Institute for International Economics,.
IEA 2009. World Energy Outlook 2009, Paris, International Energy Association. IEA 2010a. Energy Technology Perspectives (ETP) 2010, Scenarios and Strategies for 2050. Paris: IEA/OECD. IEA 2010b. World Energy Outlook 2010. Paris: OECD, International Energy Agency. IEA 2011. World Energy Outlook 2011: Energy for All. Paris: International Energy Agency. IEAGHG 2008. A Regional Assessment of the Potential for CO2 Storage in the Indian Subcontinent. IEA
Greenhouse Gas (IEAGHG) R&D Programme Report 2008/2. Cheltenham, UK: IEA Environmental Projects Ltd., Greenhouse Gas R&D Programme.
IGD 2011. From BRIC to BRICS - Report on the Proceedings of the International Workshop on South Africa's emerging power alliances: IBSA, BRIC, BASIC. Pretoria: Institute for Global Dialogue.
IIP 2012. India IN-2: Perform, Achieve, Trade (PAT Scheme. Institute for Industrial Policy. IIR 2010. India Infrastructure Report, 2010. Infrastructure Development in a Low Carbon Economy. Oxford:
3iNetwork. INCCA 2010a. Climate Change and India: A 4X4 Assessment - A sectoral and regional analysis for 2030s. .
Indian Network for Climate Change Assessment, Ministry of Environment and Forests, Government of India.
INCCA 2010b. Greenhouse Gas Emission Profile of India for 2007. India Network for Climate Change Assessments, Ministry of Environment and Forests, Government of India.
IPCC 1998. Special Report of the IPCC Working Group II, Cambridge, Cambridge University Press. IPCC 2007. Fourth Assessment Report. Intergovernmental Panel on Climate Change. JIANG, L., DONGQUAN, H., PING, H., MIN, H. & HONG, L. 2011. The Race Is On: China Kick-Starts Its
Clean Economy. Knowledge Series. ClimateWorks Foundation. JOTZO, F. 2010. Comparing the Copenhagen emissions targets. Crawford School of Economics and
Government, The Australian National University. JUN, M. 2007. How participation can help China's ailing environment. China Dialogue [Online].

References
Report commissioned by the Centre for Development and Enterprise 75
KAN, H. D. 2011. Climate Change and Human Health in China. Environmental Health Perspectives, 119, A60-A61.
KEPP, M. 2011. Brazil Plans $142.6 Million Payout From National Climate Change Fund [Online]. Bureau of National Affairs. Available: http://blogs.bna.com/climate/fulltext.aspx?id=4294969765&blogid=4294969421 [Accessed].
KOTHAWALE, D., MUNOT, A. & KRISHNA, K. 2010. Surface air temperature variability over India during 1901-2007, and its association with ENSO. Climate Research, 42, 89-104.
LAPOLA, D., SCHALDACH, R., ALCAMO, J., BONDEAU, A., KOCH, J., KOELKING, C. & PRIESS, J. 2010. Indirect land-use changes can overcome carbon savings from biofuels in Brazil. Proceedings of the National Academy of Sciences of the United States of America, 107, 3388-3393.
LEVI, M. A. 2009. Assessing China's Carbon-Cutting Proposal. Expert Brief. Council on Foreign Relations. LIN, L. 2011. China's 12th Five-Year Plan: Sustainability. KPMG Insights. KPMG China. LOUDIYI, I. 2010. Brazil Announces Phase Two of the Growth Acceleration Program. Ihssane Loudiyi blogs.
Washington, DC: World Bank. LUCENA, P., SCHAEFFER, R. & SZKLO, A. 2009. The Vulnerability of the Electric Power System to Climate
Change in Brazil. Climate Change and Extreme Events in Brazil. Lloyds. MANDHANA, N. 2012. Bright Days: How India is Reinventing Solar. . TIME Ecocentric, 13 February 2012. MANDKE, S. & BHIDE, U. 2003. A decreasing storm frequency over Bay of Bengal. Journal of Indian Geophysical
Union, 7, 53-58. MARENGO, J. 2009. Climate Change, Extreme Weather and Climate Events in Brazil. Climate Change, Extreme
Weather and Climate Events in Brazil. Lloyds. MARENGO, J., CHOU, S., KAY, G., ALVES, L., PESQUERO, J., SOURES, W., SANTOS, D., LYRA, A., SUIERO,
G., BETTS, R., CHAGAS, D., GOMES, J., BUSTAMANTE, J. & TAVARES, P. 2011. Development of regional future climate change scenarios in South America using the Eta CPTEC/HadCM3 climate change projections: climatology and regional analysis for the Amazon, São Francisco and Paraná River basins. Climate Dynamics.
MCKINSEY 2009a. Pathways to a Low-Carbon Economy: Version 2 of the Global Greenhouse Gas Abatement Cost Curve. McKinsey & Company.
MCKINSEY 2009b. Pathways to a Low Carbon Economy for Brazil. Sao Paulo: McKinsey & Company. MCT 2010. Brazilian Inventory of Anthropogenic Emissions by Sources and Removals by Sinks of Greenhouse
Gases not Controlled by the Montreal Protocol. Brasília: Ministry of Science and Technology. MEEHL, G., STOCKER, T., COLLINS, W., FRIEDLINGSTEIN, GAYE, A., GREGORY, J., KITOH, A., KNUTTI,
R., MURPHY, J., NODA, A., RAPER, S., WATSON, I., WEAVER, A. & ZHAO, Z. 2007. Global Climate Projections, Climate Change 2001: The Scientific Basis. Contributions of Working Group I to the Third Assessment Report of the Intergovernmental Panel on Climate Change, Cambridge, Cambridge University Press.
MIGUEZ, J. & OLIVEIRA, A. 2011. The importance of historical responsibility in the context of the international regime on climate change. In: GROUP, B. E. (ed.) Equitable access to sustainable development. Beijing, Brasilia, Cape Town and Mumbai.
MITRA, A. P., SHARMA, S., BHATTACHARYA, S., GARG, A., DEVOTTA, S. & SEN, K. 2004. Climate Change and India: Uncertainty Reduction in Greenhouse Gas Inventory Estimates, Universities Press India.
MNRE 2012. Ministry of New and Renewable Energy - 2012 Annual Report. MOLTMANN, S., HAGEMANN, M., EISBRENNER, K., HÖHNE, N., STERK, W., MERSMANN, F., OTT, H.,
WATANABE, R. & SCHALLABÖCK 2011. Quantifying emission reduction contributions by emerging economies. German Federal Environment Agency.
MONGABAY. 2012. President Rouseff vetoes some controversial changes to Brazil's Forest Code. Mongabay.com, 29 May 2012.
MURPHY, P. 2011. Rio de Janeiro to set up carbon trading exchange. London Green Financial, 12 Dec 2011. NAKHOODA, S., CARAVANI, A., BIRD, N. & SCHALATEK, L. 2011. Regional Briefing: Asia and the Pacific.
Climate Finance Fundamentals. Overseas Development Institute,. NDRC 2007. China’s National Climate Change Programme. Beijing: People’s Republic of China,. NOAA. 2005. National Weather Service: Climate Prediction Centre [Online]. Washington, DC: National Oceanic
and Atmospheric Administration. Available: http://www.cpc.ncep.noaa.gov/products/analysis_monitoring/ensostuff/ensofaq.shtml [Accessed].
ODI. 2012. Climate Funds Update [Online]. Overseas Development Institute and Heinrich Böll Stiftung. Available: http://www.climatefundsupdate.org/ [Accessed].
ONGC. 2012. Oil and Natural Gas Corporation Limited website [Online]. Available: http://www.ongcindia.com/Download/green.htm [Accessed 16 April 2012].
PETROCHINA 2011. 2011 Sustainability report. Beijing: PetroChina Company Limited,.

References
Report commissioned by the Centre for Development and Enterprise 76
PEZZA, A., SIMMONDS, I. & FILHO, A. 2009. Climate perspective on the large-scale circulation associated with the transition of the first South Atlantic hurricane. International Journal of Climatology, 29, 1116-1130.
PHILLIPS, D. 2011. Brazil's Oil Frontier: Sub-salt drilling could net billions of barrels. TXCHNOLOGIST. PIMENTA, F., KEMPTON, W. & GARVINE, R. 2008. Combining meteorological stations and satellite data to
evaluate the offshore wind power resource of Southeastern Brazil. Renewable Energy, 33, 2375-2387. PINTO, H. 2009. Adaptation in the Brazilian Agricultural Sector. Climate Change and Extreme Events in Brazil.
Sao Paulo: Lloyds. PRICE, L. & XUEJUN, W. 2007. Constraining Energy Consumption of China’s Largest Industrial Enterprises
Through the Top-1000 Energy-Consuming Enterprise Program. Proceedings of the 2007 ACEEE Summer Study on Energy Efficiency in Industry. Ernest Orlando Lawrence Berkeley National Laboratory.
RAJAMANI, L. 2011a. Deconstructing Durban. The Indian Express. RAJAMANI, L. 2011b. Deconstruction Durban. The Indian Express, 15 December 2011. REC-REGISTRY. 2012. REC Registry of India [Online]. Available: https://www.recregistryindia.in/ [Accessed 2
April 2012]. REIS, A. 2012. Brazil. In: HEMMER, P. (ed.) Climate regulation in 18 jurisdictions worldwide: Getting the Deal
Through. London: Law Business Research Ltd. RELIANCE INDUSTRIES. 2012. Reliance Industries Limited website [Online]. Available:
http://www.ril.com/html/business/exploration_production.html [Accessed 16 April 2012]. REMAIS, J. V. & ZHANG, J. 2011. Environmental Lessons from China: Finding Promising Policies in Unlikely
Places. Environ Health Perspect, 119. REMME, U., TRUDEAU, N., GRZYK, D. & TAYLOR, P. 2011. Technology development prospects for the
Indian power sector. International Energy Agency France; OECD. ROCKSTROM, J., STEFFEN, W., NOONE, K., PERSON, A., CHAPIN, F., LAMBIN, E., LENTON, T.,
SCHEFFER, M., FOLKE, C., SCHELLNHUBER, J., NYKVIST, B., WIT, C., HUGHES, T., LEEUW, S., RODHE, H., SORLIN, S., SNYDER, P., COSTANZA, R., SVEDIN, U., FALKENMARK, M., KARLBERG, L., CORELL, R., FABRY, V., HANSEN, J., WALKER, B., LIVERMAN, D., RICHARDSON, K., CRUTZEN, P. & FOLEY, J. 2009. A safe operating space for humanity. Nature, 461, 472-475.
RODRIGUES, F. & SOARES, M. 2009. Brazil Caught Between Oil, Politics, and Carbon Growth. Cutting Edge News, 30 November 2009.
ROVERE, E. 2011. Mitigation Action in Developing Countries: Country Study for Brazil. Rio de Janeiro: MAPS. ROVERE, E. & RAUBENHEIMER, S. 2011. Low Carbon Scenarios in Emergent Economies: the Brazilian Case. SDPC 2004. The People's Republic of China initial national communication on climate change. CHN/COM/1 B.
Beijing: State Development Planning Commission. National Coordination Committee on Climate Change.
SEARCHINGER, T., HEIMLICH, R., HOUGHTON, R., DONG, F., ELOBEID, A., FABIOSA, J., TOKGOZ, S., HAYES, D. & YU, T. 2008. Use of U.S. Croplands for Biofuels Increases Greenhouse Gases Through Emissions from Land-use Change. Science, 319, 1238-1240.
SEI 2011. Comparison of Annex 1 and non-Annex 1 pledges under the Cancun Agreements. Working paper WP-US-1107.
SINOPEC-CHINA PETROLEUM 2008. Sustainable Development Report 2008. Beijing: China Petroleum & Chemical Corporation,.
SONDE, R. 2007. Carbon Capture and Storage: Indian Perspective - Need for High End R&D and International Collaboration. Presentation at Overcoming Barriers to CC Deployment Workshop. Paris.
STERN, N. 2006. The Stern Review on the Economics of Climate Change, Cambridge, Cambridge University Press. STEWART, R., KINGSBURY, B. & RUDYK, B. 2009. Climate Finance for Limiting Emissions and Promoting
Green Development: Mechanisms, Regulation, and Governance. In: STEWART, R., KINGSBURY, B, AND RUDYK, B (ed.) Climate Finance: Regulatory and Funding Strategies for Climate Change and Global Development. New York: New York University Press.
THE PEW CHARITABLE TRUST 2012. Who's Winning the Clean Energy Race: 2011 Edition. Washington, DC.
THOMSON REUTERS 2010. Patented in China II: The Present and Future State of Innovation in China New York: Thomson reuters,.
TRENBERTH, K. E., JONES, P. D., AMBENJE, P., BOJARIU, R., EASTERLING, D., TANK, A. K., PARKER, D., RAHIMZADEH, F., RENWICK, J. A., RUSTICUCCI, M., SODEN, B. & ZHAI, P. 2007. Observations: Surface and Atmospheric Climate Change. In: SOLOMON, S., QIN, D., MANNING, M., CHEN, Z., MARQUIS, M., AVERYT, K. B., TIGNOR, M. & MILLER, H. L. (eds.) Climate Change 2007: The Physical Science Basis. Contribution of Working Group I to the Fourth Assessment Report of the Intergovernmental Panel on Climate Change. Cambridge Cambridge University Press.

References
Report commissioned by the Centre for Development and Enterprise 77
UNDP 2011. Human Development Report 2011 - Sustainability and Equity: A Better Future for All. New York: United Nations Development Program.
UNFCCC 2009a. Proposal from Bolivia on behalf of Malaysia, Paraguay and the Bolivarian Republic of Venezuela for an amendment to the Kyoto Protocol. . Copenhagen: Conference of the Parties Serving as the Meeting of the Parties to the Kyoto Protocol
UNFCCC 2009b. Submission from Brazil on subparagraph 1.b.i of the Bali Action Plan (mitigation by Annex 1 countries). United Nations Framework Convention on Climate Change.
UNFCCC. 2010. Letter from the Embassy of the Federative Republic of Brazil including nationally appropriate mitigation actions [Online]. Berlin: United Nations Framework Convention on Climate Change. Available: http://unfccc.int/files/meetings/cop_15/copenhagen_accord/application/pdf/brazilcphaccord_app2.pdf [Accessed 15 March 2012].
UNFCCC 2011a. Compilation of information on nationally appropriate mitigation actions to be implemented by Parties not included in Annex I to the Convention. FCCC/AWGLCA/2011/INF.1. Geneva: United Nations,.
UNFCCC 2011b. Proposals by India for inclusion of additional agenda items in the provisional agenda of the seventeenth session of the Conference of the Parties. Note by the Secretariat,.
UNFCCC. 2012. Clean Development Mechanism [Online]. United Nations Framework Convention on Climate Change. Available: http://cdm.unfccc.int/ [Accessed].
UNU-IHDP 2012. Inclusive Wealth Report, Measuring progress beyond GDP. Brochure. USEIA 2010. Country Analysis Brief: China. USG 2009. US leaked cable: Working with Brazil on climate change - An opportunity. Brasilia: United States
Embassy in Brasil. USG. 2012. United States Census Bureau [Online]. Available:
http://www.census.gov/population/international/data/idb/informationGateway.php [Accessed]. WB. 2012. World Bank Open Data [Online]. World Bank. Available: http://data.worldbank.org/ [Accessed March
2012]. WINKLER, H., JAYARAMAN, T., PAN, J., OLIVEIRA, A., ZHANG, Y., SANT, G., MIGUEZ, J., LETETE, T.,
MARQUARD, A. & RAUBENHEIMER, S. 2011. Equitable access to sustainable development: Contribution to the body of scientific knowledge. . Beijing, Brasilia, Cape Town and Mumbai: BASIC Expert Group.
WRI 2011. Climate Analysis Indicators Tool (CAIT) 9.0. Washington, DC: World Resources Institute. ZHAI, P. M. & PAN, X. H. 2003. Trends in temperature extremes during 1951–1999 in China. Geophysical
Research Letters, 30, 1913. ZHAI, P. M., ZHANG, X. & WAN, H. 2004. Trends in total precipitation and frequency of daily precipitation
extremes over China. Journal of Climate, 18, 1096–1108. ZHANG, J. F., MAUZERALL, D. L., ZHU, T., LIANG, S., EZZATI, M. & REMAIS, J. V. 2010. Environmental
health in China: progress towards clean air and safe water. Lancet, 375, 1110-1119. ZHOU, N., FRIDLEY, D., MCNEIL, M., ZHENG, N., KE, J. & LEVINE, M. 2011. China's Energy and Carbon
Emissions Outlook to 2050. Berkeley: Lawrence Berkeley National Laboratory.