The Resilience of Bergamot Farmers in the Reggio … · Title: The Resilience of Bergamot Farmers...
44
DISEI - Università degli Studi di Firenze Working Papers - Economics DISEI, Università degli Studi di Firenze Via delle Pandette 9, 50127 Firenze, Italia www.disei.unifi.it The findings, interpretations, and conclusions expressed in the working paper series are those of the authors alone. They do not represent the view of Dipartimento di Scienze per l’Economia e l’Impresa, Università degli Studi di Firenze The Resilience of Bergamot Farmers in the Reggio Calabria Province of Southern Italy F. Ciani, J. Huggard, T. Zervas Working Paper N. 25/2014
Transcript of The Resilience of Bergamot Farmers in the Reggio … · Title: The Resilience of Bergamot Farmers...

DISEI - Università degli Studi di Firenze
Working Papers - Economics
DISEI, Università degli Studi di Firenze Via delle Pandette 9, 50127 Firenze, Italia
www.disei.unifi.it The findings, interpretations, and conclusions expressed in the working paper series are those of the authors alone. They do not represent the view of Dipartimento di Scienze per l’Economia e l’Impresa, Università degli Studi di Firenze
The Resilience of Bergamot Farmers in
the Reggio Calabria
Province of Southern Italy
F. Ciani, J. Huggard, T. Zervas
Working Paper N. 25/2014

Title: The Resilience of Bergamot Farmers in the Reggio Calabria Province of Southern
Italy
Author names and affiliations: Federico Ciani (University of Florence and ARCO
Lab, via delle Pandette 9, 50127, Florence, Italy) [email protected]
Joseph Huggard (The Huggard Consulting Group, 94 rue de l’ horizon, Itzig, L-5960
Luxembourg) [email protected]
Thomas Zervas (The Huggard Consulting Group, 94 rue de l’ horizon, Itzig, L-5960
Luxembourg) [email protected]
Corresponding author: Federico Ciani (ARCO Lab, via delle Pandette 9, 50127,
Florence, Italy)
E-mail: [email protected]
Mobile: +39 3333740316
Skype: cianiskioppa
Classification code: Q12, I32, O13
Keywords: bergamot, resilience, socio-economic impact, essential oil

2
Abstract
Bergamot is a citrus fruit with more than 90% of the global production coming from
the Reggio Calabria province. It is used almost exclusively as an essential, high-
quality fragrance ingredient. A study was carried out to examine the impact of the
stability that has occurred in the bergamot sector after the reform of the bergamot
value chain in 2007. The objectives of this paper are (i) to measure the resilience of
bergamot producers, (ii) to highlight the structure of their resilience building strategy,
(iii) to assess the relevance of the bergamot production and the reform of the
bergamot value chain. Interviews with representatives of 326 households who
produce bergamot and are registered at the Consortium of Bergamot of Reggio
Calabria were carried out in three interview centres across the province in March and
April 2014, using a CAPI-adapted technique. The measurement of bergamot
producers’ resilience was based on the application of multivariate analysis techniques
and on the existing body of knowledge regarding social and ecological resilience. The
study demonstrated that almost 70% of interviewees have seen their income increase
by between 32% and 35% in the seven years to 2014. Bergamot was identified as
both being more profitable than other crops and contributing to farmers’ resilience by
increasing their access to networks. Using a simulation scenario approach, analyses
showed that if the cultivation of bergamot were no longer carried out it would induce a
decrease in producers’ resilience by 21%.
Acknowledgements
This study has been conducted by The Huggard Consulting Group in collaboration with
researchers from the department of Economics and Management of the University of
Florence, on behalf of the International Fragrance Association (IFRA) and Capua 1880.
We would like to thank Prof. Mario Biggeri of the Department of Economics and
Management of the University of Florence for his suggestions and assistance/advice.
We would like to thank prof. Donato Romano for sharing his expertise about social and
ecological resilience measurement.
Our gratitude goes also to Carmelo Spanti who shared with us his deep knowledge of
bergamot value chain.
We would also to thank Stephen Weller, Director of Communications of IFRA, the
University Mediterranea of Reggio Calabria, the Chamber of Commerce of Reggio
Calabria and the Consortium of Bergamot for their extensive support.

3
1. Introduction
Agriculture plays a significant role in Calabria’s economy. During the 1950’s, the
Italian land reform took place as a ten-year plan which focused on irrigation, land
transformation, mountain conservation and afforestation, agrarian reform, road
construction and the provision of public water supply (Dickinson, 1954). It resulted in
changing the dynamics and visual appearance of the region as the former large landed
estates, ‘latifundia’, were broken up and new small holdings were created. In addition,
the government invested in promoting the growing of commercial crops such as citrus
fruits, figs and chestnuts to supplement the traditional agricultural activities of the
region which were focused on growing cereals and olives and on the raising of sheep
and goats. Calabria is one of the poorest regions in Italy.
Nowadays, Calabria is characterised by small agricultural units with an average farm
size of 3.2 hectares, compared, for example, to France or Germany where the average
farm sizes are 55 and 56 hectares, respectively. These data indicate that the region
has many small and medium agricultural enterprises which produce crops mainly for
direct family consumption (Arzeni & Sotte, 2013). However, recently there has been
an increase on a regional level regarding the average farm size (from 3.2 hectares in
2000 to 4.0 hectares in 2010). The workers in a farm are mostly relatives of the farm
owner (72%), with foreign agricultural workers representing less than 14% of the
farm labour workforce.
This study focuses on the Reggio Calabria province, where bergamot production takes
place, near the Ionian coast, between the towns of Villa San Giovanni and Gioiosa
Jonica (Consorzio di Bergamotto)1.
The province is characterised both by a good agro-ecological potential but also by a
substantial fragility due to very substantial recent and historic deforestation and to a
climate that alternates between long droughts and rain storms (Ciancio et al., 1995).
Vines and olives are produced along with bergamot, clementines and other citrus
fruits. A large part of this province is taken up by the Aspromonte National Park which
contains thousands of hectares of pine forests on the Tyrrhenian side and beach on
the Ionian side. The olive production is the most significant both in terms of surface
area (41.6%) and number of farms (83.2%) involved, while citrus is at number three
with 12.4% of the land and 28.5% of farms (ISTAT, n.d.).
1 Available online: http://www.consorziodituteladelbergamotto.it/inglese.html

4
Bergamot is a citrus fruit (Citrus Bergamia Risso) which is yellow when ripe. It
blossoms in April and the fruit is harvested between November and March. More than
90% of the global production is coming from the Reggio Calabria province in southern
Italy. It is used almost exclusively as a fragrance ingredient. However, a small portion
of the production is used as a flavouring and in the pharmaceutical and cosmetics
industries. Approximately 1,200 hectares is under bergamot production with an
average crop of some 100,000 kg of the essential oil. To obtain 1 kg of oil,
approximately 200 kg of fruit are required. It is estimated that 6,000 people are
employed in the bergamot cultivation and the essential oil production (Consorzio di
Bergamotto, 2012).
Bergamot is a significant ingredient for the perfume industry where it is used in more
than 65% of women’s perfumes and almost half of men’s fragrances. Its sourcing
steps are the following:
• The bergamot crop is delivered from the farmer’s property to the processing
plants.
• Bergamot fruits are washed and any that are unsuitable are discarded.
• Using a variety of physical processes, the surface of the fruit which contains the oil
is abraded into a water medium.
• The oil is then separated from the water.
• It is then purified using high-vacuum distillation.
• The remains of bergamot fruit are mainly used as fertilizer but a small amount is
used in food and pharmaceutical production.
The Consortium for Bergamot oil of Reggio Calabria Tutelace is a regulatory body
which was reformed in 2007 and ensures that the bergamot essential oil produced in
the region meets the criteria set out by the European Union. In 2001, the European
Union created a Controlled Mark of Origin for essential oil from Reggio Calabria
bergamot. This covers all key aspects, including bergamot cultivation, extraction of
the essential oil and marketing. It also foresees the establishment of the Consortium
to monitor Reggio Calabria bergamot in all these stages. Unionberg is a consortium of
bergamot producers closely linked to the Consortium for Bergamot oil of Reggio
Calabria Tutelace. Unionberg has created agreements with the main bergamot
transformation industries to stabilise prices and relationships between demand and
supply.

5
The “Commission Decision of 5 July 2005 on the aid scheme which Italy plans to
implement for the protection of bergamots and bergamot derivatives in Calabria
(Notified under document number C (2005) 1814)” is the key piece of legislation.
Calabria receives funding from the EU through the European Regional Development
Fund (ERDF) in support of its programmes on regional development, economic
change, and enhanced competitiveness. Funding priorities include research,
innovation, environmental protection and risk prevention. Infrastructure investment
retains an important role (EC Regulation, 2006).
The aim of the study is two-fold. Firstly, to survey those involved with bergamot
production to understand the impact of the changes (the initiative of the Consortium
to stabilise the price of bergamot and restore a voluntary stockpile system for the
Consortium members) that have occurred in recent years and which has induced an
overall stability for the sector. Secondly, to measure the livelihood resilience of
bergamot farmers in the Reggio Calabria province. The objective is thus to identify the
structure of farmers’ resilience-building strategies and assess the role of bergamot
production in these resilience-building processes. This paper therefore sets out to
examine if techniques utilised in developing countries can be applied in this region
and, to what extent, this ‘new situation’ has impacted the resilience of those
households involved. The bergamot sector in Reggio Calabria depicts a stable and
sophisticated environment where an increasing number of producers is both interested
in increasing the quantity and improving the quality of the bergamot that they
produce. There are farmers in the area who have expanded their bergamot production
or have the intention to do so by purchasing more land, or by expanding their
bergamot cultivation, or both. This exemplifies the general attitude towards bergamot,
which is seen as a serious, long-term investment which could bring in a substantial
income to the household. Therefore, the study sets out to identify the impact of long-
term price stability of bergamot, a major fragrance and flavouring ingredient, on
households in Calabria, an economically depressed region in Italy.
2. Resilience of Social-Ecological Systems
Resilience – derives from the Latin ‘resalire’ meaning to spring back – has become a
widely used term in many disciplines ranging from psychology to ecology (Community
and Regional Resilience Institute, 2013). The concept of resilience is already well-
established in the ecological literature, but is comparatively new to socio-economic

6
systems (Alinovi et al., 2009 and 2010). In broad terms, resilience is a measure of a
system’s ability to withstand stresses and shocks, that is, its ability to persist in an
uncertain environment.
A key dimension of resilience is the ‘social-ecological system’ (SES). Natural resource
management relates not just to ecological or social issues, but to having multiple
integrated elements. Social-ecological systems have, inter alia, cultural, political,
social, economic, ecological, and technological components that interact together,
emphasising the ‘humans in nature’ perspective in which ecosystems are integrated
with human society (Resilience Alliance, 2010).
From the social sciences’ perspective, the link between social and ecological resilience
is the dependence of communities, and their economic activities, on ecosystems,
showing that the two systems have synergistic and co-evolutionary relationships. It is
evident that the resilience of a social system is related to the resilience of the
ecological system on which the former depends. This is more evident for social
systems that are dependent on a single ecosystem or a single resource. In addition,
analysis of the resilience of ‘institutions’, including habitualised behaviour, the rules
and norms that govern society as well as the more usual notion of formal institutions
with memberships, constituencies and stakeholders, which govern the use of natural
resources and create incentives for sustainable or unsustainable use within social
systems, is a central component linking social and ecological resilience (Adger, 2000).
This study adapted the resilience concept (Alinovi et al., 2009 and 2010) developed
within the environmental context to the livelihood strategies and agricultural
production of households in a rural setting in southern Italy.
3. Data & Methods
Two bespoke questionnaires were developed for both household and community levels
that enabled the resilience of target group to be evaluated.
The ‘household’ questionnaire consisted of 150 items and its administration lasted
approximately 45 minutes. The interviewees were all bergamot producers of the
province of Reggio Calabria, members of the Bergamot Consortium (Unionberg
Association). The sample for interview was drawn from a list of approximately 350
farmers who are currently members of the Consortium (Unionberg Association). This
list was provided by the President of the Consortium of Bergamot. These farmers were
the target group for interviews, irrespective of the location and the size of farm. Part

7
of the items of the questionnaire were retrospective: since the reform of the Bergamot
Consortium took place in 2008, a seven-year interval was used in order to capture the
possible differences that might have occurred due to the stabilisation of the bergamot
prices.
During this phase 326 farmers were interviewed using the bespoke questionnaire. The
interviews were carried out in three centres established in the villages of San
Gregorio, Bianco and Condofuri. The farmers, who were interviewed in each centre,
were mostly from the nearby area (Table 1).
Table 1 – Geographical Distribution of Interviews
Centre Frequency %
Bianco 136 41.72%
Condofuri 58 17.79%
San Gregorio 132 40.49%
Total 326 100.00%
Source: Authors’ elaborations
The ‘community’ questionnaire was an adaptation of the ‘household’ questionnaire
retaining the items which were relevant to be asked at a community level. The
‘community’ questionnaire consisted of 100 items and was administered over
approximately 30 minutes. ‘Community’ interviews were conducted in two villages
where bergamot is produced and also in two ‘matching’ villages where bergamot is not
produced, in order to have a well-defined idea of the context.
In addition, reports on Calabria were obtained from the Italian National Institute of
Statistics (ISTAT). This public research organisation provides high-quality statistical
information, analyses and forecasts on national and regional level.2 The combination
of the ‘community’ questionnaire along with the research from ISTAT, provided
valuable insights on the socio-economic status of the Calabria population and helped
create a more complete image of the setting for the study.
As the concept of resilience is being more widely used in the field of social science, the
effort to find more pragmatic methodologies to measure it has led to different
approaches (Carter et al., 2006; Keil, 2008; Alinovi et al., 2009 and 2010). The
approach developed by Alinovi and colleagues (2009 and 2010) has been adopted by
the FAO in order to identify and measure the household resilience to food insecurity
and, on a larger scale, the resilience of food systems. This approach, with some
2 Available online: http://www.istat.it/en

8
modifications (Ciani, 2012) has been used in this study. This is based on the concept
that resilience, while not being directly observable, can be conceptualised as a latent
variable and thus estimated through a factor analysis procedure. Factor analysis was
initially used in psychometric studies aimed at the measurement of human intelligence
(Bartholomew et al., 2008). Factor analysis starts by examining how a set of observed
variables co-vary and seeks to extract a set of factors that explain why the observed
variables co-vary in a given way. The objective is to model the covariates with the
minimum number of factors. The better the explanatory power of the first n factors is,
the more the n factor model can be considered satisfactory. The relationship between
the observed variables and each factor can then be interpreted to explain the factor
itself. In this case, the framework is further complicated by the two stages structure
of the model because resilience is not estimated directly from a set of observed
variables but from a set of latent resilience components which are, in turn, derived
from a set of observed variables. In this case, both in the first and in the second
stage, the objective is to have a set of one-factor, factorial models where the only
factor retained represents a resilience latent component (in the case of first stage
models) or the resilience index (in the case of the second stage factorial model).
In the case of bergamot and of southern Calabria, a further challenge for the study
was readapting this approach to address the context of a high-income country and
reflect a more general definition of resilience to economic insecurity/shock. The
analysis implemented in this project focuses on the household unit because it is at this
level that most risk management practices and coping strategies are implemented.
Moreover, decisions concerning the household agricultural business are usually taken
at the household level and the consequences of these decisions usually impact the
entire household.
The general resilience model is an approach that derives an index (latent variable,
i.e., it cannot be observed directly), from combining, using mathematic techniques,
the resilience components (in the study of Alinovi and colleagues (2010), which was
the basis for our study, there were eight resilience parameters): Income & Food
Access (IFA), Access to Basic Services (ABS) Social Safety Nets (SSN),
Agricultural Assets (AA), Agricultural Practice & Technologies (APT), Non
Agricultural Assets (NAA), Stability (S), and Adaptive Capacity (AC). These
eight components are also not directly observable but are developed by combining
observable variables. For example, the resilience component Income & Food Access is

9
derived from per capita income (INC), per capita expenditure (EXP), etc. Within each
observed variable, there is a set of questions (items) which measures this variable.
The first resilience component in the study – Economic Connectivity (EC) derives from
the Income and Food Access (IFA) resilience parameter which was used in previous
studies in Kenya (Alinovi et al., 2010) and Palestine (Alinovi et al., 2009). However,
since this study was conducted in a high income country which does not face the
challenge of food shortage as is the case in the previous two contexts, it was decided
to adjust this parameter and focus only on income.
In order to measure resilience, observable variables consistent with the
methodological approach were developed for addressing via the questionnaire. It was
critically important that each variable was only included once in the model. Thus,
careful attention was paid to assigning any variables that were relevant for more than
one component. While drafting the overall structure of the research, the study by
Alinovi and colleagues (2010) was used as starting point to develop a new
questionnaire targeted on the context under analysis and on the topic of this research
(i.e. livelihood resilience). This meant both reviewing literature and research relevant
to Calabria and consulting with key stakeholders.
Using this approach, ultimately, seven resilience components were developed:
Economic Connectivity (EC), Agricultural Assets and Technologies (AAT), Non
Agricultural Assets (NAA), Access to Economic Resources (AER), Social
Networks and Information (SNI), Household Structure (HS), Human Capital
(HC) (Figure 1).
In addition, the questionnaire was designed in such a way to minimise the risk of
incomplete or inaccurate information. For example, as there were questions of
sensitive nature concerning income, it was decided to include additional questions
related to household assets that are useful to impute missing value and to check the
reliability of responses to direct questions related to income.

10
Figure 1 – Bergamot Resilience Index Conceptual Framework
Source: Authors’ elaborations
4. Results
Almost all of the producers interviewed are owners of the farm they cultivate (322 out
of 326). In addition, 96% of the interviewees reported their farms being run
exclusively by their household. These findings reinforce existing data which show that
the agricultural land is mostly inherited from one generation to the other and that
agricultural production remains a strictly family business.
Despite the bulk of the agricultural enterprises covered by the survey being
household-managed, the production is heavily market oriented. Currently, the survey
showed that for 88.85% farms more than 90% of production is sold on the market.
This percentage increased slightly over last seven years (in 2007 it was 85.08%).
As expected, the majority of labour force in the farms in this survey consists of
household members. In the 81% of farms there are no permanent workers with only
2.73 of farms reporting more than 1 permanent worker. This picture does not change
substantially if we compare the current situation to that of seven years ago: only
4.6% of farms (15 farms) experienced a variation in the number of permanent
workers (positive in 12 cases and negative in 3).
The situation is substantially different if we take into consideration seasonal workers.
The use of seasonal work is widespread in the study sample. It is interesting to note
that the use of seasonal workers increased in more than half of the cases (53.99%).
This point is extremely relevant if one considers the extremely negative employment
situation in Calabria during this period. This underlines both the potential and actual
Observable
Parameters
Resilience Index
Economic
Connectivity
Agricultural
Assets and
Technologies
Non-
Agricultural
Assets
Access to
Economic
Resources
Social
Networks &
Information
Household
Structure
Human
Capital
… … … … … … … … …
e.g.
Income
e.g. Access
to Credit e.g.
Irrigation

11
role of agriculture in general, and of bergamot cultivation in particular, as a means to
create job opportunities in the region. As expected, the use of non-household labour is
directly proportional to farm size both for permanent and seasonal workers. Figure 2
shows the evolution of the number of permanent and seasonal workers comparing the
current situation and that of seven years ago.
Figure 2 – Average Number of Permanent and Seasonal Workers
Source: Authors’ elaborations
Agricultural activities are slowly becoming a steady source of income. When asked
whether they think that it would be possible for them to live exclusively from their
agricultural activities, 26% of interviewees answered ‘yes’ while 71% responded ‘no’.
For the same question, with reference to seven years ago and before the bergamot
stabilisation of prices, the results were 15% and 79% respectively. In both cases a
small percentage did not express an opinion.
Moreover, 71% of respondents replied that their farming activities are profitable
compared to seven years ago that only 30% of them thought the same (Figure 3).
Figure 3 – Do you Believe your Farming is Profitable?
3% 30%
71%
67%
29%
7 years ago
Now
No response Yes No
Source: Authors’ elaborations
This significant upward trend explains why 84% of farmers are planning investments
in their agricultural activities in the next three years. These investments vary and the

12
most commonly cited were: planting new bergamot trees, purchase of new
equipment, purchase of land and improvement of the irrigation system. It should be
noted however that in the last seven years only a small percentage (27%) of farmers
has obtained funding from public grants. In addition, as 75% of farmers report having
sufficient information regarding possible ways of funding for their agricultural
holdings, the causes for such low funding rates among them would appear to derive
elsewhere e.g., long bureaucratic procedures, difficulty to obtain grants, inadequate
funding which discourages farmers from applying, etc. However, farmers continue to
believe that their agricultural enterprise will grow as 73% of participants answered
that they have a positive or very positive view for their future in agriculture.
Table 2 shows what is the primary occupation of the participants and the members of
their household. This helps form a clear picture of the demographic, occupational and
social distribution of the sample under study. It is worth noting that the percentage of
persons who list farming, as a primary occupation, is quite low. This seems to suggest
that for these households agriculture is a supplementary source of income.
Table 2 – Primary Occupation
Sector % (Members 15-75)
Public Sector 19.18%
Commerce 4.68%
Private Sector: Employees 1.80%
Private Sector: Entrepreneurs/Freelance Professionals 12.23%
Agriculture 14.39%
Students 10.91%
Pensioners 22.78%
Unemployed 7.43%
Other 1.08%
Source: Authors’ elaborations
It is worth noting that apart from the primary and secondary occupation of the
members of the household, the questionnaire also considered other fixed sources of
income such as pensions, savings, rent from property or from other types of
investment. However the results obtained showed that these additional sources of
income are quite limited in those sampled. Pensions were the most common steady
source of income and about one-third (33.4%) were in receipt of these.
Bergamot has become a stable and secure source of income and this is shown by the
intention of the participants to expand their bergamot production in the next three
years (Figure 4).

13
Figure 4 – Intention to Expand Bergamot Production
85%
14%
1%
Yes
No
No response
Source: Authors’ elaborations
These planned investments would include improving the management of the existing
farm, creating a new bergamot farm or purchasing an already existing bergamot farm
(Figure 5).
Figure 5 – Types of Future Investments in Bergamot Production
43%
46%
11%
0% 0%Improve Management of
Existing Farm (207)
Create New Bergamot
Farm (222)
Purchase Existing
Bergamot Farm (52)
Other (1)
No Response (1)
Source: Authors’ elaborations
In 9.8% of farms, the area cultivated with bergamot has expanded over the last seven
years. The production of bergamot has grown in 69.94% of farms while it has
decreased in only 8.9% of cases. The profit resulting from bergamot production has
also increased in 84.97% of farms. It is interesting to notice that the increase in profit
is maintained if profit per ha (increased in 87.73% of cases) is considered rather than
just total profit. Bergamot profit margin (i.e. the ratio between profit and total
production value) increased in 69% of farms (while it has decreased only in 14% of
cases). It seems reasonable to hypothesize that these widespread and positive
changes can be associated with the reform of the bergamot value chain.
Besides its impact on prices and profits, the effect of the bergamot value chain reform
is clear if we take into consideration how the use of marketing channels has changed
in the years following the reform (Table 3). In 2014 the bulk of bergamot production

14
(87.42%) was sold through the consortium while in 2007 this share was below 20%.
On the contrary, the direct selling to transformation industries (identified as one of the
main causes of price instability and quality uncertainty) has been significantly reduced
(from 61.96% to 10.12%).
Table 3 – Where Do Producers Sell Bergamot?
Prevailing Marketing Channel 2014 2007
Bergamot Consortium 87.42 18.71
Transformation Industries 10.12 61.96
Final Consumer - 0.31
Middle Men 0.61 10.43
Local Market 0.61 2.15
Other 0.61 5.52
Uncultivated field 0.61 0.92
Source: Authors’ elaborations
This overall positive picture is confirmed if the level of household income and its
evolution is analysed. When questioned regarding their income, 69.94% of bergamot
producers reported that their earnings have increased over the last 7 years, 22.70%
didn’t report any variation, while only 7.36% experienced an income loss. For those
households who experienced an income growth (69.94%), the average increase was
around 33% with no significant changes among the different income groups. This is
against a real income decrease for all of Italy of 13% between 2007 and 2013 as
reported by the International Monetary Fund (IMF, 2013). On average, incomes in
Calabria, one of the most depressed regions in Italy, are only 50% of those in the
North. Table 4 reports the average increase for each income distribution quartile (only
for those households which saw their income increase over the last seven years).
Table 4 – Increase in Household Income
Groups (Farmers with Income Increase) Increase (%)
Total Sample 33.43%
1st Quartile of Income Distribution 34.76%
2nd Quartile of Income Distribution 32.29%
3rd Quartile of Income Distribution 33.49%
4th Quartile of Income Distribution 33.79%
Source: Authors’ elaborations
With regard to the level of financial stability perceived by the interviewed households,
it is possible to note that only 6.48% of households find it extremely difficult to
manage monthly family needs while more than 20.99% of households do not perceive
any difficulty at all. About one third of interviewed households perceived a change in
their economic condition over the last seven years. A critical finding, if one takes into

15
consideration the economic crisis, is that the percentage of farmers who cope with
their monthly needs easily has increased in the last seven years by more than 6%
(from 15.43% to 20.99%). Figure 6 shows farmers’ perception regarding their ability
to cope with monthly needs now and seven years ago. The figure seems to suggest
that there is a sort of polarisation process with a substantial decrease of the share of
households managing fairly easily (from 52% to 33%), while both the share of
households experiencing some difficulty and of those managing very easily increased
over the years. This depicts that “the middle class” could be vulnerable and this may
need to be addressed.
Figure 6 – How do Households Meet Their Monthly Needs?
Source: Authors’ elaborations
Overall, the agricultural enterprises participating in the survey report being dynamic
to a certain degree (increasing value of production, increasing profitability, increasing
labour demand). This finding is quite significant when considered in the context of a
very depressed economic environment. The effect of the bergamot value chain reform
on producers is evident. The production of bergamot as well as the profitability of the
sector has increased steadily. The impact on the marketing channels is clear: the
renewed central role the Consortium is a crucial asset for the whole value chain.
These achievements have an impact on the general attitude of producers relative to
their farming activity: producers’ widespread optimism and pro-active approach
towards the future is maybe the most important result of the reform of the sector.
4.1. Resilience-Based Approach
Using the raw data from the interview study, we applied the concept of resilience in
order to explore further implications that the bergamot production might have on
farmers’ livelihood strategies. As already noted, household resilience is not directly

16
observable and, as such, is considered a latent variable. In accordance with the model
employed, resilience is based on different components that are also latent variables
which, in turn, are derived from a set of observed variables. Seven possible latent
resilience components have been identified. This section will first explain, in detail,
the composition of each subsidiary latent variable and then how these components
have been combined to compute an overall resilience index.
The seven components are:
• Economic Connectivity (EC)
• Agricultural Assets and Technologies (AAT)
• Non-Agricultural Assets (NAA)
• Access to Economic Resources (AER)
• Social Networks and Information (SNI)
• Household Structure (HS)
• Human Capital (HC)
Each component has been estimated through a standard factor analysis where the
value of the component is the factorial score (loading) of the first factor extracted by
the analysis. The first stage factorial analysis has been calibrated so that (i) the signs
of the loadings are coherent with the theoretical framework and (ii) the first factor can
be considered valid if it meets at least two of the three criteria (i.e. scree plot curve,
explained variance higher than 70% and Eigen value greater than 1). The factor
loadings have been computed through the Bartlett method (Bartlett, 1937). The
following sub-sections examine each of these components/factors in turn. In the
following sub-section, the results of the estimations will be reported and briefly
commented. In particular the signs of the coefficients will be discussed. Moreover, the
results tables will report also the variable mean and the standard deviation. The
variable mean is a measure of the position of the variables and the standard deviation
is a measure of the dispersion of a set of data from its mean. The wider the spread of
the data, the higher the deviation.
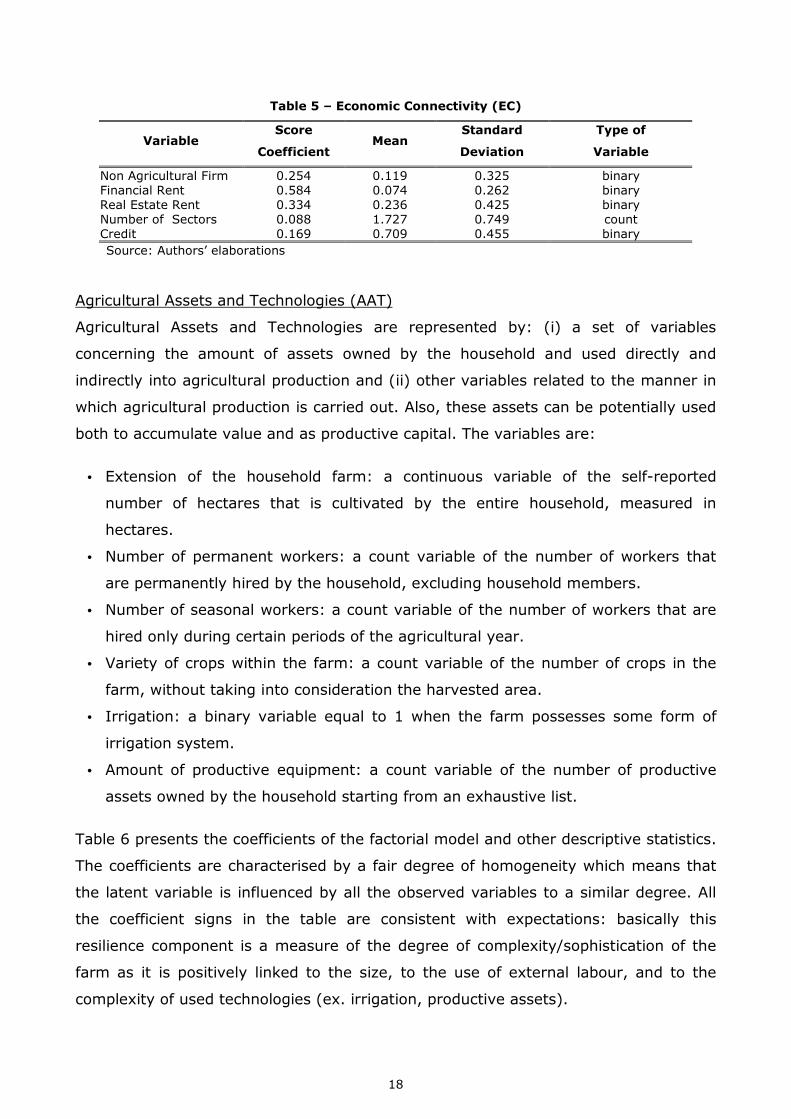
Economic Connectivity
The Economic Connectivity of a household is its ability to be connected to several
markets and income generating opportunities. The model considers that the higher
the household economic connectivity, the higher its ability to withstand shocks (Ciani,
2012). In the case of bergamot producers, the observable variables used to compute
the latent resilience component are:

17
• Ownership of non-agricultural firms: a binary variable equal to 1 if at least one
household member owns a non-agricultural firm.
• Income from financial assets: a binary variable equal to 1 if the household
receives returns from financial assets.
• Income from real estate assets: a binary variable equal to 1 if the household
receives a rent from property assets.
• Number of sectors in which the household members are active: a count variable.
• Access to credit market: a binary variable equal to 1 if the household has actual
or potential access to credit.
Table 5 reports the descriptive statistics and the coefficients used to compute the
factorial scores.
The type of variable is also specified in the last column. The reported statistics are
variable mean and standard error. The score coefficients indicate how observable
variables are linked to this latent resilience component. This means that, given a
certain value of a variable, a higher absolute value of the coefficient is linked to a
higher (positive or negative, according to the coefficient sign) value of this resilience
component (i.e. the latent variable). The sign of the coefficient indicates whether the
relationship between the observed variable and the latent resilience component is
direct or inverse. Clearly, it is important to carry out a plausibility check on the sign of
the coefficient. This insures, in this case, for example, that more sources of income do
not lead to lower economic connectivity. For this latent variable, the number of
sectors where the household is active has a relatively low coefficient, while the others
are both higher and more homogenous. This difference in coefficient size is due to the
characteristics of the variables. All the variables, except for the number of sectors in
which the household members are active, are binary. It means that the impact of
these variables on the scores can be 0 or 1 times the coefficient (i.e. the value of the
coefficient). The number of sectors on the contrary is a count variable ranging from 1
to 4 in the dataset. This means that the impact of this variable on the factors scores
ranges from 0.088 to 4 times 0.088=0.352. The coefficient signs in the table are
consistent with expectations.
18
Table 5 – Economic Connectivity (EC)
Variable Score
Coefficient Mean
Standard
Deviation
Type of
Variable
Non Agricultural Firm 0.254 0.119 0.325 binary
Financial Rent 0.584 0.074 0.262 binary
Real Estate Rent 0.334 0.236 0.425 binary
Number of Sectors 0.088 1.727 0.749 count
Credit 0.169 0.709 0.455 binary
Source: Authors’ elaborations
Agricultural Assets and Technologies (AAT)
Agricultural Assets and Technologies are represented by: (i) a set of variables
concerning the amount of assets owned by the household and used directly and
indirectly into agricultural production and (ii) other variables related to the manner in
which agricultural production is carried out. Also, these assets can be potentially used
both to accumulate value and as productive capital. The variables are:
• Extension of the household farm: a continuous variable of the self-reported
number of hectares that is cultivated by the entire household, measured in
hectares.
• Number of permanent workers: a count variable of the number of workers that
are permanently hired by the household, excluding household members.
• Number of seasonal workers: a count variable of the number of workers that are
hired only during certain periods of the agricultural year.
• Variety of crops within the farm: a count variable of the number of crops in the
farm, without taking into consideration the harvested area.
• Irrigation: a binary variable equal to 1 when the farm possesses some form of
irrigation system.
• Amount of productive equipment: a count variable of the number of productive
assets owned by the household starting from an exhaustive list.
Table 6 presents the coefficients of the factorial model and other descriptive statistics.
The coefficients are characterised by a fair degree of homogeneity which means that
the latent variable is influenced by all the observed variables to a similar degree. All
the coefficient signs in the table are consistent with expectations: basically this
resilience component is a measure of the degree of complexity/sophistication of the
farm as it is positively linked to the size, to the use of external labour, and to the
complexity of used technologies (ex. irrigation, productive assets).

19
Table 6 – Agricultural Assets and Technologies (ATT)
Variable Score
Coefficient Mean
Standard
Deviation
Type of
variable
Farm Size 0.206 7.017 15.777 continuous
Permanent Workers 0.146 0.309 0.822 count
Seasonal Workers 0.282 3.666 3.299 count
Crops Variety 0.183 1.785 1.021 count
Irrigation 0.343 0.966 0.181 binary
Productive Assets 0.253 3.933 1.497 count
Source: Authors’ elaborations
Non-Agricultural Assets (NAA)
Non-Agricultural Assets are other assets owned by the household that can increase or
decrease in value but which represent household wealth. They also reflect past flows
of resources in and out of the household. The selected variables are:
• Value of the house owned by the household: a continuous variable of the self-
reported value in euros, in case the household owns the house where they are
living.
• Number of cars owned by the household: a count variable.
• Household ability to accumulate savings over the last three years: household
members were asked to indicate whether during the last three years they were
able to save money, were compelled to spend previously accumulated money, or
spent all money earned. This was modelled as a binary variable as households will
never consistently balance their budgets so overall they are either over- or under-
spending.
Table 7 reports the main results of the factorial analysis. Note that the mean of the
house value has a different scale if compared to the other values. It is due to the
magnitude of the variable. This factor does not affect the estimation as all the values
are standardised3. The coefficients are characterised by a fair degree of homogeneity
which means that the latent variable is influenced by all the observed variables to a
similar degree. All the coefficient signs in the table are consistent with expectations.
3 In other words, the factor is extracted directly from the correlation matrix and not from the covariance matrix (where the magnitude and the unit of measure matter).

20
Table 7 – Non-Agricultural Assets (NAA)
Variable Score
Coefficient Mean
Standard
Deviation
Type of
Variable
House Value 0.655 176625.802 133595.935 continuous
Number of Cars 0.520 1.589 0.794 count
Ability to Save 0.281 0.123 0.329 binary
Source: Authors’ elaborations
Access to Economic Resources (AER)
Access to Economic Resources is one of the basic dimensions of the resilience building
process as both the level and the variability of income flows are key factors.
These variables are:
• Profit from agricultural activities: a continuous variable for the self-reported
amount of money in euros that the household obtains from its agricultural
activities, remaining after paying for inputs, wages, etc.4
• Monthly income: a continuous variable of the self-reported amount of money in
euros available monthly to cover household needs.
• Gap income-needs: a continuous variable of the difference between monthly
income and the amount of money identified as ‘sufficient to live without problems’
by the respondent. The variable can be higher, lower or equal to zero according to
the degree of satisfaction of households’ needs. The gap is measured in euros and
has a positive value when the actual income is less than the desired income.
The score coefficients and other descriptive statistics are reported in Table 8. The
coefficients are characterised by a fair degree of homogeneity which means that the
latent variable is influenced by all the observed variables to a similar degree. All the
coefficient signs in the table are consistent with expectations.
Table 8 – Access to Economic Resources (AER)
Variable Score Coefficient Mean Standard
Deviation
Type of
Variable
Agricultural Profit 0.235 13102.084 28443.667 continuous Monthly Income 0.627 2338.389 1137.563 continuous
Gap Income-Needs 0.455 321.045 1025.187 continuous
Source: Authors’ elaborations
4 It should be noted that for the scope of this report the term ‘profit’ includes both land rent and the implicit wage that the household pays to the household members involved in the production.

21
Social Networks and Information (SNI)
Access to Social Networks and Information can increase the range of opportunities for
the household, particularly in case of shocks and perturbations. In this case the
variables selected to represent this phenomenon are:
• Share (percentage) of household members belonging to farmers’ organisations,
trade unions etc. (apart from the Bergamot Consortium) – a continuous variable.
• Responsible position in NGO: a binary variable equal to 1 when at least one
member of the household holds a responsible position within an organisation.
• Sufficient access to support for what concerns farm-related issues: a binary
variable equal to 1 if the respondent claims to receive sufficient support when
applying to receive subsidies, grants etc.
• Access to information: a binary variable equal to 1 if the respondent claims to be
sufficiently informed about the opportunities of receiving support from public
institutions on farm-related issues.
The score coefficients and other descriptive statistics are reported in Table 9. While
the coefficients are characterised by a fair degree of homogeneity which means that
the latent variable is influenced by all the observed variables to a similar degree, the
quality of participation is significant, as the variable ‘responsible position in NGO’ is
the one characterised by the highest coefficient.
All the coefficient signs in the table are consistent with expectations.
Table 9 – Social Networks and Information (SNI)
Variable Score
Coefficient Mean
Standard
Deviation
Type of
Variable
Share of Household Members
who are Part of an NGO
0.107 0.320 0.339 continuous
(limited 0/1) Responsible in NGO 0.590 0.071 0.256 binary
Sufficient Support 0.352 0.752 0.433 binary
Sufficient Information 0.446 0.816 0.388 binary
Source: Authors’ elaborations
Household Structure (HS)
The Household Structure dimension is related to the demographic composition of the
household. The argument advanced is that the demographic structure of the
household may be related to the household’s ability to react to a shock (e.g. a
household with a higher prevalence of people aged 18-65 has a larger labour force
related to its size). The variables used to approximate this dimension are:

22
• Household demographic dependency ratio: it is the ratio between the number of
household members who can be defined as dependents (i.e. people younger than
15 and older than 64) to the number of household members aged 15-64. A
continuous variable.
• Number of first degree relatives (i.e. father, mother, husband, wife, brothers,
sisters, sons or daughters of the interviewed person) who are not living in
Calabria anymore. A count variable.
Table 10 reports the score coefficients and descriptive statistics about the variable. It
is worth underlining that this is the only negative factor which is positively correlated
with demographic dependency and emigration. In other words, this factor is expected
to be negatively correlated with household resilience.
Table 10 – Household Structure (HS)
Variable Score
Coefficient Mean
Standard
Deviation
Type of
Variable
Demographic Dependency Ratio 0.706 0.058 2.253 continuous Emigration from the Household 0.590 1.331 2.435 count
Source: Authors’ elaborations
Human Capital (HC)
Human capital is a pivotal component of a household’s resilience. The higher the
human capital of a household, the higher its flexibility and its ability to seize
opportunities and change behaviours. The variables used to estimate this dimension
are:
• The maximum degree of education achieved within the family: it is the highest
degree of education (elementary, junior high school, senior high school, university
or more) reached by one of the members of the household. An ordinal variable.
• The degree of education (elementary, junior high school, senior high school,
university or more) achieved by the household head. An ordinal variable.
• The percentage of English speaking members of the household. A continuous
variable.
• The percentage of household members who can use a computer. A continuous
variable.
• The percentage of household members who can use the Internet. A continuous
variable.

23
Table 11 – Human Capital (HC)
Variable Score
Coefficient Mean
Standard
Deviation
Type of
Variable
Max Education among Household
Members
0.194 3.429 0.748 ordinal
Household Head Level of Education 0.193 3.015 0.946 ordinal
Percentage of English Speaking
Members of the Household
0.151 0.474 0.401 continuous
(limited 0/1)
Share of Computer Users among the
Household Members
0.315 0.726 0.343 continuous
(limited 0/1)
Share of Internet Users among the
Household Members
0.306 0.715 0.344 continuous
(limited 0/1)
Source: Authors’ elaborations
Table 11 shows the main results of the factorial analysis and some descriptive
statistics. The coefficients are characterised by a fair degree of homogeneity which
means that the latent variable is influenced by all the observed variables to a similar
degree.
Following the methodology used by Alinovi and colleagues (2008 and 2010) and
modified by Ciani (2012), the factorial scores have been used to compute the overall
resilience index. The Household Structure component was not included in the model
for three main reasons. Firstly, it substantially decreased the share of variance
explained by the first factor extracted (i.e. the resilience index). Secondly, the
coefficient relative to this component would be very low. Thirdly, the sign is not
expected as it is positively related to the resilience index while the expected sign was
negative. Previous experience with the model suggests that this occurs when the
component is not an appropriate one or is inconsistent with the model. As will be
shown later, the consequences of the exclusion of the Household Structure
component from the resilience index have been checked. The exclusion of this
dimension from the index does not affect the validity of the index itself for several
reasons. Firstly, the resilience definition is inherently context based. As a
consequence, it is quite expected that a component that is relevant for resilience-
building in a specific context is not in another one. Secondly, the low value of the
Household Structure dimension coefficient might arise as a consequence of two
opposite effects cancelling out each other. On one hand, having more elderly persons
within a household tends to reduce resilience (weaker labour force, usually lower
endowment of human capital etc.); on the other, it tends to increase the number of
persons receiving an income from pension (i.e. a stable and reliable income).

24
Table 12 reports the scoring coefficients of the six resilience indices and other
descriptive statistics, excluding the Household Structure component. All coefficients’
signs are positive. As would be expected, a higher level of resilience is linked to
higher economic connectivity, to the complexity of the agricultural firm, to a higher
value of households’ assets, to a more effective access to income and income
generating opportunities, to a more intensive level of participation and involvement
in social networks and to having greater human capital.
It is valuable to use the resilience index to develop different resilience profiles5. This
can be done by stratifying the population according to some variable of interest: in
other words, we observe the average value of the resilience index and of the
resilience components in each strata and identify meaningful differences. In this case,
the values of the resilience index have been stratified according to the size of the
farms. The population has been classified in five categories according to the size of
their farms.
Table 12 – Resilience Index and Its Components
Variable Score
Coefficient Mean
Standard
Deviation
Resilience Index (RI) - 0.348 0.282
Economic Connectivity (EC) 0.313 0.425 0.298
Agricultural Assets and Technologies (ATT) 0.268 0.418 0.406
Non Agricultural Assets (NAA) 0.318 0.116 0.875
Access to Economic Resources (AER) 0.238 0.404 0.672
Social Networks and Information (SNI) 0.176 0.842 0.384
Human Capital (HC) 0.301 0.176 0.498
Source: Authors’ elaborations
Table 13 reports the frequency of the sizes of the farms into five categories.
Table 13 – Farm Size
Farm Size (ha) Frequency % % cum
0-1 86 26.38 26.38
1-2 54 16.56 42.94
2-5 86 26.38 69.33
5-10 56 17.18 86.50
10+ 44 13.50 100.00
Total 326 100.00 -
Source: Authors’ elaborations
As you can see in Figure 7, as expected, household resilience is directly proportional
to the farm size, even if it is quite clear that the relation is not proportional, while the
5 It is worth to underline that we have one single resilience index. We are simply going to observe how its values vary in different population groups identified by the distribution of a relevant variable.

25
difference between the fifth group and the fourth one is much more significant than,
for example, the difference between the fourth and the third. This trend continues.
Additional insights can be obtained on the resilience strategies adopted by the
households analysed by examining the average value of the components of the
resilience index in the total population and in each single farm size class.
Figure 7 – Household Resilience and Farm Size
0
0.1
0.2
0.3
0.4
0.5
0.6
0-1 ha 1-2 ha 2-5 ha 5-10 ha 10+ ha
Farm Size
Source: Authors’ elaborations
Figure 8 presents the ‘average shape’ of the resilience strategy in the population. The
figure highlights the very important role played by the access to social networks and
information. This result may be explained by the involvement of farmers’
organisations and in particular to their ability to assist farmers in obtaining support
from local institutions e.g. from the regional government6.
6It is worth to remember that the distribution of EU funds for agriculture, rural development and economically depressed areas is usually managed by the regional government.

26
Figure 8 – Household Resilience Strategy Shape and Farm Size
Source: Authors’ elaborations
0
0.2
0.4
0.6
0.8
1
1.2
1.4
1.6
1.8
2
EC
AAT
NAA
AER
SNI
HC
(1) Total Sample
0
0.2
0.4
0.6
0.8
1
1.2
1.4
1.6
1.8
2EC
AAT
NAA
AER
SNI
HC
(2) Farm Size: 0-1 ha
0
0.2
0.4
0.6
0.8
1
1.2
1.4
1.6
1.8
2EC
AAT
NAA
AER
SNI
HC
(3) Farm Size: 1-2 ha
0
0.2
0.4
0.6
0.8
1
1.2
1.4
1.6
1.8
2EC
AAT
NAA
AER
SNI
HC
(4) Farm Size: 2-5 ha
0
0.2
0.4
0.6
0.8
1
1.2
1.4
1.6
1.8
2EC
AAT
NAA
AER
SNI
HC
(5) Farm Size: 5-10 ha
0
0.2
0.4
0.6
0.8
1
1.2
1.4
1.6
1.8
2EC
AAT
NAA
AER
SNI
HC
(6) Farm Size: 5-10 ha

27
The stratified analysis allows for a further interesting observation – the shape of the
resilience strategy is not radically different across farm size classes. This supports the
approach taken in this study of focusing on the impacted (bergamot producers) group
rather than initially running a cluster analysis to identify a number of different
livelihood strategies, as was carried out by other investigators (Alinovi et al., 2010;
Ciani, 2012). It should be pointed out that these previous investigators were
constrained to work with existing data sets as opposed to this study which had the
ability to generate its own data from the bespoke questionnaire.
Also, the identification of different livelihood strategies is required when the observed
population is composed of different groups (e.g. pastoralists, subsistence farmers,
market oriented farmers etc., Alinovi et al., 2010). In this case, the five farm size
groups differ in their levels of resilience rather than in the fundamental ‘shape’ of their
resilience strategy (Figure 8).
This can be explained by the relative homogeneity of the livelihood profile of the
households. Differences in resilience strategies across the farm size classes are seen
in income (Economic Connectivity) and relations (Social Networks and Information) as
they are the dimensions that vary more sharply across the five groups. Other
dimensions such as Human Capital and Non-Agricultural Assets do not show
substantial variations between groups. Of course, this does not mean that human
capital and non-agricultural assets are not relevant for resilience-building, but that
they are not as significant in explaining why resilience varies across household farm
size classes. This can be explained by the role played by agricultural activities within
the overall household livelihood strategy.
Agricultural activities are usually complementary to other activities. As a consequence,
the same farm size may be complementary to activities of two very different
households (e.g. one with a very high and one with a very low human capital
endowment). It also demonstrates that Reggio Calabria, despite the severe economic
problems that it faces, is part of a high-income country in which social welfare,
services and formal networks exist. These results, which are to be expected, confirm
that the area is quite homogeneous and also conforms the validity of the approach
and methodology, which is innovative in being applied in a European/high-income
country context. Previous resilience research has focused on low-income countries or
areas struck by war, conflicts and natural disasters.

28
An alternative analysis would be to classify the study population by combining the
farm size and the proportion of farm land used for bergamot cultivation. The
population has been divided in three farm size classes (from 0 to 2 ha, from 2 to 5 ha,
more than 5 ha)7 and three bergamot intensity classes (up to 33% of total harvested
area, from 33% to 66% of total harvested area, more than 66% of total harvested
area). Nine potential categories are obtained by cross tabulating the farm size and the
bergamot use groups.
Table 14 reports the frequencies of the resulting nine categories. Notably, the
category of small size farms with medium intensity of bergamot cultivation is empty.
In general, the high bergamot intensity group is mainly small farmers.
Table 14 – Farm Size & Bergamot Cultivation
Category Frequency % % cum
Small Size - Low Bergamot Intensity 7 2.2 2.2 Small Size - Medium Bergamot Intensity - - -
Small Size - High Bergamot Intensity 79 24.2 26.4
Medium Size - Low Bergamot Intensity 16 4.9 31.3
Medium Size - Medium Bergamot Intensity 27 8.3 39.6
Medium Size - High Bergamot Intensity 77 23.6 63.2
Large Size - Low Bergamot Intensity 62 19.0 82.2
Large Size - Medium Bergamot Intensity 30 9.2 91.4
Large Size - High Bergamot Intensity 28 8.6 100.0
Source: Authors’ elaborations
It is interesting to observe the average value of the resilience index for the above
categories. First of all, as clearly shown by Figure 9, in each farm size class, the
average value of the resilience index is higher for farmers using larger proportions of
their farm to cultivate bergamot. These results also show that households with small-
size farms and with high bergamot cultivation intensity have a level of resilience
higher than medium-size farm owners with low and medium bergamot cultivation
intensity.
7 The number of farm size categories has been reduced to three (from five in the previous analysis) to facilitate calculation and presentation of results.

29
Figure 9 – Farm Size, Bergamot Cultivation and Resilience
0.000
0.100
0.200
0.300
0.400
0.500
0.600
Farm Category
Small Size - Low Bergamot
Intensity
Small Size - Medium Bergamot
Intensity
Small Size - High Bergamot
Intensity
Medium Size - Low Bergamot
Intensity
Medium Size - Medium Bergamot
Intensity
Medium Size - High Bergamot
Intensity
Large Size - Low Bergamot
Intensity
Large Size - Medium Bergamot
Intensity
Large Size - High Bergamot
Intensity
Source: Authors’ elaborations
Figure 10 – Household Resilience Strategy Shape, Farm Size and Bergamot
Cultivation
Source: Authors’ elaborations
Small Size Farms (0-2 ha)
0.000
0.200
0.400
0.600
0.800
1.000
EC
AAT
NAA
AER
SNI
HC
Small Size - Low Bergamot Intensity Small Size - High Bergamot Intensity
Medium Size Farms (2-5 ha)
0.000
0.200
0.400
0.600
0.800
1.000
EC
AAT
NAA
AER
SNI
HC
Medium Size - Low Bergamot IntensityMedium Size - Medium Bergamot IntensityMedium Size - High Bergamot Intensity
Large Size Farms (5+ ha)
0.000
0.200
0.400
0.600
0.800
1.000
EC
AAT
NAA
AER
SNI
HC
Large Size - Low Bergamot IntensityLarge Size - Medium Bergamot IntensityLarge Size - High Bergamot Intensity

30
This data suggests a positive association between resilience and bergamot cultivation
when controlling only for farm size but would be confirmed by controlling for several
variables.
As was presented for farm size classes, it is interesting to examine the average value
of the resilience components for each group in order to have a snapshot of the various
resilience strategies. Figure 10 reports the values for the eight categories from Table
14 grouped according to the size of the farm. For small size farms it is interesting to
note that the variation in the values of the access to social networks and information
are the main driver of the difference between the average resilience of the two
groups. In the case of households with medium-size farms, there appears to be no
major differences among the three groups with regard to the shape of the resilience
strategy. For large farmers, the figure shows considerable differences, particularly for
the values of Access to Economic Resources and Agricultural Assets and Technologies.
According to the definition adopted by this report resilience is ‘a measure of the
persistence of systems and of their ability to absorb change and disturbance and still
maintain the same relationships between populations or state variables’
(Holling, 1973, p. 14). This paper considers resilience as a latent variable and
determines it through a composite resilience index in order to address the complexity
of resilience-building. Because this was a bespoke questionnaire, it was possible to
place a question that would provide a good proxy for resilience. In this case, the proxy
can be used to attempt to validate if that index is effectively measuring resilience. The
simultaneous use of the composite index and of the proxy allows for having a robust
resilience index. Clearly, relying exclusively on a resilience proxy would not allow the
investigation of the components of the resilience-building processes and providing
insights as to the variables that are relevant from the policy-maker’s perspective.
In the questionnaire, the interviewed farmers were asked to indicate the maximum
shock, expressed as monetary loss that their household can endure without reporting
a permanent loss of wellbeing. This can be used as a proxy for resilience but has a
number of weaknesses. Firstly, it is based on the respondent’s perceptions,
preferences, etc. Secondly, it reduces the measurement of the consequence of a
shock to a monetary measure, even if the reality is much more complex.
Nevertheless, it is worthwhile to check whether there is any correlation between the
measured resilience index and this proxy, whose distribution is reported in Table 15.

31
Table 15 – Maximum Shock that Can Be Absorbed by the Household
Max Shock Entity %
500-999 3.07 1000-4999 8.28
5000-9999 14.11
10000-24999 18.1
25000-49999 45.09
500000+ 11.35
Source: Authors’ elaborations
The relation between calculated resilience index and this resilience proxy has been
analysed through the estimation of an ordered logit model (Greene, 2003) where the
classes identified in Table 15 are the categories of the dependent variable of the
model8. Basically, the model is used to predict the probability of a household to
present a modality of the dependent variable given a set of characteristics (including
resilience). Beyond the resilience index, other variables have been included in the
model. Two alternative variations of the model have been estimated. In the first, the
resilience index is included as a continuous variable (Table 16). In the second, the
resilience index has been transformed into a categorical variable by computing the
quartiles of its distribution (Table 17). The resilience index elaborated in this section is
a good predictor of the maximum shock that can be absorbed by the households,
irrespective of the form used to include it in the model.
To obtain additional insights concerning the functioning of the resilience index it is
beneficial to re-examine the elements of the index and to analyse the relationship
between the resilience components and households’ ability to absorb shocks.
The model presented in Table 18 highlights the resilience dimension that underlies the
households’ ability to absorb shocks. The components of Human Capital, Access to
Economic Resources and Social Networks and Information are positively and
significantly related to absorption capacity. Economic Connectivity and Non-
Agricultural Assets appear not to play a significant role. The demographic structure of
the household (Household Structure) has been re-included in this model to check
whether its exclusion was relevant or not. The lack of significance of its coefficient
lends support to its exclusion from the resilience index. The role and the sign of the
Agricultural Assets and Technologies dimension is unexpected as it is significantly but
negatively related with absorption capacity.
8 Ordered logit models are models in which the dependent variable is a categorical variable; modalities are ordered in a scale and are attributed on this scale in a meaningful way that is relevant and can be explained by the independent variables.

32
Given these somewhat unexpected results, a further model has been used to increase
the level of detail of the analysis. Starting from the observed variables used to
compute the various resilience components, a restricted set of variables has been
selected to specify the relation between these variables and households’ ability to
absorb shocks.
Table 16 –
Model 1: Resilience Index and Resilience Proxy
Variable Coefficient Standard Error
Household Characteristics
Farm Main Source of Income?
Yes 0.511 0.283 *
No - -
Share Agriculture on Total
Income
At Least 1 Household
Member is Farmer
0.018 0.006 ***
Yes -0.232 0.347
No - -
Household Head Gender
Female 0.722 0.519
Male - -
Interview Centre
Bianco 0.022 0.227
San Giorgio 0.843 0.298 ***
Condofuri - -
Resilience
Resilience Index 0.000025 0.000 ***
Prob>Chi2= 0.00000
Source: Authors’ elaborations
The two step process of aggregation used in the resilience index calculation approach
provides clear aggregated components but is a trade-off with lower complexity. It may
be that one of the components (e.g. Household Structure) of the resilience index is
not significantly associated with absorption capacity but some of the observed
variables used to compute the component do play a significant role. Regarding
Economic Connectivity, the results show that both the access to property rent and to
credit are positively and significantly related to the absorption capacity. In a similar
way, the value of the house and the ability to save have a positive and significant

33
role. Human Capital, Social Networks and Information and Access to Economic
Resources retain their importance even if analysed through primary variables and not
through the aggregated index. The farm size, which was the variable selected in the
agricultural asset dimension, retains its unexpected sign. This can be explained by the
low demand in the land market as resources invested in land are not easy to liquidate
and the ownership of larger land areas appears to be perceived more as a constraint
rather than an opportunity.
Table 17 –
Model 2: Resilience Index and Resilience Proxy
Variable Coefficient Standard Error
Household Characteristics
Farm Main Source of Income?
Yes 0.491 0.281 *
No - -
Share Agriculture on Total
Income
At Least 1 Household
Member is Farmer
0.016 0.006
Yes -0.155 0.347
No - -
Household Head Gender
Female 0.626 0.506
Male - -
Interview Centre
Bianco -0.093 0.225
San Giorgio 0.704 0.307 **
Condofuri - -
Resilience
Household Belongs to 1th Resilience Quartile -1.584 0.299 ***
Household Belongs to 2nd Resilience Quartile -0.321 0.151 ***
Household Belongs to 3rd Resilience Quartile -0.165 0.098 ***
Household Belongs to 4th Resilience Quartile - -
Prob>Chi2= 0.00000
Source: Authors’ elaborations

34
Table 18 –
Model 3: Resilience Index and Resilience Proxy
Variable Coefficient Standard Error
Household Characteristics
Farm Main Source of Income?
Yes 0.387 0.312
No - -
Share Agriculture on Total
Income
0.000 0.006
At Least 1 Household
Member is Farmer
Yes -0.294 0.375
No - -
Household Head Gender
Female 0.606 0.549
Male - -
Interview Centre
Bianco -0.120 0.257
San Giorgio 0.259 0.330
Condofuri - -
Resilience
Economic Connectivity 0.618 0.440
Agricultural Assets -0.153 0.034 ***
Non Agricultural Assets 0.000002 0.000
Income 0.00028 0.000 ***
Access to Networks 1.163 0.326 ***
Demographic Structure -0.066 0.046
Human Capital 0.924 0.248 ***
Prob>Chi2= 0.00000
Source: Authors’ elaborations

35
Table 19 –
Model 4: Resilience Index and Resilience Proxy
Variable Coefficient Standard Error
Household Characteristics
Farm Main Source of Income?
Yes 0.811 0.314 **
No - -
Share Agriculture on Total Income 0.007 0.006
At Least 1 Household Member is Farmer
Yes 0.034 0.374
No - -
Household Head Gender
Female -0.208 0.570
Male - -
Interview Centre
Bianco -0.498 0.265 *
San Giorgio 0.277 0.337
Condofuri - -
Resilience
Economic Connectivity
Investment income: yes -0.379 0.458
Investment income: no - -
Property income: yes 0.588 0.290 **
Property income: no - -
Access to credit: yes 0.456 0.255 *
Access to credit: no - -
Agricultural Assets
Farm size -0.034 0.008 ***
Non Agricultural Assets
House value 0.000002 0.000 **
Income
Income 0.01206 0.000 ***
Ability to save (last 3 years): yes 0.89348 0.353 **
Ability to save (last 3 years): no - -
Access to Networks
Share of household member in association 1.784 0.413 ***
Access to support: yes 1.485 0.350 ***
Access to support: no - -
Demographic Structure
Demographic dependence index -0.013 0.051
Human Capital
Household head education: university 1.064 0.479 **
Household head education: junior high school 0.833 0.426 **
Household head education: senior high school -0.239 0.426
Household head education: elementary school - -
Prob>Chi2= 0.00000
Source: Authors’ elaborations

36
5. Resilience and Bergamot Production
In order to understand the role of bergamot production in resilience-building
strategies, it is first necessary to describe the role of agriculture and agricultural
activities overall. In general, agriculture is the main source of income and the main
economic activity for only a minority of households in the study. Only 26.07% of those
interviewed believe that their farm could potentially be the main source of income for
the household. However, this number has increased substantially compared to seven
years ago (15.34%), before the reforms of the Bergamot Consortium. This is reflected
in the portion of household income coming from agriculture-related activities. For 70%
of those interviewed, agriculture accounts for less than 30% of total income, but has
become more important than seven years ago where for more than 83% of the
households it was below 30%. While in only 11.6% of households at least one
member is defined as a ‘farmer’ or farm worker, on average, 67% of family members
of working age are involved in the daily management of the farm. In the case of 39%
of the interviewed households, all of those of working age are reported as being
involved in the daily management of the farm. This suggests that agriculture provides
an opportunity to diversify income sources and to get additional family income for the
whole family rather than for an individual family member.
It can be concluded that the main, direct short-term impact of bergamot production
on resilience may be through increased income and economic connectivity and
diversification. Therefore, it would be worthwhile to examine whether bergamot
production is more advantageous than other agricultural production. According to our
data, the profit from bergamot production has increased in 85% of farms in the past
seven years. Those interviewed report that this occurred mainly as a result of
increased income from the sale of bergamot rather than by an expansion of the area
under bergamot, which occurred in just 9.2% of farms. Information provided by
interviewees indicates that bergamot production is currently significantly more
profitable than other crops on a hectare basis.
Another dimension where bergamot production can contribute to producers’ resilience
is the access to networks. The structure of the bergamot sector, after the reform
implemented in 2008, is based on the association Unionberg of the producers of
bergamot. This increased capacity of collective action is likely to have increased
farmers’ access to information and to public support with the possible positive impact
on other crops. Access to credit has likely been improved by the stabilisation of the

37
market and the creation of long-term agreements between farmers and buyers that
can be used as collateral.
Other dimensions of resilience are likely to be less sensitive to bergamot production.
Non-Agricultural Assets, demographic structure, even if this dimension is not included
in the resilience index and Human Capital accumulation are likely to be sensitive to
more complex factors (e.g. culture policies, etc.). Usually changes in these
dimensions, in particular in a high-income country, are slow. As a consequence, the
size of the impact of bergamot production on these dimensions is less predictable. The
potential impact of Agricultural Assets and Technologies is ambiguous. The higher
profitability of bergamot is likely to encourage the enlargement of the area cultivated
with bergamot. However, during the last seven years the total bergamot area has
increased only by 7.55% (i.e. 58 ha in total). Moreover, a large part of this increase is
due to the reallocation of land use and not to the enlargement of farms. In fact, only
7.1% of farms experienced an expansion of total harvested area with an average
expansion of 3.78 ha. It should be noted that this kind of investment is likely to be
influenced by long-term support policies as the time horizon for an investment in a
new bergamot plantation is at least five years.
Simulating the impact of a change of some aspect of the production
environment/system (e.g. prices, taxes, incentives) on a variable, or on a set of
variables, of interest (e.g. household livelihood resilience) is challenging. In fact, the
amount of interactions occurring in the real world is likely to hamper the calculation of
the impact of such a change. In simple terms, other factors, not measured, or
possibly not measurable, in this study will have changed in the period since the
stabilisation of the bergamot market. To address this challenge, a simulation scenario,
characterised by a set of hypothesis that allow the complexity of this issue to be
managed and coherent results to be obtained, has been developed.
The objective is to consider two scenarios where bergamot production has respectively
disappeared or been totally marginalised. In the first, the area previously harvested
with bergamot is left uncultivated. In the second, the area cultivated with bergamot is
considered to give a return per hectare equal to the average of non-bergamot
cultivations in the farm. While the first scenario (i.e. the disappearance of the
bergamot sector) may appear extreme, it was seen as realistic prospect immediately
prior to the reform of the Bergamot Consortium (Spanti, 2013).

38
In these two scenarios the disappearance of bergamot is supposed to have an impact
on the following variables:
(i) Crops variety (i.e. the ATT resilience component);
(ii) Agricultural profit, monthly income, gap between income and needs (i.e. the
AER resilience component).
It is also possible to hypothesise an impact on other dimensions, such as Access to
Networks and Information. However, the study dataset does not allow the modelling
of the impact on this component. As a consequence, the impact of the simulated
changes on the resilience index is likely to be underestimated.
Other additional hypotheses of this simulation are:
(i) There is no direct impact on household consumption. Bergamot has no
significant use in the households.
(ii) There is no impact on the prices of other products and thus on the average
profitability of non-bergamot production. It is reasonable to hypothesise that
conversion of the total area under bergamot to other crops is unlikely to
influence the market price of other crops.
The new variable values arising from the simulation are used to compute the
simulated values of the resilience components and then of the resilience index by
using the factor loadings (and the coefficients) of the previous factor analysis as
described above.
Table 20 shows the impact of bergamot cultivation on resilience. The impact on
resilience is evident: the disappearance of bergamot cultivation would induce a
decrease in producers’ resilience by 21.10% in scenario 1 and by 15.73% in
scenario 2. The cross tabulation of impact, farm size and bergamot farm intensity
shows that the impact is directly proportional to bergamot intensity and to farm size
e.g., large producers with a high share of land used for bergamot production being the
ones impacted the most.
The dimension Access to Economic Resources (AER) would be the most impacted by
the disappearance of bergamot production with an average negative impact around
26% in scenario 1 and around 12% in scenario 2. The impact on Access to Networks

39
and Information (ANI) would be around 26% in both scenarios while the impact on
agricultural technology would be lower (about 15%) and mainly due to the decrease
of diversification in the case of disappearance of the bergamot cultivation.
In conclusion, it is possible to note that, despite agriculture not often being the
primary source of income for the interviewed households and although bergamot
cultivation represents only a modest share of total agricultural activities, the
contribution of bergamot to farmers’ resilience building in Southern Calabria is
significant.
Table 20 – Simulation Results
Impact on… Group Scenario 1 Scenario 2
Total Sample -21.10% -15.73%
Small Size - Low Bergamot Intensity -16.40% -15.68%
Small Size - Medium Bergamot Intensity - -
Small Size - High Bergamot Intensity -22.14% -13.38%
Medium Size - Low Bergamot Intensity -17.29% -16.66%
Medium Size - Medium Bergamot Intensity -19.74% -18.39%
Medium Size - High Bergamot Intensity -23.94% -15.01%
Large Size - Low Bergamot Intensity -15.31% -15.03%
Large Size - Medium Bergamot Intensity -21.11% -19.97%
Overall Resilience
Index
Large Size - High Bergamot Intensity -26.34% -17.80%
Total Sample -26.25% -12.82%
Small Size - Low Bergamot Intensity -13.02% -11.33%
Small Size - Medium Bergamot Intensity - -
Small Size - High Bergamot Intensity -26.71% -4.94%
Medium Size - Low Bergamot Intensity -15.75% -14.14%
Medium Size - Medium Bergamot Intensity -21.59% -18.13%
Medium Size - High Bergamot Intensity -33.98% -11.26%
Large Size - Low Bergamot Intensity -13.82% -13.22%
Large Size - Medium Bergamot Intensity -28.89% -25.89%
Access to Economic
Resources
Large Size - High Bergamot Intensity -39.52% -18.78%
Total Sample -26.92% -26.92%
Small Size - Low Bergamot Intensity -20.28% -20.28%
Small Size - Medium Bergamot Intensity - -
Small Size - High Bergamot Intensity -31.41% -31.41%
Medium Size - Low Bergamot Intensity -20.29% -20.29%
Medium Size - Medium Bergamot Intensity -38.84% -38.84%
Medium Size - High Bergamot Intensity -19.54% -19.54%
Large Size - Low Bergamot Intensity -28.23% -28.23%
Large Size - Medium Bergamot Intensity -31.73% -31.73%
Access to Networks
and Information
Large Size - High Bergamot Intensity -27.51% -27.51%
Total Sample -15.01% -15.01%
Small Size - Low Bergamot Intensity -10.04% -10.04%
Small Size - Medium Bergamot Intensity - -
Small Size - High Bergamot Intensity -22.31% -22.31%
Medium Size - Low Bergamot Intensity -19.86% -19.86%
Medium Size - Medium Bergamot Intensity -9.66% -9.66%
Medium Size - High Bergamot Intensity -11.54% -11.54%
Large Size - Low Bergamot Intensity -6.09% -6.09%
Large Size - Medium Bergamot Intensity -6.85% -6.85%
Agricultural Assets
and Technologies
Large Size - High Bergamot Intensity -7.48% -7.48%
Source: Authors’ elaborations

40
6. Conclusions
This study is an attempt to apply a quantitative approach to the measurement of
social-ecological resilience in the context of a high-income country. This pioneering
use will be hopefully adopted and advanced by other researchers in the future. This
approach can be used to identify groups at risk and what action could be taken to
improve their coping strategies. In addition, the approach can be used to determine
the impact on the resilience of various groups of a wide range of interventions
including social/health services, safety nets, infrastructure investment, new
agricultural techniques and new crops or varieties. Resilience now is an internationally
recognised metric which not only yields data on current status but also on what has
been achieved to date and how future interventions might be optimised.
In addition, this is the one of the first interview study conducted with bergamot
producers in the Reggio Calabria province. Our research focused on a topic which is
rather unexplored despite the fact that bergamot is a high value crop and in practical
terms, only grown in this region. In addition, the success of our study is based on the
high participation rate of interviewees, as 326 bergamot farmers were interviewed
with a total farming size of approximately 826 hectares. If we take into consideration
that the total bergamot production in the province of Reggio Calabria is 1,200
hectares, then we have more than 65% of the bergamot properties represented in our
research.
A possible limitation of the study could be that certain data was collected concerning
the current situation and that of seven years ago. It is possible that this may have
introduced some confounding in the form of recall bias. This was considered and not
believed to impact the results significantly because the resilience index was only
calculated for the current situation. In the survey results, it may have been a factor
but the risk was not judged to outweigh the benefits of obtaining insights concerning
the situation prior to the reform of the Bergamot Consortium and the consequent
stabilisation of the bergamot price.
As briefly described above, Calabria is a region characterised by high unemployment
(particularly among young people) low income, and high internal migration rates. This
scenario has worsened over the last years because of the economic crisis and the
decrease of transfers from the central government due to budget constraints. As a

41
consequence, job opportunities and creation of sources of income in Calabria is an
urgent need.
Bergamot cultivation is an activity that has several unique characteristics that support
the potential of the sector. Firstly, high-quality bergamot production is a natural
monopoly of southern Calabria given the unique agro-ecological conditions of the
region. It is not possible to cultivate bergamot on a large scale and of sufficient
quality to meet the demands of the fragrance industry in other areas. Secondly, the
demand of the sector requires specific policy measures.
To conclude, the study shows that bergamot production increases producers’
resilience (i) by providing additional and stable income, (ii) by increasing the
opportunities of income diversification and (iii) by stimulating collective action.
The potential of the bergamot sector is well recognised and seen as an overall positive
trend. For instance, 85% of interviewed farmers plan to expand their bergamot
production in the next three years. However, over the last seven years, only 28% of
farmers have had access to incentives to invest in their farms and only 5.62% of
farmers made use of these incentives to expand bergamot production. Therefore,
while bergamot is making a contribution to improving the resilience of those involved
in its production, the potential advantages have not been fully exploited.
In a broader sense, promoting and safeguarding the bergamot production is part of a
different vision of southern Calabria’s development. It will allow it to be transformed
into an area that will be competitive and open to opportunities from an economic,
social and cultural point of view through the valorisation of its endogenous resources.

42
References
Adger W.N., 2000, Social and ecological resilience: are they related? Progress in Human Geography. 24(3):347-364.
Alinovi L., D’Errico M., Mane E, Romano D., 2010, Livelihood strategies and household
resilience to food insecurity: an empirical analysis to Kenya. European report on Development; FAO.
Alinovi L., Mane E., Romano D., 2009, Measuring household resilience to food insecurity: application to Palestinian households. Working Paper.
Arzeni A., Sotte F., 2013, Imprese e non-imprese nell’agricoltura italiana. Una analisi
sui dati del Censimento dell’Agricoltura 2010. Gruppo 2013 Working Paper. N. 20.
Bartholomew D.J., Steele, F., Galbraith J., Moustaki I., 2008, Analysis of Multivariate
Social Science Data. Statistics in the Social and Behavioral Sciences Series (2nd ed.). Taylor & Francis.
Bartlett M. S., 1937, The statistical conception of mental factors. British Journal of
Psychology. 28:97-104.
Carter M.R., Little P.D., Mogues T., Negatu W., 2006, Shocks, sensitivity and
resilience: Tracking the economic impacts of environmental disaster on assets in Ethiopia and Honduras. DSGD Discussion Paper, No 32. Washington D.C.: IFPRI.
Ciancio O., Iovino F., Menguzzato. G., 1995, La Calabria, terra ricca di boschi. -Dendronatura. 9-17.
Ciani F., 2012, A resilience-based approach to food insecurity: The impact of Mitch
hurricane on rural households in Nicaragua.
Community and Regional Resilience Institute., 2013, Definitions of community
resilience: An analysis.
Consorzio di Tutela del Bergamotto di Reggio Calabria. Available online: http://www.consorziodituteladelbergamotto.it/inglese.html
Consorzio del Bergamotto., 2012, Il Bergamotto di Reggio Calabria. Reggio Calabria: Laruffa Editore S.R.L..
Dickinson R. E., 1954, Land reform in Southern Italy. Economic Geography. 30(2):157-176.
European Commission Decision (2006/218/EC). Available online: http://eur-
lex.europa.eu/LexUriServ/LexUriServ.do?uri=OJ:L:2006:085:0022:0035:EN:PDF
Greene, W. H., 2003, Econometric Analysis (5th ed.). Prentice Hall.
Holling C.S., 1973, Resilience and stability of ecological systems. Annual Review of Ecology and Systematics. 4.
International Monetary Fund., 2013, IMF Country Report on Italy No. 13/348.
Washington D.C.
ISTAT., n.d., 6o Censimento Generale dell’Agricoltura in Calabria. Risultati Definitivi.
ISTAT., 2014, Noi Italia. 100 Statistiche per capire il paese in cui viviamo.
Keil A., Zeller M., Wida A., Sanim B., Birner R., 2008, What determines farmers’ resilience towards ENSO related drought? An empirical assessment in central
Sulawesi, Indonesia. Climate change. 86:291-307.

43
Regulation (EC) No 1080/2006 Of the European Parliament and of the Council of 5
July 2006 on the European Regional Development Fund and repealing Regulation (EC) No 1783/1999. Available online: http://eur-
lex.europa.eu/LexUriServ/LexUriServ.do?uri=OJ:L:2006:210:0001:0011:EN:PDF
Resilience Alliance. Assessing resilience in social-ecological systems: Workbook for practitioners. Version 2.0; 2010.Available online:
http://www.resalliance.org/index.php/resilience_assessment
Spanti C., 2013, Bergamotto una miniera d’oro verde. Rome: Asterisk Edizioni.