The research described in this report was sponsored by … · ture submarine production: (1)...
232
Transcript of The research described in this report was sponsored by … · ture submarine production: (1)...


The research described in this report was sponsored by the Office of theSecretary of Defense under RAND’s National Defense Research Institute, afederally funded research and development center supported by the Office ofthe Secretary of Defense, the Joint Staff, and the defense agencies, ContractMDA903-90-C-0004.
RAND is a nonprofit institution that helps improve policy and decisionmakingthrough research and analysis. RAND® is a registered trademark. RAND’spublications do not necessarily reflect the opinions or policies of its researchsponsors.
© Copyright 1994 RAND
All rights reserved. No part of this book may be reproduced in any form by anyelectronic or mechanical means (including photocopying, recording, orinformation storage and retrieval) without permission in writing from RAND.
Published 1994 by RAND1700 Main Street, P.O. Box 2138, Santa Monica, CA 90407-2138
1200 South Hayes Street, Arlington, VA 22202-5050201 North Craig Street, Suite 202, Pittsburgh, PA 15213-1516
RAND URL: http://www.rand.org/To order RAND documents or to obtain additional information, contact
Distribution Services: Telephone: (310) 451-7002; Fax: (310) 451-6915; Email:[email protected]
Cover design by Corrine Maier
ISBN: 0-8330-1548-6

iii
PREFACE
In January 1993, RAND’s National Defense Research Institute (NDRI) was askedby the Office of the Under Secretary of Defense for Acquisition (now Acquisitionand Technology) to compare the practicality and cost of two approaches to fu-ture submarine production: (1) allowing production to shut down as currentlyprogrammed submarines are finished, then restarting production when moresubmarines are needed, and (2) continuing low-rate production. The researchwas motivated by concerns that the submarine production base might not beeasily reconstituted if production is shut down and by the countervailingrecognition that deferring new submarine starts might yield substantial savings,particularly over the short term.
This report is a comprehensive record of the methods employed in RAND’sanalyses and the results obtained. Those analyses were completed and briefedto the research sponsors and other interested parties in the summer of 1993.They reflect what was known then about cost, schedules, and so forth. (The textof this report includes some information that has come to our attention sincethen.)
It is our intention that this report be understandable by someone with littleknowledge of submarine production or cost and schedule analysis but that itsatisfy those interested in the details of the assessments underlying the conclu-sions presented. It will be supplemented by two less comprehensive prod-ucts—a shorter report that emphasizes results and takes a more selective ap-proach to the supporting material offered and a “research brief,” a single-sheetstand-alone summary of findings.
This research was carried out in NDRI’s Acquisition and Technology PolicyCenter. The National Defense Research Institute is a federally funded researchand development center sponsored by the Office of the Secretary of Defense,the Joint Staff, and the defense agencies.


v
CONTENTS
Preface .................................................. iii
Figures .................................................. ix
Tables................................................... xv
Summary ................................................ xvii
Acknowledgments.......................................... xxvii
Chapter OneINTRODUCTION ....................................... 1
Chapter TwoBACKGROUND......................................... 5U.S. Submarine Production to Date .......................... 5Events in the Life of a Submarine............................ 10
Design.............................................. 10Construction ......................................... 12Maintenance ......................................... 13Deactivation ......................................... 14
The Submarine Industrial Base ............................. 14
Chapter ThreeEFFECTS OF A PRODUCTION GAP ON SHIPYARDS.............. 21Methodology........................................... 22
Analysis Assumptions .................................. 23Data for Cost Estimates ................................. 23Modeling Workforce Buildup and Postrestart Production ........ 24
An Illustrative Case: Baseline Estimates for Electric Boat .......... 25Sizing the Residual Cadre................................ 26Impact on Submarines Currently in Construction.............. 27Costs of Smart Shutdown................................ 28
vi The U.S. Submarine Production Base
Annual Cost of Maintaining Production Capabilities ............ 29Costs and Schedule of Reconstitution....................... 30
Summary of Results Across All Cases ......................... 34
Chapter FourEFFECTS OF A PRODUCTION GAP ON NUCLEAR-COMPONENT VENDORS ................................. 43Naval Nuclear-Propulsion Industrial Base ..................... 43Lead Times with an Active Industrial Base ..................... 46Shutting Down and Reconstituting the Reactor Core Vendor ....... 48
One-Year Shutdown.................................... 49Five-year Shutdown.................................... 50
Shutting Down and Reconstituting the Rest of the Nuclear VendorBase ............................................. 51
Risks Associated with Gaps in Nuclear Component Production...... 51Estimation Risk ....................................... 52Accident Risk......................................... 55
Summary and Conclusions ................................ 56
Chapter FiveEFFECTS OF A PRODUCTION GAP ON NONNUCLEAR-COMPONENT VENDORS ................................. 59Why Is This an Important Issue? ............................ 59Scope of the Problem..................................... 60Possible Actions to Ensure Future Product Availability ............ 62
Preserving Existing Production Lines ....................... 63Reconstituting a Source of Supply in the Future ............... 64
Combining Shutdown, Maintenance, and Restart Costs ........... 67
Chapter SixALTERNATIVE FLEET REPLACEMENT STRATEGIES ............. 69Modeling Fleet Replacement ............................... 69Defining and Screening the Alternatives....................... 75
Narrowing the Range of Production Rates Considered .......... 75Choosing One of the Two Decommissioning Strategies .......... 78Narrowing the Range of Fleet Sizes Considered................ 80Checking the Feasibility of Production Gaps .................. 80
Chapter SevenCOMPARING THE COST OF ALTERNATIVE STRATEGIES ......... 83Sustaining a Fleet Size of 40 Ships at Two Produced per Year ....... 85
Differences in Discounted Costs........................... 85Differences in Undiscounted Costs......................... 87Identifying the Sources of the Cost Differences ................ 89Minimum vs. Maximum Gap: the 30-Year-Life Cases ........... 91

Contents vii
Minimum vs. Maximum Gap: the 35-Year-Life Cases ........... 9330-Year Ship Life vs. 35-Year Life: the Minimum-Gap Cases ...... 9530-Year Life vs. 35-Year Life: the Maximum-Gap Cases .......... 98
Sensitivity to Production Rate and Fleet Size ................... 99Sustaining a Fleet Size of 40 Ships at Three Ships Produced per
Year.............................................. 99Sustaining a Fleet Size of 50 Ships at Three Ships Produced per
Year.............................................. 100Sustaining a Fleet of 30 Ships at Two Ships Produced per Year..... 101
Chapter EightRISK ................................................. 103Program Risk........................................... 103Accident Risk .......................................... 107Long-Term Risk......................................... 107
Chapter NineCONCLUSIONS AND RECOMMENDATIONS................... 109On the Practicality of an Extended Gap ....................... 109On the Cost-Effectiveness of an Extended Gap .................. 110On the Risks of an Extended Gap ............................ 110Recommendations ...................................... 110
AppendixA. DESIGN CONSIDERATIONS ............................... 113B. SUPPLEMENTARY BACKGROUND INFORMATION.............. 117C. SHIPYARD EFFECTS: ADDITIONAL CASES .................... 123D. BRITISH PRODUCTION RESTART EXPERIENCE ................ 155E. FRENCH PRODUCTION EXPERIENCE ....................... 165F. WORKFORCE RECONSTITUTION MODEL AND GENERIC
RESULTS ............................................. 171G. OPERATING AND SUPPORT COSTS ......................... 189H. COMPARING COSTS: ADDITIONAL CASES.................... 193

ix
FIGURES
S.1. Total Cost to Shut Down, Maintain, and Restart a Shipyard ..... xixS.2. SSN-21 Shipyard Need Dates and Design-and-
Manufacturing Spans for Selected Nuclear Components ....... xxS.3. Production Rate Influences the Fleet Size That Can Be
Sustained .......................................... xxiiS.4. No Matter the Scenario, Restart Cannot Be Long Delayed ....... xxiiiS.5. Gapping and Restart Relations Between Minimum- and
Maximum-Gap Strategies .............................. xxivS.6. Long-Term Cost Differences Between Minimum and
Maximum Gaps Are Small .............................. xxv2.1. Nuclear Submarines Commissioned, by Class ............... 62.2. Submarine Fleet Composition Profile ..................... 72.3. Attack Submarine Fleet Composition, Past and Projected,
No New Starts....................................... 102.4. Typical Submarine Design and Construction Timeline ......... 112.5. Illustrative Submarine Construction and Maintenance
Timeline........................................... 132.6. Nuclear Submarine Starts Fell Sharply in the Late 1960s,
Again in the Early 1990s................................ 162.7. Submarine Completion Schedule ........................ 193.1. Total EB Personnel Reconstitution Costs ................... 333.2. EB Postrestart Production Schedule....................... 333.3. Shipyard Reconstitution Costs, Electric Boat, No Work
Beyond That Currently Under Way, Maximum Rate = 2 perYear .............................................. 34
3.4. Shipyard Reconstitution Costs, Newport News, No WorkBeyond That Currently Under Way, Maximum Rate = 2 perYear .............................................. 35
3.5. Shipyard Reconstitution Costs, Newport News, withAdditional Aircraft Carrier (CVN-76), Maximum Rate = 2 perYear .............................................. 35

x The U.S. Submarine Production Base
3.6. Shipyard Reconstitution Costs, Electric Boat, with OverhaulWork, Maximum Rate = 2 per Year ........................ 36
3.7. Shipyard Reconstitution Costs, Newport News, withOverhaul Work (no CVN-76), Maximum Rate = 2 per Year....... 36
3.8. Shipyard Reconstitution Costs, Electric Boat, with ThirdSeawolf, Maximum Rate = 2 per Year ...................... 37
3.9. Shipyard Reconstitution Costs, Electric Boat, No WorkBeyond That Current, Maximum Rate = 3 per Year ............ 37
3.10. Time to Deliver First Ship After Restart, Electric Boat .......... 383.11. Time to Deliver First Ship After Restart, Newport News ........ 39
4.1. Naval Reactors Authorized and Net Civilian ReactorsOrdered by Year ..................................... 45
4.2. Interval from Contract Award to the Time Component IsNeeded............................................ 47
4.3. SSN-21 Shipyard Need Dates and Design-and-Manufacturing Spans for Selected Nuclear Components ....... 48
4.4. Cost of Reconstituting Nuclear Industrial Base by Year Priorto Restart .......................................... 52
4.5. Cost Growth for Select Nuclear Facilities ................... 535.1. Illustrative Shutdown, Maintenance, and Restart Costs ........ 676.1. Fleet Composition Analysis Framework .................... 706.2. Electric Boat Submarine Production History ................ 716.3. Newport News Submarine Production History............... 716.4. Los Angeles- and Seawolf-Class Submarines Will All Be
Retired by 2030 ...................................... 746.5. The 80 Alternative Fleet Replacement Strategies
Considered ......................................... 766.6. Largest Achievable Fleet Size When Maximum Ship Age Is
30 Years ........................................... 776.7. Largest Achievable Fleet Size When Maximum Ship Age Is
35 Years ........................................... 776.8. Target Fleet Size Can Still Be Sustained If Some Submarines
Are Decommissioned Early ............................. 796.9. Early Decommissioning for the Case Shown in Figure 6.8
Would Save $14 Billion ................................ 796.10. Latest First-Delivery Date Feasible for Each Production
Strategy ........................................... 816.11. Latest Restart Date Feasible for Each Production Strategy....... 81
7.1. Gap and Restart Relations Between Minimum- andMaximum-Gap Strategies .............................. 84
7.2. Cumulative Cost of Sustaining the Attack Submarine Fleet(40-Ship Minimum) at a Maximum Production Rate of Twoper Year, Discounted at 5 Percent per Year.................. 86

Figures xi
7.3. Upper Right Portion of Figure 7.2 at High Resolution .......... 877.4. Cumulative Cost of Sustaining the Attack Submarine Fleet
(40-Ship Minimum) at a Maximum Production Rate of Twoper Year, Undiscounted................................ 88
7.5. Upper Right Portion of Figure 7.4 at High Resolution .......... 887.6. Cumulative Cost of 40-Ship, Two-per-Year Strategies,
Relative to Cumulative Cost for Min.-Gap, 30-Year-LifeStrategy, Discounted.................................. 90
7.7. Cumulative Cost of 40-Ship, Two-per-Year Strategies,Relative to Cumulative Cost for Min.-Gap, 30-Year-LifeStrategy, Undiscounted................................ 90
7.8. Annual Cost Differences, Maximum Minus Minimum Gap,Max. Ship Life 30 Years, Min. Fleet Size 40, Max. ProductionRate Two per Year .................................... 92
7.9. Cumulative Cost of Maximum Gap Relative to MinimumGap, Max. Ship Life 35 Years, Min. Fleet Size 40, Max.Production Rate Two per Year, Undiscounted ............... 93
7.10. Annual Cost Difference, Max. Gap Minus Min. Gap, Max.Ship Life 35 Years, Min. Fleet Size 40, Max. Production RateTwo per Year........................................ 94
7.11. Annual Cost Differences, 35-Year Max. Ship Life Minus 30-Year, Min. Gap, Min. Fleet Size 40, Max. Production RateTwo per Year........................................ 97
7.12. Annual Cost Differences, 35-Year Max. Ship Life Minus 30-Year, Max. Gap, Min. Fleet Size 40, Max. Production RateTwo per Year........................................ 98
7.13. Cumulative Cost of 40-Ship, Three-per-Year Strategies,Relative to Cumulative Cost for Min.-Gap, 30-Year-LifeStrategy, Discounted.................................. 100
7.14. Cumulative Cost of 50-Ship, Three-per-Year Strategies,Relative to Cumulative Cost for Min.-Gap, 30-Year-LifeStrategy, Discounted.................................. 101
7.15. Cumulative Cost of Max. Gap Relative to Min. Gap for 30-Ship, Two-per-Year, 30-Year-Life Strategies, Discounted ....... 102
B.1. Nuclear-Powered Ships by Type ......................... 118B.2. Submarine Construction Funding vs. Navy Ship
Construction Funding................................. 121C.1. Persons Required, Submarine and Carrier Construction,
Maximum Quarter.................................... 127C.2. NNS Personnel-Related Reconstitution Costs, Without
CVN-76............................................ 129C.3. NNS Postrestart Production Schedule, Without CVN-76 ........ 129

xii The U.S. Submarine Production Base
C.4. NNS Shipyard Reconstitution Costs, No Work Beyond ThatCurrently Under Way, Production Rate = Two per Year......... 130
C.5. With CVN-76, Carrier Work Increases in Some SubmarineRestart Years........................................ 131
C.6. Personnel-Related Reconstitution Costs for NNS withCVN-76............................................ 133
C.7. Postrestart Production Schedule for NNS with CVN-76......... 133C.8. Shipyard Reconstitution Costs, Newport News, with
Additional Aircraft Carrier (CVN-76), Production Rate =Two per Year........................................ 134
C.9. Submarine Construction and Overhaul Skill Requirements...... 138C.10. Submarine Construction and Carrier Overhaul Skill
Requirements ....................................... 139C.11. EB Personnel-Related Reconstitution Costs, with Overhaul
Work.............................................. 143C.12. EB Postrestart Production Schedule, with Overhaul Work....... 143C.13. EB Shipyard Reconstitution Costs, with Overhaul Work,
Production Rate = Two per Year.......................... 144C.14. NNS Personnel-Related Reconstitution Costs, with
Overheads but Without CVN-76.......................... 147C.15. NNS Postrestart Reconstitution Schedule, with Overhauls
but Without CVN-76 .................................. 147C.16. NNS Shipyard Reconstitution Costs, with Overhauls but No
CVN-76............................................ 148C.17. EB Personnel-Related Reconstitution Costs, with SSN-23 ....... 151C.18. EB Postrestart Reconstitution Schedule, with SSN-23 .......... 151C.19. EB Shipyard Reconstitution Costs, with SSN-23 .............. 152
D.1. Production and Commissioning History of British NuclearSubmarines......................................... 156
E.1. Production and Commissioning History of the Last FiveFrench Submarine Classes ............................. 166
E.2. The French Stagger Submarine Design Demand.............. 167F.1. Sample Postrestart Profile of Work in Progress and
Deliveries, for Sustained Production Rate of Three perYear .............................................. 177
F.2. Time to Achieve First Delivery and a Sustained ProductionRate of One per Year .................................. 179
F.3. Time to Achieve First Delivery and a Sustained ProductionRate of Two per Year .................................. 179
F.4. Time to Achieve First Delivery and a Sustained ProductionRate of Three per Year ................................. 180
F.5. Time to Achieve Rate Is Not Very Sensitive to Level of EarlyWorkforce Attrition ................................... 181

Figures xiii
F.6. Time to Achieve Sustained Rate Is Sensitive toMentor:Trainee Ratio ................................. 182
F.7. Workforce-Rebuilding Cost Penalty for a SustainedProduction Rate of One Ship per Year ..................... 185
F.8. Workforce-Rebuilding Cost Penalty for a SustainedProduction Rate of Two Ships per Year..................... 185
F.9. Workforce-Rebuilding Cost Penalty for a SustainedProduction Rate of Three Ships per Year ................... 186
F.10. Increasing Attrition Raises the Cost Penalty Slightly ........... 187F.11. The Cost Penalty Is Sensitive to the Mentor:Trainee Ratio....... 187H.1. Cumulative Cost of Sustaining the Attack Sub Fleet (40-Ship
Minimum) at a Maximum Production Rate of Three perYear, Discounted at 5 Percent per Year..................... 194
H.2. Cumulative Cost of Sustaining the Attack Sub Fleet (40-ShipMinimum) at a Maximum Production Rate of Three perYear, Undiscounted................................... 194
H.3. Cumulative Cost of 40-Ship, Three-per-Year Strategies,Relative to Cumulative Cost for Min.-Gap, 30-Year-LifeStrategy, Discounted.................................. 195
H.4. Cumulative Cost of 40-Ship, Three-per-Year Strategies,Relative to Cumulative Cost for Min.-Gap, 30-Year-LifeStrategy, Undiscounted................................ 195
H.5. Annual Cost Difference, Min. vs. Max. Gap, Max. Ship Life30 Years, Fleet Size 40, Max. Rate Three per Year ............. 196
H.6. Annual Cost Difference, Min. vs. Max. Gap, Max. Ship Life35 Years, Min. Fleet Size 40, Max. Production Rate Three perYear .............................................. 197
H.7. Annual Cost Difference, 30-Year Max. Ship Life vs. 35 Years,Min. Gap, Min. Fleet Size 40, Max. Production Rate Threeper Year ........................................... 197
H.8. Annual Cost Difference, 30-Year Life vs. 35 Years, Max. Gap,Min. Fleet Size 40, Max. Production Rate Three per Year........ 198
H.9. Cumulative Cost of Sustaining the Attack Submarine Fleet(50-Ship Minimum) at a Maximum Production Rate ofThree per Year, Discounted at 5 Percent per Year ............. 198
H.10. Cumulative Cost of Sustaining the Attack Submarine Fleet(50-Ship Minimum) at a Maximum Production Rate ofThree per Year, Undiscounted ........................... 199
H.11. Cumulative Cost of 50-Ship, Three-per-Year Strategies,Relative to Cumulative Cost for Minimum-Gap, 30-Year-Life Strategy, Discounted............................... 199

xiv The U.S. Submarine Production Base
H.12. Cumulative Cost of 50-Ship, Three-per-Year Strategies,Relative to Cumulative Cost for Minimum-Gap, 30-Year-Life Strategy, Undiscounted ............................ 200
H.13. Annual Cost Difference, Minimum vs. Maximum Gap, Max.Ship Life 30 Years, Min. Fleet Size 50, Max. Production RateThree per Year....................................... 201
H.14. Annual Cost Difference, Minimum vs. Maximum Gap, Max.Ship Life 35 Years, Min. Fleet Size 50, Max. Production RateThree per Year....................................... 201
H.15. Annual Cost Difference, 30-Year vs. 35-Year Max. Ship Life,Min. Gap, Min. Fleet Size 50, Max. Production Rate Threeper Year ........................................... 202
H.16. Annual Cost Difference, 30-Year vs. 35-Year Max. Ship Life,Max. Gap, Min. Fleet Size 50, Max. Production Rate Threeper Year ........................................... 203
xv
TABLES
2.1. Characteristics of Selected U.S. Submarine Classes ........... 82.2. Shipyards That Have Produced Nuclear Ships ............... 152.3. Shipyard Capabilities for Nuclear-Submarine Construction
and Maintenance .................................... 173.1. Cost Impact on Current EB Submarines Under
Construction........................................ 293.2. EB Personnel Released by Various Dates ................... 293.3. EB Shutdown Costs as a Function of Next Start .............. 303.4. EB Annual Maintenance Costs Prior to Next Start............. 313.5. Skilled Workforce Available When Production Resumes ........ 313.6. Total EB Personnel Reconstitution Costs ................... 323.7. Summary of Shipyard Cost Effects of Deferring Production...... 384.1. Key Nuclear Suppliers ................................. 444.2. History of Nuclear Component Suppliers................... 465.1. Nonnuclear Suppliers and Components Judged Critical by
at Least Two Sources.................................. 636.1. Submarines Delivered per Year for Different Maximum
Rates ............................................. 726.2. Values of Cost Inputs to the Fleet Replacement Model ......... 738.1. Sources of Uncertainty and Their Treatment in the
Quantitative Analysis ................................. 104A.1. Critical Engineering and Design Skills ..................... 116B.1. Submarine Fleets of the World........................... 119C.1. Cost to Shut Down NNS Submarine Production Capability...... 125C.2. NNS Annual Maintenance Costs Prior to Restart ............. 125C.3. Skilled Workforce Available When Production Resumes ........ 126C.4. Total NNS Personnel Reconstitution Costs Without
CVN-76............................................ 128C.5. Skilled NNS Workforce Available When Production
Resumes If CVN-76 Is Funded ........................... 132
xvi The U.S. Submarine Production Base
C.6. Total NNS Personnel Reconstitution Costs with Funding ofCVN-76............................................ 132
C.7. Major Maintenance Activities for Submarines ............... 135C.8. Scheduled Future Repair/Overhaul Activities for 688-Class
and Ohio-Class Submarines ............................ 135C.9. Cost Impact on EB Submarines Currently in Construction
with Overhaul Work .................................. 140C.10. EB Shutdown Costs, with Overhaul Work .................. 140C.11. EB Annual Maintenance Costs Prior to Restart, with
Overhaul Work ...................................... 141C.12. Skilled Workforce Available When Production Resumes ........ 142C.13. Total EB Personnel Reconstitution Costs, with Overhaul
Work.............................................. 142C.14. NNS Shutdown Costs, with Overhaul Work ................. 145C.15. Skilled Workforce Available When Production Resumes ........ 146C.16. Total NNS Personnel Reconstitution Costs, with Overhauls
but Without CVN-76 .................................. 146C.17. EB Shutdown Costs as a Function of Next Start .............. 149C.18. EB Personnel Released by Various Dates ................... 150C.19. Skilled Workforce Available When Production Resumes ........ 150C.20. Total EB Personnel Reconstitution Costs ................... 150C.21. Summary of Shipyard Costs of Deferring Production .......... 153
D.1. British Submarine Characteristics ........................ 156D.2. Upholder-Class Submarine Planned vs. Original
Schedules .......................................... 161E.1. French Submarine Characteristics........................ 166F.1. Assumed Relative Efficiencies by Experience Level ............ 174F.2. Assumed Relative Compensation Rates by Experience Level ..... 174F.3. Assumed Steady-State Attrition Rates by Experience Level ...... 175F.4. Tested Early Attrition Rates, by Experience Level ............. 180F.5. Distributions of Fixed and Variable Overhead Costs
Examined .......................................... 184G.1. 688-Class Submarine O&S Costs ......................... 191

xvii
SUMMARY
The current attack submarine production program is coming to an end. Afterdecades of building three or more submarines annually, there have been noconstruction starts since 1991. It is generally believed that the current fleet ofLos Angeles–class attack submarines is big enough to meet U.S. security needsfor many years. Superficially, it may seem appropriate, especially given bud-getary constraints, to suspend submarine production for a period of time.
At some point in the future, however, it will be necessary to build more sub-marines to replace the Los Angeles–class ships as they age and can no longer beoperated with high standards of safety and reliability. Initiating such a con-struction program from scratch will involve serious challenges. Nuclear sub-marines are among the most complex structures built by man. Not only mustthey survive and function under water for long periods of time in a hostile envi-ronment, they contain a nuclear reactor in immediate proximity to the crew.Despite these challenges, U.S. nuclear submarines have demonstrated their re-liability in diverse conflict situations while maintaining a very good safetyrecord over the years. That history can be credited in large part to the highlyskilled submarine design, engineering, and construction workforce, both in theshipyards and at the factories of critical-component vendors.
The most recently started submarine is now three years into construction.Shipyard workers and component vendors needed only in the initial phase ofconstruction are already dispersing or preparing to exit the business. More willleave as the industry shuts down in phases. If more submarines are not startedsoon, then rebuilding the workforce, reopening the shipyard facilities, andreestablishing the vendor base could be very costly and time-consuming.Reconstitution could also compromise the reliability and safety of submarinesconstructed before today’s high standards are reattained.
The purpose of this study was to determine the practicality of extending thecurrent gap between submarine starts, given the time required to restart; esti-mate the money likely to be saved, given the offsetting costs of shutdown and

xviii The U.S. Submarine Production Base
restart; and characterize the largely unquantifiable risks involved in a reconsti-tution strategy. Our conclusions are as follows:
• It takes so long to restart production after shutdown that construction ofthe next class of submarines must be started by around 2001 if fleet sizesthat the government judges consistent with anticipated national securityneeds are to be sustained.
• For the longest gaps feasible, the discounted stream of costs required tosustain the submarine force to 2030 results in savings of less than a billiondollars compared to the cost of a more continuous program. That is wellwithin the margin of error with which we can now project such costs.
• Given the difficulties and challenges involved in restarting submarine pro-duction from scratch, our cost estimates for restart may be too low and ourschedule estimates too optimistic. Further risks related to nuclear licensingand environmental and safety concerns may jeopardize the success of thenuclear submarine program.
• Considering the limited savings realizable and the substantial risks incurredin extended-gap scenarios, we recommend that construction of additionalsubmarines be started soon. Specifically, we recommend that the thirdSeawolf-class submarine, now planned for a 1996 start, be funded, and thatthe Navy proceed with plans for beginning a new class of submarines in thelate 1990s.
In arriving at these conclusions, we drew on quantitative data and qualitativeinformation from private- and public-sector shipyards and vendors, relevantcomponents of the U.S. Navy and the Office of the Secretary of Defense, andforeign governments with shutdown experience. Sources included personswith varying perspectives on the seriousness of the delays, costs, and risks as-sociated with a production gap. We critically reviewed all data, made adjust-ments as appropriate, and built and ran models to draw inferences where thenature of the data permitted it. We determined how stopping and restartingproduction affects shipyard and vendor costs and schedules and how decisionsabout future fleet size and production rate affect the production gaps feasible.These results were then combined to yield discounted cost streams for sustain-ing the submarine production base under a strategy of continued productionand under various gapping strategies. We accounted for the costs of producing,operating, and maintaining the submarine force until 2030, when the LosAngeles–class submarines will all have been retired. The results of the analysesunderlying our principal conclusions are as follows.
Shipyard Effects. If submarine production is to be suspended for a number ofyears, substantial sums will have to be expended to shut down shipyard activi-

Summary xix
ties and facilities in a manner that preserves tooling and information to facili-tate restart. Then, the yard and its production lines will have to be maintainedin working order during the gap. Additional expenses will be incurred in re-opening facilities and rebuilding the workforce at the end of the gap. Theseworkforce expenses dominate the total (for an illustrative case, see Figure S.1).Costs of rebuilding the workforce include those of hiring and training newworkers, plus those arising from inefficiencies in producing early submarines(when the workforce will have more workers at lower levels of productivity thanit will later). We found that submarine production restart costs can be reducedif shipyards remain active with aircraft carrier construction or with submarineoverhauls. (Currently, the latter are performed in Navy shipyards.)
The longer the production gap, the more skilled workers will be permanentlylost from the industrial base, and the longer it will take to produce the firstsubmarine and to ramp production up to the desired rate. If workers can be re-tained through other shipyard activities, these delays can be reduced. For ex-ample, whereas it would take over ten years after contract award to deliver thefirst submarine starting from a residual skilled workforce of 250, it would takeonly six years if 1000 skilled workers could be retained.
RANDMR456-S.1
FY01
Restart year
Bill
ions
of F
Y92
dol
lars
2.5
2.0
1.5
1.0
0.5
0
Electric Boat, max. production rate = 2/yr,min. fleet size = 40 ships, no SSN-23
Rebuilding workforce
Shutdown, maintenance, other restart
Figure S.1—Total Cost to Shut Down, Maintain, and Restart a Shipyard

xx The U.S. Submarine Production Base
Vendor Effects. Shipyards buy or receive through the government many sub-marine components—nuclear and nonnuclear—produced by outside suppliers.To be ready for installation at the correct point in submarine construction, workon some key nuclear components must begin well in advance (see Figure S.2).Current work will keep nuclear-system vendors busy for the next two or threeyears (assuming a new aircraft carrier is built). Design work has already begunon the longest-lead components for a new attack submarine. Unless there is alengthy production gap, it would not be practical to shut down the suppliers ofsuch components. Neither is it necessary to shut down the sole remaining U.S.producer of naval reactor cores, as that firm is engaged in producing cores torefuel aircraft carriers and the Trident-missile-carrying submarines. Shuttingthe remaining nuclear vendors down for several years would result in hundredsof millions of dollars in reconstitution costs, assuming reconstitution is feasibleat all.
Although the nuclear-vendor base is small, there are on the order of a thousandsuppliers of nonnuclear submarine-specific components. For the most part,
RANDMR456-S.2
Years prior to submarine delivery
Steamgenerator
Core
Main coolantpump
Reactorvessel
Start
Nuclear component design- and-manufacturing span
Submarine construction span
SSN
214 12 10 8 06 4
NOTE: The times assume an active industrial base; required lead times could be longer following an extended production gap.
Delivery
Figure S.2—SSN-21 Shipyard Need Dates and Design-and-Manufacturing Spans forSelected Nuclear Components

Summary xxi
supply of these latter components could be quickly resumed once demand forthem is renewed following a production gap. A few, however, require specialskills or technologies that may be difficult to recover should the firms producingthem go out of business during a gap. For these cases, comprising at least a fewproducts and at most a few dozen, reconstitution costs could amount to half abillion dollars.
If submarine orders are delayed, the government could take a variety of actionsthat could help avoid the need to reconstitute the nuclear and nonnunclearvendor bases. Such measures include funding the production of items in ad-vance of need, paying the firms to develop and prototype advanced methods tomanufacture the needed components, or allocating other Navy work to thosefirms. Each of these measures has its drawbacks. But whatever is chosen, itmust be done soon, as critical nonnuclear suppliers may otherwise begin to goout of business within the next year.
Effects of Fleet Size and Production Rate on Delivery Gap. We have referred tothe “production gap” that began in 1991 and will extend until construction onthe next submarine starts. Since fleet size effects are determined by the time ofsubmarine entry into the force, we now refer to the “delivery gap,” or time be-tween delivery of the last submarine now under construction and the next one.
Fleet size, maximum sustained production rate, and delivery gap are interre-lated. The implications for gap length cannot be understood without under-standing the constraints that production rate places on fleet size. Estimates offuture required attack submarine fleet size range roughly from 40 to 60. Giventhe rate at which submarines will be retired in the future, a production rate ofone submarine per year following a 1998 restart cannot sustain a fleet size of 30(see Figure S.3).1 Two per year will sustain 40 but not 50; it takes three per yearto sustain 60. If the service lives of the more recently built submarines could beextended from a maximum of 30 years to 35 years, the fleet size sustainable at agiven production rate would increase. A fleet size of 50, for example, could thenbe sustained at two new submarines per year. However, extending the lives ofnuclear submarines is not a trivial task. Much additional technical study andanalysis of cost and military effectiveness is required before a decision could bemade to implement it.
______________1In steady state, one new submarine per year could sustain a fleet of 30 submarines with 30-yearlives. However, submarines of the Los Angeles class were built at an average rate of three per yearand will be decommissioned at least as rapidly. At a production rate of one per year and a retire-ment rate of three per year, the fleet will shrink until all current ships are decommissioned (in2027).

xxii The U.S. Submarine Production Base
�
RANDMR456-S.3
Max
imum
num
ber
of s
ubm
arin
es in
flee
t
80
70
60
50
40
30
20
10
02000 2010 2020 2030
�������������������
����������������������
�������������������������������������
���������������������������������������
Max. ship age = 30 yrfor all cases
��
3 (2 yards)
3 (1 yard)
2
1
Near 0
Rate
������
Figure S.3—Production Rate Influences the Fleet Size That Can Be Sustained
Figure S.4 shows the latest possible delivery date for the next submarine if vari-ous fleet sizes are to be maintained at a maximum production rate of two orthree ships per year from a single shipyard, with a maximum ship life of 30 or 35years. For several combinations of production rate, fleet size, and service life, itis not possible to sustain the fleet size minimum unless the first new attacksubmarine is delivered before 2004, which is impractical. (Such combinationsare represented by the blank triangles in Figure S.4.) Maximum gaps are to 2010if a 40-sub fleet is to be sustained and to 2007 if a 50-sub fleet is the objective.Given the inefficiencies of restart, such gaps mean that construction of the nextsubmarine must start by 2001 at the latest.
For each of the maximum gaps shown in Figure S.4, it is possible to define acorresponding minimum gap as a baseline against which the savings of an ex-tended gap can be compared. For example, as the figure shows, if an eventualfleet size of 40 is to be sustained at a maximum production rate of two ships peryear, the delivery gaps must end in 2005 or 2010. The earlier date holds if sub-marine life is to be held to 30 years and the later if the more recently built subscan be extended to 35 years. The gap from delivery of the last ship currentlyunder construction, scheduled for 1998, is then 7 years in the 30-year case and12 years in the 35-year case (for the latter, see the lower bar in Figure S.5). Theminimum gap achievable in either case entails initiating construction of aSeawolf-class submarine in 1996. The Seawolf’s delivery date of 2002 would

Summary xxiii
RANDMR456-S.4
NOTE: No third Seawolf; blank triangle indicates delivery needed earlier thanis feasible.
Latest year to deliver next submarine
For max.age of
30 yr
35 yr
Production Rate
2 per yr 3 per yr
Tosustaina fleetsize of
40
50
60
2005
2010
2005
2010
2010
2006
2007
2004
Figure S.4—No Matter the Scenario, Restart Cannot Be Long Delayed
then result in a four-year delivery gap, followed by a three-year gap (upper barsin Figure S.5).
Gap Savings. Assuming the current submarine service life, a 40-ship fleet, and atwo-per-year production rate, the maximum gap strategy saves about $700 mil-lion (net present value [NPV]) relative to the minimum gap case; for the 35-yearoption, roughly $200 million (see Figure S.6). These savings take into accountall costs related to production restart, construction, and fleet operations andmaintenance through 2030. The savings for both cases are much smaller thanthe uncertainty to which our projections are subject and the $2 billion savingsachievable through extending ship life by five years.
When a production rate of three ships per year is allowed, extending the gapdoes not always result in savings, but the difference is, in all cases we examined,less than a billion dollars. Life extension, on the other hand, results in savingsranging from about a billion to about two and a half billion dollars, dependingon the case.
Gap Risks and Constraints. The modest savings from extending the productionand delivery gaps are achieved at a substantial increase in program risk. Someof this risk arises from the inherent uncertainty in making any kind of cost or

xxiv The U.S. Submarine Production Base
2004
RANDMR456-S.5
1992
Year
1994 1996 1998 20102000
SSN-762
SSBN-739
SSN-763
SSBN-740
SSN-768
SSBN-741
SSN-771
SSN-21
SSBN-742
SSN-22
SSBN-743
SSN-773
SSN-772
SSN-770
SSN-769
SSN-766
SSN-767
SSN-765
SSN-764
20062002
Submarinesunder
construction
Minimum fleet size = 40Maximum production rate = 2 per yrMaximum ship life = 35 years
2008
Minimum gap
Start Delivery
Third Seawolf (SSN-23)
4 years
New attack submarine
Maximum gap
~12 years
New attack submarine
3 years
������������
������������
����������������
Newport News Shipbuilding
Electric Boat
Figure S.5—Gapping and Restart Relations Between Minimum-and Maximum-Gap Strategies
schedule estimate for an action that has no real analogue: No dormant indus-tries have experienced production restarts recently. Also, we have made no al-lowance for problem resolution in our estimates, although British experienceindicates that it would be challenging to produce submarines that integratenew technologies developed during the gap years.
Other risks relate to more specific infrastructure failures that could substan-tially postpone or even jeopardize a restart program’s successful completion.For some of the longer gap scenarios, for example, submarine design and de-velopment skills may atrophy, further lengthening the production phase. It isuncertain whether construction management, technical, and trade skills can be

Summary xxv
1995 20302000 2005 2015 20201990 2025
RANDMR456-S.6
Cum
ulat
ive
cost
rel
ativ
e to
min
. gap
, 30-
yr c
ase
(bill
ions
of d
olla
rs, N
PV
)
1
–3
–5
–1
–2
–4
2010
0Min. gap, 30-yr life
Max. gap, 30-yr life
Min. gap, 35-yr life
Max. gap,35-yr life
Figure S.6—Long-Term Cost Differences Between Minimumand Maximum Gaps Are Small
reconstituted at any reasonable price; once firms and individuals leave the in-dustry, it may not be possible to lure them back. Shipyard nuclear licenses andenvironmental permits may be lost if production is suspended; considering theurban locations of the shipyards, restoring those permits could be characterizedconservatively as a serious political challenge. If restarting production at alower skill level results in an eventual accident, particularly one involving a nu-clear reactor, the ship’s crew and everyone else in the vicinity could be endan-gered, and public pressure could halt submarine construction and curtail op-erations indefinitely.
Gapping production also constrains the fleet sizes and production rates thatcan be chosen. World events may lead to a decision that a fleet size of 60 isneeded to ensure national security. Such a fleet size cannot be sustained if con-struction on the next submarine is not initiated before 2000. Even for a 50-shipfleet, delaying the next submarine start to 2000 or beyond would require a pro-duction rate greater than two per year, and the same would be true of a 40-shipfleet if the current 30-year lifespan is retained. It is uncertain whether subma-rine production at three per year would be viewed as affordable, and such aprogram would produce a full fleet of 30-year-lifespan submarines in less than20 years, resulting in another production gap in the 2030s.
Recommendations. Given the limited savings achievable through gappingproduction and the substantial risks incurred, we recommend a “minimum

xxvi The U.S. Submarine Production Base
gap” strategy that entails constructing the next Seawolf-class submarine be-ginning in 1996, to be followed by the first attack submarine incorporating anew design beginning around 1998. We also recommend that the Navy exam-ine carefully the feasibility of extending the life of the more recently built attacksubmarines.

xxvii
ACKNOWLEDGMENTS
This work could not have been undertaken without the special relationship thatexists between the Office of the Secretary of Defense (OSD) and RAND underthe National Defense Research Institute (NDRI). For that relationship we aregrateful. Many individuals in OSD and RAND deserve credit for the work dis-cussed in this report. Their names and contributions would fill several pages. Ifwe were to single out a senior person in OSD and another at RAND who partici-pated in and supported this work in extraordinary ways, we would mentionGene Porter, Director, Acquisition Program Integration, and David Gompert,Director, NDRI.
We also want to thank the leadership and staff of the Office of the Secretary ofDefense, the Office of the Secretary of the Navy, the Naval Sea SystemsCommand, the Navy Nuclear Propulsion Directorate, the Navy ProgramExecutive Officer for Submarines, Electric Boat Division of General Dynamics,Newport News Shipbuilding, Mare Island Naval Shipyard, and Norfolk NavalShipyard. The shipyards arranged for us to visit their facilities and gave us theopportunity to discuss production issues with those most directly involved.The shipyards and the Navy offices provided all the data we requested in atimely manner. We appreciate their sharing their perspectives with us and theirtreating different perspectives in a professional manner.
We are also indebted to the British and French Ministries of Defense for allow-ing us to visit their headquarters and submarine production facilities and todiscuss their experiences with production gaps, low-rate production, and pro-duction issues.
This broad-based participation made possible the analysis described here.
Finally, we wish to thank RAND colleagues Joseph Large and James Winnefeld.Their thoughtful reviews occasioned many changes that improved the clarity ofthe report.


1
Chapter One
INTRODUCTION
The security and economic well-being of the United States depend upon free-dom of the seas for merchant vessels engaged in American trade and U.S. war-ships defending American interests around the globe. The U.S. forces beneaththe world’s oceans play a vital role in maintaining the American maritime pre-eminence necessary to guarantee freedom of the seas. However, in light ofchanges in the world, the accompanying reductions in threats to American in-terests and resources devoted to national defense, and the vigorous pace ofsubmarine construction in the past decade, there is no longer a pressing needfor production now of a new class of submarines for the U.S. fleet.1
—Donald J. Atwood, Jr.
Writing in 1992, then–Deputy Secretary of Defense Atwood expressed well theneed for U.S. attack submarines and the sufficiency of the current submarineforce to meet that need. At some point in the future, of course, it will be neces-sary to build more submarines to replace the current ones as they become tooold to operate safely. But how difficult will it be to resume production once ithas stopped? Important construction skills may be lost—skills that may be ex-pensive and time-consuming to restore. Will the extra cost be greater than thatsaved by stopping production? Would it be wiser to maintain skills and facili-ties by continuing to build submarines at a low rate in the interim, even thoughbuilding additional ships cannot be justified by near-term national securityneeds?
These and related issues were addressed in the study reported in this volume,which was undertaken by RAND’s National Defense Research Institute for theOffice of the Under Secretary of Defense for Acquisition (now Acquisition andTechnology). RAND was asked to evaluate “the practicality and cost effective-
______________1Memorandum to Secretary of the Navy and others on “Submarine Forces for the Future,” January22, 1992.

2 The U.S. Submarine Production Base
ness of reconstitution of the submarine production base versus a continuingprogram for limited production.” RAND’s analysis built on earlier research onshutting down and restarting production in the aircraft industry2 and on abroad set of studies in acquisition policy.
This report begins with some background information for the reader unfamiliarwith the status of the U.S. submarine fleet and the special requirements ofsubmarine construction. We then assess the cost and schedule implications ofshutting down and restarting each of the principal elements of the submarineindustrial base—the shipyards, nuclear-system vendors, and nonnuclear-sys-tem vendors. Next, we show how the schedule effects of shutdown and restartinteract with factors such as desired fleet size, annual production rate, andnumber of operating shipyards to determine the maximum feasible gap (lengthof time) in submarine delivery. This analysis permits the construction of differ-ent time gap scenarios. We then estimate the costs of those scenarios, includ-ing the shutdown and restart costs calculated earlier. The quantitative analysisis combined with a qualitative assessment of important risks entailed in shut-down and restart to yield the report’s conclusions and final observations.
Our analyses drew on information from shipyards and vendors, components ofthe U.S. Navy and the Office of the Secretary of Defense, and foreign govern-ments with shutdown experience. Sources included persons with varying per-spectives on the seriousness of the delays, costs, and risks associated with aproduction gap. We reviewed all data critically, made adjustments where webelieved it appropriate, and built and ran models to draw inferences when thenature of the data permitted. Models and other methods specific to the indi-vidual analyses are discussed in connection with those analyses in the followingchapters.
Although we consider a wide variety of factors, the focus is on the productionbase. We do discuss some of the implications of shutdown and restart for thenation’s ability to design submarines (see, in particular, Appendix A), but notnearly in as much detail as we treat production. Clearly, design is required forproduction, and deterioration of the design base is as critical as losses to theproduction base.
We assume in our cost and schedule analyses that the motivation for restartingor continuing production is to replace obsolescent ships—or to preserve thecapacity to replace them. We do not attempt to analyze the implications of athreat to national security dramatic enough to warrant some sort of crash pro-gram to bolster the attack submarine force. While the events of the past few
______________2John Birkler, Joseph Large, Giles Smith, and Fred Timson, Reconstituting a Production Capability:Past Experience, Restart Criteria, and Suggested Policies, RAND, MR-273-ACQ, 1993.

Introduction 3
years indicate the volatility of the geostrategic environment, we believe that theemergence of such a threat in the near future is unlikely and, in any event, itsimplications are unclear. Suffice it to say that a national emergency could pro-vide the impetus to build the submarine force up more quickly than we indi-cate, given sufficient resources.
The study’s principal outputs were the analyses and conclusions specific tosubmarines, but we believe the approach we took is another important product.The overall conceptual framework and the individual models of workforcebuildup and fleet dynamics could be used in analogous studies of other types ofships facing similar acquisition decisions. With appropriate modification fordifferent production quantities, maintenance policies, and so forth, the analyti-cal tools developed here could also be applied to other types of major weaponsystems.


5
Chapter Two
BACKGROUND
This chapter provides some general background that may be helpful in under-standing the analyses that follow. After reviewing the history and current statusof U.S. submarine production and fleet composition, we discuss various perti-nent aspects of submarine design, production, and operational life. Finally, wedescribe the evolution and organization of the submarine production base.
U.S. SUBMARINE PRODUCTION TO DATE1
The nuclear submarine propulsion system emerged in the early 1950s as thesuccessor to the then-prevalent diesel-electric system, which used diesel en-gines on the surface and electric batteries while submerged. Nuclear powerpermitted a technical solution to the submarine’s greatest vulnerabilities—theneed to surface or snorkel periodically to recharge the batteries, and the sub-merged-speed constraint enforced by limited battery capacity. When the firstnuclear submarine, USS Nautilus, was commissioned, the U.S. submarine fleetconsisted of about 140 diesel-electric boats. New submarine classes wererapidly prepared for construction (see Figure 2.1). The Skate and Skipjackclasses2 were begun in the 1950s as refinements of the Nautilus concept. In1958, construction started on the Thresher (now Permit) class, which was thefirst of what would today be considered the modern, front-line submarine. Asthe cold war with the Soviet Union raged, the development of the ballistic mis-sile submarine became a national priority. Five classes of ballistic-missile-car-rying submarines (SSBNs) were fielded, representing step improvements inpropulsion technology and ship and missile design. In all, 41 SSBNs werecommissioned between 1960 and 1967. During this same period, 24 nuclear at-tack submarines (SSNs) were commissioned to augment the eight nuclear-powered submarines built before 1960.
______________1For a historical overview of submarine missions and construction funding, see Appendix B.2A submarine’s class is denoted by the name (or number) of the first ship of that type.

Utopia R ✺❁❐❆
Figure 2.1—Nuclear Submarines Commissioned, by Class
RANDMR456-2.1
Nautilus (1)Seawolf (1)
Skate (4)
Skipjack (6)
Triton (1)George Washington (5)
Halibut (1)Tullibee (1)
Thresher/Permit (14)
Ethan Allen (5)
Lafayette (9)
James Madison (10)
Benjamin Franklin (12)
Sturgeon (37)
Narwhal (1)Glennard P. Lipscomb (1)
Shading differentiates classes.
Los Angeles(62)
Ohio (18)
Seawolf (2)
55 56 57 58 59 60 61 62 63 64 65 66 67 68 69 70 71 72 73 74 75 76 77 78 79 80 81 82 83 84 85 86 87 88 89 90 91 92 93 94 95 96 97 98
Year
55 56 57 58 59 60 61 62 63 64 65 66 67 68 69 70 71 72 73 74 75 76 77 78 79 80 81 82 83 84 85 86 87 88 89 90 91 92 93 94 95 96 97 986
Th
e U.S. Su
bm
arine P
rod
uctio
n B
ase

Background 7
Meanwhile, the number of diesel submarines was rapidly reduced as World WarII vintage subs were scrapped or sold to allies (see Figure 2.2). The Navy’s avidpursuit of nuclear-powered submarines through the 1970s permitted the totalfleet size to remain relatively constant as the remainder of the diesel-electricships were removed from service. Now, the submarine force in active service iscompletely nuclear, comprising about 90 SSNs and 20 SSBNs.
The early nuclear submarine classes were small, often comprising only a fewships; some one-of-a-kind submarines were built. The concepts were new andmany unique designs were explored in searching for the best combination ofhull form, size, and propulsion and other internal systems. As submarinesevolved, class sizes became larger—a result of the early engineering and learn-ing process that discarded unworkable ideas and retained high performancecharacteristics. Large classes of multimission submarines gained a cost advan-tage from repeated construction of the same design.
Several classes of submarines are now in service or are being built (see Table2.1). The current version of SSBN in production is the Ohio class (sometimesreferred to as the SSBN 726 class or as the Trident class, after the name of itsmissile system). Fourteen Ohio-class submarines have been completed, withfour more being built. Some older SSBNs of the Lafayette class and the
RANDMR456-2.2
Sub
mar
ines
in fl
eet
Figure S.1—Total Cost to Shut Down, Maintain, and Restart a Shipyard���������������
���������������������������������������������������������������������������
0
20
40
60
80
100
120
140
160
180
1960 1970 1980 1990 2000
Pre-Ohio-class SSBNs
Diesel
Pre-Los Angeles-class SSNsLos Angeles- and
Seawolf-classSSNs
Ohio-class
SSBNs
Figure 2.2—Submarine Fleet Composition Profile

8 The U.S. Submarine Production Base
Table 2.1
Characteristics of Selected U.S. Submarine Classes
Ship Class
Length/Diameter
(feet)
Displacement(submerged)
(tons)
NumberCompleted
(year) Armament
Gato (SS-212) 312/21 2,391 73(1941–44)
24 torpedoes
Nautilus (SSN 571) 324/27 4,040 1(1954)
18 torpedoes
Sturgeon (SSN 637)a 292/32 4,640 37(1966–75)
24 torpedoes and missilesb
Los Angeles (SSN 688) 360/33 6,927 39(1976–89)
26 torpedoes and missiles(for last 8, see 688I)
Improved Los Angeles(SSN 751 or 688I)
360/33 6,927 23(1988–96)
26 torpedoes andmissiles and 12Tomahawks
Seawolf (SSN 21) 350/40 9,150 2 (+?)(1996– )
50 torpedoes andmissiles or 100 mines
Ohio (SSBN 726) 560/42 18,700 18(1981–97)
24 Trident C4 or D5missiles and 26 torpedoes
aSix of the Sturgeon-class submarines finished between 1971 and 1975 were larger (302 ft, 4960tons).bA combination of torpedoes and antiship missiles totaling 24.
Benjamin Franklin class remain in the inventory and are scheduled for deacti-vation in the next few years. Two older SSBNs have been converted to carry outspecial-forces delivery missions.
The oldest attack submarines in the active fleet are those of the Sturgeon class(SSN 637), whose construction was begun in the early 1960s. This submarineincorporated advanced quieting and sensor systems to make it one of the mostsuccessful classes of attack submarines in the fleet’s history. In all, 37 of thesesubmarines and one variant (USS Glennard P. Lipscomb) were built. SomeSturgeon-class submarines have been deactivated and all remaining ships ofthis class are scheduled for removal from the fleet by 2000.
In the early 1970s, construction began on the Los Angeles–class (SSN 688) sub-marine. This submarine was designed with an advanced propulsion plant togive the ship increased speed and maneuverability. In 1980, a major modifica-tion was begun with the USS Providence (SSN 719) and all following ships (31 inall), in which 12 tubes for Tomahawk land-attack cruise missiles were mountedin the ballast tanks in the bow. In 1983, work was begun on USS San Juan (SSN751), the first of what became known as the improved Los Angeles class. In

Background 9
these 688Is, the forward diving planes were moved from the sail to the bow andthe sail was strengthened, allowing ice penetration. Also, the combat systemwas improved. In all, 62 Los Angeles-class submarines have been authorized,with seven remaining in various stages of construction.
The newest class of attack submarine is the Seawolf (SSN 21), designed to com-bat the most advanced Soviet submarine threat. It incorporates advances inquieting, firepower, diving depth, sonar, and propulsion. Two Seawolf-classsubmarines have been authorized and are under construction. The first isscheduled for delivery in 1996.
As for the future, it is anticipated that the SSBN fleet will consist of 18 Ohio-class submarines; all earlier class SSBNs will be decommissioned or modifiedfor other service. Some of the early Los Angeles-class submarines are to be de-commissioned early as a cost-cutting effort by the Navy to reduce the size of thefleet. It is unlikely that large numbers of Seawolf-class submarines will be builtbecause of their cost (in the neighborhood of $2 billion). A third ship is plannedfor a 1996 construction start, though it is conceivable that no more than the twocurrently authorized will be funded.3 The Navy is also planning a new SSNclass, referred to as the “new attack submarine” (NSSN), more affordable thanthe Seawolf, to begin construction around 1998.4 Whether to build the thirdSeawolf and when to begin the NSSN are the key issues in defining a productiongap for attack submarines.
Regardless of what start date is chosen, there is no doubt that a new class ofsubmarines will be needed at some point. Observers disagree on the number ofattack submarines sufficient to achieve U.S. national security goals in the earlypart of the next century. But the numbers mentioned within the defense com-munity generally fall between about 40 and 60.5 As Figure 2.3 illustrates, with-out any new starts, the number of attack submarines in the fleet will fall below60 in 2008 and below 40 in 2013, as early Los Angeles-class submarines are de-commissioned at age 30.6
______________3In September 1993, the Administration announced its intention to complete the third Seawolf(SSN-23), and in October, the Department of Defense (DoD) released $540 million in funding previ-ously authorized by Congress for that ship (or other action to preserve the submarine industrialbase). Eventual construction of SSN-23 is subject to further congressional funding and approvals.4This program, the planning for which began in 1991, has also been endorsed by the ClintonAdministration.5The Administration has endorsed a range of 45 to 55. For a tabular comparison of U.S. and foreignsubmarine fleets, see Appendix B.6Submarines are designed for a service life of 30 years, although few actually serve that long. Theaverage age at decommissioning is 26. If the Los Angeles–class ships are withdrawn from the fleetbefore age 30, maintaining the force structure will be a more difficult problem. Service lives longerthan 30 years are considered later in this report.

10 The U.S. Submarine Production Base
Sub
mar
ines
in fl
eet
RANDMR456-2.3
0
20
40
60
80
100
120
1970 1980 1990 2000 2010 2020 2030
Pre-Los Angeles-class SSNs
Diesel
Los Angeles- andSeawolf-class
SSNs
Figure 2.3—Attack Submarine Fleet Composition, Past and Projected,No New Starts
EVENTS IN THE LIFE OF A SUBMARINE
Time required to design and build, cost to maintain, and when to deactivate areamong the factors that must be taken into account in deciding whether torestart production or continue at a low rate. For example, restarting productionwithout an experienced workforce would lengthen design and constructiontimes. Fewer or more maintenance actions may be needed if submarines aredecommissioned earlier or later than usual in an attempt to sustain a given fleetsize as efficiently as possible. An understanding of the events that take placeduring a submarine’s life is also necessary for an appreciation of the complexityof the tasks involved and thus of the risks entailed in shutting down productionand dispersing the workforce. Here, we discuss construction, maintenance,and deactivation of typical attack submarines by an active industrial base. Webegin with design, which is not part of the life history of an individual subma-rine but which must precede construction of the first ship of a new class.
Design
The time required to design a nuclear submarine class has varied greatly. Tosome degree, design time has been related to technical complexity of the sub-

Background 11
marine and its systems and the perceived military necessity for fielding the newclass. Nautilus was designed and engineered in a relatively short time—onlythree to four years were required to begin construction from the time the Navymade the decision to proceed with the project. The first SSBN experienced aneven faster design period. Military necessity demanded rapid development ofthe SSBN force and the first ship started life as an SSN in the constructionphase. During the construction process, systems were altered and the missilecompartment was added in order to develop the class more rapidly.
Design periods today (see Figure 2.4) are longer for a number of reasons. Asweapon systems have grown in complexity and expense, DoD has institutedrigorous schedules for their review and approval. The acquisition systemrequires specific milestones to approve the start of concept development, to ap-prove the concept and begin design and R&D, and to approve the design andbegin construction. The other major factor contributing to more lengthy designperiods is the technical complexity of the submarine. The Seawolf design teamhad been working for six years before construction started. Extensive investi-gation was needed to achieve the desired advances in quieting, sonar andcombat system capability, and hull form and maneuverability. (For moreinformation on design, see Appendix A.)
RANDMR456-2.4
Years0–5–10–15
Detaileddesign start
Preliminarydesign start
Launching DeliveryContractdesign start
Initialcriticality
Contract
Conceptualdesign start
Fabricationstart
Sea trials
CommissioningConstructionphase
Figure 2.4—Typical Submarine Design and Construction Timeline

12 The U.S. Submarine Production Base
Construction
The construction process begins after a contract is awarded to a shipbuilder.The Navy’s practice has been to procure long-lead-time equipment (for exam-ple, the reactor vessel and other large nuclear components) two years prior tothe expected contract award. After contract award, the shipbuilder procuresthe necessary material and subcontracted equipment and begins fabrication.
In constructing the submarine classes of the past, the hull was erected andopenings were cut to enable installation of major equipment. Cramped work-ing spaces and constrained access made running electrical cable, installing ma-chinery, and welding difficult. In addition, one trade had to finish its work be-fore another could start, contributing to construction inefficiencies.
By the early to mid 1980s, the industry had switched to a modular constructionapproach, in which steel is rolled and welded into hull cylinders and frames.Decks and supports are built into the cylinders, and equipment is loaded intoboth ends. Completed cylinders of up to 1000 tons are positioned and weldedtogether and the internal piping and wiring are joined. Access difficulties and“waiting time” are minimized, effecting significant cost and time savings.
The submarine is completely assembled inside a building to provide protectionfrom the weather and consistency of welds and measurements. When fabrica-tion is complete, the ship is launched. Once waterborne, all ship’s systems arereadied for testing. The testing process for a new submarine is complex andtechnically demanding. Individual components are inspected and tested. Next,systems are tested. In the culmination of the nuclear test program, the reactorplant is filled with coolant, all supporting systems are tested, and the reactor isthen operated for the first time and the entire propulsion system is checked out.Likewise, all other systems, including the combat system, are tested whiledockside.
When dockside testing is complete, the ship begins a sequence of trials at seawith its eventual Navy crew. These trials test hull integrity, propulsion capabil-ity, all sensors and weapons systems, navigation and communication systems,and acoustic performance. The sea trials generally take several months tocomplete. Once the trials are complete and all material deficiencies are cor-rected by the shipbuilder, the submarine is delivered to the Navy. This is fol-lowed by commissioning, the formal ceremony that officially places the subma-rine in the Navy’s service.

Background 13
Maintenance
While in service, the submarine operates at sea conducting training, fleet oper-ations, and deployments. During these operations, nearly all preventive main-tenance and much corrective material maintenance are performed by the ship’screw or its supporting intermediate maintenance activity (IMA) (submarinetender or base).
A submarine also undergoes a number of shipyard maintenance periods (seeFigure 2.5). The first time after delivery that the submarine is detailed to theshipyard is referred to as the postshakedown availability (PSA). Time out ofservice ranges from 4 to 12 months and serves mainly as a construction guaran-tee period for the shipbuilder, who repairs and adjusts submarine componentsand systems that have failed to meet specifications or otherwise require repair.Also, the government normally contracts with the shipbuilder to perform sys-tem alterations or modifications that were not performed during constructionbecause of contract cost, time limitations, or material availability.
Another type of maintenance action is selected restricted availability (SRA).SRAs, which are not shown on Figure 2.5, are normally two to three months induration. The primary purpose of the SRA is to inspect specific systems, whichoften requires drydocking, and to modify systems and components. SRAs canbe accomplished in a Navy or private shipyard, as well as at an IMA.
RANDMR456-2.5
-5 0 5 10 15 20 25 30 Years
Refuelingoverhaul
Deactivation
Major overhaulMajor overhaul
Postshakedown availability
Contract
Commissioning
New construction
Shipyard period
Figure 2.5—Illustrative Submarine Construction and Maintenance Timeline
14 The U.S. Submarine Production Base
For the more recently built submarines, the first major shipyard period follow-ing PSA is the depot modernization period (DMP). DMPs normally span 12–16months. Ship systems are upgraded and major components and systems arerefurbished. Inspections requiring major disassembly are also performed (forexample, removal of the propeller and shaft to allow inspection of the sterntube).
Overhauls are now conducted once or twice in the life of a submarine. Thesemajor shipyard periods can take 18–24 months to complete and take place in ei-ther public or private shipyards. Similar types of modernization, refurbish-ment, and inspections as in a DMP are conducted, but on a more thoroughscale. Following an overhaul, virtually all equipment on the ship has been re-furbished. Overhaul may also incorporate refueling. As experience is gained,overhaul frequency and core life are continually reevaluated. Nuclear sub-marines now in service must refuel once. For Seawolf, the core will have suffi-cient fuel and the requisite operating characteristics to last the life of the ship,and that is also the goal for the NSSN. This type of long-lived core will savemoney by eliminating the need to purchase additional reactor cores and to payfor refueling.
Deactivation
Deactivation removes a submarine from service. The submarine is decommis-sioned—it goes through a formal ceremony striking it from the Navy’s list of ac-tive ships—and is taken to a public or private shipyard for deactivation. Duringdeactivation, the nuclear reactor is defueled. All ship’s systems are shut downand drained. Fire-control computers and other recoverable equipment are re-moved and sent to other Navy facilities. The ship is prepared for towing andtaken to Puget Sound Naval Shipyard. Here, the reactor compartment, whichcontains all of the submarine’s radioactive systems, is cut out of the ship,sealed, and buried at a government site in Hanford, Washington. The remain-ing submarine hull is recycled as scrap metal.
THE SUBMARINE INDUSTRIAL BASE
The prolific submarine-building of the 1950s sustained a competitive industrialbase. Seven shipyards succeeded in winning Navy contracts for nuclear-pow-ered ships. Though the capital investment in yard capabilities and expendi-tures for training and maintaining a qualified workforce were great, so were theexpected payoffs. As shown in Table 2.2, 209 nuclear-powered ships were builtor are under construction. Component suppliers for the nuclear plants andother key submarine systems were similarly busy. The prospect of a large sub-

Background 15
Table 2.2
Shipyards That Have Produced Nuclear Ships
Shipyard First Keel Laid Last Ship Numbers Built
Electric Boat(Groton)
1952 – 56 Attack submarinesa
17 Polaris submarines18 Trident submarinesa
1 research vehicle
Newport NewsShipbuilding andDrydock Co.
1958 – 39 Attack submarinesb
14 Polaris submarines11 aircraft carriersb
6 cruisers
Electric Boat(Quincy)
1964 1969 2 Attack submarinesc
2 cruisers
Mare IslandNaval Shipyard
1956 1972 9 Attack submarines7 Polaris submarines1 Regulus submarine
Ingalls Shipbuilding Corp. 1958 1974 12 Attack submarines
PortsmouthNaval Shipyard
1955 1971 7 Attack submarines3 Polaris submarines
New York Shipbuilding Corp. 1960 1966 3 Attack submarines1 cruiser
aIncluding four Ohio-, two Seawolf-, and two Los Angeles–class SSNs under construction.bIncluding five Los Angeles-class SSNs and two CVNs under construction.cTwo additional subs counted here in Groton’s total were launched there and towed to Quincyfor outfitting.
marine fleet and the promise of nuclear energy led many companies into theproduction of nuclear equipment.
The boom years of the nuclear shipbuilding industry lasted through the 1960s.Many factors influenced the shrinking of the industry. With lessons learnedfrom the Thresher tragedy,7 shipbuilding standards became much more rigor-ous, requiring increased capital investment and sophisticated levels of man-agement and technical supervision. Components had come to last longer, so itwas no longer necessary to manufacture as many replacements and spares.Also, the demand for new submarines, which had been averaging eight per yearsince the late 1950s, suddenly fell to about four annually after 1966, as the
______________7USS Thresher was lost off New England on April 10, 1963, with its 129-man crew. The only otherU.S. nuclear submarine lost at sea was the Skipjack-class USS Scorpion, with a crew of 99, off theAzores on May 21, 1968.

16 The U.S. Submarine Production Base
RANDMR456-2.6
Num
ber
of s
ubm
arin
es s
tart
eda
14
10
8
6
4
01955 19801960 1965 1970 19751950
Restart year
2
12
1985 1990 1995
aNumber of keels laid through 1973; number of fabrication starts thereafter; three subs missed in this transition allotted arbitrarily to 1973 (1) and 1974 (2).
Figure 2.6—Nuclear Submarine Starts Fell Sharply in the Late 1960s,Again in the Early 1990s
Polaris fleet of SSBNs came to completion (see Figure 2.6). Only two yards stillconstruct nuclear ships.
The climate in the civilian nuclear industry worked to the detriment of thecomponent suppliers. Declining orders from civilian plants resulted in manysuppliers surviving with only the Navy as a customer. As a result, suppliers ofcritical nuclear components dwindled from 14 in the 1960s to 4 today.
Currently, there are two private shipyards and six naval shipyards that work onnuclear-powered submarines (see Table 2.3). New construction is undertakenby the two private shipyards—Electric Boat, a division of General Dynamics,and Newport News Shipbuilding and Drydock Company, a subsidiary ofTenneco. Both yards design and construct nuclear submarines, and both con-duct activities associated with PSAs and SRAs. Newport News also builds nu-clear aircraft carriers, and it can build and maintain other types of ships, bothmilitary and commercial.

Background 17
Table 2.3
Shipyard Capabilities for Nuclear-Submarine Construction and Maintenance
ShipyardNew
Construction SRA DMPOver-haul
Re-fuel
Deacti-vate
Electric BoatGroton, CT
X X x x
Newport News ShipbuildingNewport News, VA
X X x x x x
Pearl Harbor Naval ShipyardPearl Harbor, HI
X X X x x
Mare Island Naval ShipyardVallejo, CA
X X X X X
Puget Sound Naval ShipyardBremerton, WA
X X X x X
Portsmouth Naval ShipyardPortsmouth, NH
X X X x x
Norfolk Naval ShipyardPortsmouth, VA
X X X X X
Charleston Naval ShipyardCharleston, SC
X X X X X
NOTE: The 1993 Base Realignment and Closure commission recommended that Mare Island andCharleston be shut down in FY95.Key: X Currently conducting this operation.
x Has capability to perform.
The relationship between the private shipyards and the Navy is handledthrough contracts. The yards bid on work as solicited by the Navy and a selec-tion is made according to price and other criteria. The contracts are normallyawarded through the Naval Sea Systems Command (NAVSEA) and are adminis-tered by the Supervisor of Shipbuilding, Conversion, and Repair located at eachprivate shipyard.
The naval shipyards are owned and operated by the Navy. Senior naval officersand government-employed civilians hold supervisory positions in the shipyardorganization. The workforce and shop supervisors are civilian employees.Naval shipyards operate under commercial-like procedures, but do not havecontracting agreements in the traditional sense with the government. Navalshipyards are administered by NAVSEA.
Naval shipyards no longer construct new nuclear submarines. Although sub-marines were constructed at Mare Island Naval Shipyard and Portsmouth NavalShipyard in the past, the building ways are in disrepair and would require sub-stantial capital investment to recover. However, naval shipyards still perform a

18 The U.S. Submarine Production Base
wide range of activities from SRAs and DMPs to refueling overhauls and deacti-vations. Naval shipyards also make emergent repairs during the submarine’soperating life that are beyond the capability of a submarine tender or base. Inaddition to on-site activities, shipyards have formed highly trained mobile“tiger teams” that can make repairs and modifications at Navy bases or otherremote sites.
The private shipyards, component vendors, and naval shipyards represent thesurviving remnants of the industrial base assembled during the late 1950s tobuild advanced nuclear-powered submarines that could counter a major threatto U.S. national security. The early leaders of this effort, and Admiral Hyman G.Rickover in particular, had an unswerving demand for reliability and safety,combined with an insistence on personal responsibility. The result was an in-dustrial culture whose record of technical excellence may be unmatched.
Now, the future of the submarine industrial base as a continuing enterprise is indoubt. Only four new submarines have started construction this decade, andthe last of those is scheduled to be completed in 1998 (see Figure 2.7). If thethird Seawolf-class submarine and the NSSN are not started on schedule, it isquite likely that the skills built over the years will disperse. In the followingchapters, we analyze the implications of such a loss for the cost and schedule ofsubmarine production when restarted, and we compare those consequenceswith the savings realized from postponing further submarine production.

Background 19
1998
RANDMR456-2.7
1992
Year
Newport News Shipbuilding
Electric Boat
1993 1994 1995 20001996
SSN-762
SSBN-739
SSN-763
SSBN-740
SSN-768
SSBN-741
SSN-771
SSN-21
SSBN-742
SSN-22
SSBN-743
SSN-773
SSN-772
SSN-770
SSN-769
SSN-766
SSN-767
SSN-765
SSN-764
19991997
Figure 2.7—Submarine Completion Schedule


21
Chapter Three
EFFECTS OF A PRODUCTION GAP ON SHIPYARDS
Deferring future submarine production would result in savings arising from adecrease in the present discounted value of that production. It would also re-sult in costs, because personnel would have to be released, facilities would haveto be shut down “smartly”1 and maintained during the gap, and then theworkforce would have to be reconstituted. The savings are straightforwardlycalculated from the shift in submarine production scheduling, which we takeup in Chapters Six and Seven. The costs are not straightforward, and we ad-dress them in detail here for the shipyards and in the next two chapters for ven-dors providing nuclear and nonnuclear submarine components to the ship-yards.
We present cost estimates for “smartly” shutting down submarine productioncapability at the shipyards, maintaining the production capability in a dormantstate for a period of time, and then reestablishing production at the shipyards inthe future. Postrestart production schedule estimates are given in terms of thetime needed to build the first submarine and the time to reach the desired sus-tained rate of submarine production.
Because the costs of shutdown and reconstitution are greatly influenced by thestatus of the yards during the halt in submarine production, we examine sixdistinct cases. In two base cases—one for Electric Boat (EB) and one forNewport News Shipbuilding (NNS)—we assume no new submarine productionwork at either yard and that the next aircraft carrier (CVN-76) will not be con-structed in the foreseeable future. This would leave only the current submarineworkload at EB and would result in the complete shutdown of EB’s facilitieswhen that workload is finished in 1998. NNS’s submarine production work isscheduled to be completed in 1996. Other NNS work includes the construction
______________1“Smart” shutdown entails extra investment to preserve institutional knowledge and infrastructurein the interest of promoting efficient restart.

22 The U.S. Submarine Production Base
of CVN-74 (Stennis) and CVN-75 (United States) and the overhaul of CVN-65(Enterprise).2
In our third case, we assume the decision is made to build CVN-76 at NewportNews with authorization in FY95. This would keep facilities open and allow fora larger workforce at the start of NSSN production than would otherwise be thecase. In our fourth and fifth cases, we consider the impact on shutdown and re-constitution costs and schedules for both the baseline cases if submarine repairand overhaul work (including SSBN work) is redirected from the Navy’s ship-yards to the private yards. Finally, we evaluate a partial EB analogue to theCVN-76 case: constructing a third Seawolf-class submarine (SSN-23).3
In this chapter we first discuss certain elements of our approach. We then gothrough the various cost elements in some detail for the initial baseline case.Summary findings are then given for all the cases considered, along with theprincipal lessons we drew from them. The other cases are treated in depthequal to that of the initial baseline case (though partially by reference to it) inAppendix C.
METHODOLOGY
This section outlines our general assumptions, our sources of data, and ourprincipal method for modeling the most important category of costs andschedule delays. First, we identify in more detail the costs associated with pro-duction gaps at the shipyard: (1) the costs to “smartly” shut down and mothballthe facilities at the shipyard and to release some portion of the shipyard per-sonnel, (2) the costs to maintain the production facilities in a dormant statusincluding the annual costs associated with any personnel retained during theproduction hiatus, and (3) the cost to reconstitute the production facilities andto hire and train the production workforce. Note that each of the three costcomponents comprises facility- and personnel-related costs. (We also estimateany gap-related costs borne by submarines currently under construction.)
______________2We limit our analysis for NNS to submarine and carrier workloads. There is other work currently inthe yard, including some commercial ship repair work. And, there is the possibility of other futuremilitary and commercial construction or repair work.3EB also builds ballistic-missile-carrying submarines (as has NNS in the past), but replacement ofthe SSBN fleet will not get under way until after the period covered by this analysis of shipyardreconstitution.

Effects of a Production Gap on Shipyards 23
Analysis Assumptions
Assumptions specific to the cases examined are stated in the discussion of re-sults for those cases. General assumptions for the shipyards analyzed are asfollows:
• DoD will assume all costs for shutting down, maintaining, and reconstitut-ing the submarine production capabilities.
• Each of the shipyards will be willing to reconstitute production capabilities.
• There will be no political, environmental, or other pressures that wouldstop reconstitution.
• Nuclear licenses and environmental permits associated with restartingsubmarine construction will be granted after proper certification by con-trolling agencies.
• Engineering and design capabilities will be maintained at the shipyard,funded by DoD and Navy research and development moneys.
• Vendors of nuclear and nonnuclear components remain in place.
It is unlikely that all these conditions would be met in the event of an extendedgap. If any are not met, costs and delays would be greater than those estimatedhere. We restrict ourselves in this chapter to quantifiable shipyard productioncost and schedule effects. The risks involved in not meeting the conditionslisted are discussed elsewhere in this report.
It is important to bear in mind one other matter related to the scope of thisanalysis. We estimate only costs to DoD. We do not consider any costs associ-ated with loss of employment or reduced revenues to state or local governmentsduring a production gap. Such social-welfare costs are likely to be large.
We also note that only the costs associated with delays in production are in-cluded. We do not include costs that would also be incurred if there were nofurther delay, such as depreciation writeoffs in compensation for capital in-vestment or future workman’s compensation and medical claims attributableto the current workforce.
Data for Cost Estimates
Various offices throughout the Navy provided insights and data for this analysis.The majority of our shutdown-and-restart cost and schedule estimates arelargely based on inputs from functional-area experts at EB and NNS.

24 The U.S. Submarine Production Base
In reviewing these data, we were aware, of course, that both EB and NNS havean interest in the outcome of our analysis. Since EB produces submarines only,a lengthy production hiatus is not in EB’s interest. NNS has other options tohelp it outlast a gap and its principal competitor. We interacted with EB andNNS to fully understand the logic and sources that underlie their estimates. Insome cases, we modified the shipyards’ estimates based on other data or as-sumptions. Historical data were also used whenever available. We are satisfiedthat the data used represent a reasonable, unbiased characterization of subma-rine production in the shipyards.
Data were also received from several public shipyards on the overhaul and re-fueling of 688-class submarines. Finally, we consulted with the submarine in-dustries in Great Britain and France to understand how they deal with very lowproduction rates and their experience with production gaps. What we learnedfrom the British and French experience is recounted in some detail inAppendixes D and E.
Modeling Workforce Buildup and Postrestart Production
Methods for calculating most of the cost elements are straightforward and arepresented with the detailed results in this chapter and in Appendix C.Calculation of the personnel costs associated with restarting production andestimation of postrestart production schedules are more complicated and aresummarized here. Further explanation is offered in Appendix F.
The first ships of a new class built following a production gap will cost morethan they would have had there been no gap; they will also take longer to build.Four factors contribute to the extra cost and time:
• The production workforce will have to be rebuilt through hiring and train-ing of workers.
• The rate at which the workforce can be built up will be limited by the avail-ability of skilled workers who can act as mentors.
• In the initial years, the workforce will be less efficient than the preshutdownworkforce because it will have a larger proportion of less experienced per-sonnel.
• At the outset, the shipyard’s fixed overhead will be spread over fewer shipsthan it would have been on a steady schedule of two or three ships peryear.4
______________4Fixed overhead per ship is not, strictly speaking, a personnel-related cost. However, the number ofships in the yard is limited by the rate at which the workforce can be reconstituted. We thus

Effects of a Production Gap on Shipyards 25
To quantify the cost and schedule penalties of restarting production, we built amodel that takes as inputs the initial size of the workforce and the number ofexperienced workers available in subsequent years from any ongoing produc-tion lines for earlier-class submarines or aircraft carriers. Other variable inputsinclude the number of inexperienced workers a fully skilled worker can mentorand worker attrition rates as a function of experience. Taking all this into ac-count, the model increases the workforce in annual steps, calculating the totalworker-hours produced.
In estimating the production schedule, two other inputs come into play: rela-tive worker efficiencies as a function of experience and the target annual sus-tained production rate. The first of these permits the model to calculate the ef-fective number of worker-hours produced per year—that is, the equivalent infully-skilled-worker-hours. A submarine is “delivered” when enough worker-hours have been accumulated to complete a ship and to get far enough alongon others so that progress is being made toward the desired sustained rate. Thenumber of effective hours required to complete a ship is a nominal figure basedon experience and anticipation of the character of the next class.
To calculate the cost penalty, the model considers three further inputs: hiringand training cost per worker, worker wages as a function of experience, andvariable and fixed overhead.5 These permit the estimation of total cost over thetime it takes to reach the sustained production rate. By subtracting the amountit would have cost to build the same number of ships with a fully skilledworkforce at the sustained rate, the total cost penalty is obtained. This is thepersonnel-related cost of reconstitution.
AN ILLUSTRATIVE CASE: BASELINE ESTIMATESFOR ELECTRIC BOAT
Given the assumptions and approach described above, this section outlines thedevelopment of the cost and schedule implications for our first case—ElectricBoat becomes inactive after current submarine production ends. We go intosome detail here to illustrate the way in which we took into account the fullrange of shutdown-, maintenance-, and restart-related costs in coming up withthe summary results. Similar details regarding the other cases are given inAppendix C.
________________________________________________________________________accounted for fixed overhead in our workforce reconstitution cost model, but it was not practical toquantify and separate the portion of total extra cost attributable to fixed overhead (or any otherfactor).5The model also accounts for the cost of materials, but this was not varied with gap length and isnot part of the cost penalty.
26 The U.S. Submarine Production Base
Some background on facilities may be helpful in understanding what follows.Groton, Connecticut, is the headquarters for EB and houses the engineeringand major shipbuilding functions. The manufacture of complex components,the final outfitting and assembly of hull sections, the loading of nuclear fuel anddockside testing of propulsion plants, and the final operational testing of thecomplete ship all take place at Groton.
EB’s facility at Quonset Point, Rhode Island, has extensive facilities for the au-tomated manufacture and outfitting of major hull sections. Completed mod-ules are barged from Quonset to Groton for assembly into the final product.
For this case, we assume that SSN-22, to be delivered in June 1998, is the lastsubmarine constructed (i.e., there is no SSN-23). This would result in theQuonset facility closing in 1995 and the Groton facility closing in late 1998.
In reporting our cost and schedule estimates for EB, we begin with the addi-tional gap-related cost accruing to submarines now under construction andproceed to shutdown, annual maintenance, and restart. First, however, amethodological point of particular importance to this case deserves some ex-planation.
Sizing the Residual Cadre
From the remaining workload, we estimated the drawdown in the workforce assubmarine construction winds down over the next several years. We assumethat the workforce would not be allowed to fall below some threshold numberof management and production personnel. This core, maintained during theproduction hiatus, would be the foundation to build upon and train new work-ers when production resumes. How large should this cadre be?
We obtained from EB an estimate of the direct production worker-hour re-quirements, by skill, to produce a notional 10 million worker-hour submarine.The skill workloads were defined by quarter over a five-year construction pe-riod. For each skill, we identified the quarter in which worker-hours peakedand converted the worker-hours into approximate personnel levels. The totalof the peak-quarter personnel requirements across all skills was 2579.
We assume that at least 10 percent of that number would be needed to form thecore workforce to retain during the production hiatus. We therefore base ourcost estimates on a core workforce of 260 production personnel. As indirecthours are about 15 percent of direct hours, we add 40 indirect/managementpersonnel to the core to bring the total to 300. We consider this core to be amimimum.

Effects of a Production Gap on Shipyards 27
A much larger cadre could be justified. In fact, adding persons to the cadrewould result in long-run net savings. The reason for this is that the costs of re-building the workforce after a production gap are large—the smaller the work-force at restart, the larger the cost (this is discussed in more detail below and inAppendix F). The cost of paying an extra cadre worker over the duration of agap is less than the rebuilding cost saved by having that worker available atrestart. With each additional person, the marginal savings at restart decrease,so at some point the net marginal gain drops to zero and a cost-minimizingcadre is reached. First-cut analyses along these lines suggest the cost-minimiz-ing cadre may be several times the size of the one we use.
There is a problem with such an approach, however. Simply proliferating thenumber of workers on the payroll and the money paid them begs the questionof whether skills can be maintained during a gap. What would the cadre do?Over the short run, cadre personnel could provide the labor for the postshake-down availabilities for the new Trident and Seawolf submarines. They alsocould interact with the design and engineering staffs, working on mock-ups andprototype sections of new submarine designs. Finally, there may be a way towork out agreements with countries such as France, Germany, or the UnitedKingdom that will still be building submarines during the production hiatus inthe United States. Regardless, the larger the cadre, the more difficult it wouldbe to find enough for them to do to retain their mentor qualifications at restart.Thus, we opt for the smaller cadre, although in other cases we do estimate theeffects of keeping a larger number of people profitably employed by directingoverhaul work to the private yards.
Impact on Submarines Currently in Construction
If production at EB does not restart until FY96 or later, there will likely be someimpact on the cost of the eight submarines currently being built. Additionalcosts would result from two sources. First, incentive bonuses to key manage-ment and trade personnel may be required to ensure that they do not leave theprogram in the lurch prior to completion of the last submarine by acceptingother job offers in anticipation of shutdown. We estimate that at most 2000personnel would fall into this category and that the average bonus would be$10,000.6
Second, one might anticipate a decrease in morale among the workforce.Facing termination of their jobs, there may be a tendency toward decreasedproductivity. There would also be some loss in efficiency and additional costsassociated with transferring work from Quonset to Groton. We assume ineffi-
______________6All costs in this chapter (and in Appendix C) are in constant FY92 dollars.

28 The U.S. Submarine Production Base
ciencies will increase the remaining workload by a percentage based on whenthe next new start is authorized. If the next submarine is authorized in FY00 orlater, we estimate the total inefficiencies would amount to 10 percent of the12,000 worker-years remaining. We cost each additional worker-year at$50,000.
Our estimates of the costs are given by year of restart in Table 3.1.7 If a newstart is authorized by FY96, both the Groton and Quonset facilities would re-main open and no additional costs should accrue. Later starts result in the clo-sure of one or both facilities, requiring some retention bonuses and resulting insome loss in productivity. The full impact on the cost of submarines now inconstruction is realized for restarts in FY00 or later.8
Costs of Smart Shutdown
Completely shutting down production capabilities at EB will incur costs for fa-cilities and equipment (both nuclear- and nonnuclear-related), personnel re-lease, and vendor liabilities. The first category includes the cost of mothballingequipment to keep it in condition to save time and money at restart. Cranesmust be preserved, portable equipment must be palletized and stored, an in-ventory must be taken, etc. Nuclear-related costs are for securing and monitor-ing equipment and facilities; we assume there will be no other activities relatedto handling nuclear components and no environmental cleanup required.
To calculate worker release cost, we assume a workforce profile of 13,400 pro-duction and indirect-support employees at the end of the 1993 fiscal year, allbut 300 of whom would be released. We allowed $5000 per worker for place-ment, retraining, and adjustment services (of which $3000 would be for Title IIINational Reserve Funds for Defense Impacted Workers requested from theDepartment of Labor). Shutdown-related vendor cost escalation9 was esti-
______________7It is important that this and other similarly constructed tables not be read as expenditureprofiles—so much incurred in (or by) FY97, so much in (or by) FY98, and so on. The cost cited forFY97 is the total bonus-and-inefficiency cost incurred in all years if submarine production isrestarted in FY97. (Exception: tables of annual maintenance costs.)
Although we do not expect NSSN construction to start before FY98 (and this case assumes no SSN-23), we report results for earlier years. We do this because the cost and personnel data for FY98 andbeyond are more easily understood if the results for the antecedent years are also displayed.8The costs of ships in construction could also be affected if the current schedule is either stretchedor compressed in response to the NSSN start date. We cannot estimate the likelihood of such anoccurrence.9Information from EB indicates that General Dynamics’ Quincy shipyard experienced such costescalation not only during its shutdown but during preceding program downturns that suggestedshutdown might be imminent. The extra costs are thought to be the result of several factors,including vendor attempts to recover unamortized development cost over a smaller number ofships and future restart of cold production lines for replacement parts.

Effects of a Production Gap on Shipyards 29
Table 3.1
Cost Impact on Current EB Submarines Under Construction
Next StartNumber of
BonusesExtra
Worker-YearsTotal Cost
(millions of $FY92)
FY95 0 0 0FY96 0 0 0FY97 500 300 20FY98 1000 600 40FY99 1500 900 60FY00 or later 2000 1200 80
NOTE: Each bonus costs $10,000; each extra worker-year costs $50,000.
mated at 5 percent of the cost of specialty material and engineered components(the “Plan and Mark” cost) for the last two submarines in production.
The full shutdown costs would be incurred if the next production start is inFY00 or beyond. The pre-FY00 timing of these costs is taken up in Tables 3.2(supporting data) and 3.3 (costs themselves). For restart before FY00, Grotoncould remain open; before FY97, Quonset Point could also remain open. Site-specific facility- and equipment-related shutdown costs are timed accordingly.Personnel-related costs are calculated from worker releases based on the antic-ipated submarine work profile (Table 3.2). Vendor liability costs are assumed toincrease as restart is postponed from FY97 to FY00.
Annual Cost of Maintaining Production Capabilities
The longer the gap lasts and the more facilities shut down, the more it will coston an annual basis to maintain those facilities. Costs will be incurred, for ex-ample, for around-the-clock security plus manpower and material for preven-
Table 3.2
EB Personnel Released by Various Dates
Date
WorkersRemaining
at Start of Year
WorkersReleased During
Previous YearCumulative
Workers Released
FY94 13400FY95 12800 600 600FY96 9900 2900 3500FY97 5200 4700 8200FY98 2000 3200 11400FY99 700 1300 12700FY00 300 400 13100FY01 or later 300 0 13100
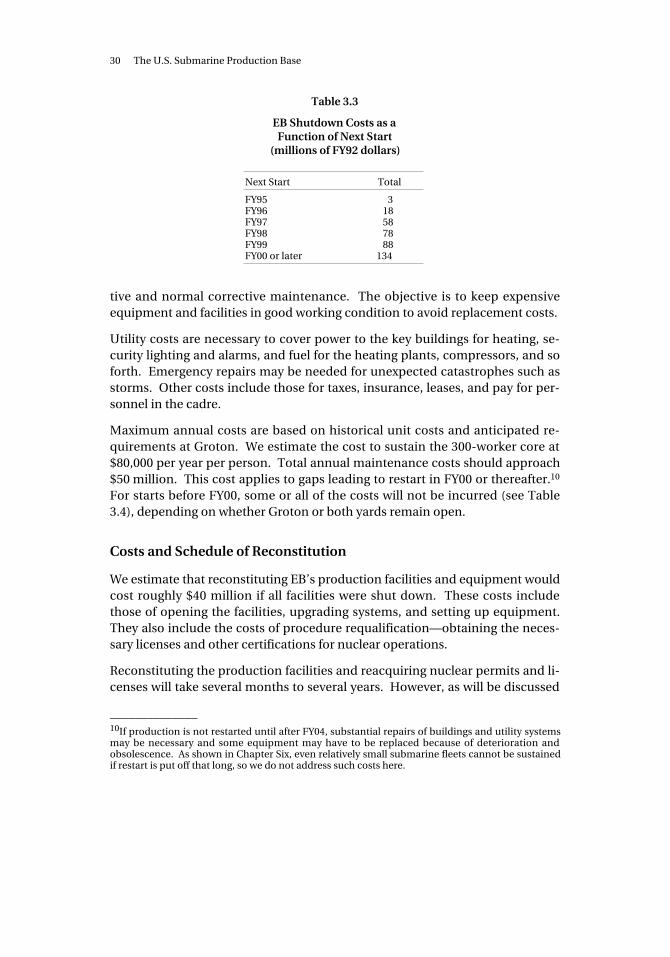
30 The U.S. Submarine Production Base
Table 3.3
EB Shutdown Costs as aFunction of Next Start
(millions of FY92 dollars)
Next Start Total
FY95 3FY96 18FY97 58FY98 78FY99 88FY00 or later 134
tive and normal corrective maintenance. The objective is to keep expensiveequipment and facilities in good working condition to avoid replacement costs.
Utility costs are necessary to cover power to the key buildings for heating, se-curity lighting and alarms, and fuel for the heating plants, compressors, and soforth. Emergency repairs may be needed for unexpected catastrophes such asstorms. Other costs include those for taxes, insurance, leases, and pay for per-sonnel in the cadre.
Maximum annual costs are based on historical unit costs and anticipated re-quirements at Groton. We estimate the cost to sustain the 300-worker core at$80,000 per year per person. Total annual maintenance costs should approach$50 million. This cost applies to gaps leading to restart in FY00 or thereafter.10
For starts before FY00, some or all of the costs will not be incurred (see Table3.4), depending on whether Groton or both yards remain open.
Costs and Schedule of Reconstitution
We estimate that reconstituting EB’s production facilities and equipment wouldcost roughly $40 million if all facilities were shut down. These costs includethose of opening the facilities, upgrading systems, and setting up equipment.They also include the costs of procedure requalification—obtaining the neces-sary licenses and other certifications for nuclear operations.
Reconstituting the production facilities and reacquiring nuclear permits and li-censes will take several months to several years. However, as will be discussed
______________10If production is not restarted until after FY04, substantial repairs of buildings and utility systemsmay be necessary and some equipment may have to be replaced because of deterioration andobsolescence. As shown in Chapter Six, even relatively small submarine fleets cannot be sustainedif restart is put off that long, so we do not address such costs here.

Effects of a Production Gap on Shipyards 31
Table 3.4
EB Annual Maintenance Costs Prior to Next Start(millions of FY92 dollars)
Year Quonset Groton Total
FY95 0 0 0FY96 0 0 0FY97 8 0 8FY98 8 0 8FY99 8 0 8FY00 or later 8 40 48
NOTE: Costs on a given line accrue if restart occurs in thatyear or afterward; for example, if restart occurs in FY97 orthereafter, the $8M on the FY97 line accrues.
in more detail shortly, the limiting factor in getting production restarted will bethe time to hire and train the production workforce.
An additional element of equipment-related reconstitution cost is that of re-constituting computers and business information systems and hiring andtraining computer-related personnel. Because engineering and design func-tions will continue during any production hiatus, there will be a core computersystem to build upon when production resumes. However, that core must beexpanded, new software and equipment added, and personnel trained. Thefarther beyond FY99 that restart occurs, the greater the magnitude of this ex-pansion above the core system.
Personnel inputs to the workforce buildup model are shown in Table 3.5. Thefirst three columns are similar to those of Table 3.2, but only production work-ers are included. The workers available for restart are 90 percent of thosereleased during the previous year, plus 20 percent of those released the year be-
Table 3.5
Skilled Workforce Available When Production Resumes
RestartYear
WorkersRemainingat Start of
Year
WorkersReleased During
Previous Year
WorkersAvailable for
RestartSkilled Transfers This
Year and After
FY95 10500 500 550 9450FY96 8000 2500 2350 7200FY97 4000 4000 4100 3600FY98 1500 2500 3050 1350FY99 500 1000 1400 450FY00 260 240 676 0FY01 260 0 308 0FY02 or later 260 0 260 0

32 The U.S. Submarine Production Base
fore that. Skilled transfers are 90 percent of those released from current sub-marine construction lines in the year of restart and thereafter. Thus, for exam-ple, in the event of a restart in FY98, we estimate that 3050 workers will be avail-able for restart: 90 percent of the 2500 who were released during FY97 plus 20percent of the 4000 who were released during FY96. In addition, we anticipatethat of the 1500 workers remaining on the 688 and Ohio lines at thestart of FY98, 90 percent (or 1350) will become available for transfer to the NSSNline as their work on the current lines ends in FY98 and FY99.
To the costs produced by our model, which considers only production workers,we add the cost of hiring indirect support personnel. We calculate the supportpersonnel needed as 30 percent of the growth in the production workforce afterrestart and multiply that number by $2000 to account for hiring, relocation, andtraining. This cost ranges from $4 to $10 million, depending on restart year andproduction rate.
As shown in Table 3.611 and Figure 3.1, the total cost to reconstitute theworkforce dwarfs the previous cost elements described. For a sustained pro-duction rate of two submarines per year and the other assumptions noted in thetable, personnel-related reconstitution costs top one billion dollars if restart isdeferred until FY00. Costs escalate as the gap is lengthened or the productionrate increased.
Deferring restart until FY00 also increases the time required to build the firstsubmarine from the nominal six years12 to seven (see Figure 3.2; assumptions
Table 3.6
Total EB Personnel Reconstitution Costs(millions of FY92 dollars)
Next Start Rate = 2 Rate = 3
FY98 331 606FY99 703 1032FY00 1236 1623FY01 1665 1972FY02 or later 1747 2125
NOTE: The case assumes a fixed overhead of $150 mil-lion (pessimistic), early attrition rate of 5 to 10 percent(optimistic), and mentor/trainee ratio of 1:2 (inter-mediate).
______________11Costs in this and analogous tables in Appendix C are expressed with more precision than theestimates merit. These numbers must be combined with the much smaller shutdown and restartcosts, so we retain all digits as if they were significant.12In this and other cases, the model yields times of less than six years, but it does not take intoaccount calendar-time requirements for sequential completion of tasks. We assume a six-yearminimum for construction of the first submarine. (See Appendix F.)

Effects of a Production Gap on Shipyards 33
RANDMR456-3.1
Bill
ions
of F
Y92
dol
lars
2.5
2.0
1.5
1.0
0.5
0FY99 FY04FY00 FY01 FY02 FY03FY98
������������
����������
��������������
���������
����������
������������������
Restart year
����Rate = 3
Rate = 2
Figure 3.1—Total EB Personnel Reconstitution Costs
RANDMR456-3.2
Yea
rs to
ach
ieve
mile
ston
es
18
14
12
2
0FY99 FY04FY00 FY01 FY02 FY03FY98
Restart year
����
Milestone
Rate = 3
Rate = 2
1st delivery
8
6
10
16
4
���������
�������������������������
���������
����������
��������������
Figure 3.2—EB Postrestart Production Schedule

34 The U.S. Submarine Production Base
are those of Table 3.6). Increasing the gap another year increases the construc-tion time to ten years. The time required to reach a sustained production rateof two per year rises rapidly from about six years for an FY98 restart to approxi-mately 15 years for FY01.
SUMMARY OF RESULTS ACROSS ALL CASES
Figures 3.3 through 3.9 and Table 3.7 display the gap-related shipyard costs es-timated for each of the six cases identified at the beginning of this chapter (plusone excursion), starting with the illustrative case just detailed. Figures 3.10 and3.11 show the postrestart schedule results for delivery of the first submarine.Costs are broken out according to the categories identified above.13 Eachvertical bar represents, for restart in the year identified with it, the total extracosts associated with a production gap, summed across all years from the startof the gap into the distant future.
FY03�������
�������
����
����
����
RANDMR456-3.3
FY98
Restart year
Bill
ions
of F
Y92
dol
lars
2.5
2.0
1.5
1.0
0.5
0
Restart
Cumulativemaintenance
Shutdown����
FY99 FY00 FY01 FY04
Maximum rate = 2 per year
FY02
Figure 3.3—Shipyard Reconstitution Costs, Electric Boat, No Work Beyond ThatCurrently Under Way, Maximum Rate = 2 per Year
______________13Shutdown costs include impact on submarines currently in construction.

Effects of a Production Gap on Shipyards 35
FY03��������� ��
������
����
RANDMR456-3.4
FY98
Restart year
Bill
ions
of F
Y92
dol
lars
2.5
2.0
1.5
1.0
0.5
0
Restart
Cumulativemaintenance
Shutdown��
FY99 FY00 FY01 FY04
Maximum rate = 2 per year
FY02
Figure 3.4—Shipyard Reconstitution Costs, Newport News, No Work Beyond ThatCurrently Under Way, Maximum Rate = 2 per Year
FY03��������� ������
RANDMR456-3.5
FY98
Restart year
Bill
ions
of F
Y92
dol
lars
2.5
2.0
1.5
1.0
0.5
0
Restart
Cumulativemaintenance
Shutdown����
FY99 FY00 FY01 FY04
Maximum rate = 2 per year
FY02
Figure 3.5—Shipyard Reconstitution Costs, Newport News, with Additional AircraftCarrier (CVN-76), Maximum Rate = 2 per Year

36 The U.S. Submarine Production Base
FY03��������� ������
RANDMR456-3.6
FY98
Restart year
Bill
ions
of F
Y92
dol
lars
2.5
2.0
1.5
1.0
0.5
0
Restart
Cumulativemaintenance
Shutdown����
FY99 FY00 FY01 FY04
Maximum rate = 2 per year
FY02
Figure 3.6—Shipyard Reconstitution Costs, Electric Boat,with Overhaul Work, Maximum Rate = 2 per Year
FY03��������� ������
RANDMR456-3.7
FY98
Restart year
Bill
ions
of F
Y92
dol
lars
2.5
2.0
1.5
1.0
0.5
0
Restart
Cumulativemaintenance
Shutdown����
FY99 FY00 FY01 FY04
Maximum rate = 2 per year
FY02
Figure 3.7—Shipyard Reconstitution Costs, Newport News, with Overhaul Work(no CVN-76), Maximum Rate = 2 per Year

Effects of a Production Gap on Shipyards 37
FY03�� ������
RANDMR456-3.8
FY98
Restart year
Bill
ions
of F
Y92
dol
lars
2.5
2.0
1.5
1.0
0.5
0
Restart
Cumulativemaintenance
Shutdown����
FY99 FY00 FY01 FY04
Maximum rate = 2 per year
FY02
Figure 3.8—Shipyard Reconstitution Costs, Electric Boat,with Third Seawolf, Maximum Rate = 2 per Year
FY03���������
������
����
����
RANDMR456-3.9
FY98
Restart year
Bill
ions
of F
Y92
dol
lars
3.0
2.0
1.5
1.0
0.5
0
Restart
Cumulativemaintenance
Shutdown��
FY99 FY00
2.5
FY01 FY04
Maximum rate = 3 per year
FY02
Figure 3.9—Shipyard Reconstitution Costs, Electric Boat, No Work Beyond ThatCurrent, Maximum Rate = 3 per Year

38 The U.S. Submarine Production Base
Table 3.7
Summary of Shipyard Cost Effects of Deferring Production
Cost ($M) for Restart in
Case FY98 FY99 FY00 FY01 FY02 FY03 FY04
EB inactive, 2/yr 470 880 1580 2080 2230 2300 2370NNS inactive, 2/yr 610 1010 1780 2140 2200 2250 2290NNS w/CVN-76, 2/yr 510 790 720 640 560 510 510EB w/overhaul, 2/yr 430 820 1170 1260 1280 1310 1340NNS w/overhaul, 2/yr 540 870 1140 1200 1230 1240 1260EB w/SSN-23, 2/yr 400 570 770 1040 1180 1670 2020EB inactive, 3/yr 750 1210 1970 2390 2610 2680 2740
NOTE: Assumptions in Table 3.6 and elsewhere in this chapter apply. For full cost summary, SeeTable C.21.
RANDMR456-3.10
Yea
rs
12
10
6
4
0FY99 FY04FY00 FY01 FY02 FY03FY98
Restart year
8
2
�������������
������������
����������
��No further work
With SSN-23
With overhaul
Figure 3.10—Time to Deliver First Ship After Restart, Electric Boat
The results are based on similar assumptions, with some variations (largelyworkload-based) to allow accurate characterization of the two shipyards. Theresults shown are based on a sustained production rate of two ships per year.An exception is Figure 3.9, which depicts an excursion from the EB baselinecase at three ships per year. Results for the other cases at the higher rate are

Effects of a Production Gap on Shipyards 39
RANDMR456-3.11
Yea
rs12
10
6
4
0FY99 FY04FY00 FY01 FY02 FY03FY98
Restart year
8
2
��No further work
With CVN-76
With overhaul(no CVN-76)
����������������
�����������������
Figure 3.11—Time to Deliver First Ship After Restart, Newport News
given in Appendix C (along with the details of the cost elements supporting thegraphs shown here).
The results shown are true only for the set of assumptions they represent (seethe note to Table 3.6). We believe the assumptions we made have the effect,taken together, of fairly representing likely cost and schedule effects. The re-sults are thus neither particularly conservative nor anything near a worst case.However, they could change substantially for different reasonable assumptionsregarding the rate at which the workforce could be built up, level of fixed over-head, attrition rates, and many other factors (see Appendix F). Nonetheless, ab-solute values aside, we believe that certain conclusions that rest on the relationsamong elements in the graphs would be fairly resistant to changes in assump-tions. The following conclusions represent the central lessons that should bedrawn from our analysis of shipyard costs and schedule.
Costs generally increase with gap length. This goes for all three classes of costelements:
• The longer the gap, the farther the current submarine construction pro-gram goes toward completion. Facilities begin to shut down, equipmentneeds to be stored properly, and personnel are paid severance and retrain-

40 The U.S. Submarine Production Base
ing allowances as they are released. Eventually, all facilities close and theworkforce falls to a minimum cadre that must be maintained to train re-cruits at restart. Simultaneously, this drawdown could cause inefficienciesin the remaining workforce that increase the cost of submarines currentlyunder construction.
• Shut-down facilities need to be secured and maintained during a gap. Thelonger the gap, the more facilities need attention and the longer they needit. Also, if a gap is long enough for the workforce to fall to a minimumcadre, then the longer the gap, the longer that cadre must be sustained.
• The more facilities are shut down, the greater the expense to reopen themwhen production restarts. Also, the more the workforce has decreased, themore it will cost to build it back up again.14 This is the most importantfactor in the gap length relations and leads us to our second principal con-clusion.
Personnel-related reconstitution costs dominate. This is true across all casesand all restart years. The costs of rebuilding a workforce account for two-thirdsto 90 percent of all shipyard reconstitution costs. The reasons for this are givenin the factors listed in the description of the workforce model: Not only is itnecessary to account for hiring and training, but also for the inefficiency ofnewly hired workers and the need to allocate fixed shipyard overhead to the fewboats that a slowly growing workforce can simultaneously build.
In addition to the delay corresponding to the length of the hiatus itself, a pro-duction gap can add several extra years to the time to construct the first sub-marine (which is nominally six years; see Figures 3.10 and 3.11). The main rea-son for this is that it takes time to rebuild a skilled workforce.
Gap-related costs and delays decrease if other work is available. The equiva-lent of half an overhaul per year would keep only a small fraction, roughly 10percent, of the eventual sustained-rate workforce employed. That is enough,however, to cut back on workforce buildup costs and reduce overall gap-relatedcosts—by something on the order of 50 percent from those accruing to an inac-tive yard (compare Figures 3.6 and 3.7 with Figures 3.3 and 3.4).15 It is also
______________14The workforce buildup model does not account for the difference in skill mix between theresidual workforce and that needed to start submarine construction. As explained above, the 260-person cadre can be designed to possess the appropriate skill mix. However, it is doubtful that theskills needed for the early phase of submarine construction would be found in other workersavailable for restart who are coming off submarine construction lines in the completion phase.Costs for restart in the first few years displayed in Figures 3.3 through 3.9 are thus likely to be higherthan the costs shown.15This analysis does not account for the difference between skills and management structuresrequired for overhaul and those required for construction. Although there is substantial overlap(see Appendix C), some skills are construction-specific, so the 50 percent savings should be

Effects of a Production Gap on Shipyards 41
enough to eliminate gap-related delivery delays (beyond the length of the gapitself). But it is worth noting that we do not account for the inefficiencies ofsuddenly directing overhaul work to the private yards and just as suddenly redi-recting it elsewhere once submarine production restarts.
A major alternative source of work would have an even greater effect. For ex-ample, construction of an aircraft carrier at Newport News (see Figure 3.5)could reduce gap-related costs for some restart years by over 75 percent (andthis assumes only one carrier built and no overhauls). As with overhaul, manyfacilities would remain open and there would be no need to sustain a cadreduring the gap. Most important, a great many workers would be available fromthe carrier line, which winds down over many years, to restart submarine pro-duction or transfer into it after restart and thus reduce the dominating work-force buildup costs. In particular, it is the transfers that are mainly responsiblefor the advantage of the carrier relative to overhaul work, as the initial work-forces we assume for both cases are the same for most restart years.
The smaller ongoing source of work represented by the SSN-23 at EB is also (foras long as it lasts) a big improvement over an inactive yard. But it represents areal improvement relative to overhaul only for restarts in FY99 and FY00, whensubstantial numbers of workers are being released from the SSN-23 line butthere are still enough left to provide numerous transfers over the next two orthree years.
Increasing the target rate of submarine production increases costs and delays(compare Figures 3.3 and 3.9). A higher production rate does not affect any ofthe costs involved in shutting down production, maintaining facilities andworkers, or reinitiating work. However, a greater number of workers is neces-sary to build more submarines per year in steady state, and it takes a longertime to rebuild the workforce to that level, so all the costs involved in that effortare increased.
To the costs and delays discussed in this chapter and in Appendix C must beadded further gap-related costs and delays—not to mention risks—from havingto reconstitute the vendor base supplying the shipyards. It is to these costs,delays, and risks that we now turn.
________________________________________________________________________regarded as optimistic. In particular, the initial overhaul would probably take longer and cost morethan those performed at the shipyards now carrying them out.


43
Chapter Four
EFFECTS OF A PRODUCTION GAP ONNUCLEAR-COMPONENT VENDORS
The U.S. Navy has placed enough orders to sustain the naval nuclear propulsionindustrial base through FY95. The industry’s continued operation dependscritically on carrier construction and the next-generation submarine reactor forthe NSSN. (The most critical supplier—the supplier of reactor cores—can alsorely on carrier and Trident refuelings.) In this chapter, we examine the time,cost, and risk associated with deferring further submarine production longenough that some or all nuclear vendors shut down. The magnitude of the ef-fects raises the question of whether the government should accept the risks andincur the cost involved in letting these firms go out of business and having torestart production at some future date.
This analysis draws on our discussions with and data provided by industry,Naval Nuclear Propulsion Directorate, Naval Sea Systems Command, and OSDofficials. Some data come from nuclear-contractor responses to a comprehen-sive industrial-base questionnaire prepared by the Office of the AssistantSecretary of Defense (Production and Logistics) and administered by the Navy.We begin with an overview of the naval nuclear industrial base.
NAVAL NUCLEAR-PROPULSION INDUSTRIAL BASE
Research, development, and manufacture in support of the nuclear Navy arecarried out by major corporations under contract to the government, subcon-tractors that supply hardware support and technical expertise to the prime con-tractors, and government laboratories. In this chapter, we focus on the pro-duction processes of suppliers who manufacture critical nuclear components:
• reactor cores
• heavy reactor plant components (reactor vessels, steam generators, pressur-izers)
• control rod drive mechanisms

44 The U.S. Submarine Production Base
• pumps, pipes, and fittings
• instrumentation and control equipment
• valves and auxiliary equipment.
Table 4.1 lists the manufacturers of these components.
The prospects of the naval nuclear industrial base are less than robust. As dis-cussed in Chapter Two, the nuclear industry suffered a reversal of fortunes inthe 1970s and 1980s, as is starkly illustrated by the record of civilian reactor or-ders over the last several decades (Figure 4.1) and the dwindling number ofcritical-component suppliers to the Navy (Table 4.2). With no domestic civilianorders and declining orders from the Navy, the nuclear field is no longer com-
Table 4.1
Key Nuclear Suppliers
Nuclear Component Supplier Location
Nuclear cores Babcock & Wilcox Co., Naval Nuclear FuelDivision Lynchburg, VA
Heavy components Babcock & Wilcox Barberton, OHTubing B&W-Specialty Metals Koppel, PALarge forgings Beth Forge Bethlehem, PA
Control rod drivemechanisms
Marine Mechanical Corporation Cleveland, OH
Pumps Westinghouse Electro-Mechanical Division Cheswick, PABW/IP International,Byron Jackson Pump Division Long Beach, CA
Pipe and fittings Tube Turns, Inc. Louisville, KY
Instrumentation and SPD Technologies Philadelphia, PAcontrol equipment Eaton Pressure Sensors Division Bethel, CT
Loral Control Systems Archibald, PAGE Reuter-Stokes Twinsburg, OHPeerless Instrument Corporation Elmhurst, NYImaging & Sensing Technology Corp. Elmira, NYWestinghouse I&C Systems Baltimore, MDEaton Cutler-Hammer Milwaukee, WI
Valves and Target Rock Corp. East Farmingdale, NYauxiliary equipment Hamill Manufacturing Trafford, PA
SOURCE: Admiral Bruce DeMars, Supplement to the 3 March Report on Preservation of the U.S.Nuclear Submarine Capability, Naval Nuclear Propulsion Directorate, U.S. Department of Defense,Washington, D.C., November 10, 1992.

Effects of a Production Gap on Nuclear-Component Vendors 45
RANDMR456-4.1
1952
Year
Num
ber
of r
eact
ors
40
20
10
0
–10
–2054 92
Naval reactors authorized
Net civilian reactors ordered
56 58 60 62 64 66 68 70 72 74 76 78 80 82 84 86 88 90
30
Negative numbers indicate more cancellations than new orders.
Figure 4.1—Naval Reactors Authorized and Net Civilian Reactors Ordered by Year
mercially appealing.1 The large capital investment needed and the low prob-ability of achieving a steady return on investment will probably discourage newfirms from entering this field. Meanwhile, uncertainty about the timing of fu-ture nuclear component orders and anticipated low production rates haveraised concerns that the few remaining producers of key naval componentsmay close down or, because of uneconomical order rates, cease making thesecomponents.
It is essential for the Navy’s nuclear ship programs that the remaining nuclearindustrial capability survive. Nuclear system manufacture requires high stan-dards for component manufacturing and quality assurance, specialized facili-ties for fabrication and testing, and a highly qualified and skilled workforce.Naval nuclear manufacture is even more specialized. Naval nuclear reactorsare small, use highly enriched fuel, must operate for decades without replace-ment or major maintenance, experience frequent power variations, are re-quired to meet quietness and shock criteria, and are designed to operate inclose proximity to humans. The means of meeting this kind of demand cannot
______________1For a discussion of the commercial industry during its early years see R. L. Perry, A. J. Alexander, W.Allen, P. DeLeon, A. Gandara, W. E. Mooz, and E. S. Rolph, Development and Commercialization ofthe Light Water Reactor, 1946–1976, RAND, R-2180-NSF, June 1977.

46 The U.S. Submarine Production Base
Table 4.2
History of Nuclear Component Suppliers
Component Supplier
Component 1960s 1970s 1980s 1990s
Reactor cores B&WUNCCEM&CWest.
B&WUNC
B&WUNC
B&W
Heavy equipment B&WA-C***AOSFWCEWest.Alco
B&WA-C***C-WCEAeroSW
B&WPCC***a
CESW
B&W
Control rod drive mechanisms TRW*
VARD**M-S
TRW*
R/LSI**TRW*BFM**
MMC*
Main coolant pumps West.GE
West. West. West.
NOTE: *, **, ***-successor company in same facility.aPCC and B&W consolidated with the eventual outcome of downsizing and PCCexiting from the heavy equipment business.Key: A-C Allis Chalmers GE General Electric
Aero Aerojet MMC Marine Mechanical Corp.AOS A.O. Smith M-S Marvel-SchelberB&W Babcock and Wilcox PCC Precision Components Corp.CE Combustion Engineering R/LSI Royal/LSIC-W Curtiss-Wright SW Struthers WellsFW Foster Wheeler UNC United Nuclear Corp.
West. Westinghouse
be replaced quickly or cheaply, if they can be replaced at all. In the remainderof this chapter, we attempt to convey some sense of the time, cost, and risk in-volved.
LEAD TIMES WITH AN ACTIVE INDUSTRIAL BASE
Before we discuss the effects of shutting down and then reconstituting the ven-dor base upon times to produce nuclear components, we offer some perspec-tive by characterizing the lead times now prevailing. As we show, fabrication ofnuclear components must begin years in advance of hull construction, evenwith all production processes up and running—and the lead times have beengrowing. The advent of modular construction techniques has contributed to

Effects of a Production Gap on Nuclear-Component Vendors 47
this trend. At one time, components were not needed until the hull was fin-ished. Now they are needed to outfit the hull cylinders before these sections arewelded together.
Although modular construction techniques are now used on all three currentsubmarine classes, the Seawolf is the first designed for extensive modular con-struction from the outset. As shown in Figure 4.2, most key nuclear compo-nents are required sooner after the shipyard contract award for the first Seawolfthan for either the latest Ohio- or Los Angeles–class ships. The NSSN, of course,will also be designed for modular construction.
The intervals between contract award and need date are shorter than the time ittakes to manufacture the components. For the SSN-21, fabrication of somecomponents had to start five or six years in advance of the shipyard’s work (seeFigure 4.3), or twelve years in advance of submarine delivery.2 Lead times forthe NSSN will be comparable. Plans are to order the reactor core in 1996 for aship that will not be delivered until perhaps 2005. Thus, any delays caused byvendor base reconstitution must be added to these already lengthy lead times.
������
Years
Steamgenerator
Nuclear core
Main coolantpump
Reactorvessel
Lead instrument and control
cabinet
0 1 2 3 64 5
RANDMR456-4.2
Pressurizer
Control rod mechanism
SSN-21
SSBN-743
SSN-773����
��������������������
��������������
��������������
��������
��������������
Figure 4.2—Interval from Contract Award to the Time Component Is Needed
______________2Because the times shown are for first-of-class ships, they include development and test activities.Times for follow-on ships should be shorter.

48 The U.S. Submarine Production Base
Years prior to submarine delivery
Steamgenerator
Core
Main coolantpump
Reactorvessel
Start
Nuclear component design- and-manufacturing span
Submarine construction span
SSN
214 12 10 8 06 4
NOTE: The times assume an active industrial base; required lead times could be longer following an extended production gap.
Delivery
RANDMR456-4.3
Figure 4.3—SSN-21 Shipyard Need Dates and Design-and-Manufacturing Spans forSelected Nuclear Components
SHUTTING DOWN AND RECONSTITUTING THE REACTOR COREVENDOR
We begin our analysis of gap-related costs and delays with the supplier of thereactor core, the costliest and most technically challenging of the nuclear com-ponents. We will then examine shutdown and reconstitution effects on the re-mainder of the naval nuclear industrial base in less detail.
Current plans call for one or two reactor core orders a year from FY95 throughFY99. Work on the shipboard version of the NSSN reactor will be preceded inFY95 by start of construction on a prototype. Carrier cores will be started everyother year for future refueling requirements, and a Trident refueling reactor willbe ordered in FY98.
The core vendor estimates that an annual demand of one reactor core and ahalf a million worker-hours are required to maintain its financial viability.Planned orders from the Navy are sufficient to meet that goal, but, as produc-

Effects of a Production Gap on Nuclear-Component Vendors 49
tion rates are already low and facilities underutilized, the vendor may not re-main an economically solvent commercial firm if some of the planned ordersdo not materialize on schedule. As we show in the following examples, thecosts, delays, and risks of losing the core vendor are so great that the only prac-tical alternative to the planned stream of orders is a government subsidy tosustain the vendor’s capability.
The following subsections explore two scenarios for shutting down and recon-stituting the reactor core production capability. The first scenario examinesshutdown of the industry for one year, the second envisions a longer-termshutdown.
The reconstitution process breaks down into five major elements:
• shutting down facilities
• reestablishing the workforce
• reestablishing the facilities
• reestablishing the production process
• constructing and testing prototypes.
For the one-year shutdown, we discuss the first, second, and fourth items; thethird should not present a challenge, and prototypes would not be necessary.For the five-year hiatus, all elements come into play.
One-Year Shutdown
We begin our assessment of the one-year shutdown with the effects on timing.Of the three elements relevant to some aspect of the one-year case, only facilityshutdown does not affect the timing of reconstitution. In the early years, re-constitution is driven by the need to rebuild the workforce, conduct training,obtain clearances, requalify the production process,3 and gain preproductionexperience. These functions would require about one and one-half years beforeproduction begins and continue for about six months during early phases of theproduction process. The core production process currently requires six toseven years. A one-year shutdown would stretch that manufacturing time bytwo to three years.4
______________3The Nuclear Regulatory Commission and the Director of Naval Nuclear Propulsion must certifythe safety and quality of new production processes for nuclear components. Processes may have torequalify after shutdowns of six months or more.4This neglects the possibility that the vendor may have to go through a major requalification pro-gram (even if the gap in production is as short as six months).

50 The U.S. Submarine Production Base
These increased time spans result from reestablishing the production processand reducing uncertainties stemming from the risks of “forgetting” associatedwith stopping production. While production is in process, manufacturingsteps, fabrication methods, and quality assurance procedures are being exer-cised and yield a known product outcome. In the absence of an ongoing pro-duction process, each step will not only take longer to accomplish but also re-quire more frequent checking and component testing (some of it destructive).The checking and testing are necessary to ensure safety and final product qual-ity before proceeding to the next step. This kind of protocol is essential be-cause, in contrast to other high-technology components, a nuclear reactor mustwork the first time it is used.
Thus, reestablishing the workforce and the production process after a one-yearhiatus would together result in an increase of three and one-half to five years incore delivery. This means that steps to reconstitute the core vendor capabilitywould have to begin roughly 10 to 12 years before the core is needed in theshipyard.
A one-year gap would also increase the costs of producing the next core byabout $40 million. About half that cost would be for partially decontaminatingand decommissioning the facilities, and almost a quarter is for the greater over-head burdens that initial units of production would bear at restart.
Five-Year Shutdown
For relatively long periods of shutdown, costs are difficult or impossible to es-timate. Nevertheless, estimates that are available far exceed those for a shortshutdown. The total cost to reconstitute would appear to be on the order of abillion dollars, plus an unknown amount for constructing and testing proto-types and first production articles.
For a shutdown period on the order of five years, reconstitution times are evenmore uncertain. In addition to the usual concerns in restarting any industry—availability of facilities and the ability to hire, train, and retain a work force—theeffects of the economic environment, environmental concerns and attitudes,and future licensing requirements are unpredictable. However, assuming allresources are available and today’s regulatory environment prevails, as many as18 years would be required to prepare facilities, develop the subvendors, hire anentire new workforce, train employees, restart production, and produce the firstcore. Even then, that first core would not be suitable for installation in an op-erational submarine but would probably undergo rigorous testing as a proto-

Effects of a Production Gap on Nuclear-Component Vendors 51
type at a land-based site.5 This estimate involves a good deal of guesswork, asthere is no experience on which to base it. It is also success oriented in that itassumes no major problems develop that require going back to the subcompo-nent level.
Thus, gaps in nuclear core production for one to five years can double or eventriple the time it takes from award of the vendor contract to delivery of the op-erational reactor. When taken together with the extra costs involved, it is clearthat the core production capability should not be allowed to lapse.
SHUTTING DOWN AND RECONSTITUTING THE REST OF THENUCLEAR VENDOR BASE
Prospects for the nuclear core vendor look fairly promising compared to thosefor the rest of the nuclear vendor base, which does not get as large a percentageof its business from refueling. The work backlog for these firms runs out in1996, and the NSSN represents the only other foreseeable demand for theirservices. Deferring reactor component orders beyond the late 1990s will prob-ably mean that critical-component suppliers will exit the business.
We estimate that the capability represented by those firms could be reconsti-tuted more quickly than could that for the reactor core, although reconstitutioncosts are likely to be substantial. Those for heavy components—reactor vessels,steam generators, and pressurizers—could top $550 million (see Figure 4.46).Fortunately, the backlog situation for these suppliers is the most favorable; de-sign work on heavy components for the NSSN has already started. The costs forthe other component suppliers combined come to about $170 million.7
RISKS ASSOCIATED WITH GAPS IN NUCLEAR COMPONENTPRODUCTION
Two kinds of risks are not covered in our analysis of cost and schedule effects.One is the risk that our cost and schedule estimates are underestimated—the
______________5At present, the Director of Naval Nuclear Propulsion has not proposed prototyping after a pro-duction hiatus, should one occur. Such a prototype would either have to replace an existing onenow in operation, or a new site would have to be established. That choice would have to be basedon difficult tradeoffs involving cost, schedule, technical, and regulatory issues.6The data in this figure are our estimates based principally on an unpublished industry survey takenby the Office of the Assistant Secretary of Defense (Production and Logistics) and adjusted in thelight of additional information.7Neither our cost nor our schedule estimates include cost increases and delays in integrating nu-clear propulsion plant components and testing their function as a system or in reestablishing coor-dination among the government, component suppliers, and the shipyards. This coordination,though never perfect, has been the result of many years of working together.

52 The U.S. Submarine Production Base
������������
������
������
��������������������������
���������
������
������
���������������������
RANDMR456-4.4
Year 4
Years prior to production start
$ m
illio
ns800
400
300
200
100
0
Valves and auxiliary equipment
Instrumentation and control
Pumps, pipe and fittings
Control rod mechanisms
Heavy equipment
����
Year 3 Year 2
700
600
500 ��
Year 1 Total
Figure 4.4—Cost of Reconstituting Nuclear Industrial Base by YearPrior to Restart
possibility that the true costs and delays could be so great as to render infeasi-ble the production of quality nuclear components for a near-future submarineprogram. The second is the risk that, in attempting to meet cost and scheduleconstraints, quality will be compromised and an accident will result.
Estimation Risk
Estimating the cost and schedule of reconstituting the nuclear industrial base isa difficult and uncertain task, particularly with respect to core production.Investment programs or projects typically begin with the kind of initial or con-ceptual estimates presented here—rough approximations based upon simplecalculations and minimal engineering.8 Unlike subsequent estimates, initialestimates reflect the use of simple ratios and factors to estimate basic portionsof the reconstituted facility. These estimates are optimistic and, as mentioned
______________8Initial estimates are followed by preliminary estimates based upon completed development workand some engineering and submitted to management for a decision whether to continue the pro-ject into plant design. Then come budget estimates made when plant design is well under way andengineering is 30 to 70 percent complete, and definitive estimates made when construction is readyto begin or is under way.

Effects of a Production Gap on Nuclear-Component Vendors 53
above, success oriented. Usually no attempt is made to estimate the effects ofdifferent sites, changing regulatory environments, advances or uncertainty intechnology or in the economic environment, and possible changes in scope. Inthe present case, the relicensing problem alone could add years of public hear-ings and debates and, at worst, make reconstitution impossible.
Initial estimates have proven to be poor predictors of cost and performance. Thisis true of various technologically advanced facilities, whether they require ad-vances in the state of the art or not. In past RAND research,9 data were col-lected on the accuracy of cost estimates for three nuclear process plants—theBarnwell Nuclear Reprocessing plant, the GE Reprocessing facility, and theNaval Fuels Materials Facility. Barnwell and the GE facility were first-of-a-kindfacilities, while the Naval Fuels project was a facility that was to duplicate tech-nology at an aging facility operated by a private firm for the Navy. Figure 4.5reports initial estimates, preliminary estimates following development work,the actual cost to construct the projects as designed, and the total cost to try tomake the projects work to specifications and satisfy regulations until further
RANDMR456-4.5
Mul
tiple
of i
nitia
l est
imat
e
7
6
5
4
3
2
1
0Initial
estimatePreliminary
estimateActual cost Total prior to
walkaway
����������������
������������������������������������
����������������
��������������������������
����
Barnwell Reprocessing
GE Reprocessing
Naval Fuels
Figure 4.5—Cost Growth for Select Nuclear Facilities (constant dollars)
______________9Edward W. Merrow, Stephen W. Chapel, and J. C. Worthing, A Review of Cost Estimation in NewTechnologies: Implications for Energy Process Plants, R-2481-DOE, RAND, July 1979.

54 The U.S. Submarine Production Base
activity was canceled. As is evident from the figure, average increases in cost atsucceeding project phases were substantial. The increases shown may also beconservative, for the same reason that it is not possible to report schedule slip-page for these facilities: none of them ever operated successfully.10
For anyone who might imagine that updating a production process technologythat has experienced a developmental hiatus is relatively simple, these facilities,especially the Naval Fuels facility, provide some insightful lessons:
• Technologies that are subject to changing regulatory environments must bereinvented after any significant amount of time. The Naval Fuels facilitywas a pioneer manufacturing facility in the truest sense even though it wasintended only as a duplicate of an operating facility.
• Design expertise that created and maintained the old technology may notbe of much value to the reinvention of the “new” technology.
Thus, it would seem that the initial cost estimates we report here could be mul-tiplied by a factor ranging from two to at least seven (see Figure 4.5), if experi-ence with these sorts of estimates is to be taken into account. However, al-lowance must be made for the differing incentives behind the various estimatesin this chapter. Estimators (including, perhaps, those represented in Figure 4.5)are generally invested to some degree in the continuation of the project they areestimating. They usually do not have strong incentives to account for all possi-ble sources of cost increase and delay in continuing the project. But where theissue is the potential discontinuation of the program, the incentives are re-versed. Although we have no reason to doubt the accuracy of the data providedby nuclear vendors, we consider it prudent, particularly in light of the conclu-sion the data supports, to be conservative in choosing an “underestimation fac-tor.” We also note that the duplication of the Naval Fuels Materials Facility isthe closest of the three projects in Figure 4.5 to the processes and facilities likelyto be undertaken in reconstituting the naval nuclear production base. Thegrowth in estimates for that facility are at the low end of the range.
We thus accept most of the gap costs as stated and apply (in the summary tothis chapter, below) a factor of two to the more uncertain longer-shutdowncosts associated with the reactor core. We treat the delay estimates, particularlythose for the five-year shutdown, as conservative, without attempting to quan-tify the possible degree of error involved.
______________10While the Naval Fuels facility did begin limited production, the high cost of the new facility anddeclining demand made continued operation impracticable.
Effects of a Production Gap on Nuclear-Component Vendors 55
Accident Risk
The U.S. Naval Nuclear Propulsion Program strives to reduce risk to minimumpracticable levels. This philosophy was imbued in the program by AdmiralRickover from its inception in 1948 until 1982.11 Rickover dominated the de-velopment of the program and was personally responsible for its content andeffectiveness. He had an uncompromising attitude toward safety, rejectedhighly developmental and untried systems and concepts, and instilled a strongsafety culture in the Navy’s reactor program. Accidents were—and are—un-thinkable. His approach to design was conservative and required strict controlover manufacture of all equipment, including extensive inspections by speciallytrained personnel during the course of manufacture and of the finished equip-ment. Safety during the handling of nuclear material was and is absolutelyparamount. As a result, there has not been a single nuclear accident in the his-tory of the nuclear navy.
While we cannot quantify risk, we have drawn on available literature to set up aframework that allows some qualitative inferences about the future. This litera-ture suggests a set of eight parameters experience has shown are significant in-dicators of decreased accident likelihood:12
1. Absence of new or unusual materials
2. Absence of new or unusual methods of construction
3. Absence of new or unusual types of structure
4. Experience and organization of the design and construction team
5. Sufficiency and relevance of research and development background
6. Favorable industrial climate
7. Favorable financial climate
8. Favorable political climate.
With respect to the first three criteria, the current overall approach has beenconservative, averse to unproved technologies, systems, and materials. The
______________11Upon Rickover’s retirement, Executive Order No. 12344 established the position of Director,Naval Nuclear Propulsion, at the four-star Admiral level. It vested in that position direct personalauthority for all aspects of the nuclear propulsion program—operations, safety standards and pro-cedures, research, etc. That authority is entrenched by the security of an eight-year term in thepost. The order recognized the prerequisites for maintaining a rigorous safety culture by institu-tionalizing for Rickover’s successors his power to dictate the shape of the program free of interfer-ence from other branches of the Navy and government.12Alfred Pugsley, “The Prediction of Proneness to Structural Accidents,” The Structural Engineer,Vol. 51, No. 6, June 1973.
56 The U.S. Submarine Production Base
quality of reactor and equipment design and manufacture are confirmedthrough extensive analyses and full-scale mockups and tests using land-basedprototypes. The approach has been deliberately evolutionary.13
With regard to criterion 4, the current design and construction teams haveconsiderable experience. Scores of naval nuclear reactors have been safely builtand operated over a period of decades. As for 5, land-based prototypes of de-sign similar to that of shipboard plants are built first and operated continu-ously, so that any design-related problems should be noticed at a land-basedsite before they occur at sea. During the past decades, the submarine commu-nity has enjoyed high levels of business, financial, and political support.
It would appear that criteria 1, 2, 3, and 5 will continue to be met in the foresee-able future. Criterion 4 would, of course, not be met if production is sus-pended. The design, development, and construction of nuclear submarinecomponents is not a theoretical skill learned in textbooks. Rather, these skillscome about through experimenting with methods and ideas, testing them, andlearning through trial and error. Newly formed teams lack these experiencesand must learn by making a few mistakes of their own. Obviously, if not caught,mistakes heighten the potential for accident.
While the latter is the most important potential shortfall, the submarine indus-trial base may not see the kind of business, financial, and political support aftera production shutdown that it once drew upon to start a high-quality program.Thus, according to our qualitative framework, at least four of the eight elementsare likely to foster risk, a situation counter to the philosophy that has under-pinned a highly successful endeavor. Unless a costly, time-consuming effort toreduce risk is undertaken, the potential for accident can be expected to increase.
SUMMARY AND CONCLUSIONS
Shutting down and reconstituting the naval nuclear industrial base will result inincreased costs, longer contract-to-delivery schedules, and an elevated risk ofdeficiencies in product quality and thus of accident. Attempts to quantify theseeffects are fraught with the potential for error. With that caveat in mind, we of-fer the following conclusions:
• Deferring orders for the NSSN or additional submarine reactor cores be-yond the late 1990s could result in inefficiencies at the core manufacturerthat would translate into higher overhead costs, which would be borne bythe government.
______________13Francis Duncan, Rickover and the Nuclear Navy: The Discipline of Technology, Naval InstitutePress, Annapolis, Md., 1990.
Effects of a Production Gap on Nuclear-Component Vendors 57
• Deferring production of the NSSN beyond the late 1990s will probably re-sult in the shutdown of the capability to produce other critical nuclearcomponents. Reconstituting this capability after an extended gap may notresult in long delays but could entail costs in the hundreds of millions ofdollars. Some critical-component vendors could exit the business withinthe next year or so; the government must begin taking action soon if largecosts are to be avoided.
• Because the increase in accident risk following a production gap is un-quantifiable, we cannot say whether it would be significant. However, itwill be greater if components are pushed through the production processon a budget and schedule much tighter than those projected above. Whilethe probability is uncertain, the consequences of a submarine-related nu-clear accident would clearly be severe. An accident could well entail loss oflife if it occurs at sea, greater loss of life and social and environmental dis-ruption if it occurs in port, and the suspension of the nuclear submarineprogram in either case.


59
Chapter Five
EFFECTS OF A PRODUCTION GAP ON NONNUCLEAR-COMPONENT VENDORS
A major element of the overall submarine industrial base is the set of vendorsthat supply nonnuclear components and material to the shipyards. There areroughly one thousand firms that provide components of some technical com-plexity or that are unique to submarines. The majority of those products repre-sent variants of products used elsewhere and do not require highly specializedindustrial processes. However, about 10 percent of the products are distinctiveto some degree, and some are highly specialized and provided by firms thathave no other product lines. If new submarine production were to be stoppedfor a prolonged period of time, many of those specialized product lines wouldbe abandoned and at least some of the firms would go out of business. The re-sulting loss of capability would have to be replaced before submarine produc-tion is restarted, resulting in extra costs and delays. In this chapter, we (1)quantify the number of products or firms that would be most affected by anyprolonged cessation of submarine production, and (2) define and provide apreliminary evaluation of two strategies that might be adopted to provide anadequate supply of such critical components when submarine production isrestarted.
WHY IS THIS AN IMPORTANT ISSUE?
Why does a submarine require components and material much different fromthat of any other naval vessel? The answer is found in several characteristics ofsubmarine operations:
• Pressure. Along with the hull itself, some of the components are exposed tothe water pressure created by deep submergence. The propeller drive shaft,periscope, and other items for which there are hull openings must remainsealed against sea water. The steam condenser in the propulsion systemand other parts that circulate sea water for cooling must operate at deep-submergence pressures.

60 The U.S. Submarine Production Base
• Noise-limiting. Pumps, motors, gears, and other mechanical devices mustbe specially designed to minimize the noise they produce.
• Internal environment. A submarine must create and maintain an underwa-ter life-support environment that provides comfortable and healthy condi-tions for the crew and for sensitive equipment.
• Reliability. Because of the long operating tours and the catastrophic conse-quences that can result from equipment failure, high standards of reliabilityare demanded from many components.
While almost every component of a submarine has some counterpart in surfaceships, the combination of the above special subsurface operation conditionsrequires unique design and performance specifications for some items. Simplybecause a generic class of components, such as hydraulic pumps, is widelyavailable does not guarantee continuing availability of similar componentssuitable for use in combat submarines.
In addition to the special requirements that many of the components mustmeet, three other characteristics of the nonnuclear supplier base contribute tothe difficulty of ensuring supply after a production gap. In many cases, theproduct was developed by the firm using at least some of its own resources, andthus the firm retains proprietary rights to the product. Furthermore, many ofthose designs have been refined over the course of several generations of appli-cations, some dating back to the earliest nuclear submarines. Experience withthose earlier designs, together with increasingly stringent performance specs,has in at least some cases led to a product that appears to be relatively simplebut in fact requires highly specialized and subtle manufacturing equipment andprocesses. Finally, because of the dwindling demand for submarine-specificproducts, in many cases there is now a single qualified supplier for a compo-nent, making it more unlikely that at least one source will outlast a gap.
SCOPE OF THE PROBLEM
The first objective of our nonnuclear-vendor analysis was to identify andquantify the components and suppliers that potentially would become unavail-able in the event of a prolonged period of no new orders for construction. Weturned to three data sources:
• A survey and analysis of the submarine industry conducted by the Navy,initially in early 1992 and then updated in November 1992.1 Among other
______________1Preservation of the Industrial Base for Nuclear-Powered Submarine Systems: Fall Update, Office ofthe Assistant Secretary of the Navy for Research, Development, and Acquisition, November 1992.

Effects of a Production Gap on Nonnuclear-Component Vendors 61
topics, that report contained results of a survey of 233 vendors conductedby the Naval Sea Systems Command’s Shipbuilding Support Office(NAVSHIPSO).
• Lists of suppliers provided by the shipyards, and ranked in terms of critical-ity (by the shipyards’ own criteria).
• Visits to a few of the supplier firms by members of the RAND research team.
RAND drew on data contained in the NAVSHIPSO survey to develop a screeningprocess and to make a first-order determination of critical vendors.NAVSHIPSO identified 114 of the firms returning surveys as posing a potentialproblem of continuing product availability after a production gap. We re-stricted our analysis to those firms. Because of the limited scope of the sourcedata, our analysis is not exhaustive, but we believe it to be complete enough tosupport a useful set of conclusions and recommendations.
Because the survey sample contained information on a wide variety of productsand firms, our next step was to screen the members of the list in a way thatwould sort out the most critical ones. We defined a two-step screening process:
1. Will the firm’s product still be available in the absence of new submarineproduction for a period of several years? If so, the product is not critical; ifnot available, then . . .
2. Will the product have been technologically superseded after a productiongap of several years? If so, the product is not critical; if not so, it is.
Application of these criteria screened out most firms. In some cases the firm’sproduct, while special to submarines, used standard production processes andconstituted at most a special production set-up. An example is the special steelused in the hull. That steel requires a special mill run, but is produced onequipment used to produce many other grades of steel for a wide variety ofcustomers. Products such as these were screened out in the first step. That is,we would anticipate that at submarine production restart, they could be avail-able with little delay or extra cost.
Alternatively, a product might be evolving so rapidly that a new design is pro-duced every few years, thus outmoding the existing design. We believe that allof the electronic mission equipment such as sonar and communications gearfalls into this category. Both the hardware and software elements of suchequipment are evolving rapidly so that any future submarine would probablyuse designs substantially different from those used in today’s submarines.Furthermore, the industry that supplies electronic mission equipment is broad-based and relatively robust, with many related products being produced forsurface ships, the aerospace industry, and other military applications. While we

62 The U.S. Submarine Production Base
cannot assert that future submarine components of this class will be “easy” todevelop and produce, we see little basis for concern that vital elements of theindustry capability will atrophy in the short-term absence of new submarineorders.
After application of both screening tests, 11 products were judged critical.These were components that might still be technologically current but forwhich the production line would close and the supplier might go out of busi-ness over a prolonged gap in new orders unless some mitigating action wastaken.
The next step was to compare our list with similar lists provided by each of thetwo shipyards. Expecting a high degree of correlation, we found instead littleagreement among the three lists. Out of the 53 products identified in the vari-ous lists, only three appeared on all three lists, and only a total of 12 appearedon at least two of the lists (see Table 5.1).2
The lack of agreement on identifying critical products results partly because ofdifferences in the rules used by the three organizations in the analysis.However, this preliminary exercise was sufficient to justify two important con-clusions regarding the submarine vendor base:
• The vast majority of vendors are expected to remain as viable supplierseven across several years of no new submarine starts. The number of prod-ucts and suppliers that require some significant government action to en-sure continuing product availability is, at most, a few dozen. This conclu-sion becomes less certain as the next submarine start is delayed into thelate 1990s, and would be expected to change substantially if the next start isdelayed until 2000 or later.
• A few production lines will probably be shut down before 1995 because theysupply items needed early in submarine construction and the order gap isalready reaching critical proportions for those firms. Action must be takenimmediately if these industrial capabilities are not to be lost.
POSSIBLE ACTIONS TO ENSURE FUTURE PRODUCT AVAILABILITY
For cases in which production lines may be shut down, the Navy is faced withtwo broad choices—preserve the present firms and lines or allow those lines toclose and reconstitute a source of supply in the future. Each of those options isbriefly explored below.
______________2In addition to differences among the three “short lists,” three of the firms in Table 5.1 did not ap-pear on NAVSHIPSO’s “long list” of 114.

Effects of a Production Gap on Nonnuclear-Component Vendors 63
Table 5.1
Nonnuclear Suppliers and Components JudgedCritical by at Least Two Sources
Firms rated critical by all three evaluators
Cepeda Associates (air scrubbers)IMO-DeLeval (steam condensers)EG&G Sealol (main drive shaft seals)
Firms rated critical by two evaluators
Allied Signal/Garrett (hydraulic pumps)CBI Services (sonar spheres)Fairbanks Morse (diesel generator sets)Hitco (sonar domes)Martin Marietta (towed-array capstans)SPD Technology (switchgears, circuit breakers)Vacco Industries (air reduction valves)Waukesha Bearings (main drive thrust bearings)York International (air conditioners)
Preserving Existing Production Lines
Several vendors discussed with us how their submarine-specific capabilitiesmight be preserved across a production gap of several years. From these dis-cussions we made a list of general options. Although no attempt was made towork out a specific strategy for a specific firm, it seems clear that enough differ-ent strategies exist so that any of the critical production lines could be sustainedfor a few years if that was deemed appropriate.
By examining these strategies we are not necessarily recommending that anyparticular product be “saved.” Such a decision should be reached only after de-veloping a strategy for that product, estimating the cost of applying the strategy,and comparing that cost with the expected cost and risk of establishing a newsupplier at some future time. Analysis at that level for each of the several dozenpotentially critical products was beyond the scope of this study.
We identified five general strategies that might be applied if a decision is madeto preserve a production line. All, of course, entail extra costs of some kind toDoD, and these costs need to be weighed against the benefits.
First, for those products that require overhaul or replacement during normaluse, there is some continuing demand for activities that could be met by theoriginal supplier. In some cases, that supplier is now doing the support work,thereby sustaining the firm’s critical staff, paying overhead on the facilities, andso forth. However, in many cases that work has been contracted to other firmsor is being done within the Navy’s own facilities. Shifting that work back to the

64 The U.S. Submarine Production Base
original supplier would not be cost free—someone else would lose the work—but it might well prove to be the least expensive solution.
Another option is to purchase, lease, or otherwise retain key facilities requiredto manufacture the critical product. The manufacture of the submarine-specific products often requires unique tooling and test facilities that cannot beused in a firm’s other products. By relieving the financial burden of preservingthose facilities through an idle period, it might be possible to ensure quickrestart in the future.
A third option is to purchase from the supplier of the critical component aquantity of related products used in surface ships that is sufficient to sustainthat supplier. Again, that means a loss of work elsewhere, presumably on thepart of a supplier that is charging lower costs or providing higher quality for thesurface ship component.
A fourth possibility might be to purchase additional quantities of the latest ver-sions of critical components and use them to upgrade older submarines duringoverhaul. Given the reduced threats of the post–cold war era, it seems unlikelythat this strategy would be chosen.
Finally, the gap could be used as an opportunity for the firm to enhance its pro-duction processes, improve quality and reliability, and reduce costs.
Reconstituting a Source of Supply in the Future
If submarine construction is not expected to be restarted for several years, it be-comes increasingly attractive to simply allow the present production lines to beclosed, in the expectation of “starting over” when the need arises. In somecases that might mean asking the original supplier to re-create the productionfacility and then requalify the process. In other cases it could mean going to asupplier of related products and persuading that firm to create the neededproduct design and associated production facilities. We attempted to deter-mine the costs and risks of starting over, to give some sense as to whether thismight be a better approach than preserving existing lines. As will be apparentfrom the discussion that follows, that attempt was beset by a variety of difficul-ties.
Cost of Reconstituting an Old Production Line. We used two data sources toestimate the cost of reconstituting the current supplier base. The first was a se-ries of estimates, made by the Los Angeles– and Ohio-class submarine vendors,of the cost of restarting their own production line after a production gap of un-specified length. That estimate was provided as part of the industrial base sur-vey conducted by NAVSHIPSO in the first half of 1992. The second data source

Effects of a Production Gap on Nonnuclear-Component Vendors 65
was the production cost per shipset for several dozen of the most critical com-ponents.
The vendor-estimated cost of restarting a production line was available for onlysome of the critical components. Furthermore, that cost, and the cost of thecomponents themselves, varied widely. To permit some comparison amongthe components, we determined the ratio of nonrecurring restart cost to recur-ring unit production cost for a dozen components where both values wereavailable. Most of the ratios fell between the values of 1.0 and 1.5. That is, thesuppliers estimated that the nonrecurring cost of restarting an inactive produc-tion line would typically be slightly more than the unit production cost of oneshipset. Recognizing that these restart cost estimates had been provided by thesuppliers themselves, without any critical review, we chose to use the(optimistic?) value of 1.0.
We also determined the total unit production cost of one shipset for 20 of themost frequently mentioned products in the various listings of critical items.That value is about $100 million. Multiplying that by the ratio determinedabove should give the cost to reconstitute all 20 production lines.
The number needing reconstitution will depend on the length of the gap. Somefirms will complete their current production runs in the next year or so, whileothers have active production of closely related products (e.g., propulsion re-duction gears for surface ships) scheduled for several more years. We estimatedthat if production was restarted in 1995 or 1996, only about one half (by shipsetvalue) of the producers would have to reconstitute their production line. Incontrast, if submarine production was delayed until the late 1990s, all of thecritical suppliers would incur reconstitution costs.
Thus, we estimated that for a near-term restart of submarine construction, thecost of restarting production for the critical vendors might be on the order of$50 million, while further delay could double that cost. In all cases these esti-mates refer to restarting existing vendors’ production lines, and assumes that inmost cases critical production facilities and test equipment have been retainedduring the production gap.
The estimation process outlined above is obviously rough and subject to con-siderable uncertainty. We have deliberately shaded the estimates toward thelow side. As discussed in Chapter Four, early, rough cost estimates have a ten-dency to grow. Taking that into account, we believe that the actual costs of re-constituting production of critical vendors could easily be twice the stated val-ues of $50 million to $100 million even if submarine production is restartedbefore the end of this decade.
66 The U.S. Submarine Production Base
Cost of Developing a New Supplier. We discovered wide variation in estimatesof how difficult it would be to qualify a new supplier for many of the criticalparts3—ranging from strong pessimism to strong optimism about the practi-cality of doing so. The variation stems from a lack of generally available data.As mentioned above, critical products have usually been designed and devel-oped by the producing firms, who then hold proprietary rights in the processand are reluctant to release information. Thus, how much the current produc-ers spent in developing their products is unknown. This is complicated by theevolution of those products to increased performance levels over the interven-ing decades.
Limited research suggests that the nonrecurring development cost of complexmilitary hardware is typically several tens of times the unit production cost.Even a multiple of ten, lower than anything in the available database, wouldsuggest that qualifying new suppliers for the 20 critical components notedabove would cost at least one billion dollars. Using the past as a guide, wewould expect that the suppliers would be willing to provide some of that in-vestment. However, it also seems plausible that, given the turbulence of suchmarkets during the 1990s, few suppliers would be willing to invest the fullamount needed. Thus we face two uncertainties—the actual cost of qualifyingnew suppliers, and the fraction of that cost that would be borne by the govern-ment.
Let’s assume that, on average, the government would have to provide half thecost of creating a new supplier base. In accordance with the second sentence ofthe preceding paragraph, let’s further assume that the total cost would be onlyten times the unit production cost. These assumptions yield an estimate of halfa billion dollars. We believe that is the minimum that would be required asgovernment investment, while the actual cost could easily be several times thatamount.
Conclusion. In addition to the estimating difficulties already discussed, the ac-curacy of our estimates must be discounted to some degree because we werenot able to take into account a variety of factors, such as
• uncertainty in the design specifications of the next submarine
______________3We assume that a new supplier would have to start from scratch. It is widely believed that it wouldbe impractical for the government to simply buy the rights to design-related information from anexiting producer and provide it to a new one at restart. Manufacturing and testing practices andprocedures vary so much from one firm to another that it is generally easier to redesign a productthan to adapt existing production processes.

Effects of a Production Gap on Nonnuclear-Component Vendors 67
• the degree that industry is supported over the intervening years by the con-struction of surface ships, including aircraft carriers4
• the future acceptability of overseas suppliers
• the status of the overall economy and the quality of the industry infrastruc-ture when restart occurs.
Because of the various problems in estimating reconstitution costs, any costprojection would be uncertain and subject to the risk of substantial underesti-mate. As a result, we conclude that DoD should approach such a process withcaution. We believe that both the cost and the risks of starting over will almostcertainly be larger than the costs and risks of sustaining the present suppliersfor a few years.
COMBINING SHUTDOWN, MAINTENANCE, AND RESTART COSTS
We combined the costs estimated in Chapters Three through Five for variousproduction restart strategies. An example is shown in Figure 5.1. These costswere then added to the costs of sustaining the fleet, discussed in the next twochapters.
RANDMR456-5.1
FY01
Restart year
Bill
ions
of F
Y92
dol
lars
3.0
2.5
1.5
1.0
0.5
0 ������������������������
Electric Boat, max. production rate = 2/yr,min. fleet size = 40 ships, no SSN-23
2.0
Vendor restart
Shipyard restart
Cumulative maintenance
Shutdown����
Figure 5.1—Illustrative Shutdown, Maintenance, and Restart Costs
______________4Independent of any attempt to sustain current suppliers by redirecting work.


69
Chapter Six
ALTERNATIVE FLEET REPLACEMENT STRATEGIES
We have estimated the extra costs associated with a submarine production gapand the delays caused by having to reconstitute the workforce and productionfacilities for restart. In Chapter Seven, we will combine those cost elementswith others whose deferral results in gap-related savings, to compare overallcosts for production gap strategies. First, however, we need to define a mech-anism for examining the cost and schedule consequences of each strategy.That will lead us to defining the strategies—combinations of production rate,fleet size, and ship life—that are practical alternatives for evaluation from thepoint of view of basic standards of feasibility, national security, economics, andanalytic efficiency.
MODELING FLEET REPLACEMENT
Although the elements of the strategies we’ve just been talking about all affectgap length, their scope and implications are really much broader than that, sowe prefer to call them “fleet replacement strategies.” To determine the out-comes of different strategies, we constructed a linear-programming model. Themodel is designed to choose a fleet replacement schedule, including a restartdate, that yields a minimum net present value (NPV) of future costs over a des-ignated time period, subject to specified constraints that characterize the strat-egy.
The overall structure of the model is outlined in Figure 6.1, with constraintslisted on the left. The following ranges of values were investigated:
• Sustained fleet size: 30, 40, 50, or 60 ships. These choices bracket the cur-rent force size goal of 55 established by the Joint Chiefs of Staff. The use ofthe other numbers is not an endorsement of lower goals but stems from ourdesire not to bias the results against an extended gap by ignoring fleet sizesthat permit such a gap.

70 The U.S. Submarine Production Base
RANDMR456-6.1
������������
Minimum future fleet size
������������
Maximum andminimum build
rates
������������
Option for earlydecommissioning
of 688s
��������Maximum allowable
submarine age
Model determines fleet replacementand early decommissioning schedulethat minimizes NPV of productionand O&S costs from 1994 to 2030
New submarinedelivery
schedule
Time profileof fleet size
Time profile ofcosts: - discounted - undiscounted
��������������Cost and
inventorydata
Figure 6.1—Fleet Composition Analysis Framework
• Annual production rate: a maximum of one, two, or three ships per year,with one or two active shipyards, and a minimum of zero, one half, or oneship per year. Can the shipyards deliver at the maximum rates specified?Figure 6.2 shows that Electric Boat can, and Figure 6.3 shows that NewportNews can deliver two per year and has at times delivered more.1
• Lifespan of current ships is investigated in the form of two choices:
— Whether to allow early decommissioning of Los Angeles-class ships soas to reduce operating and support (O&S) costs in the near term whenthe fleet size is greater than is justified by the present national militarystrategy and the threat it assumes. Decommissioning is consideredonly at the designated refueling point (around age 16 for the earlymodels, and at about year 24 for the later models2). Neither Seawolf
______________1To depict full submarine production capabilities, these figures include past SSBN construction.Future SSBN production is likely to influence SSN construction scheduling and costs. However,there are too many uncertainties about the nature of the future nuclear threat and the appropriateSSBN fleet size to attempt to account for SSBN effects.2This was the information available to us in the spring of 1993. The Navy has since informed us thatreactor cores on some later-model 688s will have sufficient fuel to last beyond year 24; where theydo not, the ship will be decommissioned.

Alternative Fleet Replacement Strategies 71
RANDMR456-6.2
1960
Fiscal year
Sub
mar
ines
com
mis
sion
ed6
4
3
2
1
062 2000
SSNsSSBNs5
64 66 68 70 72 74 76 78 80 82 84 86 88 90 92 94 96 98
Figure 6.2—Electric Boat Submarine Production History
RANDMR456-6.3
1960
Fiscal year
Sub
mar
ines
com
mis
sion
ed
5
4
3
2
1
062 2000
SSNsSSBNs
64 66 68 70 72 74 76 78 80 82 84 86 88 90 92 94 96 98
Figure 6.3—Newport News Submarine Production History

72 The U.S. Submarine Production Base
nor NSSN require refueling and thus are not candidates for early de-commissioning.
— Whether to extend the nominal life of the last 31 Los Angeles–classsubmarines and the Seawolves from 30 to 35 years. Only those shipsare considered, because the earlier ones would probably need to berefueled a second time if they were to operate beyond 30 years.3
These constraints can be imposed in any desired combination, and the modelwill determine the new submarine construction schedule that minimizes thefuture cost of procuring, operating, overhauling, and decommissioning thesubmarines.
Before we go on, let us clarify the way we handled transitions in the productionrate. We specified a maximum production rate, that is, a maximum number ofdeliveries per year; there were two kinds of instances in which a rate lower thanthe maximum was used. First, we input a “ramping up” schedule that specifiedthe number of ships per year a shipyard could produce in moving from no shipsdelivered to the maximum rate (represented by the rows in Table 6.1). Theseschedules were designed to reflect in a generic way the delivery schedules(starting from an inactive yard) that were produced by the workforce buildupmodel described in Chapter Three. Second, in subsequent years the fleet re-placement model could choose to deliver fewer than the maximum number al-lowed (e.g., in a year in which a smaller-than-usual number of decommission-ings was scheduled4). In either case, the number of deliveries from a particularshipyard could not be changed by more than one from year to year.
Table 6.1
Submarines Delivered per Year for Different Maximum Rates
Max. RateYear of 1st
Delivery (X) X + 1 X + 2 X + 3 X + 4 X + 5
1 per year 1 0 1 1 1 12 per year 1 0 1 2 2 23 per year 1 0 1 2 2 3
NOTE: These are rates per shipyard; for cases involving two shipyards, the combined ini-tial schedule would be 2, 0, 2, . . . .
______________3We choose a five-year extension because it is large enough to make a difference in cost and sched-ule but not so large as to merit dismissal out of hand on feasibility grounds. As explained in ChapterSeven, however, extensive study will be required to determine the feasibility of any life extensionplan.4The number of decommissionings per year is also partly under the model’s control through theoption to decommission certain vessels early.

Alternative Fleet Replacement Strategies 73
Besides the constraints listed above, there are two other inputs to the model:the current inventory of attack submarines and cost data. The inventory is de-scribed in Chapter Two. The cost values used in the analysis are shown in Table6.25 (for more detail on O&S costs, see Appendix G). While all such costs aresubject to variation from boat to boat, and subject to the inevitable uncertain-ties of estimating future costs, such lack of precision is unlikely to have a signifi-cant effect on the final study results.
There are several additional points regarding our approach to costs. Most ofthe analysis performed in the study has been on the basis of minimizing thecosts, at a 5 percent discount rate, over the time period of 1994 to 2030.Sensitivity runs with larger discount rates produced negligible differences in thecalculated schedule of new ship production. The end date of 2030 was selectedbecause by then all of the presently existing ships will have been retired (if the30-year lifespan is retained; see Figure 6.4) and the entire quantity of new shipsneeded to sustain the designated fleet size will have been constructed.
In the calculation of cost distribution over time, we assume that the entire pro-curement cost of a new submarine is incurred at a single point, six years prior tocommissioning. Other costs, such as overhaul, refueling, and decommission-ing, are incurred in the year that the activity occurs. This treatment of costs re-flects our interest in budgetary effects—appropriations as opposed to outlays.
Table 6.2
Values of Cost Inputs to the Fleet Replacement Model(costs per ship, millions of 1992 dollars)
688-Class Seawolf-Cost Input 688–699 700–718 719–773 Class NSSN
Initial construction 800 800 800 1750 1000Refuelings and overhaulsa at
7 years 175 90 90 200 17516 years 265 265 175 200 17524 years 175 175 265 200 175
Decommissioning 50 50 50 50 50Annual operations 15 15 15 17 15
a$265M actions are refueling overhauls, $175M–$200M actions are regular overhauls, and $90M ac-tions are depot modernization periods.
______________5The costs in Table 6.2 are based on information available to us in the spring of 1993. The Navy hasrecently informed us that it plans to overhaul Seawolf-class ships and NSSNs only once and, asnoted above, that it does not plan to refuel the later 688s. (However, if ship life were to be extended,a refueling at 24 years would be likely.) The Seawolf and NSSN changes would have virtually no ef-fect on our cost analysis, as the total overhaul cost would not be different (see Appendix G). The ef-fect of the 688 change is not readily predictable.

74 The U.S. Submarine Production Base
��������35-yr life
30-yr life
RANDMR456-6.4
Sub
mar
ines
in fl
eet
70
60
50
40
30
20
10
01990 2000 2010 2020 2030
��
�����������������������������
Figure 6.4—Los Angeles- and Seawolf-Class Submarines Will All Be Retired by 2030(unless lifespan is extended)
We assume procurement costs are invariant with quantity. Experience suggeststhat the learning curve slope in serial production of a submarine class is typi-cally rather flat, and is further flattened by the practice of introducing designimprovements from time to time. In addition, given that we anticipate asmaller production rate than in the past and a more varied threat, fewer shipsmay be built between substantial design modifications. Thus, we believe thatintroducing an arbitrary learning curve would add nothing to the quality of themodel results. Introducing a learning curve would also be inconsistent with ouranalytic strategy of making assumptions that favor longer gaps.6
Cost and schedule effects of reconstituting the industry after a gap in produc-tion have not been incorporated into the model. To simplify the analysis pro-cess, those effects are examined separately (as described in Chapters Three,Four, and Five) and combined with the model results during the final evalua-tion of policy alternatives in Chapter Seven.
______________6If submarines cost less with a longer gap because of discounting, applying the same percentagecost reduction to analogous ships in shorter- and longer-gap construction sequences will reducethe absolute cost difference between the two.
Alternative Fleet Replacement Strategies 75
DEFINING AND SCREENING THE ALTERNATIVES
In analyzing shutdown and reconstitution, we ignored eventual fleet dynamics,began with the gap now under way, and estimated costs and delays for variousrestart years. Now, we begin at the end, with one of a range of fleet sizes thatmight be chosen as a goal, and work backward. At some point after the de-commissioning of Los Angeles–class submarines begins, the fleet size will dropbelow the goal unless submarines have by then been produced in large enoughnumbers to make up the difference. Once values have been assigned to threefactors—the target fleet size, a production rate, and a set of lifespans for currentships—the latest possible restart date (and thus a maximum gap length) can bedetermined. Limiting the values of the factors (or model constraints) to rangesof reasonable, practical choices limits the gap lengths achievable.
By combining the various possible constraint values listed above, we obtained80 alternative fleet replacement strategies for further consideration. In doingso, we had to limit our treatment of shipyard-and-production-rate combina-tions or deal with even more strategies. We chose to consider all three single-shipyard cases (for maximum rates of one, two, and three per year). However,we confined ourselves to two two-shipyard cases: one and two per year and twoand two per year. The former gave us a case in which a sustained rate of threeper year could be achieved more rapidly after restart than with a single ship-yard, and the latter furnished a combined four-per-year rate. It did not seem tous that cases of one and one or one and three per year would add anything towhat we already had, and combined rates of more than four per year appearedunnecessary.
The 80 alternative strategies are shown in Figure 6.5. Each triangular cell repre-sents an alternative. For example, the lightly shaded triangle represents a fleetreplacement strategy in which an eventual fleet size of 30 is reached through amaximum construction rate of three ships per year at a single shipyard; themaximum current ship life is 35 years and early decommissioning is permitted.In the strategy represented by the darkly shaded triangle (partly hidden), thefirst three factors are the same, but the maximum age is the current 30 yearsand no ship is decommissioned early. This kind of diagram is useful for dis-playing model outputs, such as cost, in the cells. We use it for year of first deliv-ery or restart in repeating portions of this figure below.
Narrowing the Range of Production Rates Considered
It was possible to screen out some alternatives through consideration ofschedule issues alone (without estimating costs). For example, a productionrate of one ship per year is obviously not enough to sustain, when steady-stateconditions prevail, a fleet of more than 30 or 35 ships if those ships must retire

76 The U.S. Submarine Production Base
RANDMR456-6.5
30
40
50
60
1 per yr 2 per yr 3 per yr 3 per yr 4 per yrOne Shipyard Two Shipyards
Max. age 3035
Sustainedfleetsize
No early decommissioning
30
40
50
60
1 per yr 2 per yr 3 per yr 3 per yr 4 per yrOne Shipyard Two Shipyards
Max. age 3035
Sustainedfleetsize
Allow early decommissioning
Figure 6.5—The 80 Alternative Fleet Replacement Strategies Considered
after 30 or 35 years. Can it sustain even 30 when steady-state conditions do notprevail (i.e., when ships are coming out of the force at a rate of three per year,but when the starting point is more than 60 ships)? Let’s examine a fleet re-placement strategy that places minimum stress on future production resources:We assume the Seawolf-class SSN-23 is built, production of the NSSN is startedrelatively early with first delivery in 2005, and no ships are decommissionedearly (so they need not be replaced early). A simple spreadsheet analysis pro-duces the fleet profiles in Figures 6.6 (maximum age of 30 years) and 6.7(maximum age of 35). If the current 30-year retirement age is retained, the fleetsize will drop below 25 if only one ship can be delivered per year. Even if thelater Los Angeles–class ships are not decommissioned until age 35, the fleet willstill drop below 30. Thus, a maximum production rate of one per year willprobably not be adequate to meet future fleet needs.
This analysis permits a second useful conclusion. A production rate of threeships per year at two shipyards will sustain a fleet size of 60, even with all shipsdecommissioned at age 30. Thus, rates greater than three per year will probablynot be needed in the future. Elimination of the one-per-year and four-per-yearproduction rates allows deletion of the first and fifth of the five columns inFigure 6.5.

Alternative Fleet Replacement Strategies 77
������������
���������
RANDMR456-6.6
Num
ber
of s
ubm
arin
es
80
70
60
50
40
30
20
10
02000 2010 2020 2030
������������������
������������
�����������������������
������
��
3 (2 yards)
3 (1 yard)
2
1
Near 0
Rate
������
Figure 6.6—Largest Achievable Fleet Size When Maximum Ship AgeIs 30 Years
RANDMR456-6.7
Num
ber
of s
ubm
arin
es
90
70
60
50
40
30
20
10
02000 2010 2020 2030
��������������
������������
����������������
��������������
��
������������
��������������������80
���
3 (2 yards)
3 (1 yard)
2
1
Near 0
Rate
Figure 6.7—Largest Achievable Fleet Size When Maximum Ship AgeIs 35 Years

78 The U.S. Submarine Production Base
A third valuable inference can be drawn from a comparison of Figures 6.6 and6.7. For each production rate, extending the life of the later 688s allows a largerfleet size to be maintained. The gain is small for three ships per year and is notenough for one per year, but at the median rate of two per year, life extensionpermits a substantial gain (25 percent) across a potentially important range offleet sizes. We will have more to say about the value—and drawbacks—of lifeextension in the next chapter.
Choosing One of the Two Decommissioning Strategies
The different fleet replacement strategies obviously have different conse-quences for both near-term and far-term costs. Increasing the allowable pro-duction rate, for example, lowers present discounted costs by allowing produc-tion to be put off further into the future; however, it does not affect the sum ofthen-year, undiscounted costs. Both discounted and undiscounted costs canbe saved by decommissioning some of the Los Angeles–class submarines earlyinstead of refueling and continuing to operate them. This suggested a secondscreen, so we ran some cases through the fleet replacement model.
In Figure 6.8 we show the fleet profile consequences of two cases that differonly in the decommissioning rule applied. The top curve shows what happensif we do not allow early decommissioning of 688s, while for the second curve,early decommissioning is allowed. In the latter case the model decommis-sioned 24 submarines early, at their nominal refueling point. (That was thenumber minimizing cost given the parameters shown; for different parameters,different numbers would be decommissioned.)
For the pair of cases shown, early decommissioning permits a reduction in totalundiscounted costs of about $14 billion (in 1993 dollars; see Figure 6.9). This isa consequence of saving $440 million per boat by eliminating refueling andoverhaul costs ($265 million for the more recent 688s7) plus $210 million in op-erations costs for the forgone operational period ($90 million for the more re-cent boats).
These cases illustrate a cost relationship that turned out to be true in every sit-uation, although of course the amount of savings varied from one case to an-other. As a consequence, in all subsequent analysis we invoke early decom-missioning of the 688s to the extent necessary to minimize cost while still
______________7The maintenance schedule for the first 31 Los Angeles-class ships calls for an overhaul followingrefueling, while that for the second 31 does not. The advantages of decommissioning apply princi-pally to the first 31 ships. Decommissioning the later ships early (at age 24) saves less money, and itforgoes savings from life extension to 35 years and from postponing production of replacementships (see Chapter Seven).

Alternative Fleet Replacement Strategies 79
������������������������No early decommissioning
With early decommissioning
Minimum fleet size
����������������������������������������������������������� ����
RANDMR456-6.8
Sub
mar
ines
in fl
eet
80
70
60
50
40
30
20
10
01990 2000 2010 2020 2030
���������������������������������
��������������������������
��������
����
Max. rate = 2 per yrMax. ship life = 35 yrSSN-23 is builtPre-688s excluded
Figure 6.8—Target Fleet Size Can Still Be Sustained If Some Submarines AreDecommissioned Early
RANDMR456-6.9
Cum
ulat
ive
cost
of e
arly
dec
omm
issi
onin
g re
lativ
e to
no
ear
ly d
ecom
mis
sion
ing
(bill
ions
of 1
993
dolla
rs) 0
–2
–4
–6
–8
–10
–12
–14
–16
1990 2000 2010 2020 2030
Figure 6.9—Early Decommissioning for the Case Shown in Figure 6.8Would Save $14 Billion (undiscounted)
80 The U.S. Submarine Production Base
meeting force size goals and not exceeding maximum new construction rates.That makes the back panel in Figure 6.5 unnecessary.
Narrowing the Range of Fleet Sizes Considered
Some might argue that the range of fleet sizes we consider is already too nar-row; perhaps in the security environment of the early 21st century the UnitedStates will need only 20 attack submarines or fewer. In that case, it would nei-ther be necessary to deliver the next submarine until 2020 (see Figure 6.4) nor toreconstitute the submarine production base until after 2005. This could lead todifferent conclusions regarding the merits of extending the production gap.
Evaluating the merits of such a position is outside the scope of this analysis.8
We draw the range of fleet sizes we consider from those most widely discussedby knowledgeable participants and observers of submarine fleet requirementsand acquisition. Even a 30-ship fleet is outside that range. We retain it for cur-sory analysis of a single alternative (maximum rate of two per year, maximumship life of 30 years). With that one exception, we eliminate the top row inFigure 6.5.
Checking the Feasibility of Production Gaps
The final step in the preliminary screening of future fleet replacement optionswas to examine the maximum possible gap that might be sustained for each ofthe various cases. That is, for each of the remaining cases, how long can deliv-ery of the first ship and thus start of production be put off? The delivery andrestart dates for each of the remaining cases are shown in Figures 6.10 and 6.11,respectively. Because we are interested in both the costs and benefits of a sus-tained production hiatus, we do not interrupt the gap with an SSN-23.
Four of the cells in Figures 6.10 and 6.11 are blank. For these alternatives, deliv-ery of the first ship would have to be taken before 2004, implying a restart be-fore 1998. For that to happen, the design process for the NSSN would have tobe further along than it is now. At a maximum rate of two ships per year, pro-duction cannot be restarted soon enough to prevent the fleet size from drop-ping below 60, with or without life extension to 35 years. Nor can it be restarted
______________8It may be worth noting, however, that a 20-ship fleet would leave the United States with manyfewer attack submarines than Russia and China each now has and with about the same numberthat North Korea has.

Alternative Fleet Replacement Strategies 81
RANDMR456-6.10
NOTE: No SSN-23; blank triangle indicates delivery needed earlier thanis feasible.
Allow early decommissioning
Max. age 30
35
One Shipyard
2 per yr 3 per yr
Sustainedfleetsize
40
50
60
2005
2010
2005
2010
2010
2006
2007
2004
3 per yr
Two Shipyards
2011
2011
2008
2008
2005(59)
2005
Figure 6.10—Latest First-Delivery Date Feasible for Each Production Strategy
RANDMR456-6.11
NOTE: No SSN-23; blank triangle indicates restart needed earlier thanis feasible.
Allow early decommissioning
Max. age 30
35
One Shipyard
2 per yr 3 per yr
Sustainedfleetsize
40
50
60
1999
2001
1999
2001
2001
1999
2000
1998
3 per yr
Two Shipyards
2001
2001
2000
2000
1999(59)
1999
Figure 6.11—Latest Restart Date Feasible for Each Production Strategy

82 The U.S. Submarine Production Base
soon enough to sustain a fleet size of 50 if the current service life is retained.The same goes for 60 at three ships per year. These four cases are thus droppedfrom further consideration.9
For the remaining strategies, initial deliveries can be taken anywhere from 2004,for the one remaining case in which a single shipyard must sustain a 60-shipfleet, up to 2011, when two shipyards work to sustain 40 ships. However, thisseven-year delivery differential shrinks to three years at restart if the yards areinactive after current production ends. That is because current productionends around the time of restart for a 2004 delivery, and many workers would beimmediately available for the new production line. But if restart is postponedonly a few years, those workers will be gone, so it will take much longer to buildup the workforce and much longer to build the first submarine (see Figures 3.10and 3.11).
Thus, gap options are limited in practice to a range of choices spanning onlythree years. That limits the savings that can be achieved from deferring restartas long as possible, as we shall see in the next chapter.
Before continuing, we make a point about fleet replacement dynamics. Wehave been showing maximum feasible gaps to give extended-gap strategies a“fair shake” by maximizing their discounted savings. However, such gapswould impose a serious penalty on future generations. Consider, for example,the case of sustaining a 40-ship fleet with a production rate of up to three sub-marines per year. That would allow authorization of the first new submarine tobe delayed until 2001, with delivery in 2010. Production would then proceed for17 years, with the 40th submarine being delivered in 2027 just as the last of thepresent submarines reaches the current retirement age. However, the Navy in2027 would find itself with a fleet of 40 submarines, the oldest of which wouldbe 17 years old. Continuing the presumption of a 30-year life, no new sub-marines would be needed for another 13 years. The cycle of feast and faminewould repeat every 30 years. In fact, at least a limited problem of this type isbuilt into any policy that delays new construction as long as possible. A for-ward-looking planner would probably want to produce at a rate close to thatneeded to sustain the anticipated future fleet size in steady state, which wouldrequire a relatively early start date.
______________9A special case exists for a fleet size of 60, maximum age of 30 years, and production rate of threeper year from two shipyards. This combination leads to a force size decaying to 59 ships beforestarting to build back up. That is sufficiently close to 60 ships that we elected to retain this case inthe analysis.

83
Chapter Seven
COMPARING THE COST OF ALTERNATIVE STRATEGIES
We next compare the costs of fleet replacement or “gapping” strategies thatsurvived the previous chapter’s preliminary screening. We combine the costsfrom the fleet replacement model, which takes into account construction,maintenance, and operations, with the reconstitution costs estimated inChapters Three, Four, and Five.1
The strategies surviving the preliminary screening are those represented by thedated triangles in Figures 6.10 and 6.11. We limit our analysis to strategies in-tended to sustain a fleet of 40 or 50 ships from a single yard (plus a single 30-ship comparison). The two-shipyard cases offer only minor extensions of theproduction gap. The sole strategy for maintaining a 60-ship fleet from a singleyard requires both a high production rate and an extended ship life, and thefirst ship would still have to be delivered a year earlier than in any of the otherstrategies. It would thus not appear that this strategy is a likely choice.
The dated strategies in Figures 6.10 and 6.11 are “maximum-gap” strategies: nomore submarines will be started until the one represented by the restart anddelivery years shown. For each of these, we define a corresponding “minimum-gap” strategy. The minimum-gap strategies are intended to be the closest wecan now come to “continued production.” These entail beginning SSN-23 in1996 for delivery in 2002, and beginning the first NSSN in 1998 or 1999 for de-livery in 2005. Except for the restart date and the inclusion of SSN-23, the char-acteristics of each minimum-gap strategy are the same as those for the maxi-mum-gap strategy it is paired with. As an example, we show in Figure 7.1 theway that gapping and restarting are related for one pair of minimum- andmaximum-gap strategies (minimum fleet size of 40 ships, maximum productionrate of two per year, and maximum ship life of 35 years).
______________1The cost of reconstituting the nuclear-core vendor is not included, as we do not anticipate thatvendor will have to shut down.

84 The U.S. Submarine Production Base
2004
RANDMR456-7.1
1992
Year
1994 1996 1998 20102000
SSN-762
SSBN-739
SSN-763
SSBN-740
SSN-768
SSBN-741
SSN-771
SSN-21
SSBN-742
SSN-22
SSBN-743
SSN-773
SSN-772
SSN-770
SSN-769
SSN-766
SSN-767
SSN-765
SSN-764
20062002
Submarinesunder
construction
Minimum fleet size = 40Maximum production rate = 2 per yrMaximum ship life = 35 years
2008
Minimum gap
Start Delivery
Third Seawolf (SSN-23)
4 years
New attack submarine
Maximum gap
~12 years
New attack submarine
3 years
������������
������������
����������������
Newport News Shipbuilding
Electric Boat
Figure 7.1—Gap and Restart Relations Between Minimum- andMaximum-Gap Strategies
Given the specified restart date (and thus the gap length), the fleet replacementmodel determines the schedule of construction, early decommissioning, andlife extension (where permitted) that will replace the current fleet for the lowestnet present value. The schedule must meet the requirements of maximum pro-duction rate and minimum fleet size that characterize the strategy being as-sessed, and must avoid further production gaps by delivering at least one shipper year.2 After reconstitution costs are added to the costs of the optimal
______________2With certain early exceptions. No ships are built between SSN-23 and the first NSSN, and, asnoted in Chapter Six, we allow for the time needed to reconstitute the workforce by assuming thesecond ship is not delivered until two years after the first.

Comparing the Cost of Alternative Strategies 85
schedule identified by the model, we can compare the net present value of thetotal costs with that for a schedule derived from a different restart date.
Note that we are comparing cost-minimizing schedules contingent on restartdates defined outside the model. We do not attempt to discover the restart datethat minimizes costs. From limited analyses along those lines, we believe that,at least in some cases, the most economical restart strategy may fall between thetwo strategies we do compare—the minimum and maximum length gaps. But,given the small gap range feasible, we prefer to compare schedules that differ asmuch as possible, under the constraints applicable.
As in Chapter Three, we analyze in detail one illustrative set of alternatives andsummarize the results of the other assessments. For the illustration, we havechosen a fleet size of 40 at a maximum production rate of two per year. Wecompare minimum and maximum gaps, and 30- and 35-year maximum shiplives. Results for three per year and for the 50-ship cases are given in thischapter only in broad outline. Appendix H provides a fuller treatment.
SUSTAINING A FLEET SIZE OF 40 SHIPS AT TWO PRODUCED PERYEAR
Differences in Discounted Costs
In Figure 7.2, we show the cumulative cost of sustaining the attack submarinefleet (688s, Seawolves, and NSSNs) from 1994 to 2030. By “sustaining,” wemean the costs of reconstituting the production capability after the current gap,building ships, maintaining them through scheduled overhauls and refueling,operating the boats at current tempos, and decommissioning them. We countall these costs because all are affected by the choice of fleet replacement strat-egy. The length of the gap influences reconstitution costs. Decisions regardingearly decommissioning and life extension affect the amount of refueling andoverhauling done. All these choices interact to determine the number of shipsthat need to be built and thus eventually decommissioned. They also deter-mine the number of ships in the fleet at any given time, which affects the cost ofoperations. Furthermore, the timing of all these costs affects their presentvalue. Costs are discounted to the beginning of the period at 5 percent per year.
From the curves in Figure 7.2, we draw two conclusions, which, as we will show,are applicable in all our analyses, regardless of fleet size and production rate:
• The cost differences among the various strategies are modest relative to thetotal costs of sustaining the fleet and to the uncertainty of our predictionmethods.

86 The U.S. Submarine Production Base
1995 20302000 2005 2015 20201990 2025
RANDMR456-7.2
Bill
ions
of d
olla
rs (
NP
V)
50
40
35
10
0
25
20
30
45
15
5
2010
Min. gap, 30-yr life
Max. gap, 30-yr life
Min. gap, 35-yr life
Max. gap, 35-yr life
Figure 7.2—Cumulative Cost of Sustaining the Attack Submarine Fleet (40-ShipMinimum) at a Maximum Production Rate of Two per Year, Discounted at
5 Percent per Year
• The cost advantage of extending ship life from 30 to 35 years is greater thanthe advantage of extending the production gap (see the blow-up in Figure7.3).
Provisos should be attached to each of these. We use the sum of all fleet-relatedcosts as the basis for comparison because those are the costs affected by thechoice of replacement strategy. However, it could be argued that our denomi-nator is too large—and our estimate of relative costs thus too small. It could beargued that one does not choose between fleet replacement schedules with theobjective or even the expectation of substantially affecting (for example) thecost of operations. Indeed, the strategies differ in operational costs by less than4 percent. It could also be argued that the $2.4 billion difference between themost and least costly strategies is a lot of money, regardless of the basis of com-parison.
The principal reason we choose to be cautious in asserting cost differences isnot because they are small relative to total costs (apparent as that may be fromFigure 7.2), but because they are not large enough relative to our possible esti-mating error. We have already discussed the uncertainties attending reconsti-tution cost estimates, and our estimate of the cost of building the NSSN could

Comparing the Cost of Alternative Strategies 87
20302020
RANDMR456-7.3
Bill
ions
of d
olla
rs (
NP
V)
48
44
42
36
38
40
46
2025
Min. gap, 30-yr life
Max. gap, 30-yr life
Min. gap, 35-yr life
Max. gap, 35-yr life
Figure 7.3—Upper Right Portion of Figure 7.2 at High Resolution
also prove conservative. We cannot be confident that costs estimated within abillion dollars or so of each other actually vary in the direction shown.
As for our second conclusion, the only additional cost we take into account inassessing life extension is that of an overhaul assumed required when a shipreaches 30 years of age. Other costs, however, should be anticipated. The U.S.Navy has essentially no experience in operating submarines beyond the stan-dard 30-year life (two have been operated for 31 years). It may be necessary toinspect, monitor, and test hull elements and critical components on ships ap-proaching the 30-year mark to discover trends that can be extrapolated. If it isdiscovered that certain components have too high a probability of failure be-tween 30 and 35 years, those components would have to be replaced at the 30-year overhaul, increasing costs. It is not inconceivable that the total unac-counted cost of extending submarine life from 30 to 35 years will exceed theNPV savings shown in Figure 7.2. It is also possible that it will prove infeasibleto extend service life. However, given the potential savings, a serious look atthis option would seem advisable.
Differences in Undiscounted Costs
In Figures 7.4 and 7.5, we show the results from Figures 7.2 and 7.3 in undis-counted terms. Again, the differences are small relative to total costs. We show

88 The U.S. Submarine Production Base
1995 20302000 2005 2015 20201990 2025
RANDMR456-7.4
Bill
ions
of 1
993
dolla
rs120
40
0
80
60
20
2010
100
Min. gap, 30-yr life
Max. gap, 30-yr life
Min. gap, 35-yr life
Max. gap, 35-yr life
Figure 7.4—Cumulative Cost of Sustaining the Attack Submarine Fleet (40-ShipMinimum) at a Maximum Production Rate of Two per Year, Undiscounted
20302020
RANDMR456-7.5
Bill
ions
of 1
993
dolla
rs
110
100
95
70
85
90
105
2025
80
75
Min. gap, 30-yr life
Max. gap, 30-yr life
Min. gap, 35-yr life
Max. gap, 35-yr life
Figure 7.5—Upper Right Portion of Figure 7.4 at High Resolution

Comparing the Cost of Alternative Strategies 89
these results because they indicate the effects of discounting, and because weintend to use undiscounted costs below to analyze the reasons for differencesamong the strategies. Caution is urged in their interpretation and use, for tworeasons:
• Decisions regarding spending and investment over the long term should bemade on the basis of discounted costs. Some would say that no saving re-sults from postponing a billion-dollar purchase by ten years, that it’s “justmoving money around.” But that ignores the value most people wouldascribe to having the benefits of that purchase now rather than later(whether that money goes to a submarine or some other purpose).
• The costs we show in Figure 7.4 are the result of converting the discountedoutput of the fleet replacement model into undiscounted terms. The out-put of the model is the result of fleet replacement decisions made to mini-mize discounted costs. If submarine acquisition policy is to be made on thebasis of undiscounted costs, it should be based on fleet replacement deci-sions that minimize undiscounted costs.
Identifying the Sources of the Cost Differences
Notwithstanding the cautions we have urged in interpreting predicted cost dif-ferences among the strategies, we believe these differences merit further exam-ination, for two reasons. First, the larger differences—those on the order of $2billion or more—may represent genuine differences in the directions shown,even if assumptions regarding reconstitution and construction costs arechanged. We recognize that long-term policy decisions must often be based onuncertain data, that some information is better than none, and that policy-makers might not wish to ignore predicted cost differences of that magnitude.The reasons for these differences may thus be of interest for policymaking.
Second, an analysis of the sources of the cost differences—even the smallerones—is useful because it demonstrates how the need to meet certain objec-tives and constraints affects not only construction but also maintenance anddecommissioning decisions. The decisions that need to be made to minimizecost are not always the ones that would have been expected without runningthe model. The results thus illustrate the utility of analytic modeling of this typein planning submarine acquisition over the long term.
We begin with a different way to show the costs in Figures 7.2 and 7.4. Figures7.6 and 7.7 display the same discounted and undiscounted profiles of future

90 The U.S. Submarine Production Base
1995 20302000 2005 2015 20201990 2025
RANDMR456-7.6
Bill
ions
of d
olla
rs (
NP
V)
1
–3
–5
–1
–2
–4
2010
0Min. gap, 30-yr life
Max. gap, 30-yr life
Min. gap, 35-yr life
Max. gap,35-yr life
Figure 7.6—Cumulative Cost of 40-Ship, Two-per-Year Strategies, Relative toCumulative Cost for Min.-Gap, 30-Year-Life Strategy, Discounted
1995 20302000 2005 2015 20201990 2025
RANDMR456-7.7
Bill
ions
of 1
993
dolla
rs
2
–3
–5
–1
–2
–4
2010
0Min. gap, 30-yr life
Max. gap, 30-yr life
Min. gap, 35-yr life
Max. gap,35-yr life
–6
–7
–8
1
Figure 7.7—Cumulative Cost of 40-Ship, Two-per-Year Strategies, Relative toCumulative Cost for Min.-Gap, 30-Year-Life Strategy, Undiscounted

Comparing the Cost of Alternative Strategies 91
cumulative costs, this time in terms of their difference from the 30-year-life,minimum-gap case. The latter thus becomes a flat line at zero. It is clearer onthese curves than on the previous ones that the cumulative difference in costbetween strategies varies substantially over time.
We will now compare the minimum vs. the maximum gap, first assuming a 30-year maximum ship life, then 35 years. Then we will compare a 30-year life vs.35 years, first assuming a minimum gap, then a maximum. We will concentrateon the undiscounted curves, as it is easier to discover the sources of cost differ-ences when not simultaneously accounting for the time value of money. Thedifferences among the discounted curves can then be readily understood.
Minimum vs. Maximum Gap: the 30-Year-Life Cases
These cases are represented by the two thin lines, solid for minimum gap (thehorizontal line at zero dollars), and dashed for maximum, in Figures 7.6 and 7.7.If it proves impractical to extend the life of submarines to 35 years, this is themost interesting comparison. It also lends itself the least to support a decisionone way or the other, as the cost difference between the two maximum-gap op-tions is less than or equal to the undiscounted value of a single submarine overthe entire time span of replacing the current fleet. In fact, the early swings inrelative cost result from the purchase of single ships. The authorization of SSN-23 in the minimum-gap case gives a cost advantage to a continued gap, most ofwhich is lost at the maximum gap’s NSSN start in 1998, only to be returned atthe minimum gap’s NSSN start in 1999, and so on.
This situation is shown more clearly in Figure 7.8. We still show the differencebetween minimum- and maximum-gap strategies, but here the cost for eachyear is shown separately rather than cumulatively, and it is broken down bycost element. If, for a particular year, the minimum case requires, say, a higherconstruction cost than the maximum, that difference is shown as a black bar ex-tending below the zero line. Conversely, if the maximum gap requires extra re-fueling, a dark gray cross-hatched bar extends above the line.3 The early costswings arising from the timing of ship construction show up clearly in this dis-play. Eventually, the same number of ships is built in both cases. However, acost difference of $760 million (in 1993 dollars) accumulates, almost all of it by2003 (see Figure 7.7). Where does it come from?
The cost difference between the minimum- and maximum-gap cases can beviewed as arising entirely from the decision in the former case to bridge the gap
______________3In this and similar graphs for the following comparisons, we do not show the differences for de-commissioning and operating costs, as these are small on an annual basis.
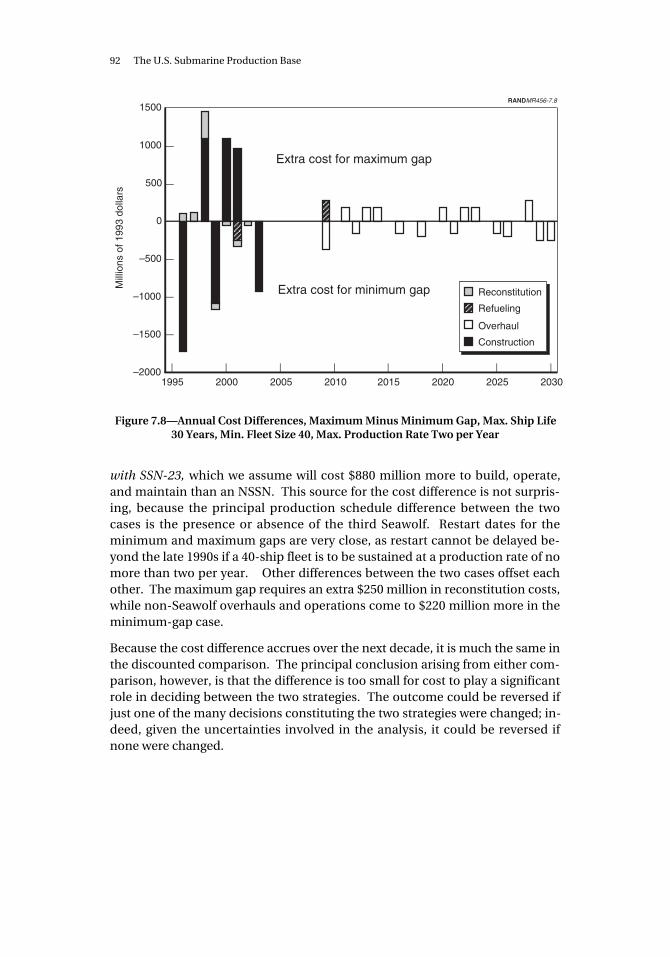
92 The U.S. Submarine Production Base
RANDMR456-7.8
��
��
1500
1000
500
0
–500
–1000
–1500
–2000
Mill
ions
of 1
993
dolla
rs
1995 2000 2005 2010 2015 2020 2025 2030
Extra cost for maximum gap
Extra cost for minimum gap Reconstitution
Refueling
Overhaul
Construction
�
Figure 7.8—Annual Cost Differences, Maximum Minus Minimum Gap, Max. Ship Life30 Years, Min. Fleet Size 40, Max. Production Rate Two per Year
with SSN-23, which we assume will cost $880 million more to build, operate,and maintain than an NSSN. This source for the cost difference is not surpris-ing, because the principal production schedule difference between the twocases is the presence or absence of the third Seawolf. Restart dates for theminimum and maximum gaps are very close, as restart cannot be delayed be-yond the late 1990s if a 40-ship fleet is to be sustained at a production rate of nomore than two per year. Other differences between the two cases offset eachother. The maximum gap requires an extra $250 million in reconstitution costs,while non-Seawolf overhauls and operations come to $220 million more in theminimum-gap case.
Because the cost difference accrues over the next decade, it is much the same inthe discounted comparison. The principal conclusion arising from either com-parison, however, is that the difference is too small for cost to play a significantrole in deciding between the two strategies. The outcome could be reversed ifjust one of the many decisions constituting the two strategies were changed; in-deed, given the uncertainties involved in the analysis, it could be reversed ifnone were changed.

Comparing the Cost of Alternative Strategies 93
Minimum vs. Maximum Gap: the 35-Year-Life Cases
If submarine life can be extended to 35 years, the cost relations between theminimum and maximum gaps change dramatically, as illustrated by the twoheavy lines (solid and dashed) in Figure 7.7 (regraphed in Figure 7.9 to clarifythe relationship). From 1999 through 2008, the difference between maximumand minimum gaps is at least twice as great as in the 30-year case, with the spanreaching $4.2 billion in 2005 and 2006. From 2013 through 2030, the differenceis again twice as great, but this time in the opposite direction, with a maximumspread of $2.9 billion in 2022. The outcome at the end of the period analyzed isa $2.6 billion cost advantage for the minimum gap (undiscounted).
The basic reason for the difference between this pair of curves and the previouspair lies in the relative gap lengths. In both cases, the minimum gap is thesame: we assume that the earliest an NSSN can be delivered is 2005. As ex-plained above, if submarine life cannot be extended beyond 30 years, that isalso the latest the NSSN can be delivered and still sustain a 40-ship fleet at aproduction rate of no more than two per year. But if the service life of the later688s can be extended to 35 years, the maximum delivery gap stretches to 2010.As a result, in the 35-year case the timing of ship construction differs for the twogap strategies, and that is reflected in the cost difference. From 1999 to 2003,
1995 20302000 2005 2015 20201990 2025
RANDMR456-7.9
Bill
ions
of 1
993
dolla
rs
3
–3
–5
–1
–2
–4
2010
0
1
2
Min. gap
Max. gap
Figure 7.9—Cumulative Cost of Maximum Gap Relative to Minimum Gap, Max. ShipLife 35 Years, Min. Fleet Size 40, Max. Production Rate Two per Year, Undiscounted

94 The U.S. Submarine Production Base
about one ship per year is authorized under the minimum-gap strategy whilethe maximum gap has not yet ended (see Figure 7.10). From 2007 through2013, one ship more per year is started under the maximum-gap strategy, andthe maximum gap’s cost advantage is eaten away. As in the previous compari-son, the same number of ships is eventually built under both strategies. And, infact, if ship construction alone were considered, the maximum gap would againcome out ahead in savings, this time by $1.6 billion. Part of that results from(again) the substitution of a Seawolf-class submarine for an NSSN in the mini-mum-gap strategy.4 Most of it, however, comes from a second factor: Delayingthe maximum-gap restart date permits a more concentrated productionschedule (fewer years in which production must be constrained to a singleship). We estimate a $75 million unit cost advantage to building two ships in ayear instead of one,5 and savings thus accrue to the maximum-gap strategy.
����
��
������
���
RANDMR456-7.102000
1000
500
0
–500
–1000
–1500
–2000
Mill
ions
of 1
993
dolla
rs
1995 2000 2005 2010 2015 2020 2025 2030
Extra cost for maximum gap
Extra cost for minimum gap
Reconstitution
Refueling
Overhaul
Construction
�
1500
Figure 7.10—Annual Cost Difference, Max. Gap Minus Min. Gap, Max. Ship Life 35Years, Min. Fleet Size 40, Max. Production Rate Two per Year
______________4For all of the minimum/maximum-gap comparisons discussed in this report, an intermediate casecan be created that would be roughly equivalent to the minimum gap minus SSN-23. (For the firstcomparison, above, this “intermediate” case is actually the maximum gap.) The intermediate casewould save on the order of $700 million (discounted or undiscounted) relative to the minimum gap.5This results from allocating the $150 million fixed overhead cost to two ships instead of one.

Comparing the Cost of Alternative Strategies 95
If the maximum-gap strategy is substantially less expensive in terms of shipconstruction, what is responsible for the minimum gap’s even more substantialcost advantage overall? First, although we constrain the minimum gap strategyto an earlier restart and thus a slower, costlier production schedule, that earlierstart allows this strategy to take greater advantage of a significant source of costsavings: early decommissioning. Under the minimum-gap strategy, four moreships are decommissioned in 2000, resulting in $1.1 billion in refueling costssaved (plus further savings from overhauls and operations avoided).
Just as important is the difference in reconstitution costs. The late start underthe maximum gap requires $1.9 billion more for workforce buildup, vendor re-constitution, and other costs than is needed with the minimum gap. The effectof the difference in refueling and reconstitution costs (the latter in particular) isto reduce the savings realized under the maximum-gap strategy on the left sideof Figure 7.7 to the level shown. As a result, that level is not enough to compen-sate for the savings lost when the minimum gap has the construction advantage(i.e., fewer boats built and lower costs).
The pattern of savings could result in different strategy choices, depending onhow the decisionmaker regards the time value of money. As shown in Figure7.6, there is essentially no difference between the two strategies in the presentvalue of costs discounted at 5 percent over the period through 2030, becausethe gains made by the minimum-gap strategy are later and thus discountedmore heavily. A decisionmaker who took that approach to valuing future dol-lars would thus choose between strategies on other than economic grounds.But if he or she did not wish to discount future dollars, cost considerationswould argue in favor of the minimum-gap strategy.6 Finally, one who dis-counted future costs heavily, who was concerned almost exclusively about thenext eight to ten years, would be attracted to the cost savings achieved by themaximum gap over that period.
30-Year Ship Life vs. 35-Year Life: the Minimum-Gap Cases
What is the effect of extending ship life and how does it compare with that ofextending the production gap? Now we compare the two solid minimum-gapcurves in Figure 7.7—the thin one representing 30 years and the heavier one 35.
In the 30-year case, high-rate production runs from approximately 2002 to2020; in the 35-year case, from about 2014 to 2025. It is easy to see in the heavycurve in Figure 7.7 and in the bars in Figure 7.11 the resulting savings gain in
______________6We offer this as an illustration of how different discounting preferences could affect choices be-tween gap strategies, but, as pointed out above, the model output is based on fleet replacement de-cisions that minimize discounted costs.

96 The U.S. Submarine Production Base
the 35-year case from 2002 to 2013 and in the 30-year case from 2021 to 2025.While we did not require that service life be extended in the 35-year case,7 it iseconomical to do so for the typical boat. The gain from putting off productionof the replacement boat is more than the costs we assume for life extension—that is, a refueling at 24 years8 and an overhaul at 30 years.9 Extending the livesof most (two-thirds) of the later 688s and Seawolves from 30 to 35 years permitspostponing the point at which the entire current fleet must be replaced. The re-sult is a $4.8 billion construction savings for the 35-year case. This is mostly off-set by additional costs from two sources.
The production postponement in the 35-year case is achieved by refueling 688sat 24 years and keeping them in the fleet, thus putting off their replacement.These refueling costs come to $1.9 billion and fall between 2009 and 2014,slowing the savings gain for the 35-year case during that period (Figure 7.7). Ifrefueling is advantageous, why is it not also done in the 30-year case? Granted,without life extension, refueling postpones ship replacement by only six years,but that still results in net discounted savings after figuring in the refuelingcost.10 The answer lies in the timing of refueling and the upper limit on annualproduction: Extra refuelings in the 35-year case are accomplished before high-rate production for the 35-year case but during high-rate production for the 30-year case. For a ship refueled at 24 years, construction must simultaneouslystart on its successor (for the 30-year case). This cannot be done when produc-tion is already at two per year, so the ship must be decommissioned rather thanrefueled. This is one way in which limitations on production rate can limitsavings.11
______________7The last 31 Los Angeles–class ships were either refueled at 24 years and then overhauled for ex-tension at 30 or were decommissioned at 24. We did not allow refueling at 24 and retirement at 30in the 35-year case.8There is little or no extra operating cost if a ship is refueled at age 24. For all strategies examined,the fleet size falls to 40 in 2008 and is held close to that level by a combination of decommissioningand new production through at least 2027. Adding or subtracting a ship by means of early de-commissioning or life extension during that period is unlikely to affect operating costs, as anotherwill be subtracted or added to hold the fleet size around 40. (Falling below 40 is not permitted andrising above it is uneconomical in most situations.)9For an extension of three years, an overhaul would not be required at year 30, and almost as muchmight be saved as with a five-year extension, but at less cost (not quantified here) associated withameliorating extension-related technical and safety risks.10The choice here is between refueling and decommissioning at 24 years. Refueling at 16 years(instead of early decommissioning) entails the costs of a refueling, an overhaul, and 14 years of op-erations. Because the early 688s all reach the 16-year point by 2001, when the fleet size is well above40, replacement is not required right away even if a ship is decommissioned early. The discountedsavings from postponing production by refueling are thus small relative to the costs entailed, so re-fueling at 16 years is usually not advantageous.11As noted in Chapter Six, we have recently learned that the Navy does not plan to refuel ships at 24years in the 30-year-life case. The cores may permit service beyond that point; where they do not,the ships will be retired. We retain the discussion to point out that, in some scenarios, production

Comparing the Cost of Alternative Strategies 97
The other additional cost that contributes to offsetting the 35-year strategy’sconstruction advantage is from overhauls. As the later 688s hit their 30-yearmarks between 2015 and 2027, they are overhauled for life extension. At thesame time, NSSNs built before 2017 (mostly for the 30-year-case) are also com-ing up for overhaul. The result is a net of about one extra overhaul per year forthe 35-year case (see Figure 7.11). This is reflected in the upturn in the 35-yearcurve in Figure 7.7 prior to 2020 and in its particularly steep ascent once theproduction difference kicks in. Following the end of life-extension-relatedoverhauls in 2027, the earliest NSSNs reach their second overhaul point. Again,more of these were built under the 30-year strategy, and a small savings gainaccrues to the 35-year curve. The cost of overhauling boats for life extensionamounts to $1.8 billion, net of extra overhauls in the 30-year case for boats builtearly.12
RANDMR456-7.111500
1000
500
0
–500
–1000
Mill
ions
of 1
993
dolla
rs
1995 2000 2005 2010 2015 2020 2025 2030
Extra cost for 35-year strategy
Extra cost for 30-year strategy
��
���������
���
��
����
Refueling
Overhaul
Construction
�
Figure 7.11—Annual Cost Differences, 35-Year Max. Ship Life Minus 30-Year, Min. Gap,Min. Fleet Size 40, Max. Production Rate Two per Year
_______________________________________________________________________rate limitations can limit savings and, more generally, that various scheduling parameters interactin complex ways to influence relative costs.12All NSSNs, of course, will have the same overhaul schedule, but overhauls for those built later falloutside the window of analysis, as do more of the operating costs for those ships than for the onesbuilt earlier under the 30-year case. The excluded costs are less than those accruing beyond 2030for operating, overhauling, and decommissioning the extra boats built under the 30-year strategy.

98 The U.S. Submarine Production Base
Though the overall cost advantage of the 35-year strategy is small in undis-counted terms, it comes to $2.3 billion when discounted at 5 percent per year.Basically, the 35-year strategy allows fewer ships to be built13 and large dis-counted savings by postponing construction of many that are built. This morethan compensates for the cost of refueling more vessels and for the late, heavilydiscounted costs of extra overhauls at the 30-year point.
30-Year Life vs. 35-Year Life: the Maximum-Gap Cases
Here we compare the two dashed lines in Figure 7.7, the light one representingthe 30-year case and the heavy one the 35-year case. The general relations be-tween the curves and the reasons for them are similar to those for the mini-mum-gap cases, but here life extension runs up more undiscounted costs by2030. The difference is in even greater refueling costs for the 35-year strategy inthe current comparison, along with larger reconstitution costs (see Figure 7.12).
RANDMR456-7.121500
1000
500
0
–500
–2500
Mill
ions
of 1
993
dolla
rs
1995 2000 2005 2010 2015 2020 2025 2030
Extra cost for 35-year strategy
Extra cost for 30-year strategy
Reconstitution
Refueling
Overhaul
Construction
�–1500
–2000
–1000
������
�� �
������
�����
���
��
�
����
Figure 7.12—Annual Cost Differences, 35-Year Max. Ship Life Minus 30-Year, Max.Gap, Min. Fleet Size 40, Max. Production Rate Two per Year
______________13The fleet must be replaced five years earlier under the 30-year strategy, and then one ship per yearmust be built to avoid a production gap. Thus, at any point from 2008 to 2035 and beyond, moreships will have been built under the 30-year strategy. The extra ships cannot be “credited” againstthe next fleet replacement cycle to allow an eventual evening out of the numbers. The reason isthat, over multiple cycles, it takes a slightly higher production rate to maintain a 40-ship fleet with a30-year life than with a 35-year life.

Comparing the Cost of Alternative Strategies 99
Around the year 2000, the 35-year strategy refuels six more ships—instead ofdecommissioning them—than the 30-year stratregy. As pointed out above, de-commissioning ships at age 16 (the age of these ships) is economically prefer-able to refueling them. But in the maximum-gap case, it is not possible todecommission these ships in the 35-year strategy because of the later construc-tion restart. As it is, the fleet drops to 40 ships in 2008, and delivery of the firstNSSN must wait until 2010 under the maximum-gap condition. Further earlydecommissioning would drop fleet size below 40. The later restart in the 35-year case also means greater reconstitution costs—about $1.7 billion greater.
The extra refueling and reconstitution costs lower the maximum savings accu-mulated in the 35-year case for this comparison relative to the previous one($5.9 billion in 2005 vs. $7.6 billion in 2016). These are then outweighed by theconstruction and overhaul deficit that accumulates between 2015 and 2025.The extra refueling and reconstitution costs also keep the net present value ofthe 35-year strategy closer to that of the 30-year strategy than in the previouscomparison. However, NPV still favors the 35-year case (by $1.8 billion) be-cause of the heavy discounting applied to the late construction and overhauldeficit.
SENSITIVITY TO PRODUCTION RATE AND FLEET SIZE
In the following paragraphs, we show what happens to the relations amonggap-length and ship-life strategies when we change production rate and fleetsize. Results are summarized in the form of graphs analogous to Figure 7.6—cumulative, discounted cost relative to the 30-year minimum-gap strategy. Forthe 40- and 50-ship strategies, the full sets of graphs analogous to those pre-sented above are given in Appendix H.
Sustaining a Fleet Size of 40 Ships at Three Ships Produced per Year
Raising the maximum production rate from two to three ships per year does notresult in dramatic differences in total costs or in the cost relations among thegap-length and ship-life strategies (compare the end points in Figure 7.6 withthose in Figure 7.13). This set of curves does vary from the earlier one in thecourse of expenditures over time. However, the pairwise comparisons followthe same general pattern: early construction-derived savings for the maximumgap or 35-year case, followed by loss of some of that advantage (in discountedterms) when high-rate construction begins under the postponed-productionstrategy. (As has been pointed out, the minimum-vs.-maximum, 30-year-lifecomparison at two per year is unusual because the maximum gap in that case isnot really a postponed-production strategy.)

100 The U.S. Submarine Production Base
1995 20302000 2005 2015 20201990 2025
RANDMR456-7.13
Bill
ions
of d
olla
rs (
NP
V)
1
–3
–5
–1
–2
–4
2010
0
Min. gap,30-yr life
Max. gap,30-yr life
Min. gap, 35-yr life
Max. gap,35-yr life
Figure 7.13—Cumulative Cost of 40-Ship, Three-per-Year Strategies, Relative toCumulative Cost for Min.-Gap, 30-Year-Life Strategy, Discounted
Sustaining a Fleet Size of 50 Ships at Three Ships Produced per Year14
The total cost of sustaining a 50-ship fleet is, of course, more than that of sus-taining a 40-ship fleet. However, the relations among the strategies are similarin the two cases (compare Figure 7.14 to Figure 7.13). Again, the costs of thestrategies are all within a few billion dollars of each other, and changing maxi-mum ship life has a bigger effect than changing the length of the productiongap.
The biggest difference from the 40-ship case is that the maximum-gap strate-gies are no longer at parity or at an advantage with respect to the minimumgaps. The differences are not large, but they are consistent. For the larger fleetsize, the maximum gap strategy with life extension is about a billion-and-a-halfdollars worse off with respect to the corresponding minimum-gap strategy. Itgoes from having a small advantage for 40 ships to a small disadvantage for 50.For the 30-year case, the maximum-gap strategy is about $700 million worse off.Larger costs are run up relative to the minimum gap because production can-
______________14This chapter does not address the strategies to sustain a fleet size of 50 ships at a maximum rate oftwo per year. It is not possible to sustain such a fleet at such a rate with a maximum ship life of 30years, so there is no baseline for comparison analogous to that in the other strategies discussed.

Comparing the Cost of Alternative Strategies 101
1995 20302000 2005 2015 20201990 2025
RANDMR456-7.14
Bill
ions
of d
olla
rs (
NP
V)
1
–3
–5
–1
–2
–4
2010
0Min. gap, 30-yr life
Max. gap, 30-yr life
Min. gap, 35-yr life
Max. gap,35-yr life
Figure 7.14—Cumulative Cost of 50-Ship, Three-per-Year Strategies, Relative toCumulative Cost for Min.-Gap, 30-Year-Life Strategy, Discounted
not be put off as long when a 50-ship fleet must be replaced as it can when only40 need be built.
Sustaining a Fleet of 30 Ships at Two Ships Produced per Year
As discussed in Chapter Six, a fleet size of 30 is below the level DoD regards assufficient to meet U.S. security needs. However, since fleets of 30 or fewer maybe proposed by some in debates over submarine funding, we compare mini-mum- and maximum-gap strategies for sustaining such a fleet, current servicelife assumed (see Figure 7.15).
Relative to the analogous comparison at 40 ships, two per year, the maximum-gap strategy saves more money with the smaller fleet size because productioncan be postponed longer (delivery need not be taken until 2010). The $2-billionshort-term savings is at least as great as that for any other min.-max. compari-son we analyzed for a 30-year service life. And, in contrast to the other compar-isons, a modest savings—in excess of one and a half billion dollars—holds upover the long term.
Other analyses we conducted of fleet sizes below 40 exhibited a trend towardgreater maximum-gap savings with smaller fleets. Savings from postponing

102 The U.S. Submarine Production Base
1995 20302000 2005 2015 20201990 2025
RANDMR456-7.15
Bill
ions
of d
olla
rs (
NP
V)
1
–3
–5
–1
–2
–4
2010
0Min. gap, 30-yr life
Max. gap, 30-yr life
Figure 7.15—Cumulative Cost of Max. Gap Relative to Min. Gap for 30-Ship, Two-per-Year, 30-Year-Life Strategies, Discounted
production outweigh the greater reconstitution costs that postponement re-quires. However, as the ratio of fleet size to production rate drops, the risk offuture production discontinuities increases (see the discussion at the end ofChapter Six). And the longer restart is postponed, the greater the unquantifi-able program risk—a topic to which we now turn.

103
Chapter Eight
RISK
In Chapters Six and Seven, we quantified the cost and schedule effects of fleetreplacement strategies involving production gaps of varying lengths. A princi-pal conclusion of this analysis was that the net savings from an extended gapare small; in most comparisons of alternative strategies, they are so small that,given the uncertainty of our estimates, we cannot be sure they exist. When costdifferences are small or uncertain, less quantifiable factors may play a particu-larly important role in decisionmaking. In planning submarine production, thekey unquantifiable factors fall under the heading of “risk.”
We discussed risk in Chapter Four in connection with nuclear-componentsuppliers, but we bring it up again here to emphasize its importance in theoverall analysis and to address the topic somewhat more broadly.Uncertainties in the analysis are listed in Table 8.1, along with the manner inwhich they were treated in the quantitative analysis. More generally, extendingthe current gap in submarine production entails three kinds of risk:
• The risk that it will not be possible to reestablish the production program ataffordable cost or on a satisfactory schedule.
• The risk that, during or after reconstitution, an accident will occur becauseof degraded construction quality.
• The risk that program benefits will be constrained or costs increased overthe long term.
PROGRAM RISK
Taken by themselves, the cost and schedule estimates in the preceding chaptersdo not present a full picture of the costs and delays involved in extending theproduction gap. We made some allowance for the possibility of underestimatesin our assessment of cost and time to reconstitute the nuclear vendor base, but
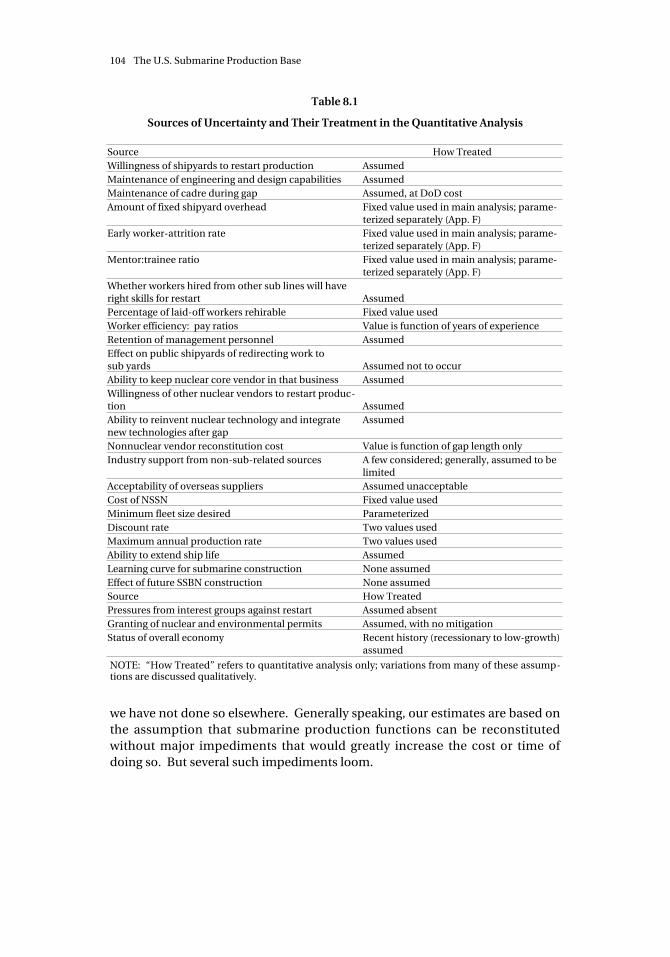
104 The U.S. Submarine Production Base
Table 8.1
Sources of Uncertainty and Their Treatment in the Quantitative Analysis
Source How TreatedWillingness of shipyards to restart production AssumedMaintenance of engineering and design capabilities AssumedMaintenance of cadre during gap Assumed, at DoD costAmount of fixed shipyard overhead Fixed value used in main analysis; parame-
terized separately (App. F)Early worker-attrition rate Fixed value used in main analysis; parame-
terized separately (App. F)Mentor:trainee ratio Fixed value used in main analysis; parame-
terized separately (App. F)Whether workers hired from other sub lines will haveright skills for restart AssumedPercentage of laid-off workers rehirable Fixed value usedWorker efficiency: pay ratios Value is function of years of experienceRetention of management personnel AssumedEffect on public shipyards of redirecting work tosub yards Assumed not to occurAbility to keep nuclear core vendor in that business AssumedWillingness of other nuclear vendors to restart produc-tion AssumedAbility to reinvent nuclear technology and integratenew technologies after gap
Assumed
Nonnuclear vendor reconstitution cost Value is function of gap length onlyIndustry support from non-sub-related sources A few considered; generally, assumed to be
limitedAcceptability of overseas suppliers Assumed unacceptableCost of NSSN Fixed value usedMinimum fleet size desired ParameterizedDiscount rate Two values usedMaximum annual production rate Two values usedAbility to extend ship life AssumedLearning curve for submarine construction None assumedEffect of future SSBN construction None assumedSource How TreatedPressures from interest groups against restart Assumed absentGranting of nuclear and environmental permits Assumed, with no mitigationStatus of overall economy Recent history (recessionary to low-growth)
assumed
NOTE: “How Treated” refers to quantitative analysis only; variations from many of these assump-tions are discussed qualitatively.
we have not done so elsewhere. Generally speaking, our estimates are based onthe assumption that submarine production functions can be reconstitutedwithout major impediments that would greatly increase the cost or time ofdoing so. But several such impediments loom.

Risk 105
We have allowed considerable cost and time to reconstitute technical and tradeskills at the shipyards—up to $2 billion and 17 years to return to current capa-bilities. Even so, these may be underestimates. For example, our estimates arebased on the optimistic assumption that the shipyards will be able to rehire90 percent of workers laid off during the year preceding restart. But workersmay leave the area or become disaffected in ways that reduce their propensityto work for the shipyard or compromise their effectiveness if they do so.
It may be difficult to sustain a large enough cadre of workers once the con-struction of current submarines ends. If the restart date is unknown or morepromising prospects come along, workers may depart. It is critical that theseworkers be retained to serve as mentors at restart. While detailed drawings andspecifications are prepared for each of a submarine’s components and systems,we should recognize the contribution of experience. Many actions in subma-rine construction demand a particular experienced individual who is the onlyperson in the yard or factory who can execute that process correctly or teachsomeone else how to do it. It may seem strange to some that the successfulproduction of such a technologically advanced system could depend in part ona sort of “black art” or folklore, but that is indeed the case. There are many ar-eas where the essence of production cannot be captured by a drawing, specifi-cation, book, or videotape. There is significant risk that, after a gap in produc-tion, the United States could not build another submarine to the same level ofperformance for some time—until a new base of experienced designers, tech-nicians, and workers could be grown.
We have estimated the costs of rehiring management and support workers as apercentage of those for production workers. However, we have not assessed thespecific contributions of management to an efficient production process. Weestimated how production workforce drawdowns to various levels would influ-ence reconstitution cost and schedule, but we did not do the same for man-agement drawdowns. It is likely that released management personnel will beable to sell their talents to other industries elsewhere in the country and veryunlikely that such people could be lured back.
Besides losing workers in an extended gap, the submarine industrial base willprobably also lose firms—suppliers of various components used in submarineproduction. Companies “stung” once by a hiatus in submarine constructionmay be unwilling to invest in future construction. Future submarine construc-tion may appear to be tenuous compared to the buildup in the 1960s.Companies may not care to accept the risk of reentering the submarine con-struction business, fearful that the U.S. government might again invoke anothergap in production at some later time. Some companies may successfully makethe conversion to civilian products and may not elect to re-convert to militaryapplications.

106 The U.S. Submarine Production Base
We have only cursorily examined the effects of an extended gap on design anddevelopment expertise (Appendix A). Without some measure such as prototyp-ing to fill the gap, it may be necessary to lay off experienced design engineers.Those who would otherwise have represented the next generation of recruitsmay seek more promising opportunities in the civilian sector. If both experi-enced designers and recruits are in short supply, there will be fewer opportuni-ties to pass on the lessons learned in designing previous classes (some “blackart” is involved here, too). Clearly, a deterioration in design expertise wouldaffect the time required to reconstitute production, but the size of that effect isunknown.
While design capability may erode as the gap lengthens, the challenge to de-signers increases as technology progresses farther beyond the state of the artrepresented by the Seawolf class. Whereas the next submarine class need notmeet, let alone exceed, some Seawolf performance criteria, it would be desir-able to take advantage of those advances that are applicable to submarine op-erations in the reduced-threat environment. No one will want to ignoretechnological improvements that could afford U.S. submarine crews a moresecure, efficient operating environment. Enhancements to the design processfor the NSSN are intended to reduce technological risk. Some challenges willremain, however, not only for designers but for the production workforce. Ourestimates of reconstitution delays based on workforce buildup do not take intoaccount the possibility of extra time needed for testing or reworking improvedsystems.
Finally, restart could be delayed indefinitely by the need to satisfy regulatoryrequirements. Submarine construction yards and many component supplierswork with hazardous materials or processes that require licenses or permitsfrom state or federal organizations (such as the Environmental ProtectionAgency, Department of Energy, and Nuclear Regulatory Commission). In manycases, the contractor’s activities are “grandfathered” under previous regulationsbecause of their continuing activity in that process, even though current regu-lations may be more strict. Contractors have legitimate concerns that theirpermits will lapse if they suspend activity. Regaining the permit or license mayprove to be expensive and difficult, if not impossible, in a society in which envi-ronmental concerns, and nuclear ones in particular, often dominate. The regu-latory process will provide a “foot in the door” to any who may wish to delay in-definitely or terminate the nation’s nuclear submarine program.
Clearly, there may be many hurdles to clear in restarting submarine production.We cannot characterize well the costs and delays involved because no one hasyet attempted to restart a dormant industry that produces technologically ad-

Risk 107
vanced products. As pointed out in Chapter Four, the few crude available ana-logues to restarting submarine production suggest that it may be as difficultand costly to rebuild some capabilities as it was to build the current ones.
The extent of rebuilding required, however, depends on the length of the pro-duction gap. The gap has already been long enough to threaten the survival ofsome nonnuclear vendors even if it lasts only until the scheduled SSN-23 startin 1996. Other ill effects may not be realized unless restart is delayed into thenext decade. Thus, in attempting to balance qualitative program risks againstquantitative savings, greater weight should be ascribed to the former as gaplength increases.
ACCIDENT RISK
We discussed the risk of accident in some detail in Chapter Four. Suffice it tosay here that many of the factors mentioned above as contributing to programrisk also increase the possibility of an accident resulting in severe damage to orloss of a ship during construction or operations. In addition to the immediatephysical consequences, such an accident, particularly a nuclear one, wouldgreatly raise the odds against successfully reestablishing the submarine con-struction program. Obviously, the Navy cannot rely on a “learning curve” ortrial and error in nuclear-submarine safety.
LONG-TERM RISK
A lengthy production gap will have negative consequences many years after it isover. The longer the gap, the greater the risk that fleet sizes will not meet na-tional security needs and the greater the risk that another production gap willeventually result. Even if a submarine production program can be successfullyreestablished after a lengthy gap, acquisition planners will face an unpalatablechoice between low sustainable fleet sizes and high production rates. Or theremay be no choice—both may be necessary.
As shown in Chapter Six, even with a minimum-gap strategy the fleet size willdrop almost to 40 around 2025 if the production rate is held to two per year andsubmarines are retired at 30 years of age. That minimum fleet size will drop ifthe gap lengthens. If global tensions continue to abate, that may not be seen asa major problem. But events of recent years have demonstrated the unpre-dictability of the geostrategic environment. Developments in Russia, China, orelsewhere may lead U.S. defense planners to conclude that the nation would be

108 The U.S. Submarine Production Base
safer with 50 attack submarines. That number cannot be achieved after a longgap unless at least three ships can be built per year.1
Building three ships per year creates its own long-term problems. It will sustaina fleet size of 90 at steady-state and current submarine life spans. If fewer than90 ships are desired, steady-state cannot be achieved; the production rate mustdrop at some point. As shown in Chapter Six, a possible result is the rate will goto zero and another production gap will result, with all the risks describedabove. The risk of another gap can be lowered by initiating submarine produc-tion soon and building at a deliberate pace, instead of waiting a long time toundertake a crash program.
______________1And, of course, it would take years to deliver the first submarines following production restart.Failure to hedge against future threats is another problem with the 20-ship minimum fleet sizementioned in Chapter Six. In that case, it could be cost-effective to wait 15 years or more betweenthe start of the second Seawolf and the NSSN, but the ability to ramp up production quickly wouldbe lost. Furthermore, the number of submarines available to counter a serious threat would bemuch smaller than the 40 taken as a minimum in this analysis.

193
Appendix H
COMPARING COSTS: ADDITIONAL CASES
Chapter Seven examines cost estimates for alternative production gap and ship-life strategies intended to maintain a fleet of 40 submarines at a maximum pro-duction rate of two ships per year. In Appendix H, we present analogous graphs(with some commentary) for strategies that could maintain fleet sizes of 40 or50 ships at maximum production rates of three per year. As in Chapter Seven,we show cumulative costs to 2030, discounted and undiscounted, in absoluteterms and relative to the minimum-gap, 30-year-life case, and bar charts thatbreak down the undiscounted-relative-cost charts into categories (construc-tion, refueling, reconstitution, and overhauls).
SUSTAINING A FLEET SIZE OF 40 SHIPS AT THREE PRODUCEDPER YEAR
Figures H.1 through H.4 show the cumulative costs of sustaining the submarinefleet (688s, Seawolves, and NSSNs) from 1994 through 2030. The costs depictedin these figures follow the general pattern in the analogous two-per-year graphs(Figures 7.2, 7.4, 7.6, and 7.7), with the exception of the 30-year-ship-life, maxi-mum-gap strategy. At two ships per year, the latter differs little from the corre-sponding minimum-gap case, because at such a low production rate, a gapcannot be long if the force is not to drop below 40 ships. If it is possible to buildthree ships per year after restart, a longer gap can be opened up. Thus, in thecurrent comparisons, the 30-year-life, maximum-gap case shows a cost patternclose to the other strategies (maximum gap or 35-year life) entailing postponedproduction. That is, savings accrue from a construction rate that is initially be-low that in the baseline case. When high-rate construction begins under thepostponed-production strategies, some or all of that advantage is lost (less indiscounted terms than in undiscounted terms).
The general lesson is the same as for the two-per-year case. Extended gaps inproduction do not result in large savings. For the current 30-year-life, there isessentially no difference between the minimum and maximum gaps over the
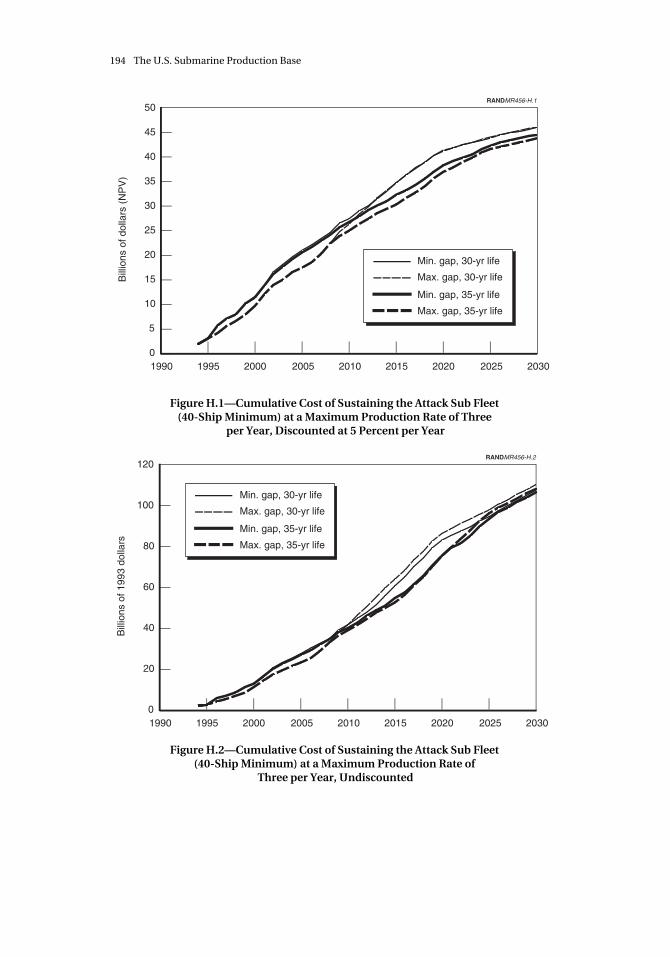
194 The U.S. Submarine Production Base
1995 20302000 2005 2015 20201990 2025
RANDMR456-H.1
Bill
ions
of d
olla
rs (
NP
V)
50
40
35
10
0
25
20
30
45
15
5
2010
Min. gap, 30-yr life
Max. gap, 30-yr life
Min. gap, 35-yr life
Max. gap, 35-yr life
Figure H.1—Cumulative Cost of Sustaining the Attack Sub Fleet(40-Ship Minimum) at a Maximum Production Rate of Three
per Year, Discounted at 5 Percent per Year
1995 20302000 2005 2015 20201990 2025
RANDMR456-H.2
Bill
ions
of 1
993
dolla
rs
120
40
0
80
60
20
2010
100Min. gap, 30-yr life
Max. gap, 30-yr life
Min. gap, 35-yr life
Max. gap, 35-yr life
Figure H.2—Cumulative Cost of Sustaining the Attack Sub Fleet(40-Ship Minimum) at a Maximum Production Rate of
Three per Year, Undiscounted

Comparing Costs: Additional Cases 195
1995 20302000 2005 2015 20201990 2025
RANDMR456-H.3
Bill
ions
of d
olla
rs (
NP
V)
1
–3
–5
–1
–2
–4
2010
0
Min. gap,30-yr life
Max. gap,30-yr life
Min. gap, 35-yr life
Max. gap,35-yr life
Figure H.3—Cumulative Cost of 40-Ship, Three-per-Year Strategies, Relative toCumulative Cost for Min.-Gap, 30-Year-Life Strategy, Discounted
1995 20302000 2005 2015 20201990 2025
RANDMR456-H.4
Bill
ions
of 1
993
dolla
rs
4
–6
–10
–2
–4
–8
2010
2
Min. gap, 30-yr life
Max. gap,30-yr life
Min. gap, 35-yr life
Max. gap,35-yr life
0
Figure H.4—Cumulative Cost of 40-Ship, Three-per-Year Strategies, Relative toCumulative Cost for Min.-Gap, 30-Year-Life Strategy, Undiscounted

196 The U.S. Submarine Production Base
long term; with life extension, the longer gap saves roughly a billion dollars. Forequivalent gapping strategies, life extension saves on the order of $2 billion.
Figures H.5 through H.8 are the analogues of Figures 7.8, 7.10, 7.11, and 7.12 forthe two-per-year case and are useful in examining the sources of the cost differ-ences. The sharpest differences between the two- and three-per-year cases arein the two pairs of graphs (first and last) involving the 30-year, minimum gapstrategies. The anomalous nature of that strategy for the two-per-year case hasalready been noted. However, some differences are apparent in all compar-isons because the ability to build three ships per year permits greater post-ponement of production in the maximum-gap and 35-year strategies, resultingin wider swings in costs.
SUSTAINING A FLEET SIZE OF 50 SHIPS AT THREE PRODUCEDPER YEAR
Costs of the 50-ship, three-per-year strategies are compared in Figures H.9through H.12. To repeat here for the reader’s convenience the points made inChapter Seven, the total cost of sustaining a 50-ship fleet is, of course, morethan that of sustaining a 40-ship fleet. However, the relations among thestrategies are similar in the two cases (compare Figure H.9, for example, with
RANDMR456-H.52000
1000
500
0
–500
–1000
–1500
–2000
Mill
ions
of 1
993
dolla
rs
1995 2000 2005 2010 2015 2020 2025 2030
Extra cost for maximum gap
Extra cost for minimum gap
Reconstitution
Refueling
Overhaul
Construction
�
–2500
1500
������� ������
��
��
Figure H.5—Annual Cost Difference, Min. vs. Max. Gap, Max. Ship Life 30 Years, FleetSize 40, Max. Rate Three per Year

Comparing Costs: Additional Cases 197
RANDMR456-H.62000
1000
500
0
–500
–1000
–1500
Mill
ions
of 1
993
dolla
rs
1995 2000 2005 2010 2015 2020 2025 2030
Extra cost for maximum gap
Extra cost for minimum gap
Reconstitution
Refueling
Overhaul
Construction
�
–2000
1500
��������
��������
��
Figure H.6—Annual Cost Difference, Min. vs. Max. Gap, Max. Ship Life 35 Years, Min.Fleet Size 40, Max. Production Rate Three per Year
RANDMR456-H.72000
1000
500
0
–500
–1000
–1500
Mill
ions
of 1
993
dolla
rs
1995 2000 2005 2010 2015 2020 2025 2030
Extra cost for 35-yearstrategy
Extra cost for 30-yearstrategy
Refueling
Overhaul
Construction
�–2000
1500
–2500
�� ���
������
��
��
Figure H.7—Annual Cost Difference, 30-Year Max. Ship Life vs. 35 Years, Min. Gap,Min. Fleet Size 40, Max. Production Rate Three per Year

198 The U.S. Submarine Production Base
����
��
��
RANDMR456-H.82500
1000
500
0
–500
–1000
–1500
Mill
ions
of 1
993
dolla
rs
1995 2000 2005 2010 2015 2020 2025 2030
Extra cost for 35-yearstrategy
Extra cost for 30-yearstrategy
Refueling
Overhaul
Construction
�
–2000
1500
2000
Figure H.8—Annual Cost Difference, 30-Year Life vs. 35 Years, Max. Gap, Min. FleetSize 40, Max. Production Rate Three per Year
1995 20302000 2005 2015 20201990 2025
RANDMR456-H.9
Bill
ions
of d
olla
rs (
NP
V)
60
20
0
40
30
10
2010
50
Min. gap, 30-yr life
Max. gap, 30-yr life
Min. gap, 35-yr life
Max. gap, 35-yr life
Figure H.9—Cumulative Cost of Sustaining the Attack Submarine Fleet(50-Ship Minimum) at a Maximum Production Rate of Three per Year,
Discounted at 5 Percent per Year

Comparing Costs: Additional Cases 199
1995 20302000 2005 2015 20201990 2025
RANDMR456-H.3
Bill
ions
of 1
993
dolla
rs
140
40
0
80
60
20
2010
100
120 Min. gap, 30-yr life
Max. gap, 30-yr life
Min. gap, 35-yr life
Max. gap, 35-yr life
Figure H.10—Cumulative Cost of Sustaining the Attack Submarine Fleet (50-ShipMinimum) at a Maximum Production Rate of Three per Year, Undiscounted
1995 20302000 2005 2015 20201990 2025
RANDMR456-H.11
Bill
ions
of d
olla
rs (
NP
V)
1
–3
–5
–1
–2
–4
2010
0Min. gap, 30-yr life
Max. gap, 30-yr life
Min. gap, 35-yr life
Max. gap,35-yr life
Figure H.11—Cumulative Cost of 50-Ship, Three-per-Year Strategies, Relative toCumulative Cost for Minimum-Gap, 30-Year-Life Strategy, Discounted

200 The U.S. Submarine Production Base
1995 20302000 2005 2015 20201990 2025
RANDMR456-H.12
Bill
ions
of 1
993
dolla
rs2
–4
–8
–2
–6
2010
0Min. gap, 30-yr life
Max. gap, 30-yr life
Min. gap, 35-yr life
Max. gap,35-yr life
–10
–12
–14
4
Figure H.12—Cumulative Cost of 50-Ship, Three-per-Year Strategies, Relative toCumulative Cost for Minimum-Gap, 30-Year-Life Strategy, Undiscounted
Figure H.1). Again, the costs of the strategies are all within a few billion dollarsof each other, and changing maximum ship life has a bigger effect than chang-ing the length of the production gap.
The biggest difference from the 40-ship case is that the maximum-gap strate-gies are no longer at parity or at an advantage with respect to the minimumgaps. The differences are not large, but they are consistent. For the larger fleetsize, the maximum gap strategy with life extension is about a billion-and-a-halfdollars worse off with respect to the corresponding minimum-gap strategy. Thesmall advantage for 40 ships becomes a small disadvantage for 50. For the 30-year case, the maximum-gap strategy is about $700 million worse off. Largercosts are run up relative to the minimum gap because production cannot beput off as long when a 50-ship fleet must be replaced as it can when only 40need be built.
Because production gaps do not have the effects on schedule when a 50-shipfleet must be sustained that they do when only 40 ships are needed, the min.-max. comparisons differ greatly between the two cases (compare Figure H.13with Figure H.5 and Figure H.14 with Figure H.6). The inability to concentrateproduction in the maximum-gap strategy is clearly visible in Figures H.13 andH.14. This does not, however, apply to the 30-vs.-35-year comparisons. At 50

Comparing Costs: Additional Cases 201
RANDMR456-H.132500
1000
500
0
–500
–1000
–1500
Mill
ions
of 1
993
dolla
rs
1995 2000 2005 2010 2015 2020 2025 2030
Extra cost formaximum gap
Extra cost for minimum gap
Reconstitution
Refueling
Overhaul
Construction��
–2000
1500
2000
��
�
Figure H.13—Annual Cost Difference, Minimum vs. Maximum Gap, Max. Ship Life 30Years, Min. Fleet Size 50, Max. Production Rate Three per Year
RANDMR456-H.142500
1000
500
0
–500
–1000
–1500
Mill
ions
of 1
993
dolla
rs
1995 2000 2005 2010 2015 2020 2025 2030
Extra cost formaximum gap
Extra cost for minimum gap
Reconstitution
Refueling
Overhaul
Construction��
–2000
1500
2000
–2500
�����
Figure H.14—Annual Cost Difference, Minimum vs. Maximum Gap, Max. Ship Life 35Years, Min. Fleet Size 50, Max. Production Rate Three per Year
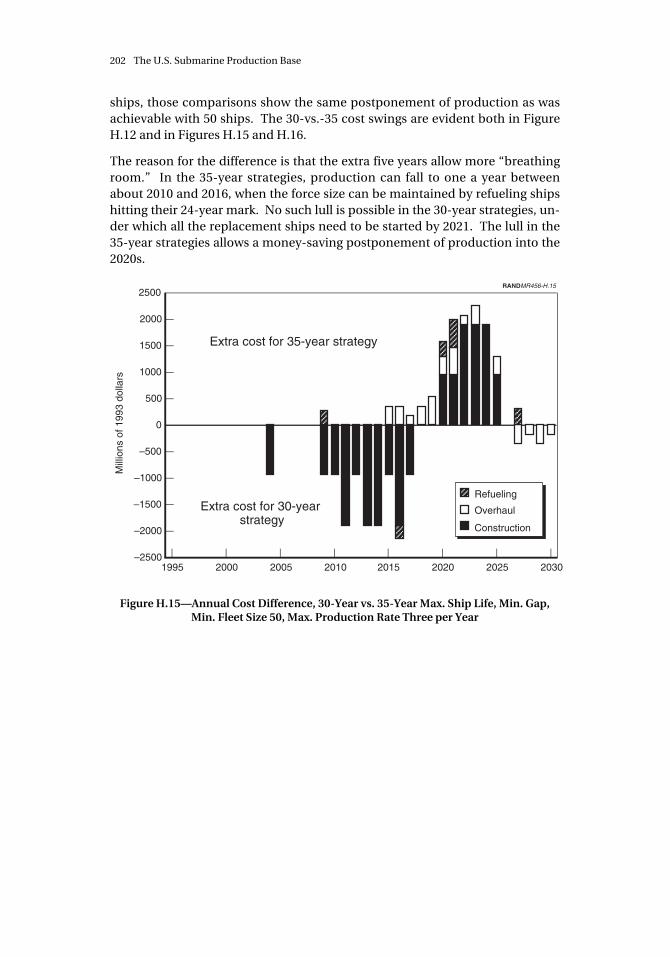
202 The U.S. Submarine Production Base
ships, those comparisons show the same postponement of production as wasachievable with 50 ships. The 30-vs.-35 cost swings are evident both in FigureH.12 and in Figures H.15 and H.16.
The reason for the difference is that the extra five years allow more “breathingroom.” In the 35-year strategies, production can fall to one a year betweenabout 2010 and 2016, when the force size can be maintained by refueling shipshitting their 24-year mark. No such lull is possible in the 30-year strategies, un-der which all the replacement ships need to be started by 2021. The lull in the35-year strategies allows a money-saving postponement of production into the2020s.
RANDMR456-H.152500
1000
500
0
–500
–1000
–1500
Mill
ions
of 1
993
dolla
rs
1995 2000 2005 2010 2015 2020 2025 2030
Extra cost for 35-year strategy
Extra cost for 30-year strategy
Refueling
Overhaul
Construction
�–2000
1500
2000
–2500
��
����
���
����
Figure H.15—Annual Cost Difference, 30-Year vs. 35-Year Max. Ship Life, Min. Gap,Min. Fleet Size 50, Max. Production Rate Three per Year

Comparing Costs: Additional Cases 203
RANDMR456-H.162500
1000
500
0
–500
–1000
–1500
Mill
ions
of 1
993
dolla
rs
1995 2000 2005 2010 2015 2020 2025 2030
Extra cost for 35-year strategy
Extra cost for 30-year strategy
Refueling
Overhaul
Construction
�–2000
1500
2000
–2500
��
��
����
���
����
Figure H.16—Annual Cost Difference, 30-Year vs. 35-Year Max. Ship Life,Max. Gap, Min. Fleet Size 50, Max. Production Rate Three per Year


113
Chapter Nine
CONCLUSIONS AND RECOMMENDATIONS
Our principal conclusions fall into three categories: those relating to the practi-cality of an extended production gap for attack submarines and those relatingto the cost-effectiveness and the risks of such a gap. As these already emergefrom the analyses of the preceding sections and in the appendixes, we simplyrestate them here to keep discussion to a minimum. For a more fully arguedprécis of the study, see the “Summary.”
ON THE PRACTICALITY OF AN EXTENDED GAP
• Production schedule options are limited. Construction of the first subma-rine of the next class (termed the “New Attack Submarine,” or NSSN) prob-ably cannot be started before 1998. (A third submarine of the Seawolf classmay be built in the interim.) But construction of the first NSSN must startby about 2001 if a fleet of submarines close to that now planned is to besustained at reasonable production rates. The difference between theshortest gap now feasible and the longest practical is thus only three years.
• The longer the gap, the more difficult it will be to sustain a fleet adequatelysized to the nation’s security needs and the greater the risk that the concen-trated production program then required will lead to another gap. If thenext submarine is not started until after 1999 and ships are still retired atthe age of 30, it will not be possible to sustain a fleet size of 50; a productionrate of three per year would be required to keep the fleet from falling below40 ships.
• If the more recently built Los Angeles-class submarines (the last 31) couldbe operated until age 35, greater flexibility in production scheduling couldbe realized. It would be possible to sustain a greater fleet size at the sameproduction rate or the same fleet size at a lower production rate than wouldbe the case with the current decommissioning age.

114 The U.S. Submarine Production Base
ON THE COST-EFFECTIVENESS OF AN EXTENDED GAP
• It is not clear that an extended production gap would result in any savingsover the long term. For some combinations of desired fleet size and maxi-mum production rate, savings may be realized by extending the gap; forothers, losses may result. In all cases, the projected gains or losses aresmaller than the errors that may accompany our prediction methods overthat time frame, so they cannot be asserted with any confidence. However,it appears that, for some combinations of fleet size and production rate,substantial gains will accrue over the short term if the gap is extended.
• Extending ship life to 35 years would probably result in modest savings indiscounted terms (perhaps on the order of $2 billion) over the next severaldecades, regardless of the fleet size or production rate. However, we do notin this estimate account for any costs of determining the feasibility of shiplife extension or any costs necessary to effect such extensions beyond thoseof a standard overhaul.
ON THE RISKS OF AN EXTENDED GAP
• In extending the production gap, DoD would run several risks that couldadd to the delays and costs we have been able to estimate. The industrialbase may lose the expertise of individuals and the capabilities of firms thatare essential for efficient reconstitution following a gap. It may be difficultfor those design and production workers who do remain to integrate all thetechnologies that become available in the interim into high-performancesubmarines. And environmental and nuclear regulatory impedimentscould add years to the time required to reconstitute.
• There can be little tolerance for trial and error in nuclear-submarine designand construction. Losses of individual and institutional expertise couldraise the risk of system malfunction and of an accident, possibly a nuclearone that would entail grave consequences.
RECOMMENDATIONS
• Considering that the savings from extending the current production gap areuncertain and that the risks of doing so are great, we recommend that con-struction on the next submarines begin as soon as practicable.
• Specifically, we recommend, first, that the third Seawolf-class submarine(SSN-23) be started around 1996 and that the first submarine of the nextclass be started as soon as feasible, around 1998.

Conclusions and Recommendations 115
• Finally, considering that savings may be realized by extending the life spanof many of the current class of submarines, we recommend that the Navycarefully evaluate this option.
Our recommendations are based on our own judgment regarding prudentweights to be attached to the results of our quantitative cost and scheduleanalysis and our qualitative risk assessment. Others using the samemethodology would arrive at a different course of action if they took either (orboth) of two alternative viewpoints. First, in reaching a restart decision, theymight regard the risks as much less important. This would be more defensibleover the short run (e.g., in deciding not to proceed with SSN-23) than over thelong run (e.g., in postponing NSSN restart into the next decade). Second, theymight attach much greater weight to the short-term savings of the maximum-gap strategies. The latter approach might be taken by someone who had littleor no confidence in cost projections running 20 or 30 years into the future andwho thus heavily discounted future costs.


113
Appendix A
DESIGN CONSIDERATIONS
Although the principal topic of this report is submarine production, we recog-nize that without design, there would be no production. Like those needed forproduction, the special skills, tools, and experience required for submarine de-sign face a risk of deterioration during a protracted gap. In Appendix A, webriefly describe the evolution of submarine design over the years, the currentphases of design, and the critical skills needed to sustain design capability andwhat is required to retain them.
For convenience, we often use the term design to encompass engineering. Tobe precise, design is the creative activity encompassing naval architecture andall aspects of marine engineering necessary to produce a new concept or designor a major modification to an old one. Engineering is the application of engi-neering tools and principles to solve specific problems for the designer and tosupport the translation of the design to production.
HISTORICAL PERSPECTIVE
The design process has evolved in parallel with the progression of more andmore complex submarines, as well as with the changing political and economicenvironment that has controlled the acquisition of major weapon systems.Prior to the mid-1960s, it would typically take five or six years to design andbuild the first ship of a class. Subsequently, more extensive reviews for cost andmilitary effectiveness were required and a more thorough definition of thesubmarine was necessary before issuing a request for proposals. Earlier in-volvement of the prospective shipbuilders also contributed to a significant in-crease in the level of effort and time required to complete the design. Finally, ofcourse, the performance requirements for successive classes of submarineshave usually been higher, so weapons and other systems have grown morecomplex. All these factors contributed to progressively increasing submarineclass design times. The Los Angeles (the first ship of its class) took roughly 12years to design and build; the Ohio, also about 12; and the Seawolf, 15 years.

114 The U.S. Submarine Production Base
The three-year difference between the last two SSN classes is particularly note-worthy. Specific factors contributing to that increase were as follows:
• The 688 was designed to maximize speed, whereas the Seawolf designerswere to maximize performance in all areas.
• Seawolf construction was designed to take advantage of the new modularapproach to submarine building, whereas the 688s were originally designedfor conventional construction techniques.
• The 688s utilized proven technologies, whereas the Seawolf design had toallow for the use of advanced technologies under development concur-rently with the submarine.
DESIGN PHASES
The design process for submarines, like that for other complex warships, con-sists of four phases.
Concept Design
First, design concepts are explored against the backdrop of a continuing evalu-ation of future missions, future threats, and future technologies. The dialoguesbetween the designer and the technologist are crucial in this stage. Systemsdesigners with a broad view of technology, current and future operationalplanning, and operational experience with current designs are necessary toprovide leadership. As concepts are explored and defined, tradeoffs are madeamong military effectiveness, affordability, and producibility. The output of theconcept design phase is the definition of a preferred design concept in a set of“single sheet” characteristics that stipulate submarine missions, principal oper-ating and performance characteristics and dimensions, military payload, anddesign affordability and producibility goals. The cost of construction is also es-timated.
Preliminary Design
Next, the preferred concept is matured. Subsystem configurations and alterna-tives are examined, and structures, hydrodynamics, silencing, and combat sys-tem performance and arrangements are analyzed and tested. The output ofpreliminary design is a set of top-level requirements explicitly describing therefinements achieved during this phase. Performance characteristics and shipdimensions are spelled out in more detail than in the “single sheet” character-istics, and the cost estimate is refined.

Design Considerations 115
Contract Design
The top-level requirements are now transferred into contracts for the detail de-sign and construction of the submarine. All systems must be defined, analysisand testing completed, and the contract drawings for submarine constructionprepared. This enables a Request for Proposal (RFP) to be issued so that ship-builders can respond with proposals that form the basis for the negotiation ofthe price, terms, and conditions in the final contract.
Detail Design
Normally, the shipbuilder turns the contract drawings and ship specificationsinto the documents necessary to construct, outfit, and test the ship. Typicalproducts would consist of working drawings, work orders, test memoranda,shipyard procedures, erection sequences, and the like. This phase of design ex-tends into the construction period.
Further Evolution of the Process
For the new attack submarine (NSSN), greater emphasis will be placed onminimizing program cost and risk. Cost estimating must be based on detailedsystem inputs, requiring a far greater degree of definition earlier in the process.Contract design will concentrate on detailed system definition. Technologymust be assessed carefully, with emphasis on minimizing cost and risk.
CRITICAL SKILLS AND PRODUCTION RESTART
There would be obvious advantages in embarking on a refined design processwith an experienced team. Even more important are the skills built over theyears, skills that must overcome challenges not faced in the design of otherships, such as operating in three dimensions, submerging and surfacing, andintegrating systems to meet strict weight and volume limitations. These skillsare listed in Table A.1.
Though not listed in the table, some of the most important participants in thedesign process are those who must lead and oversee the effort. The responsibil-ity for total submarine design synthesis rests with a few individuals—somecivilian, some military. Without this talent, the other specialists will diligentlywork to carefully design and engineer systems and parts that when combinedare not likely to function well as a whole or to be easily producible.
If the submarine skill base is dispersed through a period of inactivity, reconsti-tution will be difficult and time-consuming. It may take several years to train

116 The U.S. Submarine Production Base
Table A.1
Critical Engineering and Design Skills
Submarine hydrodynamicistsSubmarine hydro-acousticiansSubmarine weight engineeringSubmarine weapon system engineers and designersSubmarine acoustics engineers and designersUnique piping system engineers and designersSubmarine naval architectsSubmarine propulsion engineers and designersSubmarine electrical system engineers and designersSubmarine combat systems engineers and designersSubmarine structural engineersUnderwater shock engineersMagnetic silencing engineersSubmarine construction and production engineersSubmarine controls engineers (ship control)
engineers and designers to be effective, and that assumes there are sufficientlyskilled personnel available to do the training. The leadership functions wouldrequire at least ten years to redevelop.
To avoid such an outcome, it would be necessary to keep 2000–3000 designersand engineers employed in the private sector and at the Naval Sea SystemsCommand. Ongoing submarine-related research and development (R&D)funding from the Navy and the Department of Energy (DOE) provides supportto Navy, contractor, and university technical communities, but lends little sus-tenance to the activities traditionally associated with new submarine design. Ifthe NSSN design effort does not continue unbroken, the number employed insubmarine design will drop below the necessary minimum unless mitigatingmeasures are taken.
One possible mitigating measure is to design and build a prototype. Such anaction would ensure that the design and engineering capability would last atleast through detail design and would afford designers an opportunity to incor-porate new technologies and producibility concepts. Indeed, DoD should seri-ously examine the possibility of periodic prototyping as a means of “tidingover” design and engineering talent in the gaps between increasingly infre-quent new ship classes.

117
Appendix B
SUPPLEMENTARY BACKGROUND INFORMATION
Appendix B supplements the background information in Chapter Two. Wecharacterize the world nuclear-powered fleet, including the status of nationalsubmarine fleets. We review submarine roles and missions past and presentand display the course of U.S. submarine construction funding over the years.
SUBMARINES IN THE WORLD NUCLEAR FLEET
Ships powered by nuclear propulsion systems have a relatively long history ex-tending over nearly 40 years from the launching and commissioning of thesubmarine USS Nautilus in 1954. Currently, there are about 350 nuclear-pow-ered ships and submarines. Except for eight icebreakers and a cargo ship be-longing to members of the Commonwealth of Independant States (CIS), all arenaval vessels. Over half belong to the former Soviet Union, and over a third tothe United States. Only the United States and the CIS operate nuclear-poweredsurface ships, and only the CIS operates civilian manned ones. The UnitedKingdom, France, and China have the remainder. Submarines make up over 90percent of the world’s nuclear-powered ships (see Figure B.1).
Forty-three nations operate submarines that range from battery-poweredmidgets through conventional diesel-electric submarines to behemoth nuclear-powered ballistic-missile-carrying submarines. Table B.1 summarizes thesubmarine fleets throughout the world.
Five countries have built and operated nuclear-powered submarines. GreatBritain, France, China, Russia, and the United States all operate both SSNs andSSBNs in their navies.
Russia has been the largest producer of submarines. Today it has the largestand most varied fleet, but has experienced a period of decline as a result of eco-nomic difficulties that have impacted operating and maintenance funds.Russia has also exported a large number of submarines to other nations, par-ticularly diesel-electric submarines of the Romeo, Foxtrot, and Kilo classes.

118 The U.S. Submarine Production Base
RANDMR456-B.1
����������
SSN
SSBN
Combat surface ships
Nonmilitary ships
30%
5% 3%
62%
Figure B.1—Nuclear-Powered Ships by Type
The list in Table B.1 includes long-time allies of the United States as well as po-tential global and regional threats that are likely to help define the nature andsize of the U.S. attack submarine fleet in the decade to come.
ROLES AND MISSIONS
Submarines have played a critical role in military operations for most of thiscentury. Since their introduction as a military weapon during World War I, thesubmarine’s importance in naval warfare has grown substantially. In their ini-tial decades, submarines were found primarily in anti-surface-warfare applica-tions. Their armament, consisting of torpedoes and deck guns, was brought tobear against merchant shipping and enemy warships. The German submarineforce during World War II nearly strangled the Allied supply effort across theAtlantic, sinking over a thousand ships. The awesome loss of life and materialdemoralized the early Allied war effort. Soon thereafter, the American subma-rine fleet in the Pacific severed vital Japanese resupply routes. By carrying thefight to the enemy’s homeland waters early in the war, U.S. submarines starvedJapanese industry, paving the way for Allied forces to achieve victory.

Supplementary Background Information 119
Table B.1
Submarine Fleets of the World
Nation Number of Submarines (by Class)
China 1 SSBN (Xia); 1 SSB (Golf); 5 SSNs, plus 1 under construction (Han); 1 SSG(Romeo); and 43 SSs, plus 60 in reserves and 2 under construction (Romeo,Whiskey, Ming)
France 5 SSBNs, plus 2 under construction and 2 planned (L’Inflexible, Le Triomphant);6 SSNs, plus 1 in storage (Rubis); and 8 SSs (Agosta, Daphne)
Germany 18 SSs, plus 12 planned (212, 206)
India 18 SSs, plus 1 under construction (Kilo, Foxtrot, Type 209)
Italy 8 SSs, plus 4 under construction (Sauro, Toti, Type S90)
Japan 17 SSs, plus 2 under construction and 1 planned (Yuushio, Uzushio, Harushio)
Libya 12 SSs (Foxtrot, R-2 Mala)
North Korea 24 SSs, plus 2 under construction (Romeo, Whiskey), and 48 midgets
Norway 12 SSs (Ula, Kobben)
Russia 59 SSBNs (Delta, Yankee, Typhoon); 38 SSGNs, plus 3 under construction(Charlie, Echo, Oscar, Yankee); 72 SSNs, plus 7 under construction (Victor,Akula, Alfa, Sierra, Yankee Notch, Yankee, Uniform, Paltus); 12 SSGs (Juliett);and 87 SSs, plus 5 under construction (Foxtrot, Kilo, Tango, Bravo, India, Lima,Beluga, X-ray, Losos)
South Korea 7 SSs, plus 6 under construction and 3 planned (KSS-1, Cosmos, Type 209)
Sweden 12 SSs, plus 3 under construction and 2 planned (Vastergotland, Nacken,Sjoormen, Gotland)
Turkey 15 SSs, plus 2 under construction and 4 planned (Guppy, Type 209, Tango)
United Kingdom 4 SSBNs, plus 3 under construction and 1 planned (Resolution, Vanguard); 13SSNs (Trafalgar, Swiftsure, Valiant); and 6 SSs, plus 1 under construction(Upholder, Oberon)
United States 27 SSBNs, plus 4 under construction (Ohio, Franklin); 87 SSNs, plus 11 underconstruction (Los Angeles, Sturgeon, Narwhal, Seawolf); 1 SS (Dolphin); and1 research sub (NR-1)
SOURCE: Jane’s Fighting Ships 1992–93, Brassey’s Ltd., London.NOTE: Others include Albania (2 SSs), Algeria (2 SSs, plus 2 planned), Argentina (4 SSs, plus 2 un-der construction), Australia (5 SSs, plus 3 under construction and 3 planned), Brazil (4 SSs, plus 2under construction), Canada (3 SSs), Chile (6 SSs), Colombia (2 SSs and 2 midgets), Cuba (3 SSs),Denmark (5 SSs), Ecuador (2 SSs), Egypt (8 SSs), Greece (10 SSs), Indonesia (2 SSs), Iran (2 SSs, plus1 under construction, and 2 midgets), Israel (3 SSs, plus 2 under construction and 1 planned),Netherlands (5 SSs, plus 2 under construction), Pakistan (9 SSs), Peru (10 SSs), Poland (3 SSs),Portugal (3 SSs), Romania (1 SS), South Africa (3 SSs), Spain (8 SSs), Syria (3 SSs), Taiwan (4 SSs),Venezuela (2 SSs), and Yugoslavia (5 SSs and 6 midgets).Submarine type abbreviations—“SS” is diesel-electric attack submarine; “B” indicates ship carriesballistic missiles; “G” indicates ship carries guided missiles; and “N” indicates nuclear power.

120 The U.S. Submarine Production Base
The traditional missions of submarines expanded greatly after World War II.Most obviously, submarines came to provide the nation with the credible, sur-vivable, mobile nuclear deterrent that formed the backbone of U.S. securitystrategy. Their sonar and combat system capabilities were so greatly improvedthat they became the premier antisubmarine force in the U.S. military and theonly forces that could conduct operations under the North Atlantic and Arcticice cap.
These traditional roles have become less critical with the end of the cold war.Other missions, however, demonstrate the utility of the attack submarine in anew security environment characterized by a multiplicity of unpredictable,seemingly minor situations that might warrant bringing military force to bear.The nuclear propulsion technology with which all U.S attack submarines arenow equipped is particularly suited to the demands of the era because of thehigh submerged speed and extended endurance it permits. Submarines can berapidly sortied to respond to a crisis and remain in a ready condition formonths without the need to resupply, refuel, or return to base. The sub-marine’s stealth allows it to remain in a crisis area undetected, maintainingsurveillance over the situation as necessary. If the crisis is defused by nonmili-tary means, the submarine can be withdrawn without political embarrassmentor other implications—perhaps for rapid redeployment to another crisis situa-tion. If action is needed, the submarine is on station ready to perform a varietyof missions:
• Deep strike. Submarines carry highly capable cruise missiles whose longrange holds 75 percent of the earth’s surface at risk. Two nuclear sub-marines successfully struck key Iraqi targets with Tomahawk missiles dur-ing the Persian Gulf War.
• Anti-surface-ship warfare. Modern torpedoes, antiship missiles, and minesendow today’s submarines with a formidable capability in this traditionalsubmarine role.
• Mine detection. Improved sonar systems provide the attack submarinewith the capability of detecting and mapping potentially mined areas. Thisinformation could be critical to other naval forces and for the resupply ofground and air forces.
• Insertion of special forces. All U.S. attack submarines have this capability,as do two SSBNs converted for this purpose. Submarine stealth and shal-low-water operating capability facilitate this mission.

Supplementary Background Information 121
U.S. SUBMARINE CONSTRUCTION FUNDING PROFILE
A historical profile of U.S. submarine production is offered in Chapter Two.Another perspective can be gained by examining the course of total funding forsubmarine construction, as is authorized in the budget account Shipbuildingand Conversion, Navy (SCN). This account also includes construction fundingfor all other Navy vessel construction. Figure B.2 shows the early-1960s peak insubmarine construction that is evident in Figure 2.6. It shows a secondary peakin FY73 that is not evident in Figure 2.6 because construction starts for sub-marines authorized in the early to mid-1970s were spread over several yearsthereafter. Finally, the graph shows the drop-off in submarine constructionfunds to a zero obligation in FY93.
Submarine construction funding has also dropped as a percentage of total shipconstruction. In most years through the mid-1970s, submarine constructionfunding was at least a third of that for all ship construction, in some years half.Over the last 15 years, submarine construction has usually been under a quarterof the SCN budget.
Bill
ions
of F
Y93
dol
lars
0
5
10
15
20
25
FY62 FY66 FY70 FY74 FY78 FY82 FY86 FY90
RANDMR456-B.2
SCN
Subs
Figure B.2—Submarine Construction Funding vs. Navy ShipConstruction Funding (SCN)


123
Appendix C
SHIPYARD EFFECTS: ADDITIONAL CASES
In Chapter Three, summary estimates were given for cost and schedule effectsof gaps in submarine production on the shipyards. For illustration, theunderlying details were shown of the cost estimate for one of the casesexamined—Electric Boat (EB) without further work after currently programmedsubmarine production ends. Here, we present the cost estimate details for theother five cases: Newport News Shipbuilding (NNS) without further workbeyond current submarine and carrier construction; NNS, with CVN-76;Electric Boat, with submarine overhaul work; NNS, without CVN-76 but withsubmarine overhaul work; and Electric Boat with SSN-23. We conclude with atabular summary of all cases.
BASELINE ESTIMATES FOR NEWPORT NEWS SHIPBUILDING
In this section, we give our cost and schedule estimates for NNS without thefunding of CVN-76 in the foreseeable future.1 These estimates are in some re-spects more complex than those for EB because one shop may be working notonly on submarines but also on other ships and because personnel may movefrom one line to another. We simplify matters somewhat by restricting our-selves to submarine and carrier work only. This may lead to some misesti-mates—for example, if workers no longer needed in submarine constructionmove within the yard to help in building or overhauling other military or com-mercial ships. In that case, our estimates of the costs to release, rehire, and re-train personnel may be overestimated, as skilled submarine production workersmay be retained in the yard and be available when submarine production re-sumes.
______________1The Navy plans a carrier overhaul in FY03–04. We ignore the manpower requirements for thatoverhaul for two reasons. We do not analyze submarine restarts beyond FY04 (when these overhaulworkers would become available for submarine construction) in this appendix, and, as we demon-strate in Chapter Six, restarts after FY01 are impractical.

124 The U.S. Submarine Production Base
Impact on Submarines Currently in Construction
At the end of FY93, NNS had about twice as many people employed in carrierwork as in submarine construction. Although both workforces are declining,the types of needed skills change over the course of carrier construction, andreleased submarine workers may find work on the carrier line. We draw theoptimistic conclusions that, with prudent yard management, few workers willhave to be laid off from the yard before the current submarine production runends in FY96 and that morale-related productivity losses can be minimized. Wetherefore assume there will be no impact on the costs of the submarines cur-rently in construction if further submarine production is delayed, even for sev-eral years.
Costs of Smart Shutdown
NNS estimates that, because of other work in progress, only a quarter of thesubmarine production facilities would go completely out of service should thesubmarine line shut down; others would be partially shut down. Mothballing,however, might not be necessary in all cases, as some activities formerly occur-ring in shut-down facilities might be resumed at restart in facilities remainingopen.
However, for restarts after carrier work ends (FY98 or later), smart shutdownwill be necessary at all facilities. For these, we assume that NNS facility andequipment shutdown costs would be comparable to EB’s. For submarinerestarts in FY95 through FY97, we assume such costs would amount to 20 per-cent of EB’s costs (for later restart years; NNS’s submarine work ends sooner).
With regard to nuclear operations and fuelings and vendor liability, ongoingcarrier work should ensure against any costs resulting from the end of subma-rine production at least through the mid-90s. For restarts after that, we assumeNNS’s costs are comparable to EB’s.
The last element of cost associated with stopping submarine production at NNSis related to personnel. As was the case for impact on current construction, weassumed we could neglect these costs. Total facility, equipment, and vendorcosts for shutdown at NNS are given in Table C.1.
Annual Cost of Maintaining NNS Production Capabilities
As we have no detail from NNS on the cost to maintain their capabilities duringa production gap, we adapt EB’s later-year values (see Table C.2). Carrier workholds some maintenance costs to 20 percent of their maximum value forrestarts before FY98.

Shipyard Effects: Additional Cases 125
Table C.1
Cost to Shut Down NNS SubmarineProduction Capability
(millions of FY92 dollars)
Restart Year Total
FY95 8FY96 8FY97 25FY98 or later 68
Table C.2
NNS Annual MaintenanceCosts Prior to Restart
(millions of FY92 dollars)
Year Added cost
FY95 5FY96 5FY97 5FY98 or later 46
NOTE: Costs on a given line accrue if restart oc-curs in that year or afterward.
Costs and Schedule of NNS Reconstitution
For NNS’s equipment and facility reconstitution costs, we use EB’s values, withthe 20 percent factor applied for restarts before FY98. We calculate the cost ofreconstituting NNS’s workforce much as we did for EB’s. Data supportingworkforce inputs to the workforce reconstitution model are shown in Table C.3.Note here, however, that “workers remaining” include those on both the sub-marine and carrier lines. As for EB, we assume that for restart in a given year,NNS can rehire 90 percent of the workers released the previous year (this timefrom both the submarine and carrier lines) and 20 percent of those released theyear before that. The total is the initial workforce at restart, given as “workersavailable” in Table C.3. (Note we constrain this again to a minimum of 260workers.) We also assume that the reconstituting workforce absorbs 90 percentof personnel coming off other construction lines in the year of restart and insubsequent years (these are the “skilled transfers” in the table).
We add two elements of cost to those generated from the model. For the cost tohire support personnel, we make the same adjustment we did for EB. But here,we also allow $1600 to provide remedial training to each worker moving fromCVN to SSN production. We assume that these persons have worked on the

126 The U.S. Submarine Production Base
Table C.3
Skilled Workforce Available When Production Resumes
Restart Year
WorkersRemaining
at Start of Yeara
WorkersReleased DuringPrevious Yeara
WorkersAvailable for
Restart
Skilled TransfersThis Year and
After
FY95 10000 3000 2700 9000FY96 6300 3700 3930 5670FY97 3300 3000 3440 2970FY98 1300 2000 2400 1170FY99 260 1040 1336 0FY00 260 0 468 0FY01 or later 260 0 260 0
aIncluding those on CVN line.
submarine line at some time but may not have retained submarine skills. The$1600 figure is drawn from an analysis based on an NNS study2 of the compa-ny’s ability to reconstitute the submarine construction work force.
For that study, NNS identified the basic work skills, formal worker qualifica-tions, and complex work operations required in each submarine shop. NNSalso identified which of those would be required in carrier construction. Thestudy results suggest 92 percent of the basic submarine skills, 82 percent of thequalifications, and 69 percent of the complex operations would be maintainedthrough carrier construction.
For each of the shops, we took the difference between the number of skills,qualifications, and complex operations required for submarine constructionand the number maintained by carrier construction. We multiplied those dif-ferences by the peak quarterly number of personnel required for submarineconstruction to get the total number of training “actions” required for eachshop and summed these across all shops. We estimated $500 per training ac-tion and divided the total cost by the number of workers needed to build asubmarine to get $1600 to train each carrier transfer. To give a graphic impres-sion of the similarities and dissimilarities in the skills required, Figure C.1 com-pares, for some 30 skills, the number of persons required in the maximum quar-ter of submarine and carrier construction.
______________2Reconstitution of the Submarine Production Workforce, Newport News Shipbuilding, April 1993.

Shipyard Effects: Additional Cases 127
�����
RANDMR456-C.1
Number of workers in maximum quarter
Pipefitters
Shipfitters
Machineryinstallation
Painters
Electrical
Fabrication
Submarine construction
Carrier construction
Welders
Insulation
Riggers
Toolroom
Shipboard support
Machine shop
Shop productioncontrol
Foundry
Electronics test
Sub nonnuclear engineer
Sub nuclear engineer
688 design agent
Quality inspection
Inspection
Nondestructivetest
Quality assurance
Administration
Material control
Sheet metal
Figure C.1—Persons Required, Submarine and Carrier Construction,Maximum Quarter

128 The U.S. Submarine Production Base
The total of all adjustments ranged from $7 to $13 million, depending on therestart year and production rate. By adding these to the model outputs, we ob-tain our estimate of the total cost to reconstitute the production workforce.These estimates for various production rates are shown in Table C.4 and FigureC.2, for the assumptions given in the Note to the table. Again, costs are highand increase with gap length, from several hundred million dollars in FY98 tothe neighborhood of $2 billion if restart is delayed beyond FY00.
Gap length affects the postrestart production schedule in much the same way itdoes for EB (see Figure C.3, assumptions as for Table C.4). Deferral of restartbeyond FY99 increases the time to deliver the first ship, resulting in a delay ofseveral years for restarts later than FY00. And the delay is at least twice as greatfor achieving a sustained rate of production.
Summary Estimates
Figure C.4 shows the various costs associated with submarine production gapsat NNS if CVN-76 is not funded and the eventual sustained production rate istwo ships per year. Total costs grow rapidly with gap length, driven by person-nel-related costs.
NEWPORT NEWS WITH CVN-76
If CVN-76 is funded, Newport News will be able to continue to use a portion ofthe submarine personnel and facilities beyond the time when the current car-rier work ends in 1998. Here, we briefly summarize the costs of restart withCVN-76. Most of these are small and do not vary with restart year.
Table C.4
Total NNS Personnel ReconstitutionCosts Without CVN-76
(millions of FY92 dollars)
Restart Year Rate = 2 Rate = 3
FY98 416 705FY99 750 1099FY00 1453 1799FY01 or later 1747 2125
NOTE: Case shown assumes fixed overhead of$150 million (pessimistic), early attrition rate of 5to 10 percent (optimistic), and mentor: traineeratio of 0.5 (intermediate).

Shipyard Effects: Additional Cases 129
����Rate = 3
Rate = 2
RANDMR456-C.2
Bill
ions
of F
Y92
dol
lars
2.5
2.0
1.5
1.0
0.5
0FY99 FY04FY00 FY01 FY02 FY03FY98
Restart year
������������
����������
��������������
������������
����������
��������������
Figure C.2—NNS Personnel-Related Reconstitution Costs,Without CVN-76
���������
���������
�������������
���������
����������
��������������
RANDMR456-C.3
Yea
rs to
ach
ieve
mile
ston
e
18
14
12
2
0FY99 FY04FY00 FY01 FY02 FY03FY98
Restart year
8
6
10
16
4
����
Milestone
Rate = 3
Rate = 2
1st delivery
Figure C.3—NNS Postrestart Production Schedule,Without CVN-76

130 The U.S. Submarine Production Base
FY03�� ��
������
����
RANDMR456-C.4
FY98
Restart year
Bill
ions
of F
Y92
dol
lars
2.5
2.0
1.5
1.0
0.5
0
Restart
Cumulativemaintenance
Shutdown��
FY99 FY00 FY01 FY04
Production rate = 2 per year
FY02�������
Figure C.4—NNS Shipyard Reconstitution Costs, No Work Beyond That CurrentlyUnder Way, Production Rate = Two per Year
Since we reasoned there would be no effect on the current production sub-marines if CVN-76 is not funded, we infer there would be none if it is.Shutdown costs would be equal to those in the previous case for restart prior tocarrier line shutdown—$8 million. The additional carrier work will keep thenuclear operations active, and we expect no vendor liability costs or costs forreleasing personnel.
Annual maintenance costs are also equal to those in the previous case forrestart prior to carrier line shutdown. These amount to $5 million—the annualcost of security and maintenance manpower and materials, utilities, emergencyrepairs, taxes, and insurance. There is also no need for a cadre to ensure theavailability of mentors when submarine production is restarted.
Since few of the submarine facilities would be completely mothballed, therewould be only minor costs associated with bringing them back on-line. We es-timate $5 million to reconstitute facilities and $2 million for equipment.
To calculate workforce reconstitution costs, we again establish an initial work-force from released submarine and carrier workers. In contrast to the previouscase, however, the carrier workforce is growing during some potential restartyears (FY98 through FY00; see Figure C.5), so fewer workers are available for

Shipyard Effects: Additional Cases 131
restarting the submarine line. For cases when those workers number less than1000, NNS indicated they would move skilled submarine workers from the CVNline to the submarine line and hire new replacement workers on the CVN line.3
The resulting initial workforce numbers we input to the workforce reconstitu-tion model are shown in Table C.5.
We make the same adjustments described in the previous case for support per-sonnel and retraining CVN workers, and we cost replacements for CVN workersmoved to the submarine line at $10,000 each. (We could not quantify losses tothe carrier line arising from the inefficiency of the replacement workers, butthey may be in the thousands of dollars per worker.) The total of all adjust-ments ranges from $5 to $26 million.
The total cost of reconstituting the workforce is shown in Table C.6 and FigureC.6. Note that, following the jump from FY98 to FY99, personnel-related re-constitution costs decrease with a longer gap. The reason is that a large num-ber of transfers from CVN-76 is available in FY04. Thus, the closer the restart
RANDMR456-C.5
Wor
kers
8000
7000
6000
5000
4000
3000
2000
1000
0FY94
Fiscal year (tick indicates 1st quarter)
FY95 FY96 FY97 FY98 FY99 FY00 FY01 FY02 FY03 FY04
Figure C.5—With CVN-76, Carrier Work Increases in Some SubmarineRestart Years
______________3Note that we do not let the workforce fall as far in this case as we did in either baseline case. The260-person cadre was kept small because of its cost and the difficulty of finding tasks that wouldmaintain the skills of many more people. But in the present case, a large number of workers whoseskills are maintained by productive work is available. We believe it likely that the shipyard wouldtake advantage of that to restart submarine production with a larger workforce and reap major costadvantages.

132 The U.S. Submarine Production Base
Table C.5
Skilled NNS Workforce Available When Production Resumes If CVN-76Is Funded
RestartYear
WorkersRemainingat Start of
Yeara
WorkersReleasedDuring
Previous Yeara
WorkersAvailable for
RestartWorkers Hired
from CVNb
SkilledTransfersThis Yearand Afterc
FY95 10000 3000 2700 0 10570FY96 6300 3700 3930 0 7200FY97 3400 2900 3350 0 4590FY98 2200 1200 1660 0 3510FY99 2400 0 40 960 3510FY00 3400 0 0 1000 3510FY01 3900 0 0 1000 3510FY02 3800 100 90 910 3420FY03 3100 700 650 350 2790FY04 260 2840 2956 0 0
aIncluding those on CVN line.bTo bring initial submarine restart workforce to 1000.cExceeds workers remaining in some restart years because additional workers are hired for CVNin subsequent years.
Table C.6
Total NNS Personnel Reconstitution Costswith Funding of CVN-76
(millions of FY92 dollars)
Next Start Rate = 2 Rate = 3
FY98 479 870FY99 746 1019FY00 675 932FY01 588 845FY02 510 764FY03 453 735FY04 446 756
NOTE: Case shown assumes fixed overhead of$150 million (pessimistic), early attrition rate of 5to 10 percent (optimistic), and mentor:traineeratio of 0.5 (intermediate).
year is to FY04, the shorter the time over which the force must be “grown” fromscratch.
The relationship between restart year and schedule also differs from that ofprevious cases (see Figure C.7). The larger initial submarine workforces permit-

Shipyard Effects: Additional Cases 133
RANDMR456-C.6
Mill
ions
of F
Y92
dol
lars
1200
1000
800
600
400
0FY99 FY04FY00 FY01 FY02 FY03FY98
Restart year
����Rate = 3
Rate = 2200
���������
��������
����������
������
������������
��������
����������
���
Figure C.6—Personnel-Related Reconstitution Costs for NNS with CVN-76
12RANDMR456-C.7
Yea
rs to
ach
ieve
mile
ston
e
2
0FY99 FY04FY00 FY01 FY02 FY03FY98
Restart year
8
6
10
4 ����
Milestone
Rate = 3
Rate = 2
1st delivery
��������������
��������
������������
������
������������
������
Figure C.7—Postrestart Production Schedule for NNS with CVN-76

134 The U.S. Submarine Production Base
ted by transfers from the carrier workforce allow first delivery within six years,regardless of restart year. A sustained production rate of two per year can beachieved within nine years with restart in FY99; after that, the interval dimin-ishes, for the same reason that cost diminishes.
Summary Estimates
Total costs of submarine production gaps at Newport News with CVN-76 areshown in Figure C.8. Those totals are smaller than—and, for restart years be-yond FY99, only a fraction of—the totals for Newport News without CVN-76(plotted as a line in the figure). Thus, taking workers from the carrier line maycause losses there in the millions or low tens of millions of dollars, but the gainon the submarine line is in the hundreds of millions.
IMPACT OF DIRECTING OVERHAUL WORK TO PRIVATE YARDS
We have seen a large difference in the costs associated with an active and an in-active yard because of the variation in the number of people that must be re-cruited, hired, and trained when submarine production restarts. There appearsto be a substantial advantage to keeping a shipyard and its employees busy with
FY03�� ������
RANDMR456-C.8
FY98
Restart year
Bill
ions
of F
Y92
dol
lars
2.5
2.0
1.5
1.0
0.5
0FY99 FY00 FY01 FY04
Production rate = 2 per year
FY02�������
RestartCumulativemaintenanceShutdownInactive yard total
�
Figure C.8—Shipyard Reconstitution Costs, Newport News, with Additional AircraftCarrier (CVN-76), Production Rate = Two per Year

Shipyard Effects: Additional Cases 135
work related to submarine construction. A potential way to do so is to directsubmarine repair, overhaul, and refueling workload to private shipyards.
The maintenance actions for submarines were described in Chapter Two. Theannual repair and overhaul workload for submarines can be substantial. Asshown in Table C.7, submarine maintenance actions have averaged about 2.4million worker-days annually over the last seven years.
It is true that the maintenance workload has been sharply declining over thelast several years as the pre-688-class submarines reach the end of their usefullife. But it will rise again as the current fleet reaches its programmed forcestrength and the boats reach their scheduled maintenance points (see TableC.8).
Table C.7
Major Maintenance Activities for Submarines
Pre-688 688-Class 688-Class
Class ROHs DMPs
Year NumberMan-days
(000) NumberMan-days
(000) NumberMan-days
(000)
FY86 10 3669 3 1141 0 0FY87 10 3578 1 481 0 0FY88 6 2297 1 450 0 0FY89 5 1622 1 462 5 833FY90 2 713 0 0 4 582FY91 0 0 0 0 4 641FY92 0 0 0 0 2 283
SOURCE: Naval Sea Systems Command, Management Group, SEA 072.NOTE: ROH-regular overhaul; DMP-depot modernization period.
Table C.8
Scheduled Future Repair/Overhaul Activitiesfor 688-Class and Ohio-Class Submarines
688-Class Ohio-Class
Year DMPs RFOHs ROHs
FY95 0 1 0FY96 4 1 0FY97 1 3 2FY98 3 3 1FY99 2 3 1
NOTE: DMP-depot modernization period; RFOH-refueling overhaul; ROH-regular overhaul. Schedule assumes no early decommissioning.

136 The U.S. Submarine Production Base
The maintenance actions shown in Table C.8 each require between 150,000 and500,000 worker-days of effort, or approximately 600 to 2000 worker-equivalents.Thus, there should be enough maintenance work for 7000 to 9000 shipyardworkers—almost equivalent to the workload for steady-state construction oftwo new submarines per year. Even if the Los Angeles-class is decommissionedinstead of refueled at midlife, there would be enough repair and overhaul workfor 2000 to 3000 workers.
There will also be approximately 16 drydocking selected restricted availabilities(DSRAs) per year over the next five years. These periodic maintenance actions,completed between public and private shipyards, will equate to approximately400,000 worker-days (or 1600 equivalent workers) per year.
There is obviously a potentially significant annual workload in the repair, over-haul, refueling, and decommissioning of submarines. But will this type of workbe sufficient to maintain the management and production skills needed forsubmarine construction?
Management Differences Between Overhaul and New Construction
There are some significant differences between the management techniquesand philosophies for new submarine construction and those for repair andoverhaul. Construction contracts are Fixed Price Incentive (FPI). Theoretically,the work is well defined in advance, particularly for follow-on ships of a class. Itfollows a set sequence, rather like the work on an automobile assembly line; un-seen problems are unlikely. Management efforts are directed at ensuring thoseschedules are achieved as planned.
Overhauls are characterized by large uncertainties in defining the workloadahead of time in terms of both total workload and cost. The work needed is of-ten not known with specificity until systems are disassembled and inspected.Contracts are therefore written as Cost Plus Incentive (CPI).
Because of the uncertainty and because there is pressure to return a ship to thefleet as soon as possible, overhauls are much more management intensive thannew construction. Management philosophies and, most important, manage-ment control systems must be more flexible and adaptable. In particular, thereare significant differences in management systems for the ordering and controlof material, for scheduling workload and assigning skilled workers, for trackingthe status of systems and equipment, for processing reports, and for predictinglabor requirements.
Although most major overhauls now take place in public shipyards, both EBand NNS have performed overhauls in the past. In those cases, increases in

Shipyard Effects: Additional Cases 137
overhaul workload at the two yards were coincident with increases in new con-struction workload, and both cost and schedule performance degraded signifi-cantly.
In a low workload situation, as would result from gaps in new construction, in-tensive management should be able to accomplish submarine overhauls in atimely and cost effective fashion. However, a period of adjustment, along withsome start-up costs, would be required.
Trade Employment in New Construction Versus Overhaul
A potentially more important issue is whether overhaul work involves con-struction skills. Figure C.9 compares the maximum quarterly worker-hours forsubmarine construction and overhaul. All but the “pure” production skills areemployed in submarine overhauls, but for many skills, fewer hours are re-quired. Shipfitters, welders, and grinders, for example, are used to a muchgreater extent in new construction. However, outside machinists, electronicsinstallation and test, and engineering and finance are used more in overhaul.
Thus, trade people can remain employed in overhauls, but can their productionskills be maintained? Newport News determined that 96 percent of the basicwork skills, 99 percent of the qualifications, and 89 percent of the complex workoperations needed for submarine construction could be maintained throughsubmarine overhaul.4 Certainly, training will be required when moving back toconstruction, but the level of training should be significantly less than that re-quired for a new hire. And keeping submarine personnel employed in overhaulwill eliminate the costs of releasing and rehiring those workers.
At NNS, carrier overhaul could also be considered as a way to keep submarineconstruction personnel employed during the hiatus in submarine production.Figure C.10 compares skill requirements for submarine construction with thosefor carrier overhaul.
Cost Impact of Directing Overhaul Work to EB
Placing major overhaul and repair work in private yards can have a significantimpact on the costs associated with shutting down, maintaining, and reconsti-tuting submarine production capability. Many of the production support facili-
______________4Reconstitution of the Submarine Production Workforce, Newport News Shipbuilding, April 1993.We estimate that only a quarter as many training actions are needed to move the workforce fromsubmarine overhaul to construction as to move it from carrier construction to submarine construc-tion.

138 The U.S. Submarine Production Base
RANDMR456-C.9
Number of workers in maximum quarter
Welders
Pipefitters
Shipfitters
Steel processing
Outside machinists
Painters
Submarine construction
Submarine overhaul
Grinders
Steel fabrication
Electricians
Frame and cylinder fabrication
Preheat
Carpenters
Pipe welders
Sheetmetal
Riggers
Pipe insulators
Electronics installation
Shipyard test
Construction support engineeringOperations
managementElectronics test
Test support
Quality assurance
Nuclear test
Machine shop
Miscellaneous support
Procure/materiel control
Plan/production control
Figure C.9—Submarine Construction and Overhaul Skill Requirements

Shipyard Effects: Additional Cases 139
RANDMR456-C.10
Number of workers in maximum quarter
Pipefitters
Shipfitters
Machineryinstallation
Painters
Electrical
Fabrication
Submarine construction
Carrier overhaul
Welders
Insulation
Riggers
Toolroom
Shipboard support
Machine shop
Shop productioncontrol
Foundry
Electronics test
Sub nonnuclear engineer
Sub nuclear engineer
688 design agent
Quality inspection
Inspection
Nondestructivetest
Quality assurance
Administration
Material control
Sheet metal
Figure C.10—Submarine Construction and Carrier Overhaul Skill Requirements

140 The U.S. Submarine Production Base
ties could be used for overhaul work, and personnel-related costs would belower.
In estimating that impact for EB, we assume enough overhaul work is assignedto employ 1000 people. This equates to at most two 688-class DMPs per year orone Ohio-class ROH per year. We further assume that the work does not in-volve refuelings or the handling of “dirty” fuel, which EB cannot now do.
Impact on Submarines in Construction. Overhaul work coming into the yardwould result in the release of fewer employees and a decrease in the number ofincentive bonuses to keep key people in place until the final boat is delivered.Inefficiencies associated with an approaching shutdown should also be lesspronounced. If enough workload is assigned to employ 1000 workers, we esti-mate costs could decrease by half for the longest gaps considered (compareTable C.9 with Table 3.1).
Shutdown. Overhaul work would keep many of the production support facili-ties open and equipment in use at the Groton location. Approximately 50 per-cent of the Groton shutdown costs could be saved (compare Table C.10 withTable 3.3). The nuclear operations/fueling cost element may remain the same,but about 1000 fewer people (the 1000 overhaul workers plus support minus the
Table C.9
Cost Impact on EB Submarines Currently in Constructionwith Overhaul Work
Next StartNumber of
BonusesExtra
Worker-yearsTotal Cost($M FY92)
FY95 to FY98 0 0 0FY99 500 300 20FY00 or later 1000 600 40
NOTE: Each bonus costs $10,000; each extra worker-year costs $50,000.
Table C.10
EB Shutdown Costs, withOverhaul Work
(millions of FY92 dollars)
Next Start Total
FY95 3FY96 18FY97 58FY98 78FY99 84FY00 or later 115
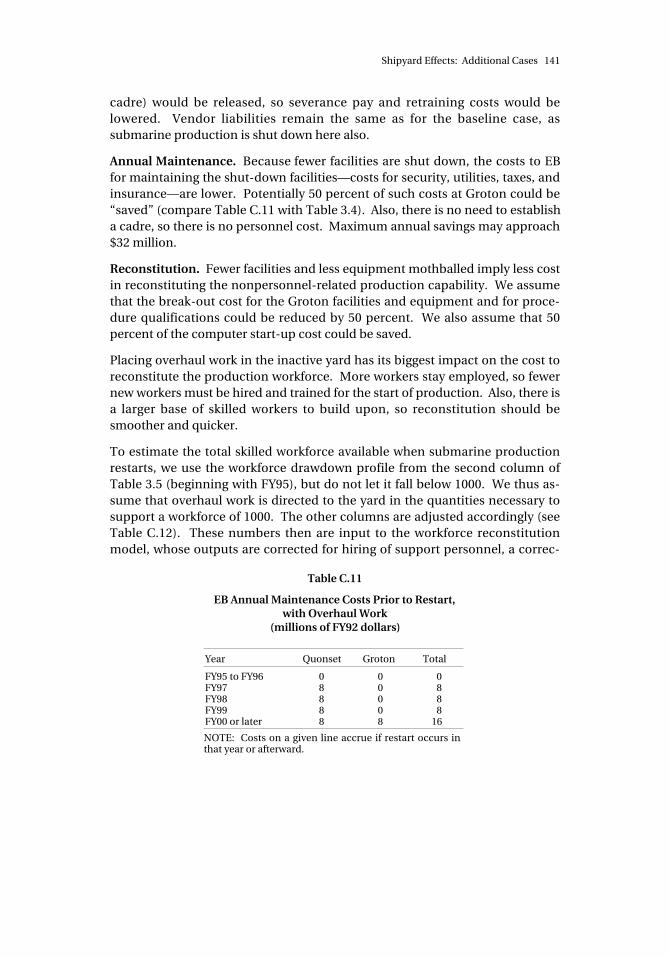
Shipyard Effects: Additional Cases 141
cadre) would be released, so severance pay and retraining costs would belowered. Vendor liabilities remain the same as for the baseline case, assubmarine production is shut down here also.
Annual Maintenance. Because fewer facilities are shut down, the costs to EBfor maintaining the shut-down facilities—costs for security, utilities, taxes, andinsurance—are lower. Potentially 50 percent of such costs at Groton could be“saved” (compare Table C.11 with Table 3.4). Also, there is no need to establisha cadre, so there is no personnel cost. Maximum annual savings may approach$32 million.
Reconstitution. Fewer facilities and less equipment mothballed imply less costin reconstituting the nonpersonnel-related production capability. We assumethat the break-out cost for the Groton facilities and equipment and for proce-dure qualifications could be reduced by 50 percent. We also assume that 50percent of the computer start-up cost could be saved.
Placing overhaul work in the inactive yard has its biggest impact on the cost toreconstitute the production workforce. More workers stay employed, so fewernew workers must be hired and trained for the start of production. Also, there isa larger base of skilled workers to build upon, so reconstitution should besmoother and quicker.
To estimate the total skilled workforce available when submarine productionrestarts, we use the workforce drawdown profile from the second column ofTable 3.5 (beginning with FY95), but do not let it fall below 1000. We thus as-sume that overhaul work is directed to the yard in the quantities necessary tosupport a workforce of 1000. The other columns are adjusted accordingly (seeTable C.12). These numbers then are input to the workforce reconstitutionmodel, whose outputs are corrected for hiring of support personnel, a correc-
Table C.11
EB Annual Maintenance Costs Prior to Restart,with Overhaul Work
(millions of FY92 dollars)
Year Quonset Groton Total
FY95 to FY96 0 0 0FY97 8 0 8FY98 8 0 8FY99 8 0 8FY00 or later 8 8 16
NOTE: Costs on a given line accrue if restart occurs inthat year or afterward.
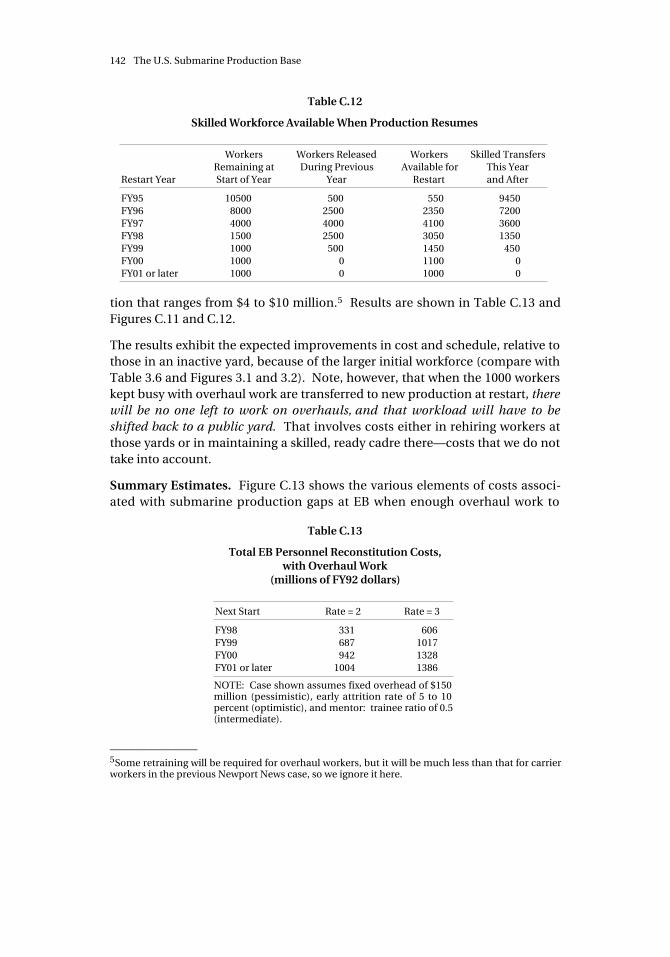
142 The U.S. Submarine Production Base
Table C.12
Skilled Workforce Available When Production Resumes
Restart Year
WorkersRemaining atStart of Year
Workers ReleasedDuring Previous
Year
WorkersAvailable for
Restart
Skilled TransfersThis Yearand After
FY95 10500 500 550 9450FY96 8000 2500 2350 7200FY97 4000 4000 4100 3600FY98 1500 2500 3050 1350FY99 1000 500 1450 450FY00 1000 0 1100 0FY01 or later 1000 0 1000 0
tion that ranges from $4 to $10 million.5 Results are shown in Table C.13 andFigures C.11 and C.12.
The results exhibit the expected improvements in cost and schedule, relative tothose in an inactive yard, because of the larger initial workforce (compare withTable 3.6 and Figures 3.1 and 3.2). Note, however, that when the 1000 workerskept busy with overhaul work are transferred to new production at restart, therewill be no one left to work on overhauls, and that workload will have to beshifted back to a public yard. That involves costs either in rehiring workers atthose yards or in maintaining a skilled, ready cadre there—costs that we do nottake into account.
Summary Estimates. Figure C.13 shows the various elements of costs associ-ated with submarine production gaps at EB when enough overhaul work to
Table C.13
Total EB Personnel Reconstitution Costs,with Overhaul Work
(millions of FY92 dollars)
Next Start Rate = 2 Rate = 3
FY98 331 606FY99 687 1017FY00 942 1328FY01 or later 1004 1386
NOTE: Case shown assumes fixed overhead of $150million (pessimistic), early attrition rate of 5 to 10percent (optimistic), and mentor: trainee ratio of 0.5(intermediate).
______________5Some retraining will be required for overhaul workers, but it will be much less than that for carrierworkers in the previous Newport News case, so we ignore it here.

Shipyard Effects: Additional Cases 143
������������
����������
��������������
������������
��������������������
RANDMR456-C.11
Mill
ions
of F
Y92
dol
lars
1400
1000
800
600
400
0FY99 FY04FY00 FY01 FY02 FY03FY98
Restart year
����Rate = 3
Rate = 2200
1200
Figure C.11—EB Personnel-Related Reconstitution Costs,with Overhaul Work
���������
�����������������
���������
�����������������
14RANDMR456-C.12
Yea
rs to
ach
ieve
mile
ston
e
2
0FY99 FY04FY00 FY01 FY02 FY03FY98
Restart year
8
6
10
4
������
Milestone
Rate = 3
Rate = 2
1st delivery
12
Figure C.12—EB Postrestart Production Schedule,with Overhaul Work

144 The U.S. Submarine Production Base
FY03�� ������
RANDMR456-C.13
FY98
Restart year
Bill
ions
of F
Y92
dol
lars
2.5
2.0
1.5
1.0
0.5
0FY99 FY00 FY01 FY04
Production rate = 2 per year
FY02�����
RestartCumulativemaintenanceShutdownBaselinetotal
�
Figure C.13—EB Shipyard Reconstitution Costs, with Overhaul Work,Production Rate = Two per Year
keep 1000 persons per year busy is placed in the yard. Savings relative togapped production with an inactive yard are on the order of one-third to one-half (or roughly half a billion to a billion dollars) for restarts after FY99.
Cost Impact of Directing Overhaul Work to NNS
We next consider the NNS case in which CVN-76 is not funded but overhaulwork sufficient to keep 1000 direct workers employed per year is directed to theyard. Our cost estimates are based on submarine overhauls, although we be-lieve the costs would be similar (perhaps slightly higher to account for retrain-ing) if the work was associated with the overhaul of carriers.
Impact on Submarines in Construction. As with our other cases for NNS, weassume there is no impact on the cost of submarines currently under construc-tion. Prudent yard management should be able to move workers across thesubmarine and carrier construction and overhaul lines in a manner that wouldreduce the release of workers and minimize morale-related productivity losses.
Shutdown. Currently programmed carrier work will keep the production sup-port facilities operating through FY97. Submarine or additional carrier over-

Shipyard Effects: Additional Cases 145
haul work would keep a portion of the production support facilities open be-yond that time. For submarine starts in FY98 or later, we assume the costs atNNS would be comparable to the costs at EB (with overhaul work).
We assume the other elements of shutdown cost (nuclear operations, vendor li-abilities, and personnel release) will be the same as in the NNS base case. TableC.14 summarizes our estimates of shutdown costs at NNS when overhaul workis available. NNS can refuel submarines or carriers and, if the overhaul work in-volves refueling, shutdown costs for starts in FY98 or later could therefore bereduced by the cost associated with shutting down the nuclear fueling opera-tions.
Annual Maintenance. Submarine or carrier overhauls should have no impacton annual maintenance costs for submarine starts prior to FY98 (ongoing car-rier work would keep those costs low). For submarine starts in FY98 or later, weassume NNS annual maintenance costs would be comparable to those for EBwith overhaul. Our cost estimates for annual maintenance (terminating atrestart) are, therefore, $5 million per year through FY97 and $16 million per yearthereafter.
Reconstitution. The assumptions that underlie our estimates of the nonper-sonnel reconstitution costs mirror those listed above plus those that underlieour EB-with-overhaul case. That is, ongoing carrier work holds down costs as-sociated with submarine starts prior to FY98; submarine overhauls would notfurther reduce these costs. For submarine starts beginning in FY98, we assumethe nonpersonnel reconstitution costs when overhauls are assigned to the yardare 50 percent of the costs associated with no overhauls.
As with EB, the workforce profiles for NNS are the same as the baseline case, butthe workforce is not allowed to fall below 1000 (see Table C.15). The workforcereconstitution model’s outputs are corrected for support hiring and retrainingof carrier workers, which, taken together, add between $8 and $13 million to themodel’s output. The totals are shown in Table C.16 and graphed in Figure C.14.Schedule effects are shown in Figure C.15.
Table C.14
NNS Shutdown Costs, withOverhaul Work
(millions of FY92 dollars)
Next Start Total
FY95 8FY96 8FY97 25FY98 or later 53

146 The U.S. Submarine Production Base
Table C.15
Skilled Workforce Available When Production Resumes
Restart Year
WorkersRemaining
at Start of Year
WorkersReleased During
Previous Year
WorkersAvailable for
Restart
SkilledTransfersThis Yearand After
FY95 10000 3000 2700 9000FY96 6300 3700 3930 5670FY97 3300 3000 3440 2970FY98 1300 2000 2400 1170FY99 1000 300 1670 0FY00 1000 0 1060 0FY01 or later 1000 0 1000 0
Table C.16
Total NNS Personnel Reconstitution Costs,with Overhauls but Without CVN-76
(millions of FY92 dollars)
Next Start Rate = 2 Rate = 3
FY98 416 705FY99 728 1068FY00 968 1357FY01 or later 1006 1398
NOTE: Case shown assumes fixed overhead of $150million (pessimistic), early attrition rate of 5 to 10percent (optimistic), and mentor: trainee ratio of 0.5(intermediate).
Having overhaul work alone at Newport News does not result in the kinds ofimprovements in cost or time to achieve sustained production rates (relative tothose from gapping with an inactive yard) that can be achieved with CVN-76.The latter serves as a source of thousands of transfers to bolster the reconstitut-ing submarine construction workforce, and we assume only enough overhaulwork for 1000 persons. However, those 1000 are enough to hold the time forfirst ship delivery to the nominal six years, and the improvements in cost andyears to achieve sustained production rates are substantial compared to thosefor an inactive yard.
Summary Estimates. Gap-related costs other than those for reconstituting theworkforce are small for all restart years, so the cost conclusions just stated alsoapply to all gap-related costs (see Figure C.16).

Shipyard Effects: Additional Cases 147
���������������
���������������������
���������
�����������������������
RANDMR456-C.14
Mill
ions
of F
Y92
dol
lars
1400
1000
800
600
400
0FY99 FY04FY00 FY01 FY02 FY03FY98
Restart year
����Rate = 3
Rate = 2200
1200
Figure C.14—NNS Personnel-Related Reconstitution Costs,with Overheads but Without CVN-76
���������
�����������������
���������
�����������������
14RANDMR456-C.15
Yea
rs to
ach
ieve
mile
ston
e
2
0FY99 FY04FY00 FY01 FY02 FY03FY98
Restart year
8
6
10
4
������
Milestone
Rate = 3
Rate = 2
1st delivery
12
Figure C.15—NNS Postrestart Reconstitution Schedule,with Overhauls but Without CVN-76

148 The U.S. Submarine Production Base
FY03�� ������
RANDMR456-C.16
FY98
Restart year
Bill
ions
of F
Y92
dol
lars
2.5
2.0
1.5
1.0
0.5
0FY99 FY00 FY01 FY04FY02�����
RestartCumulativemaintenanceShutdownBaselinetotal
��
��
Figure C.16—NNS Shipyard Reconstitution Costs,with Overhauls but No CVN-76
BRIDGING THE PRODUCTION GAP WITH SSN-23
Placing overhaul work in the private shipyards has the advantage of keeping theshipyard active during the halt in submarine production thereby reducing thetotal costs. Fewer facilities and equipment must be mothballed, maintained,and reconstituted and, more importantly, workers stay employed during theproduction gap and provide a larger base from which to rebuild the productionworkforce. An alternative method for keeping the shipyard active is to build thethird Seawolf, SSN-23. Here we consider the case where SSN-23 is authorizedfor a production start at EB in 1996.This “bridging” strategy has the following effects on our cost estimates:
• We assume that SSN-23 would provide sufficient workload to eliminate theloss of morale and productivity inefficiencies associated with the sub-marines currently in construction. That is, we assume that there is no ad-ditional cost for the submarines currently under construction.
• The Quonset Point facility stays active until at least 1999 and the Grotonfacility would not close until 2002. We therefore assume that the stream of

Shipyard Effects: Additional Cases 149
costs shown in Table 3.3 would be offset by approximately four years, re-sulting in the costs shown in Table C.17.6 We further assume that annualmaintenance and nonpersonnel-related reconstitution costs would be dis-placed by a similar interval.
• Larger numbers of production workers may be available when productionof the next generation submarine begins. The construction of SSN-23maintains the workforce for a time and provides a larger base to build uponwhen new production resumes. Our estimates of personnel released andremaining for different-year production starts are shown in Tables C.18(including indirect support) and C.19 (production workers only).
• Though reconstitution costs (see Table C.20 and Figure C.17) for laterrestart years equal those at an inactive yard, workers coming off the SSN-23line keep reconstitution costs at least as low in the interim as those for theoverhaul case. Restarting production in FY01, for example, costs $1.7 to$2.0 billion in personnel-related reconstitution costs if the yard is inactive,but only $0.9 to $1.3 billion with SSN-23 work.7 The effects of SSN-23 onpostrestart schedule are analogous to those for cost (see Figure C.18). Thepattern is also reflected in total reconstitution costs (Figure C.19).
Table C.17
EB Shutdown Costs as aFunction of Next Start
(millions of FY92 dollars)
Next Start Total
FY95 2FY96 12FY97 29FY98 44FY99 50FY00 58FY01 83FY02 87FY03 90FY04 134
______________6“Next start” and “restart” in this table and elsewhere in the discussion of this case refer to the startof construction on the NSSN (for consistency with the other shipyard analyses), not constructionstart for the SSN-23.7Reconstitution costs for FY98 are a little higher than those for an inactive yard, because at thatpoint SSN-23 is still occupying workers who could otherwise be available for the NSSN. The initialNSSN workforce is thus lower with SSN-23 than without it for a FY98 restart.

150 The U.S. Submarine Production Base
Table C.18
EB Personnel Released by Various Dates
Restart Year
WorkersRemaining
at Start of Year
WorkersReleased During
Previous Year
CumulativeWorkersReleased
FY94 13400FY95 12900 500 500FY96 11000 1900 2400FY97 7600 3400 5800FY98 4600 3000 8800FY99 3300 1300 10100FY00 1700 1600 11700FY01 or later 300 1400 13100
Table C.19
Skilled Workforce Available When Production Resumes
Restart Year
WorkersRemaining
at Start of Year
WorkersReleased During
Previous Year
WorkersAvailable for
Restart
Skilled TransfersThis Yearand After
FY95 10500 500 550 9450FY96 8150 2350 2215 7335FY97 5050 3100 3260 4545FY98 3400 1650 2105 3060FY99 2100 1300 1500 1890FY00 1250 850 1025 1125FY01 900 350 485 810FY02 260 640 856 0FY03 260 0 388 0FY04 260 0 260 0
Table C.20
Total EB PersonnelReconstitution Costs
(millions of FY92 dollars)
Next Start Rate = 2 Rate = 3
FY98 351 633FY99 524 828FY00 708 1037FY01 939 1328FY02 1072 1470FY03 1549 1880FY04 1747 2125
NOTE: Case shown assumes fixed overheadof $150 million (pessimistic), early attritionrate of 5 to 10 percent (optimistic), andmentor:trainee ratio of 1:2 (intermediate).

Shipyard Effects: Additional Cases 151
���������
������������������
������
������
�������������
���������������
���������
����
Rate = 3
Rate = 2
RANDMR456-C.17
Mill
ions
of F
Y92
dol
lars
2500
2000
1500
1000
500
0FY99 FY04FY00 FY01 FY02 FY03FY98
Restart year
Figure C.17—EB Personnel-Related Reconstitution Costs,with SSN-23
�������������
�����������������
������
�������������
��������������������
RANDMR456-C.18
Yea
rs to
ach
ieve
mile
ston
e
18
14
12
2
0FY99 FY04FY00 FY01 FY02 FY03FY98
Restart year
8
6
10
16
4
����Milestone
Rate = 3
Rate = 2
1st delivery
Figure C.18—EB Postrestart Reconstitution Schedule,with SSN-23

152 The U.S. Submarine Production Base
FY03�� ������
RANDMR456-C.19
FY98
Restart year
Bill
ions
of F
Y92
dol
lars
2.5
2.0
1.5
1.0
0.5
0FY99 FY00 FY01 FY04FY02
RestartCumulativemaintenanceShutdownBaselinetotal
��
Figure C.19—EB Shipyard Reconstitution Costs, with SSN-23
SUMMARY
The shipyard costs of deferring production are presented in Table C.21 for allcases examined. Effects on current construction and the costs of shutdown andmaintenance do not vary with target production rate. The costs of restartingproduction, and thus the total costs, do. Costs for target production rates oftwo and three per year are shown. Each cell in the table shows the costs in-curred over all years for the category heading that row, given restart in the yearheading that column.

Shipyard Effects: Additional Cases 153
Table C.21
Summary of Shipyard Costs of Deferring Production
Case and Cost ($M) for Restart inCost Category FY98 FY99 FY00 FY01 FY02 FY03 FY04
Electric Boat, No Additional Work
Current construction40 60 80 80 80 80 80
Shutdown 78 88 134 134 134 134 134Cumulative mainte-
nance 16 24 72 120 168 216 264Restart (2/yr) 337 709 1298 1747 1849 1869 1889Restart (3/yr) 612 1038 1685 2054 2227 2247 2267Total (2/yr) 471 881 1584 2081 2231 2299 2367Total (3/yr) 746 1210 1971 2388 2609 2677 2745
Newport News, No Additional Work
Current construction 0 0 0 0 0 0 0Shutdown 68 68 68 68 68 68 68Cumulative mainte-
nance 61 107 153 199 245 291 337Restart (2/yr) 478 832 1555 1869 1889 1889 1889Restart (3/yr) 767 1181 1901 2247 2267 2267 2267Total (2/yr) 607 1007 1776 2136 2202 2248 2294Total (3/yr) 896 1356 2122 2514 2580 2626 2672
Newport News, with CVN-76
Current construction 0 0 0 0 0 0 0Shutdown 8 8 8 8 8 8 8Cumulative mainte-
nance 20 25 30 35 40 45 50Restart (2/yr) 486 753 682 595 517 460 453Restart (3/yr) 877 1026 939 852 771 742 763Total (2/yr) 514 786 720 638 565 513 511Total (3/yr) 905 1059 977 895 819 795 821
Electric Boat, with Overhaul Work
Current construction 0 20 40 40 40 40 40Shutdown 78 84 115 115 115 115 115Cumulative mainte-
nance 16 24 40 56 72 88 104Restart (2/yr) 337 693 976 1048 1058 1068 1078Restart (3/yr) 612 1023 1362 1430 1440 1450 1460Total (2/yr) 431 821 1171 1259 1285 1311 1337Total (3/yr) 706 1151 1557 1641 1667 1693 1719

154 The U.S. Submarine Production Base
Table C.21—continued
Case and Cost ($M) for Restart inCost Category FY98 FY99 FY00 FY01 FY02 FY03 FY04
Newport News, with Overhaul Work
Current construction 0 0 0 0 0 0 0Shutdown 53 53 53 53 53 53 53Cumulative mainte-
nance31 47 63 79 95 111 127
Restart (2/yr) 451 773 1023 1071 1081 1081 1081Restart (3/yr) 740 1113 1412 1463 1473 1473 1473Total (2/yr) 535 873 1139 1203 1229 1245 1261Total (3/yr) 824 1213 1528 1595 1621 1637 1653
Electric Boat, with SSN-23
Current construction 0 0 0 0 0 0 0Shutdown 44 50 58 83 87 90 134Cumulative mainte-
nance 0 0 0 8 16 24 72Restart (2/yr) 351 524 708 945 1078 1555 1809Restart (3/yr) 633 828 1037 1334 1476 1886 2187Total (2/yr) 395 574 766 1036 1181 1669 2015Total (3/yr) 677 878 1095 1425 1579 2000 2393
NOTE: “Current construction” refers to effects on ships currently under construction. See textabove and in Chapter Three for further explanation of categories and assumptions. Significant fig-ures shown exaggerate precision of estimates to permit accounting for numbers of very differentsizes.

155
Appendix D
BRITISH PRODUCTION RESTART EXPERIENCE
Great Britain has a long history of submarine construction and operates theworld’s third largest nuclear submarine force. Their nuclear submarine pro-gram began in the late 1950s and their first SSN, the Dreadnought, waslaunched in 1963 (see Figure D.1). The Dreadnought was a joint technology ef-fort with a British-designed forward section and a U.S.-provided nuclear reactor(similar to the propulsion system of the USS Skate class). Currently, GreatBritain’s naval forces include some 12 nuclear attack submarines, several bal-listic missile submarines, and a small number of both newer and older diesel-powered attack submarines. Structural and operating characteristics of Britishsubmarine classes are presented in Table D.1.
Great Britain is in the process of procuring a new class of ballistic missile sub-marines (Vanguard) to replace the Polaris-equipped Resolution class. They arealso completing production of a fleet of four new diesel-powered submarines,the Upholder class. The last three of these boats are being built by Cammell-Laird, a yard that restarted conventional submarine production after a hiatus ofalmost two decades. This reconstitution of submarine production is of primaryinterest to our research. Appendix D examines the submarine production pro-cess in Great Britain and discusses the recent experiences at Cammell-Laird.
THE DESIGN AND PRODUCTION OF SUBMARINESIN GREAT BRITAIN
Organizations Involved in Design and Construction
The Sea System Controllerate of the Procurement Executive of the Ministry ofDefence (MOD) develops the conceptual designs and manages the varioussubmarine construction programs for the Royal Navy. Vickers Shipbuilding andEngineering Limited (VSEL) is the main submarine design and constructionagent in Great Britain. Vickers’s primary submarine construction facility is atBarrow-in-Furness, although they also build submarines at the Cammell-Lairdyard, which became part of VSEL after the denationalization of British

156 The U.S. Submarine Production Base
RANDMR456-D.1
SSBN
1958 60 62 64
SSN
SS
200066 68 72 74 76 78 80 82 84 86 88 90 92 94 96 98
���
Resolutionclass
Vanguardclass
Resolution
Revenge
Renown
Repulse
Vanguard
Vigilant
Victorious
Dreadnought class Trafalgar
Torbay
Tireless
TurbulentDreadnoughtTrafalgar
class
Triumph
Talent
Trenchant
Swiftsure
Sceptre
Superb
Sovereign
Swiftsure class
Splendid
Spartan
Valiant
Conqueror
Churchill
Warsprite
Valiant and Churchill class
Courageous
Upholder
Unicorn
Ursula
UnseenUpholderclass
Otter
Opossum
Ocelot
OracleOberon class
Osiris
Opportune
������������������Produced at Vickers Shipyard
Produced at Cammel-Laird Shipyard
Produced at HM Dockyard, Chatham��
CommissionLaunchLaid down
70
Figure D.1—Production and Commissioning History of British Nuclear Submarines
Table D.1
British Submarine Characteristics
Class NumberDisplacementa
(tons)Speeda
(knots)Length
(ft)Diameter
(ft) Crew Size
Vanguard 3b 15,000 –25 492 42 135Resolution 4 8,500 –25 425 33 143Dreadnought 1 4,000 –30 265 32 88Trafalgar 7 5,208 –32 280 32 97Swiftsure 6 4,900 –30 272 32 116Valiant &
Churchill5 4,800 28 285 33 116
Upholder 4 2,455 20 230 25 47Oberon 6 2,410 17 295 27 69
SOURCE: Jane’s Fighting Ships, various years.aSubmerged.bOne to be authorized.

British Production Restart Experience 157
Shipbuilders in 1986.1 In addition to submarines, VSEL designs and buildsnaval surface ships, manufactures various towed and self-propelled artillery,and has commercial ventures that include foreign military sales.
VSEL has not been capable of designing and delivering a complete operationalsystem. The MOD contracts directly with a number of firms for the design andproduction of various weapons, fire control, and sonar subsystems on the sub-marines. The MOD provides these items to VSEL but has maintained respon-sibility for their integration. MOD intends to transfer this responsibility under aprime contract, after which it would retain design authority over the submarineand its major subsystems.
As there is effectively a sole supplier for submarines, the MOD relies on com-petition at the subcontract level to control prices. Vickers subcontracts for anumber of submarine subsystems, including at times portions of the major hullstructure. One of these subcontractors is Rolls Royce and Associates, who de-sign and procure the naval nuclear propulsion plant.2
MOD insists that a certain proportion of the shipbuilding work be put up forsuch subcontracting even if the shipbuilder has the capability to do the work.Suppliers are not limited to British companies. Despite MOD’s desire to main-tain competition among subcontractors, the low historical production rate(roughly one per year) has necessarily resulted in several single-source ar-rangements for various subsystems. MOD has a core of cost accountants andcost estimators to assess the appropriateness of subcontractor costs. Theyjudge whether anticipated costs should be reduced or completely disallowed.MOD’s cost engineers use a variety of estimating techniques and historicalcontract data to estimate future costs. They avoid cost plus contracts and seekto agree on a firm price before a contract is awarded to ensure that the maxi-mum incentive is placed on the contractor.
Organizations Involved in Overhaul and Refueling
Submarine overhauls, especially reactor refueling, take place at the specializedRoyal dockyards. Nuclear overhaul is much more difficult than the nuclear as-pects of new construction, in that it requires special facilities and skills to han-dle the irradiated fuel. VSEL looked into the possibility of bidding for refitting
______________1VSEL acquired Cammell-Laird in 1985.2Rolls Royce and Associates (RRA) is owned by the Rolls Royce Industrial Power Group (IPG). RRAwas created through the 1958 U.S./UK bilateral agreement for mutual cooperation in defense mat-ters. The UK strictly adheres to the principles of this agreement in all nuclear issues. The defensenuclear work performed by RRA is rigidly separated from the commercial nuclear work performedby Rolls Royce IPG.

158 The U.S. Submarine Production Base
work but, having taken into account the investment required in training andnuclear safety certification, concluded that they could not compete with theRoyal dockyards.3
The two Royal dockyards that have been used for submarine overhaul and re-fueling are Devonport in southwestern England and Rosyth in Scotland. Theseyards are owned by the government but operated by private companies. InJune 1993, the MOD decided to direct all future submarine work to Devonport.
Production Rates and Budget Cuts
The one-per-year production rate of submarines has remained fairly stable overthe past 30 years. Peaks in production activity have been most recently tied tothe new class of ballistic missile submarines. Vickers deals with such peaks bysubcontracting portions of the hull structure or by hiring temporary workers.
Great Britain, like the United States, is in a period of declining defense followingthe breakup of the Soviet Union and the relaxation of tensions in the world. Asa result, production rates are expected to stretch out to one submarine every 18or 24 months. Citing the need for efficient progress of work—fabrication, out-fitting, and trials—and the need for a continuity of work to retain expertise,VSEL prefers that the production rate not drop below one submarine every 18months.
Specific effects of budget cuts include the cancellation of the equivalent to theU.S. Seawolf program and a reduction in the buy of the Upholder class from anoriginal ten to the current four. MOD officials are now designing and planningfor a production run of a Batch 2 Trafalgar-class attack submarine. This newclass involves minimum changes to the existing Trafalgar design. This is con-sidered to be the most economic way of procuring additional submarines tomaintain the desired force level.
The Barrow-in-Furness Yard and VSEL’s Response to Varying Demand
In addition to building submarines, VSEL’s Barrow-in-Furness yard has alsobuilt surface ships; for example, the aircraft carrier Invincible was constructedat Barrow. However, the recent award for the construction of a new helicoptercarrier represents the first surface ship to be built at Barrow in over a decade.4
______________3The Barrow location presents certain problems for the handling of “dirty” fuel. VSEL estimates itwould take seven years to attain the capability to refuel nuclear submarines at their Barrow facility.4The hull will be built to commercial standards at a yard with tanker experience. It will then betransported to Vickers for outfitting. The resulting costs are expected to be approximately half of amilitary specification helicopter carrier.

British Production Restart Experience 159
(This contract award is being contested.) Employment at Barrow is currentlyapproximately 7500, down from 14,500 in 1990. The workforce includesapproximately 600 submarine design engineers and naval architects.
VSEL recently invested almost £250 million in a new production facility termedthe Devonshire Dock Hall. This covered, modern facility contains accommo-dations for all necessary shops and support stores and was organized based onthe principles of modular submarine construction. The facility also provides forthe level launch of ships and submarines (the older method involved buildingon an inclined slipway). This new production facility is a key step in VSEL’sdrive for increased productivity and improved working conditions.
This facility was built because steady production was expected and availablecapacity was limited. Because of these limitations, Vanguard-class hull sectionswere built by other firms that did not have prior submarine construction expe-rience. While these firms had the basic structural steel expertise, VSEL foundthey needed to provide management and technical expertise and placed engi-neers and managers on-site. Some difficulties occurred, but were manageable.Although these other firms had a higher cost (approximately 20 percent) andexperienced schedule problems, they did suggest several useful process im-provements. But because of the capacity limitations and the expectation of aclass of 10 or 12 diesel submarines plus potential exports, submarine produc-tion at Cammell-Laird was restarted.
RESTARTING DIESEL SUBMARINE PRODUCTION
Building the Upholder class required meeting challenges both in the construc-tion of Britain’s first diesel submarine in 20 years and in the reinitiation of con-struction of submarines (of any kind) after a similar gap at Cammell-Laird.
Barrow-in-Furness
The MOD had decided on the construction of a new class of diesel submarinesbecause their current diesel boats (Oberon class) were approaching the end oftheir service life and they felt there was a valid operational role for diesel sub-marines as a compliment to the nuclear boats. The lead boat in the Upholderclass was designed and built by Vickers at Barrow-in-Furness.
The design stage was somewhat compressed and suffered from the lack of suffi-cient funds to adequately test various systems and construct mock-ups before
_______________________________________________________________________Swan Hunter, a British shipbuilder based at Wallsend on the River Tyne, announced it may beforced out of business after losing a bid to build this helicopter carrier for the Royal Navy.

160 The U.S. Submarine Production Base
they were placed on the lead boat. Several problems caused a delay in fieldingthe first of the class. The difficulties were associated with the main propulsionsystem and weapons handling and discharge. The general consensus was thatthe 20-year gap between diesel classes resulted in 20 years of technology“improvements” being built into the new class in one step. In addition, the dif-ficulty and complexity of fitting all the modern systems, except the nuclearpowerplant, into a smaller volume contributed to the delays. (The volumeavailable in the Upholder class is some 50 percent of that for the Trafalgarclass.) The original contract acceptance date for the lead boat was slipped byapproximately two and a half years and cost increased by more than 25 percent.
The British thus ran into production problems for a similar but more techni-cally sophisticated version of a type of ship that had been out of production fortwo decades.5 This occurred even though submarines of the last diesel classwere still operational and there remained a technical support staff familiar withthe basic hull, diesel propulsion, and other subsystems of the earlier boats. Theprincipal cause of the difficulties stemmed from insufficient testing and the lackof shore-based prototyping of the propulsion, weapons system, and other plantand equipment that had undergone improvements and technological ad-vancements from the Oberon class. VSEL officials told us that if they had to doit over again, they would prototype and test all new systems, leaving at least ayear between sea trials and launch of the second of the class.
Cammell-Laird
Cammell-Laird is a small shipyard with a long history of constructing navalships. Although they built two Resolution-class SSBNs and two Oberon-classSSNs in the 1960s, they had constructed only surface ships (destroyers, frigates,and support ships) for the two decades preceding the start of the threeUpholder-class diesel submarines. Cammell-Laird was restarting submarineconstruction after a hiatus of almost 20 years.
MOD requested competitive bids for the construction of the three follow-upUpholder-class boats in the mid-1980s. Vickers, Cammell-Laird, and a thirdshipbuilder submitted proposals. At the same time, naval shipbuilding in GreatBritain was denationalized, with Cammell-Laird becoming a subsidiary of VSEL.Given the corporate relationship, VSEL withdrew their bid for the Upholderconstruction. Cammell-Laird was awarded the contract in January 1986,6 be-
______________5This is typical of attempts to restart or duplicate advanced industrial facilities after a gap; see thediscussion in Chapter Four.6MOD and Cammell-Laird believed there would be a class of 12, plus additional foreign militarysales.

British Production Restart Experience 161
fore Vickers had completed production of the first boat. While industrial baseissues were considered, they did not have much effect on the decision, whichwas based almost entirely on price and value.
Since Cammell-Laird was “building to print,” the turmoil in the design of thefirst boat caused some slippage in the acceptance date for the last three boats.Original contract build times varied from 4 to 4.5 years. Experience with thefirst ship demonstrated that the original schedule estimates were inadequate(see Table D.2). Therefore, the rest of the boats were allotted additional time.Given these agreed-upon delays, Cammell-Laird successfully completed thethree boats on time and within budget. In fact, once some initial problems withdeficiencies in documentation of the construction process were corrected, thequality of the boats built at Cammell-Laird was as good as that at Barrow.Interestingly, the level of weld repairs at Cammell-Laird for their first boat wasless than the level at Barrow for the Upholder. This was attributed to the smallpool of experienced welders at Cammell-Laird. As the construction programexpanded to accommodate the second and third boats at Cammell-Laird, newpersonnel had to be hired and trained. This increase in production activity re-sulted in a dilution of the skill level of the welders and an increase in the num-ber of weld repairs for the last two boats. That is, the expansion of the weldingteam to accommodate the increased production resulted in some degradationof performance and quality.7 The successful cost and schedule achivements,however, rested upon careful planning, the good fortune of being able to drawon VSEL expertise, and considerable effort to apply that expertise throughtraining and consulting.
Table D.2
Upholder-Class Submarine Planned vs. Original Schedules
SubmarineClass Builder
ContractAward Date
OriginalPlannedDelivery
ActualDelivery
Difference(months)
Upholder VSEL Nov 1983 Jun 1988 6 Dec 1990 30Unseen CLS Jan 1986 Feb 1990 July 1991 16Ursula CLS Jan 1986 Oct 1991 May 1992 6
NOTE: Unseen and Ursula were delivered on time according to the revised schedule.
______________7A decrease in quality resulting from an expansion of the production program was also experiencedin the United States during the construction of the Los Angeles-class submarines and by severalpublic shipyards when overhaul workloads were significantly increased.

162 The U.S. Submarine Production Base
Given their corporate relationship and the fact that Cammell-Laird had notbuilt a submarine in almost 20 years, VSEL provided significant managerial andtechnical help to Cammell-Laird and assisted in the vendor relationships.Some of the hull rings for the first boat at Cammell-Laird were built at Barrowby VSEL. Cammell-Laird had a workforce experienced in building ships to mili-tary specifications and this workforce formed an adequate base for the subma-rine construction. They also had a production facility that was well suited forbuilding submarines.
The reconstitution of Cammell-Laird to build submarines included multipletraining courses, establishment of welder qualifications, the reconstitution ofthe quality control department, and a redefinition of all quality procedures. Agood deal of on-the-job training was provided by VSEL experts, includingbringing Cammell-Laird people to the Barrow facility to gain experience.During the first year, VSEL technical management and senior trade people con-ducted the program while Cammell-Laird staff gained experience. VSEL alsotransferred production tooling to the Cammell-Laird facility. All together, it wasnine to twelve months before production began at Cammell-Laird. Over thecourse of constructing the three submarines, the workforce at Cammell-Lairdincreased from 1000 to approximately 2500.
The end result was a successful program that met revised schedule and budgetgoals. However, the compression of the shipbuilding industry in Great Britainhas adversely affected Cammell-Laird. The shipyard closed after the delivery ofthe third Upholder-class submarine in 1993. Currently, VSEL is trying to sell theCammell-Laird shipyard. They have invested approximately £50 million, whichwill cover severance pay and expected losses in book value when the shipyard issold. The plan calls for the yard to be mothballed for about 12 months, to pre-serve the yard’s shipbuilding capability for the next year. The company is man-aging the shutdown to minimize the impact on its employees. The reduction offorce has been carried out in phases, and the company played an active role inretraining and relocating those being laid off.
Conclusion
The experience at Cammell-Laird suggests that submarine production can bereconstituted after a hiatus of several years if core knowledge and personnel withongoing submarine engineering and production experience are available and ifthe yard to be reconstituted has an adequate base of personnel skilled in militaryship construction. Clearly, the key element of this reconstitution was the transfu-sion of managerial and technical expertise from Vickers. Some hiring andtraining are certainly necessary, but the schedule and cost implications aremanageable.

British Production Restart Experience 163
In reflecting on the British experience when considering an extended gap inU.S. submarine production, it is important to keep in mind this availability ofcontinuous submarine production experience at another yard in the same cor-porate organization. It is also important to keep in mind that the submarinesbuilt at Cammell-Laird were diesel, not nuclear. The reconstitution of nuclearcapabilities, including licenses, facilities, and skilled personnel would havemade the problem much more difficult. It would have taken more time andbeen more expensive. VSEL and MOD contend that Cammell-Laird would nothave been considered if the Upholder class were nuclear-powered.


165
Appendix E
FRENCH PRODUCTION EXPERIENCE
France has a long history of building and operating submarines. Currently, theFrench fleet includes five nuclear ballistic submarines (Le Redoutable andL’Inflexible classes), with two more under construction (Le Triomphant class),six nuclear attack boats (Rubis class), and several older diesel attack submarines(Agosta and Daphne classes). Figure E.1 shows the production and commis-sioning history of the last five French submarine classes. Table E.1 identifiesnuclear submarine characteristics.
ORGANIZATIONAL STRUCTURE
The General Delegation for Armament (DGA), under the French Ministry ofDefense, is the main agency for the design, production, and repair of militaryweapon systems. The Directorate for Naval Construction (DCN) is the organi-zation within DGA responsible for naval ships, both submarines and surfaceships. DCN maintains a core of design engineers at their Paris headquartersand operates several shipyards throughout France. These shipyards are na-tionalized installations that build and maintain various types of ships and ship-board systems and act as home port for various ships in the French Navy.
For example, DCN Cherbourg provides the full-scale design and constructionfor all submarines in the French Navy. Most submarine repairs, including ma-jor overhauls and reactor refuelings, take place at Brest and Toulon, the homeports for the French Atlantic and Mediterranean fleets, respectively. Other DCNshipyards or state-owned organizations are responsible for various submarinesystems; for example, DCN Indret designs and builds the pressure vessels fornuclear reactors and Technicatome designs and builds the nuclear reactors.
THE DESIGN AGENT: DCN PARIS
The Paris headquarters of DCN houses the overall management functions andthe conceptual design teams. The French submarine technical community is

166 The U.S. Submarine Production Base
RANDMR456-E.1
SSBN
1958 60 62 64
SSN
SS
200066 68 72 74 76 78 80 82 84 86 88 90 92 94 96 98
����
Le Triomphant class (to date)
L’Inflexible
LeTriomphant
L’Indomptable
Le Tonnant
L’Inflexible class
Le Foudroyant
Le Redoubtable class
Émeraude
Perle
Saphir
Casabianca
Améthyste
Rubis class
Rubis
Beveziers
La Praya
Quessant
Agosta class
Agosta
Commission
Shipyard refurbished
First modular construction began
LeTéméraire
LaunchLaid down �Turquoise (halted)�
617
616
615 �612 & 614 overhauls
Le Terrible612
613
614
Le Redoutable611
610
607
606
605
604
603
602
601
623
622
621
620
70
Figure E.1—Production and Commissioning History of the Last FiveFrench Submarine Classes
Table E.1
French Submarine Characteristics
ClassNumber of
SubmarinesDisplacement
(tons)Length
(ft)Diameter
(ft) Crew Sizea
Rubis 7b 2,640 242 25 65+Le Redoubtable 5c 8,045 422 34.8 114+L’Inflexible 1 8,080 422 34.8 127+Le Triomphant 4d 12,700 453 41 110+
aFrench nuclear submarines are manned with two crews to allow them to remain at seafor the maximum amount of time.bAn eighth was canceled.cLe Redoutable was the first French nuclear-powered ballistic submarine.dFirst two are under construction, a third ordered, one or two more are to follow (originalplan was for six).
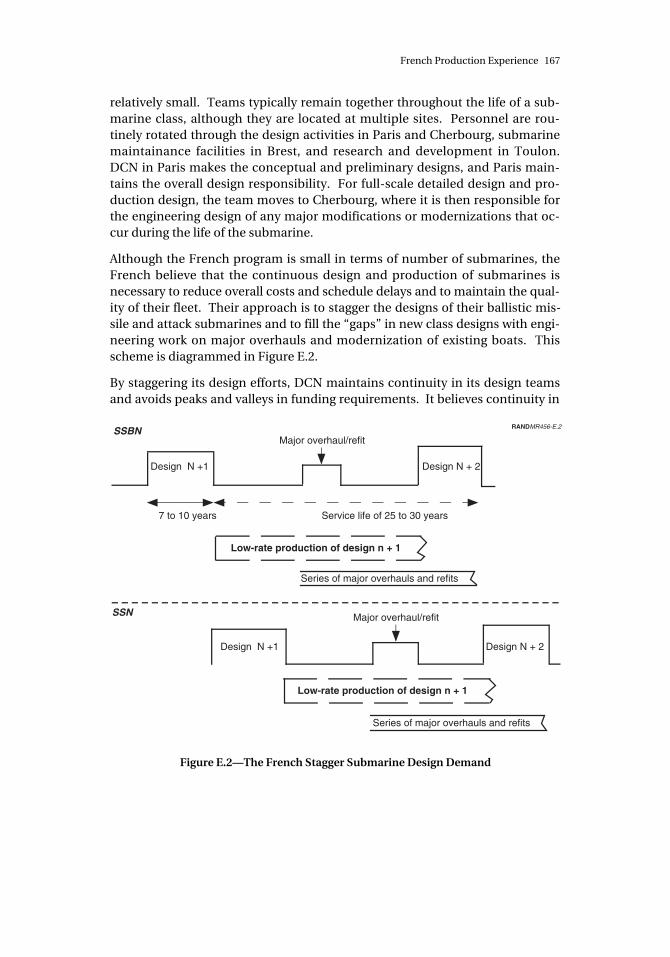
French Production Experience 167
relatively small. Teams typically remain together throughout the life of a sub-marine class, although they are located at multiple sites. Personnel are rou-tinely rotated through the design activities in Paris and Cherbourg, submarinemaintainance facilities in Brest, and research and development in Toulon.DCN in Paris makes the conceptual and preliminary designs, and Paris main-tains the overall design responsibility. For full-scale detailed design and pro-duction design, the team moves to Cherbourg, where it is then responsible forthe engineering design of any major modifications or modernizations that oc-cur during the life of the submarine.
Although the French program is small in terms of number of submarines, theFrench believe that the continuous design and production of submarines isnecessary to reduce overall costs and schedule delays and to maintain the qual-ity of their fleet. Their approach is to stagger the designs of their ballistic mis-sile and attack submarines and to fill the “gaps” in new class designs with engi-neering work on major overhauls and modernization of existing boats. Thisscheme is diagrammed in Figure E.2.
By staggering its design efforts, DCN maintains continuity in its design teamsand avoids peaks and valleys in funding requirements. It believes continuity in
RANDMR456-E.2
Design N +1
Major overhaul/refit
Design N + 2
7 to 10 years Service life of 25 to 30 years
Design N +1 Design N + 2
Low-rate production of design n + 1
Series of major overhauls and refits
Low-rate production of design n + 1
Series of major overhauls and refits
SSBN
SSN Major overhaul/refit
Figure E.2—The French Stagger Submarine Design Demand

168 The U.S. Submarine Production Base
actual practical designs is necessary to attract young engineers into the subma-rine field and to keep the best and brightest of those engineers. (This lendssupport to Appendix A’s conclusions regarding continuity of design expertise.)
Because the French build only a few of each design and produce at a very lowrate (one boat every two or three years), there is typically only one supplier forthe various submarine components. Despite the lack of competition, DCN be-lieves that low-rate production is necessary and preferable to stopping produc-tion for any period of time.
DCN is actively pursuing cooperative agreements with other countries such asthe United States and Great Britain. France, like its allies, is facing dramaticcuts in its defense budgets, and DCN feels that cooperative agreements andpartnerships are necessary to maintain French expertise in the submarine fieldin the future world of limited funding.
THE SHIPYARD: DCN CHERBOURG
DCN Cherbourg has over a century of experience in designing and buildingsubmarines and is the sole French shipyard for submarine construction.1 It isalso the home port for several smaller ships in the French Navy and providesrepair and maintenance for those ships. It has approximately 4500 full-timeemployees and hires local “temporary” subcontractors based on the workload.At Cherbourg, approximately 730 people are involved in submarine design, in-cluding some 130 engineers and 600 technicians.
Although Cherbourg is a very old shipyard with some facilities dating from thedays of Napoleon, the French have recently invested nearly 3 billion francs innew production facilities that use modern construction techniques. The facili-ties and the permanent workforce are sized to produce one submarine everytwo years. The facilities have the capability to surge to higher production rates,although additional temporary hires would be necessary to maintain higherrates. Currently, the lead boat in the Triomphant class of SSBNs is nearingcompletion and the second boat, Le Téméraire, is part way through the pro-duction cycle. The third submarine has been ordered and construction of oneor two additional boats in this class is planned.
______________1DCN Brest was also involved in submarine construction earlier in this century. Brest built its lastsubmarine (Daphne class) in the late sixties.
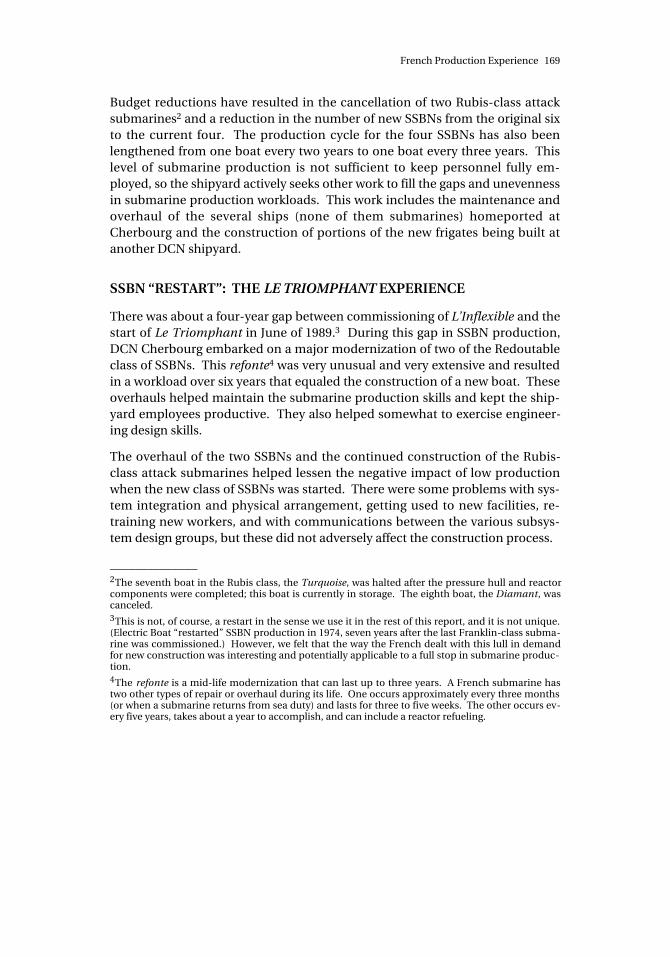
French Production Experience 169
Budget reductions have resulted in the cancellation of two Rubis-class attacksubmarines2 and a reduction in the number of new SSBNs from the original sixto the current four. The production cycle for the four SSBNs has also beenlengthened from one boat every two years to one boat every three years. Thislevel of submarine production is not sufficient to keep personnel fully em-ployed, so the shipyard actively seeks other work to fill the gaps and unevennessin submarine production workloads. This work includes the maintenance andoverhaul of the several ships (none of them submarines) homeported atCherbourg and the construction of portions of the new frigates being built atanother DCN shipyard.
SSBN “RESTART”: THE LE TRIOMPHANT EXPERIENCE
There was about a four-year gap between commissioning of L’Inflexible and thestart of Le Triomphant in June of 1989.3 During this gap in SSBN production,DCN Cherbourg embarked on a major modernization of two of the Redoutableclass of SSBNs. This refonte4 was very unusual and very extensive and resultedin a workload over six years that equaled the construction of a new boat. Theseoverhauls helped maintain the submarine production skills and kept the ship-yard employees productive. They also helped somewhat to exercise engineer-ing design skills.
The overhaul of the two SSBNs and the continued construction of the Rubis-class attack submarines helped lessen the negative impact of low productionwhen the new class of SSBNs was started. There were some problems with sys-tem integration and physical arrangement, getting used to new facilities, re-training new workers, and with communications between the various subsys-tem design groups, but these did not adversely affect the construction process.
______________2The seventh boat in the Rubis class, the Turquoise, was halted after the pressure hull and reactorcomponents were completed; this boat is currently in storage. The eighth boat, the Diamant, wascanceled.3This is not, of course, a restart in the sense we use it in the rest of this report, and it is not unique.(Electric Boat “restarted” SSBN production in 1974, seven years after the last Franklin-class subma-rine was commissioned.) However, we felt that the way the French dealt with this lull in demandfor new construction was interesting and potentially applicable to a full stop in submarine produc-tion.4The refonte is a mid-life modernization that can last up to three years. A French submarine hastwo other types of repair or overhaul during its life. One occurs approximately every three months(or when a submarine returns from sea duty) and lasts for three to five weeks. The other occurs ev-ery five years, takes about a year to accomplish, and can include a reactor refueling.

170 The U.S. Submarine Production Base
FUTURE OUTLOOK
With work on the two additional planned SSBNs, DCN Cherbourg managersfeel they can maintain the production skills of their workforce with their currentsubmarine program and with the inclusion of other production and overhaulwork. They also feel they can increase the production rate if needed by hiringadditional personnel from the local pool. These temporary hires usually have abackground in the desired skills. Furthermore, Cherbourg provides severalweeks of training to enhance the basic skills and the application of those skillsin the submarine construction area.
CONCLUSION
Although faced with very low production rates, DCN has decided that continu-ous production is preferred to stopping and starting the production lines. It hasconsolidated all submarine production capability in one shipyard (althoughseveral other shipyards work on subsystems) and has reduced its vendor sup-port to basically one contractor in each of the various systems. When neces-sary, the shipyards that perform overhauls are called upon for new constructionactivities. The viability of the French commercial nuclear industry helps main-tain nuclear capabilities for submarines. The French believe that submarineproduction skills can be maintained through overhaul and repair work and thatnew hires can be trained in submarine production skills given a basic compe-tency when hired.
The bigger concern for DCN is the maintenance of design skills—a concernshared by U.S. submarine builders. The leadership of DCN believes that, tomaintain a competence in submarine R&D, design and engineering, and newconstruction, a constant flow of new work must be maintained in the yards.Expertise at universities and in paper studies is not sufficient. Concern was alsoexpressed by DCN officials about sending negative signals to the next genera-tion of potential submarine designers if submarine production is allowed tostop for a period of time. With so few boats produced and a large gap betweennew classes of submarines, DCN must try hard to keep its design engineers ac-tively involved and interested in new submarine designs. DCN is currentlyfacing a gap in submarine design, and is actively seeking ways to fill that gap.Possibilities include the engineering work associated with the modernization ofthe Rubis-class submarines, mid-life modernization of the Triomphant class,design of a new class of attack submarines, and cooperative agreements withallies such as the United States and Great Britain.

171
Appendix F
WORKFORCE RECONSTITUTION MODEL ANDGENERIC RESULTS
Appendix F expands on Chapter Three’s analysis of rebuilding a productionworkforce.1 Here, we describe in detail the model whose results are given inthat chapter. We also elaborate on our analysis of factors influencing theschedule and cost consequences of rebuilding a production workforce in an in-dustry where production work is phasing down toward a hiatus or has alreadystopped. The analysis considers construction of a new attack submarine(NSSN) that is not expected to involve significantly different methods thanthose used in construction of current submarines (Trident, Los Angeles, andSeawolf classes). However, the approach and some of the results should beapplicable to construction of other types of ships and even to other industries.
The schedule and costs for the early submarines that would be produced after adecline in workforce depend on several factors, including the size of the work-force at restart, the rate of hiring, the experience level of new hires, the costs tohire and train, and the amount of fixed overhead costs. Because there is a sig-nificant degree of uncertainty regarding what values these factors would as-sume and how important they are relative to each other, we wanted to be ableto quantify schedule and cost effects over a range of values. It was for that rea-son that we constructed an analytic model.
The model begins with an initial workforce that evolves toward a steady statethrough hiring and attrition. The steady state is defined in terms of a predeter-mined annual production rate. If the initial workforce is smaller than thesteady-state workforce required to produce submarines at the predeterminedrate, then additional personnel are hired. If there are other construction pro-grams in the shipyard that are winding down, then workers released from theseprograms are available to the restart program.
______________1We consider only production workers. Supervisors, foremen, engineers, and indirect personnelare not explicitly included, but wrap rates account for their costs.

172 The U.S. Submarine Production Base
In the model, the workforce is not differentiated by occupational skill. In the realworld, shipyard managers must deal with all the factors included in this modelfor each category of workers—welders, riggers, electricians, etc. This implies asource of inefficiencies not addressed in the model. More important, skill mixdiffers between the start and end of submarine construction, but, in projectingworkforce buildup, the model cannot take that into account. Thus, whereworkforce drawdown profiles from Chapter Three and Appendix C suggest aninitial workforce of 1000 or 2000, these are mid- or end-phase workers comingoff submarine lines that are winding down. Initial-phase workers have sincedispersed. Because of this, the model results should be considered, particularlyin the early years following restart, as conservative estimates of the conse-quences of the various factors.
To determine effects on schedule, submarines are counted as delivered whensufficient man-hours of work have been completed. As for cost, we input thecost of a “typical” (or “steady-state”) submarine, which the model then aug-ments. The early submarine costs will be higher than the costs of “steady-state”submarines because of higher hiring and training costs; the relative inefficiencyof the rebuilding workforce, which is a result of larger numbers of unskilledworkers; and amortization of shipyard fixed overhead costs over fewer sub-marines during the rebuilding period.
This appendix is divided into two parts. First, we describe the parts of themodel that relate to workforce and workload analysis and the generic (non-shipyard-specific) schedule results yielded. Then, we turn to the estimation ofcosts and the generic results obtained from that effort.
SCHEDULE
In modeling workforce buildup and workload distribution, our objective was toquantify the effect of factors such as initial workforce size and attrition onschedule variables—that is, the time to produce the first ship and time to reachthe target annual production level. We discuss the methodology first, then thegeneric results.
Approach
Modeling the reconstitution of the workforce and its production entails answer-ing two questions: How fast can the workforce be rebuilt in terms of personsand person-hours per year and how do those hours translate into submarinecompletions in a way that allows for progress toward a stable, sustained rate ofproduction?

Workforce Reconstitution Model and Generic Results 173
Rebuilding the Workforce. The model is set up to represent the growth of aninitial workforce to some target level. For our generic analyses, a range of initialworkforces is used. For specific shipyard analyses, the initial workforce is de-termined from the numbers of workers laid off in recent years. We assume that,for restart in a given year, 90 percent of the workers released the previous yearcan be rehired, along with 20 percent of those released the year before that.(We understand from the shipyards that these are optimistic estimates, so ourreconstitution cost estimates are conservative on this account also.) The modelalso accommodates transfers from other shipyard work as workforce levels de-cline. These transfers occur each year until any existing work is totally phasedout.
The target workforce level is determined by the steady-state (target) productionrate, the steady-state number of worker-hours per submarine, and the numberof chargeable hours per worker-year.2 Using 1760 chargeable hours per worker-year and 10M (where M = million) hours per submarine, the workforce sizes forsteady-state production of one, two, and three submarines per year are 5682,11,364, and 17,045, respectively.
In the model, the workforce is distributed across 31 experience categories, cor-responding to 0 through 30 years. Each experience category is characterized by(1) a relative efficiency, (2) a relative compensation rate, (3) attrition rates (thepercentage leaving the workforce each year), and (4) the initial number of per-sonnel. The initial workforce is assumed to have no workers with fewer thanfive years of experience or more than 25 years of experience.3 This assumptionreflects the expected conditions in a declining industry, in which there has beenno hiring of entry-level workers for a few years and workforce reduction incen-tives have induced senior personnel to retire.
The relative efficiencies capture the inefficiency of a workforce that is undergo-ing a rebuilding process by hiring large numbers of unskilled personnel ascompared to a steady-state workforce that has significantly fewer unskilledworkers. Suppose that an unskilled worker can only do half the productivework of a fully skilled worker. In the model the unskilled worker would be char-acterized by a relative efficiency of 1/2 and would be credited with 1760/2 hoursof productive work per year. Workers at the lowest level would have the lowestefficiency and the efficiency values would increase with experience, reaching a
______________2The number of chargeable hours reflects those hours that workers charge to contract work. It ex-cludes vacations, holidays, sick days, jury duty, personal business, and any other charges that ac-crue against overhead or fringe benefits.3Several specific initial-workforce experience distributions were tested to determine their impacton various workforce characteristics, to ensure that the results presented here are not significantlyinfluenced by the choice of starting conditions.

174 The U.S. Submarine Production Base
maximum of one. Real-world data regarding relative efficiencies as a functionof years of experience are not readily available. For this study, we set the work-force relative efficiencies by years of experience as shown in Table F.1. Thesehypothetical values were reviewed by submarine industry personnel andjudged to be reasonable.
The relative compensation rates are based on representative submarine ship-yard pay scales (see Table F.2).
There are two sets of attrition rates, one that applies during the restart and an-other that applies to the steady state. Steady-state attrition rates are given inTable F.3. Although the shipyards do not have attrition data by experience
Table F.1
Assumed Relative Efficienciesby Experience Level
Years ofExperience
RelativeEfficiency
0 0.401 0.502 0.603 0.704 0.805 0.856 0.907 0.928 0.939 0.9410 0.9511 0.9612 0.9713 0.9814 0.9915+ 1.00
Table F.2
Assumed Relative Compensation Rates by Experience Level
Years ofExperience
RelativeCompensation
0–4 0.65 0.76 0.87+ 1.0

Workforce Reconstitution Model and Generic Results 175
Table F.3
Assumed Steady-State AttritionRates by Experience Level
Years ofExperience
Annual AttritionRate (%)
0–8 59–12 413–16 317–20 221–24 125–28 0.529 030 100
level, these values seem reasonable for two reasons. First, they decrease withexperience, which is generally believed to be true. Second, they result in asteady-state distribution of headcount by years of experience that is reasonablyclose to the actual recent distribution in the shipyards, where the workforce hasmatured. In the model, attrition is removed before the workers at each levelmove up in experience. (The model works in annual steps.) The attrition rate atthe 30-year level is set to 100 percent to prevent accumulation of a top-heavyworkforce.
Several alternative early attrition rates are discussed below. These early ratesoperate for the first five years of a restart.
An important characteristic of the model dynamics is that new workers can behired only at the lowest apprentice level (zero experience), and the maximumnumber of new hires each year is determined by the number of workers havingat least five years of experience and by a mentor: trainee ratio. This ensuresthat there is some specified number of skilled workers to serve as mentors toapprentice-level workers. Semiskilled workers (those with two through fouryears of experience) cannot serve as mentors, but do not require individualmentoring. Mentoring ratios between 1:1 and 1:5 were examined.
The elements of the model described to this point permit analysis of the work-force buildup, and the total and effective worker-hours by year. The workforcebuildup is simply the growth in size of the workforce each year as the result ofhiring and attrition. After some number of years, the workforce reaches the tar-get level for steady-state production, beyond which the distribution across ex-perience levels evolves to a steady-state condition.
The total workforce hours each year is the number of workers times the numberof chargeable hours (1760) per worker-year. If all workers were in the highest

176 The U.S. Submarine Production Base
skilled brackets, then the amount of effective, or productive, work would be thesame as the chargeable hours. With a mix of workers across all levels of experi-ence, the number of effective hours will be less than the number of chargeablehours. The rebuilding workforce takes longer than the steady-state workforceto accumulate the number of effective hours necessary to complete a subma-rine because of the larger portion of unskilled workers and the smaller size ofthe initial workforce.4
Completing Submarines. The steady-state workforce is sized to start andcomplete one, two, or three submarines per year. Of course, for any given year,the ones started are different from the ones finished, because it takes(nominally) six years to build a submarine. Thus a shipyard sized to produce(on average) one submarine per year would have six submarines in variousstages of construction in the yard at any given time (on average). For simplicity,we assume that the work required to build a submarine can be equally dividedover the six years. Then, a “balanced” shipyard—one with a stable “age distri-bution” of submarines under construction—would at the end of a given yearhave one submarine 1/6 complete, another 2/6 complete, and so on, with thelast ready to deliver. Summing these values indicates that a “balanced” yardhas 3.5 equivalent submarines at the end of the year, one in completed formand 2.5 as work in process (WIP). Similarly, at the end of each six-month pe-riod, a “balanced,” two-submarines-per-year yard will have one complete and5.5 equivalent WIP submarines; and at the end of each four-month period, a“balanced,” three-submarines-per-year yard will have one complete and 8.5equivalent WIP submarines.
The model does not explicitly distribute the work output across submarines.Instead, it counts deliveries if at year’s end enough effective worker-hours havebeen accumulated to reach or exceed the end-of-year balanced-yard WIP. Forexample, in a one-submarine-per-year yard, enough worker hours to build 3.5submarines must have been accumulated (leaving 2.5 WIP subs after delivery).This rule can be used to determine steady-state deliveries, but it can presentproblems when used to determine early deliveries. In cases where the initialworkforce is a significant percentage of the steady-state workforce, the modelwill accumulate sufficient WIP to indicate submarine deliveries in less than sixyears. This is not consistent with current submarine construction experienceand six years is used as the minimum.
______________4The model is based on a nominal submarine that requires a constant number of effective hours toproduce. The analyses presented here are based on a submarine to whose construction a steady-state workforce would charge 10 million hours. For the cases examined in this study, the corre-sponding number of effective worker-hours is in the neighborhood of 8.8 million. A workforce shortof steady state would charge more than 10 million hours to build the same 8.8-million-effective-hour submarine.
Workforce Reconstitution Model and Generic Results 177
A key question in rebuilding a submarine construction workforce is, when canthat workforce sustain a steady-state production rate that will maintain the de-sired fleet size? Figure F.1 shows an example of the profile of WIP and deliveriesfor restart of a three-ships-per-year yard using the rule described above.Deliveries see-saw between zero and one per year from years 6 through 14, thenbetween two and three for years 15 through 18. In year 19, the sustained rate ofthree is reached. Examination of many such model-generated initial deliverypatterns resulted in the judgment that a steady-state rate of three ships per yearis achieved with delivery of the eighth submarine. Similarly, steady state for atwo-ships-per-year yard is achieved with the fifth delivery, and the second de-livery constitutes rate achievement for a one-ship-per-year yard.5
Generic Results
We now present model results indicating the effects of variations in initialworkforce size, attrition, and mentoring ratio on postrestart schedule, for
RANDMR456-F.1
Equ
ival
ent s
ubm
arin
es
9
8
7
6
5
4
3
00 5 10 15 20
����������WIP
Deliveries
Years after restart
2
1
25
Figure F.1—Sample Postrestart Profile of Work in Progress and Deliveries, forSustained Production Rate of Three per Year
______________5Note that WIP in Figure F.1 stabilizes around 8. If WIP has reached 8.5 or more at year’s end,enough submarines are counted as delivered to bring the WIP below 8.5. Thus, end-of-year WIPcould run anywhere from 7.5 to 8.4, with numbers near 8 being typical.

178 The U.S. Submarine Production Base
maximum production rates of one, two, and three submarines per year. We re-port the two schedule variables mentioned above—time to first delivery andtime to reach sustained production rate. The first is important because, whenapplied to a specific shipyard scenario, it indicates how far in advance of a re-quired delivery date production must be restarted and thus limits the length ofa production gap. The second is important because it indicates when a ship-yard is able to maintain a given force level under steady-state conditions (e.g., aforce level of 60 submarines when the sustained rate is two ships per year with aservice life of 30 years).
As the size of the initial workforce increases, the time required to deliver thefirst submarine and to reach rate decrease (see Figures F.2, F.3, and F.46).Starting with only 250 skilled workers, a rebuilding shipyard will require about12 years to reach a sustained production rate of one ship per year, about 15.5years to reach two per year, and about 17.5 to reach three per year. If the initialworkforce is instead 2000, only about half as much time is required to reach thesustained rate. For production rates of two or three, however, even these timesare roughly two to four years longer than those required for first delivery (theminimum six for workforces of 1000 or more).7
We tested three sets of early attrition rates. For the cases shown above (and forthe results in Chapter Three and Appendix C), early attrition rates were set low(see Table F.4); they represent the most optimistic values for a rebuilding ship-yard. The most pessimistic set was necessary for the model to produce totalworkforce average attrition rates of nearly 30 percent per year, which were ex-perienced by Electric Boat in the early to middle 1970s when EB was expandingtheir workforce for the early Trident- and Los Angeles-class construction.
The early attrition rate does not have a great deal of influence on schedule orcost (see Figure F.5). For an initial workforce of 250 (shown), going from low tomedium attrition adds about one year to the time to reach sustained rate, andgoing from medium to high adds between one and two years. For larger initialworkforces, the sensitivity is reduced.
______________6Note that time to reach first delivery is independent of the target production rate. We show it forall three rates to ease comparison with time to reach rate.7Note that although workforces of 250 and 1000 approximate the residual cadre and overhaulworkforces for cases reported in Chapter Three and Appendix C, these results are different becausein the specific shipyard scenarios, transfers are available.

Workforce Reconstitution Model and Generic Results 179
RANDMR456-F.2
Initi
al w
orkf
orce
2,000
1,500
1,000
0 2 4 6 8
Years after restart
500
250
1810 12 14 16
��������
1st delivery
Sustained rate
Figure F.2—Time to Achieve First Delivery and aSustained Production Rate of One per Year
RANDMR456-F.3
Initi
al w
orkf
orce
2,000
1,500
1,000
0 2 4 6 8
Years after restart
500
250
1810 12 14 16
��������
1st delivery
Sustained rate
Figure F.3—Time to Achieve First Delivery and aSustained Production Rate of Two per Year

180 The U.S. Submarine Production Base
RANDMR456-F.4
Initi
al w
orkf
orce
2,000
1,500
1,000
0 2 4 6 8
Years after restart
500
250
1810 12 14 16
��������
1st delivery
Sustained rate
Figure F.4—Time to Achieve First Delivery and aSustained Production Rate of Three per Year
The mentor:trainee ratio is much more influential. In results presented so far,the ratio has been one skilled worker for two trainees. As shown in Figure F.6,the time to achieve a sustained rate of three ships per year is halved going froma mentor:trainee ratio of 1:1 to 1:5.8 The largest change occurs between rates of1:1 and 1:2. The effect is not quite as large for lower steady-state rates. The re-
Table F.4
Tested Early Attrition Rates, by Experience Level
Years of Attrition Rate (percent)Experience Low Medium High
0 10 25 501 7.5 20 402 5 25 303 5 10 204 5 7.5 10
______________8The 1:1 ratio was obtained from a public shipyard. The smaller numbers reflect the possibility thatin time of need, such ratios are likely to be permitted.

Workforce Reconstitution Model and Generic Results 181
RANDMR456-F.5
One per year
Steady-state rate
Yea
rs to
ach
ieve
rat
e25
20
15
10
5
0
Low attrition
Medium attrition
High attrition����
����������
��������������
������������
Two per year Three per year
Figure F.5—Time to Achieve Rate Is Not Very Sensitive toLevel of Early Workforce Attrition
sults are for an initial workforce of 250 and for low early attrition. The sensitiv-ity is slightly reduced for larger initial workforces and for higher initial attritionrates.
COST
The measure of personnel-related reconstitution costs used in this study is howmuch more the submarines constructed during the workforce rebuilding periodcost than they would if they were produced at steady state. Because of the re-building process, the early submarines will cost more than the steady-statesubmarines to produce. This extra cost will dampen out with time as the deliv-ery rate builds up and the workforce matures into a steady-state distribution ofexperience levels. We now describe how we estimated the reconstitution costpenalty and show how it is influenced by the factors described above.

182 The U.S. Submarine Production Base
RANDMR456-F.6
Yea
rs to
ach
ieve
rat
e
25
20
15
10
5
01:1 1:2 1:3 1:4 1:5
������������3 per yr
2 per yr
1 per yr�������������������
��������
����������������
����
��������
��������
Mentor:trainee ratio
Figure F.6—Time to Achieve Sustained Rate Is Sensitiveto Mentor:Trainee Ratio
Approach
To determine the cost penalty, the model takes explicit account of the laborforce buildup, in terms of efficiencies and compensation rates; the costs of hir-ing and training, which will be disproportionately high during a restart; and theallocation of fixed overhead costs, which will be spread over fewer deliveriesduring the buildup. Labor efficiencies and compensation rates are built intothe model in the form of values for each level of experience, as already de-scribed. Treatment of the other items is described in the following paragraphs.
Because the model does not consider each individual worker skill category, rep-resentative average hiring and training costs are used. A $5000 cost is assessedfor each hire. The lowest five levels (0–4 years experience) are considered ap-prentice/semiskilled workers. Workers at these levels receive yearly training,and an annual training cost of $3000 is assessed. A worker who does not leavebefore completing the training will accrue a total of $15,000 of training costs.
Workforce Reconstitution Model and Generic Results 183
Workers who leave because of attrition incur training costs of $3000 per year forthose years they are in the program.9
The higher fixed overhead is a major part of the cost penalty, so the distributionof overhead between fixed and variable components is important. Because thedistribution between these components for future submarine production can-not be known precisely, we analyzed values of $50M, $100M and $150M of fixedshipyard overhead. These values span the range of expected distribution be-tween fixed and variable costs.
For our nominal (steady-state) submarine costing $600 million when producedat three per year, we assume that $150 million is for overhead accruing to thatship (this is not the shipyard overhead figure just mentioned) and the other$450 million is for direct labor and material.10 The submarine will bear one-third of the fixed shipyard overhead; if the latter is $150 million, the submarinewould thus be charged $50 million. The other $100 million of overhead accru-ing to that submarine would be variable.11
In Table F.5, we show the distribution of costs for the case just described andfor others with lower production rates or shipyard overhead. The case de-scribed is at the lower right in the table. Lowering the production rate—movingto the left across the table—will increase the fixed overhead allocated to eachsubmarine but should not change the variable overhead. Reducing the fixedshipyard overhead—moving up the third column—naturally reduces propor-tionally the amount borne by each ship and raises the variable overhead toreach the $150 million per ship total assumed for three ships per year. The ef-fect of moving from the high fixed shipyard overhead to the low value is toquadruple the variable: fixed ratio for each production rate.
As stated above, the purpose of the model is to analyze the inefficiencies asso-ciated with rebuilding a workforce. Consequently, we assume that the steady-state direct labor and material costs are the same, regardless of production rateor total quantity produced. “Learning” or “cost improvement,” excepting whatis inherent in the rebuilding of the workforce, is ignored. (Shipyard experienceindicates that submarine learning curves are fairly flat.)
______________9The model does not, of course, track workers individually. At any given end-of-year step, the ap-propriate attrition rate is applied to the number of workers in each experience cohort and the num-ber of workers remaining is multiplied by $3000 if the cohort now has 1–4 years of experience.10$300 million is for labor and $150 million is for material. The latter covers shipbuilder materialand does not include government-furnished equipment such as the reactor, combat systems, etc.The $600 million shipyard cost may be between 50 and 70 percent of the total submarine cost, de-pending on the cost of the government-furnished equipment.11If the distribution of cost between direct and overhead does not look quite right to readers un-familiar with shipyard accounting, the direct labor cost ($300 million here) includes certain itemssuch as fringe benefits that are considered overhead in other industries.

184 The U.S. Submarine Production Base
Table F.5
Distributions of Fixed and Variable Overhead Costs Examined(millions of FY92 dollars per submarine)
Peak Production RateCost Element 1 per yr 2 per yr 3 per yr
Low fixed overheadDirect labor & material 450 450 450Variable overhead 133 133 133Fixed overhead 50 25 17Total cost 633 608 600
Medium fixed overheadDirect labor & material 450 450 450Variable overhead 117 117 117Fixed overhead 100 50 33Total cost 667 617 600
High fixed overheadDirect labor & material 450 450 450Variable overhead 100 100 100Fixed overhead 150 75 50Total cost 700 625 600
To determine the cost penalty associated with workforce reconstitution, themodel calculates the number of effective worker-hours available from theworkforce each year. Dividing this by the number of effective worker-hours persteady-state submarine results in the number of equivalent submarines pro-duced each year. Multiplying the number of equivalent submarines by thesteady-state submarine cost gives the cost for constructing those submarineswith a steady-state workforce. Subtracting this cost from the correspondingannual cost determined by the model for the rebuilding workforce yields theannual cost penalty for restarting. Summing this over the period from restart toachievement of steady state yields the total cost penalty.
The annual cost penalties are highest at the start of the rebuilding process.Because hiring is restricted to zero experience apprentices, there are cohorts ofworkers that work their way through the experience levels in the model andthere are corresponding fluctuations in the overall workforce efficiency. Thus,the annual cost penalties fluctuate with the changing composition of the re-building workforce while generally decreasing as the workforce builds up andimproves in overall efficiency. These fluctuations dampen out and the cumula-tive cost penalty approaches a steady-state value.
Generic Results
Figures F.7 through F.9 display the total reconstitution cost penalty for ship-yards with sustained production rates of one, two, and three ships per year. The

Workforce Reconstitution Model and Generic Results 185
0 500 1000 1500 2000 2500
RANDMR456-F.7
Cos
t pen
alty
($
billi
on)
2.0
1.5
1.0
0.5
0
Initial workforce
�������������������������
Fixed overhead $150M
Fixed overhead $100M
Fixed overhead $50M
����
��������
�����������
�����������
������
�������
Figure F.7—Workforce-Rebuilding Cost Penalty for a Sustained ProductionRate of One Ship per Year
RANDMR456-F.8
Cos
t pen
alty
($
billi
on)
2.0
1.5
1.0
0.5
00
Initial workforce
�������������������������
Fixed overhead $150M
Fixed overhead $100M
Fixed overhead $50M
500 1000 1500 2000 2500
����
��������
������
������������
����������
������
�������
Figure F.8—Workforce-Rebuilding Cost Penalty for a Sustained ProductionRate of Two Ships per Year

186 The U.S. Submarine Production Base
RANDMR456-F.9
Cos
t pen
alty
($
billi
on)
2.5
2.0
1.0
0.5
00 500 1000 1500 2000
Initial workforce
2500
�������������������������
Fixed overhead $150M
Fixed overhead $100M
Fixed overhead $50M
1.5
����
��������
�����������
�������������
�������������
Figure F.9—Workforce-Rebuilding Cost Penalty for a Sustained ProductionRate of Three Ships per Year
figures show the cost penalty as a function of the size of the initial workforce,and present three cases for fixed annual overhead values of $50M, $100M and$150M.
The penalties range from roughly $150 million to more than $2 billion. Thelatter amount, for high rate and fixed overhead and low initial workforce, isequivalent to the cost of more than three and a half (steady-state) submarines.Across the ranges of parameter values tested, the penalty increases substantiallywith fixed overhead, even more so with production rate, and most of all withdecreases in the initial workforce.
The results in Figures F.7 through F.9 were calculated with low early attritionrates. Increasing the early attrition from low to medium raises the cost penaltyby approximately 10 percent (when initial workforce is low and fixed overheadis high; see Figure F.10). Going from medium to high results in a cost penaltyincrease of between 15 and 20 percent.
In contrast to the attrition rate, the mentor:trainee ratio has a considerable ef-fect on the cost penalty. Raising the number of trainees per mentor from one tofive cuts the cost penalty by more than half (for low initial workforce and earlyattrition and high fixed overhead; see Figure F.11). (The results shown above allassume a 1:2 ratio.)

Workforce Reconstitution Model and Generic Results 187
RANDMR456-F.10
One per year
Steady-state rate
Cos
t pen
alty
($
billi
on)
3.0
2.0
1.5
1.0
0.5
0
Low attrition
Medium attrition
High attrition����
��������
��������������
������������
Two per year Three per year
2.5
Figure F.10—Increasing Attrition Raises the Cost Penalty Slightly
���������������
��������
�����������������
�����
��������
��������
RANDMR456-F.11
Cos
t pen
alty
($
billi
on)
3.5
3.0
2.5
2.0
1.5
01:1 1:2 1:3 1:4 1:5
������������3 per yr
2 per yr
1 per yr����
Mentor:trainee ratio
1.0
0.5
Figure F.11—The Cost Penalty Is Sensitive to the Mentor:Trainee Ratio


189
Appendix G
OPERATING AND SUPPORT COSTS
Appendix G presents background information regarding the operating andsupport (O&S) costs used in this study. The first section covers cost elementsand definitions. The following three sections give specific values for the 688class, Seawolf class, and NSSN, respectively.
ELEMENTS OF COST
Ship O&S costs are broken down into four major elements, with multiple sub-categories, in the Navy Visibility and Management of Operating and SupportCosts (VAMOSC) system.1 The following is a brief listing of the O&S elements:
Element
1.0 Direct unit costs
1.1 Personnel (officer and enlisted pay and allowances, and tem-porary additional duty costs)
1.2 Material (petroleum, oil, and lubricants; repair parts;supplies; equipment/equipage; consumables; expendables;ammunition; and reparables)
1.3 Purchased services
2.0 Direct intermediate maintenance
2.1 Afloat maintenance labor
2.2 Ashore maintenance labor
______________1Naval Center for Cost Analysis, Navy Visibility and Management of Operating and Support Costs(Navy VAMOSC), Individual Ships Report, Active Fleet Ships, Volume 1, Report Description, DD-I&L(A&AR) 1422 (Ships 5200), June 1992.

190 The U.S. Submarine Production Base
2.3 Material
3.0 Direct depot maintenance
3.1 Scheduled ship overhaul (public and private shipyardcosts for labor, material, and overhead to accomplishRegular overhauls (ROH), Engineered overhauls (EOH),Dry docking selected restricted availabilities (DSRA), andother overhaul categories).
3.2 Nonscheduled ship repairs (public and private shipyardcosts for labor, material and overhead to accomplish re-stricted availabilities (RAV) and technical availabilities(TAV)).
3.3 Fleet modernization (public and private shipyard costs for la-bor, material and overhead to install ship alterations and im-provements, including additional spares and other materialsfor the ship’s coordinated shipboard allowance list).
3.4 Other depot (labor, material and overhead costs for navalaviation depot work; installation of modifications to equip-ment managed by the Space and Naval Warfare SystemsCommand; rework of ordnance equipment, hull, mechanicaland electrical equipment, and electronic equipment; and de-sign services allocation to cover drawing and technical datamaintenance and updating).
4.0 Indirect operating and support
4.1 Training (cost of “C” and “F” course training for officers andenlisted).
4.2 Publications (replenishment of shipboard publications).
4.3 Engineering and technical services (cost of services providedoutside of intermediate maintenance or depot availabilities).
4.4 Ammunition handling (cost of onload/offload by CONUScoastal handling stations).
VAMOSC does not currently include costs of two major depot activities for nu-clear-powered vessels: refuelings, termed engineered refueling overhaul (ERO)for the 688 class, and decommissionings or inactivations (INAC).
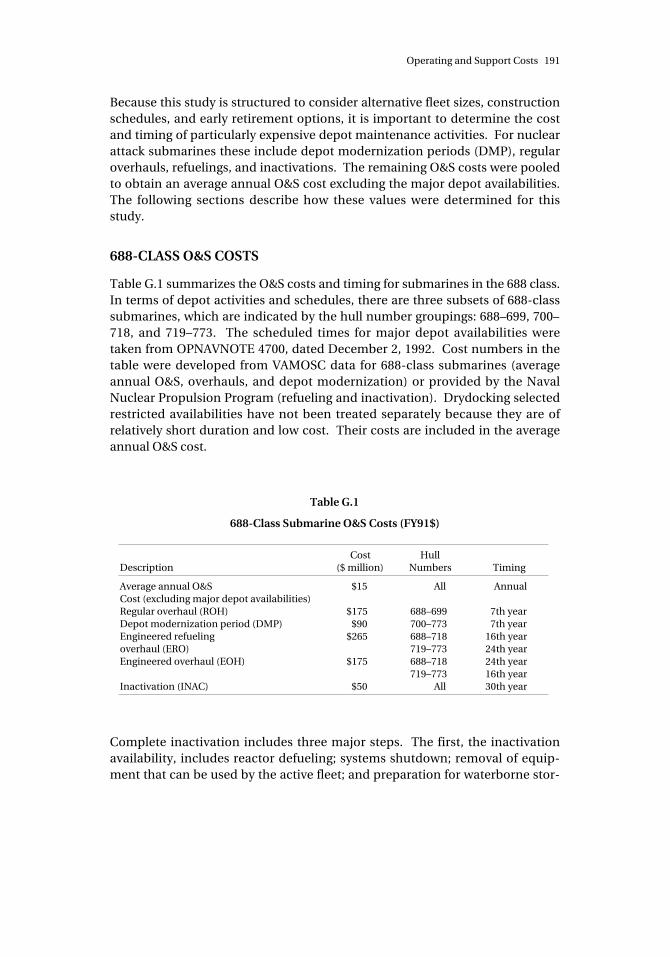
Operating and Support Costs 191
Because this study is structured to consider alternative fleet sizes, constructionschedules, and early retirement options, it is important to determine the costand timing of particularly expensive depot maintenance activities. For nuclearattack submarines these include depot modernization periods (DMP), regularoverhauls, refuelings, and inactivations. The remaining O&S costs were pooledto obtain an average annual O&S cost excluding the major depot availabilities.The following sections describe how these values were determined for thisstudy.
688-CLASS O&S COSTS
Table G.1 summarizes the O&S costs and timing for submarines in the 688 class.In terms of depot activities and schedules, there are three subsets of 688-classsubmarines, which are indicated by the hull number groupings: 688–699, 700–718, and 719–773. The scheduled times for major depot availabilities weretaken from OPNAVNOTE 4700, dated December 2, 1992. Cost numbers in thetable were developed from VAMOSC data for 688-class submarines (averageannual O&S, overhauls, and depot modernization) or provided by the NavalNuclear Propulsion Program (refueling and inactivation). Drydocking selectedrestricted availabilities have not been treated separately because they are ofrelatively short duration and low cost. Their costs are included in the averageannual O&S cost.
Table G.1
688-Class Submarine O&S Costs (FY91$)
DescriptionCost
($ million)Hull
Numbers Timing
Average annual O&S $15 All AnnualCost (excluding major depot availabilities)Regular overhaul (ROH) $175 688–699 7th yearDepot modernization period (DMP) $90 700–773 7th yearEngineered refueling $265 688–718 16th yearoverhaul (ERO) 719–773 24th yearEngineered overhaul (EOH) $175 688–718
719–77324th year16th year
Inactivation (INAC) $50 All 30th year
Complete inactivation includes three major steps. The first, the inactivationavailability, includes reactor defueling; systems shutdown; removal of equip-ment that can be used by the active fleet; and preparation for waterborne stor-

192 The U.S. Submarine Production Base
age if recycling will not take place immediately, modifications to permit towingto Puget Sound Naval Shipyard (if not there already), and missile compartmentdismantlement for ballistic missile submarines. The second is removal anddisposal of the defueled reactor compartment. The third, recycling, involvestotal dismantlement of the remaining portions of the submarine, with usefulequipment put into inventories for possible future use and everything else soldfor scrap. The $50M represents a typical value covering all three steps for all688-class submarines.2
SEAWOLF-CLASS O&S COSTS
The Seawolf-class submarines will have a propulsion system that will last thelife of the ship (30 years) without refueling. For the analyses in this study, theSeawolf-class O&S costs are derived from the O&S section in the December1992 Selected Acquisition Report (SAR). The annual depot cost was multipliedby 30 to obtain the total lifetime depot cost. This was then divided by three toobtain a representative overhaul cost to apply in the 7th, 16th, and 24th years,following the pattern of the 688 class.3 This yielded $200M per overhaul, inround numbers. The remaining costs ($17M per year) were used as the annualO&S cost. It was assumed that Seawolf inactivation would not be significantlydifferent from the 688 class and $50M was used as the inactivation cost.
NSSN O&S COSTS
The NSSN is undergoing initial concept definition and its characteristics are notyet fully identified. Alternatives being considered range from roughly the 688class to the Seawolf class. For this study, it was assumed that the NSSNs wouldhave a power plant that would last the life of the submarine. All costs were as-sumed to be similar to the 688 class: average annual O&S of $15M, overhaulcosts of $175M (occurring at the 7th, 16th, and 24th years4), and inactivationcosts of $50M.
______________2This value is based on the planning estimate for inactivation of SSN-689 at Mare Island NavalShipyard plus completion of the total inactivation at Puget Sound. It does not reflect taking advan-tage of the economies suggested in the General Accounting Office (GAO) report NuclearSubmarines: Navy Efforts to Reduce Inactivation Costs, GAO/NSIAD-92-134, July 1992.3The Navy has recently informed us that there will be only one overhaul for the Seawolf class, atmidlife. The effect of this change on our cost analysis would be negligible, as the total depot costwould be the same.4The previous note applies also to the NSSN.