The relationship of hemispheric dominance to attitudes and ...
167
University of Massachuses Amherst ScholarWorks@UMass Amherst Doctoral Dissertations 1896 - February 2014 1-1-1984 e relationship of hemispheric dominance to aitudes and aitude change among high school students : an exploration. Beverly A. Mawn University of Massachuses Amherst Follow this and additional works at: hps://scholarworks.umass.edu/dissertations_1 is Open Access Dissertation is brought to you for free and open access by ScholarWorks@UMass Amherst. It has been accepted for inclusion in Doctoral Dissertations 1896 - February 2014 by an authorized administrator of ScholarWorks@UMass Amherst. For more information, please contact [email protected]. Recommended Citation Mawn, Beverly A., "e relationship of hemispheric dominance to aitudes and aitude change among high school students : an exploration." (1984). Doctoral Dissertations 1896 - February 2014. 3961. hps://scholarworks.umass.edu/dissertations_1/3961
Transcript of The relationship of hemispheric dominance to attitudes and ...

University of Massachusetts AmherstScholarWorks@UMass Amherst
Doctoral Dissertations 1896 - February 2014
1-1-1984
The relationship of hemispheric dominance toattitudes and attitude change among high schoolstudents : an exploration.Beverly A. MawnUniversity of Massachusetts Amherst
Follow this and additional works at: https://scholarworks.umass.edu/dissertations_1
This Open Access Dissertation is brought to you for free and open access by ScholarWorks@UMass Amherst. It has been accepted for inclusion inDoctoral Dissertations 1896 - February 2014 by an authorized administrator of ScholarWorks@UMass Amherst. For more information, please [email protected].
Recommended CitationMawn, Beverly A., "The relationship of hemispheric dominance to attitudes and attitude change among high school students : anexploration." (1984). Doctoral Dissertations 1896 - February 2014. 3961.https://scholarworks.umass.edu/dissertations_1/3961


THE RELATIONSHIP OF HEMISPHERIC DOMINANCE TO ATTITUDES AND ATTITUDE CHANGE AMONG HIGH SCHOOL STUDENTS
AN EXPLORATION
A Dissertation Presented
By
BEVERLY ANN MAWN
Submitted to the Graduate School of the University of Massachusetts in partial fulfillment
of the requirements for the degree of
DOCTOR OF EDUCATION
September 1984
School of Education

Beverly Ann Mawn
All Rights Reserved
THE RELATIONSHIP OF HEMISPHERIC DOMINANCE TO ATTITUDES
AND ATTITUDE CHANGE AMONG HIGH SCHOOL STUDENTS:
AN EXPLORATION
A Dissertation Presented
By
BEVERLY ANN MAWN
Approved as to style and content by:
fa^ y -> ^&C o & Doris Stockton, Member
iii

ACKNOWLEDGMENTS
The author is indebted to Dr. Richard J. Clark, Jr., Dr. Portia
Elliott, and Dr. Doris Stockton not only for the time and effort
that they spent during the planning, implementation and reporting of
this study, but for their warmth and encouragement throughout this
process.
Appreciation is also extended to Dr. Earl Seidman and Dr. William
Masalski for their guidance and support during the preliminary
stages of this work.
In addition, many thanks are extended to the following persons:
Dr. Mary A. Cullen, for her generous assistance in validating
the hemisphericity of the instructional materials.
Joseph Sheppeck and the students of The English High School,
Boston, MA, for their cooperation in the execution of the study.
Rick Mooney of the Research Consulting Service, School of
Education, University of Massachusetts/Amherst for his suggestions
on the statistical analysis.
My father, John, for his assistance in preparing the tables and
figures and for his unshakeable confidence in me.
My mother, Alice, for her unconditional love and nurturing.
My dear sister, Barbara, not only for all the typing through the
years, but also for her treasured friendship.
Special gratitude is given to my beloved friend Henri E. Lion, Jr
for his understanding and patience, and for his graphic art work.
iv

ABSTRACT
The Relationship of Hemispheric Dominance
To Attitudes and Attitude Change Among High School Students:
An Exploration
September 1984
Beverly A. Mawn, B.A., State University College at Brockport, N.Y.
M.Ed., University of Massachusetts, Ed.D., University of Massachusetts
Directed by: Professor Richard J. Clark, Jr.
Recent brain research shows parallels among Piaget's theory of
cognitive development, brain growth spurts, and hemispheric
specialization. These parallels may explain why some students, whose
primary mode of processing is visual, inductive, do not have the mental
capability to perform certain tasks in left-brain oriented classes and
schools that tend to favor verbal, deductive styles of learning.
"Brain-incompatible" instruction may contribute to students' poor
performance in problem solving, which requires dual hemispheric
engagement•
Weiner theorized that attributions of success and failure to
ability or effort will affect achievement-related behavior. Those
students who do not experience much success in a brain-incompatible
class may use their performance, based on ability and effort, and
social norms as cues to make causal judgments which in turn have an
impact upon achievement motivation.
This study used an instructional design that stimulated right
hemispheric processing complementary to the traditional left hemi
v

spheric orientation and examined its effect upon attitude toward
problem solving, self-confidence, and causal attributions. The topics
used for this study were systems of numeration, explorations with
numbers and numerals, and explorations with geometric figures. During
the first week of the study, the students completed: Your Style of
Learning and Thinking, the Mathematical Attribution Scale (MAS), and
the Attitude Scale. The quizzes following each topic of instruction
were intended to measure students’ preference for an instructional
mode. At the end of the term, MAS and the Attitude Scale were
administered again.
Because the sample size (n=5) was much smaller than anticipated,
caution was and should be used in interpreting and generalizing the
results.
Using biserial correlation coefficients on the pretest, a strong
correlation was found between left hemispheric dominance and
attributions of failure to effort.
The Q-statistic found students showed no preference for
cognitively compatible quizzes.
T-tests on the posttests showed generally a favorable change on
the failure attributions and unfavorable on success attributions. A
trend in improved attitude toward problem solving was reported.
Differences between the gain scores of the right mode with the left
mode was found on attitude toward problem solving and causal
attributions,
vi

TABLE OF CONTENTS
ACKNOWLEDGMENTS . . . ,
Chapter
I. INTRODUCTION
Context of the Problem. 1 Statement of the Problem . 4 Purpose of the Study. 9 Research Questions . 10 Definitions of Terms . 14 Implications of the Study. 15 Limitations. 17
Remaining Chapters . 19
II. LITERATURE REVIEW . 20
Mathematics Laboratories. 20 Adolescent Reasoning. 27 Problem solving . 36 Attribution Theory. 43 Summary of the Literature Review . 48
III. METHOD. 50
Introduction .
Pilot Study . Participants . Course Content.. •• Development of Instructional Procedures .
Results of the Pilot Study .
The Study . Participants .
Design of the Study . Instruments .
Research Question One . Research Question Two . Research Question Three .
Course Content . Modification of Instructional Procedures .
Data Collection and Analysis Procedures .
50 51 51 52 53 55 59 59 60 62 62 65 65 67 68 70
vii

TABLE OF CONTENTS (continued)
IV. RESULTS OF THE STUDY .
Introduction . Analysis of Data
Research Question One . . Hypothesis One . . . .
Research Question Two . . Hypothesis Two • • . .
Research Question Three . Hypothesis Three . . . Hypothesis Four . . . .
Summary of the Findings . .
73
73 73 76 76 77 77 79 81
V. SUMMARY, CONCLUSIONS, RECOMMENDATIONS
Summary of the Study .. 83
Results of the Study. 85 Conclusions. 87
Recommendations for Future Research . 90 Concluding Statement 91
SELECTED REFERENCES 93
APPENDICES
A. Course Topics and Objectives . 102
B. A Sample Packet of Course Activities and Exercises . . . 104
Sample Quiz. 122 C. The Revised Mathematics Attitude Scale used in
the Pilot Study .. 124 D. Form A of the Children's Form Your Style of Learning
and Thinking.122 Letter of Permission from Reynolds . 132 Form B of the Adult's Your Style of Learning and
Thinking.133 Letter of Permission from Torrance . 138
E. Confidence in Learning Mathematics Scale . 139 F. Effectance Motivation in Mathematics Scale . ^
G. Teacher Scale.1Zf3 H. Mathematics Attribution Scale . 145
I. Letter from Professor Mary Cullen Validating Hemispheric
Stimulation of Sample Activities.
J. Parental Release Form.*50 K. Data Collected During the Study.153
viii

LIST OF TABLES
1* Means and Standard Deviations for Your Style of Learning and Thinking. 57
2. T-values to Test the Statistical Significance of Attitude Scores Between Groups . 57
3. T-values to Test the Significance of Attitude Gain Scores. . 57 4. YSLT Means and Standard Deviations. 73 5. A Comparison of Pretests of the R-mode Group versus L-mode Group. 74
6. Biserial Correlation Coefficients between Cognitive Style and Attitudes. 75
7. A Comparison of Pretests of the Dropout Group versus the Study Group. 76
8. Summary of the Analysis of Variance of the Quizzes of the Study Group. 7 7
9. T-test for Gain Scores of the Study Group.78 10. Attitude Variables Statistics by Group . 79 11. A Comparison of the Gain Score of the R-mode Group versus
L-mode Group . 80

LIST OF FIGURES
1. Model for a Secondary School Mathematics Laboratory .... 28 2. A Sample of Specialized Functions of the Left and Right
Hemisphere Identified by Researchers . 33 3. A Sampling of Various Problem Solving Models . 38 4. Modeling Processes Used In Translating from One Mode of
Representation to Another Mode of Representation . 41 5. Attributional Model of Achievement Motivation . AA 6. Timeline Outlining the Instruction and Data Collection
Schedule...71
x

CHAPTER I
INTRODUCTION
Context of the Problem
While many students can acquire sufficient proficiency with
computational skills, their performance on applying skills and
problem solving is poor. Max Sobel wrote in the introductory
remarks to the Results from the Second Mathematics Assessment of the
National Assessment of Educational Progress (NAEP):
The results clearly indicated that the emphasis on basics has produced a generation of students who can compute but cannot apply their knowledge to real-life problems.(p.l)
Between the first assessment in 1973 and the second assessment
in 1978, the average performance level of the 17—year—olds declined
significantly at the process levels of skill, understanding and
application. During this same period, the 13-year-olds showed
significant declines, less than those of the 17—year—olds, on skill
and application exercises.
The results from the Third Mathematics Assessment of the NAEP
in 1982 indicate that the pattern of decline in the achievement
level of the 17-year-olds leveled off. Between 1978 and 1982 the
performance of the 13-year-olds improved significantly over every
1

content area. However, Thomas Carpenter reports:
2
The impressive gains made by the 13-year-olds are encouraging, yet a closer examination reveals that much of the positive change can be attributed to improved performance on items involving routine skills. In
general, students made much more modest gains or no gains at all on items assessing deep understanding or applications of mathematics.
Very little change occurred in problem solving performance between
1978 and 1982, with the exception of the 13-year-olds who showed
significant gains in solving routine problems found in textbooks and
practiced in school. Performance on problems that were less routine
and required some understanding showed no change, a finding
consistent with the 1973 and 1978 assessments.
Responses by students to affective exercises in the 1978 survey
of the second assessment revealed that students at all grade levels
perceived their role to be passive, i.e., to watch the teacher do
the work on the board and then to work similar problems at their
seats individually. Commenting on the 1982 assessment of students’
attitudes toward problem solving and mathematics, Carpenter says:
Students' attitudes toward mathematics as a discipline
indicate that they do not have an accurate picture of mathematics as an intellectual activity. Almost half the students thought that learning mathematics is mostly
memorizing, and only about half of them believed that mathematics is made up of unrelated topics or that new
discoveries are never made in mathematics.
In spite of our efforts to nurture logical reasoning, critical
thinking, and problem solving strategies, such results would
strongly suggest that in practice we place much more instructional
emphasis upon and devote more classtime to computation and rote

3
learning than comprehension and application. We shape our students'
thinking In a manner opposed to what we profess. In his more recent
writing, Mlndstorms, Seymour Papert (1980) refers to "Pop-Ed"
cultural conceptions that influence and operate upon our students'
thinking. The first is the "I don't get it" statements that
teachers so often hear students cry. Through such remarks students
reveal their frustration. Impatience, and lack of perseverance to
struggle with ideas. They do not see refining, revising, and
"debugging" as parts of a continuous learning process, nor do they
realise that frustration Is natural to learning, and that mastery is
gradual. Another student comment that Is equally corrosive, "I'm
not mathematically-minded," indicates how they look at success and
failure. When they are unable to perform a mathematical task
successfully, they conclude that they are totally deficient in
mathematics rather than specify the concepts and/or skills that they
lack. They see the source of the difficulty only within themselves.
These two misconceptions coupled with students' passive experience
in the classroom help explain the present crisis in the classroom.
In the computer age, such broadly based skills as critical
thinking and problem solving are quickly being recognized as basic
skills. The National Council of Teachers of Mathematics in Its An
Agenda for Action (1980) recommended that problem solving be the
first priority for school mathematics in the l9S0s. I he membets of
the mathematics education community must apply themselves in the
1980s to the task of incorporating more process- and content-oriented

4
material toward developing these skills as they did toward
developing the "basics" in the 1970s.
Statement of the Problem
The nature of school mathematics makes a dramatic shift from
concrete to abstract in the high school curricula, even though many
professional organizations have argued and still continue to argue
that the nature of mathematics is both concrete and abstract,
intuitive and formal. The high school mathematics curriculum
presumes the learner is a formal operational thinker in spite of
evidence to the contrary (Karplus, 1974; Dulit, 1972). In 1977 the
Conference Board of Mathematics and Science reported that high
school teachers had consistently refrained from experimenting with
teaching models other than a teacher-centered expository approach to
group instruction.
Since then, with the advent of the microcomputer into schools,
some teachers have seized the opportunity to vary instructional
approaches.
In 1982, Larry Hatfield reflected:
Perhaps an emerging reality for many mathematics
teacher educators is the presence of teachers, both
preservice and inservice, who are seeking guidance in the
acquisition and implementation of computing applications
into the mathematics classroom. (p•30)
During the last few years, staff development projects and teacher
education programs have offered survey courses in educational

5
computing and programming language courses. Many school systems
have introduced computer literacy courses and expanded their
computer science offerings with the increasingly available
microcomputer.
Hatfield goes on to say:
As teachers become involved in efforts to make
worthwhile applications of microcomputers, it may quickly be realized that effective utilizations which capitalize upon the potentials of the microcomputer involve knowledges and skills which the classroom teacher may not possess... (p.33) ....The conceptions which mathematics educators from preschool through college have held regarding the nature of the discipline of mathematics and its learning have typically not been influenced by modern computing tools....
The prospects for inexpensive microcomputers impacting upon the "doing" of mathematics are great. The issues involved in allowing such impacts to evolve...in many respects are not new.
(p. 35)
A parallel between an instructional computing evolution in the
1980s, the mathematics laboratory movement in the 1970s, and the
"new math" revolution in the 1960s may be drawn: the prospect for
change in the teaching of mathematics may rely upon and be limited
in part by the epistemology of teachers. Hatfield writes that many
educators believe that mathematics is a body of information to be
found in the textbook. In contrast, mathematics conceptualized as a
way of thinking about or processing a great range of problematic
situations experienced by people must be constructed and
reconstructed. These contrasting viewpoints will greatly influence
instructional planning in general and computing applications in
particular. Hatfield argues that this latter "constructivist”

6
orientation of experience, action and Individuality serve as the
rationale for multiusage instructional computing.
The constructivist framework was first articulated within the
field of cognitive developmental research (in particular, Piagetian)
that has historically focused on educational implications at the
elementary school level. The work of Jean Piaget, Jerome Bruner,
and Zolten Dienes laid the theoretical foundation for activity-based
curricula. They argued that instructional planning should fit the
developmental stages of the learner. They pointed out that the
natural progression of learning moves from the concrete to the more
abstract, the intuitive to the formal, from external to internal.
Activity and play were deemed important Ingredients to a learning
environment. Therefore they proposed that various modes of
presentation and representation of content would meet the
psychological and developmental needs of the learner. Many
elementary mathematics teachers began to address these issues during
the 1970s by exploring, modifying and/or adopting activity-based
learning and the use of manipulative materials.
The results of the use of manipulatives, materials and models
embodying mathematical concepts acquired by students' manipulation,
have been mixed (Suydam and Higgins, 1977). Younger and less able
students appear to benefit most in achievement gains from an
activity-enriched environment. The laboratory approach has had
little effect in attitudinal changes either at the elementary or
junior high level. However, the approach to evaluation and the

7
instruments used were often inappropriate for and insensitive to the
goals and objectives of a mathematics laboratory. With the trend to
back-to-basics and its accompanying call for accountability,
proponents for the laboratory strategy had to be defensive about
performance on traditional objectives.
Many researchers believe that rather than determine the
effectiveness of one teaching strategy over another, researchers
should examine the interaction of learner characteristics with
instructional strategies. Snow writes:
No matter how you try to make an instructional treatment better for someone, you will make it worse
for someone else — thus it becomes imperative that we attend to ways in which individual differences interact with treatments. (1976, p.293)
Since Cronbach and Snow proposed the aptitude X treatment
interaction (ATI) paradigm for research in 1957, researchers have
been trying to identify important characteristics of students that
match with an instructional strategy to maximize learning. During
the earlier years of ATI research, the aptitude variables were drawn
from the more traditional field of abilities, and outcomes were
restricted to subject matter achievement and specific skills.
Recently researchers have formulated ATI hypotheses upon the
construct of cognitive style rather than intellectual ability.
While intellectual ability tends to be content-specific, is value
directional, and is unipolar, cognitive style is more process
—differentiated and bipolar (Messick, 1976). oriented, is value

8
Cognitive style as an aptitude variable proves more useful,
particularly for outcomes other than achievement.
The assessment background data of Results from the Mathematics
Assessment of the Second NAEP showed that there was a substantial
decrease in enrollment of upper level mathematics classes. The
Results from the Third Mathematics Assessment of the National
Assessment of Education Progress found no pattern of change for
enrollment of 17-year-olds in traditional mathematics courses, with
the exception of computer science courses. (However, personal
observation, by Professors Elliott and Stockton, of increasing
enrollment at the local college level suggests that the next
assessment will reveal increased enrollment in upper level secondary
school courses as well.) Mathematics acts as a filter in career
path selection (Sells, 1976). The longer students enroll in
mathematics courses, the wider their options for career choices,
particularly for technical and scientific careers. For a variety of
reasons women and minorities fall into mathematics avoidance
patterns that will have serious repercussions for their futures
(Haertel, 1978). Early adolescence appears to be a critical time
for intervention (Hill, 1980). If one of our goals is to increase
enrollment in high school mathematics classes, then we must become
more concerned with motivation, attitudes, and personality
characteristics in the classroom.
Causal perception of success and failure can create cognitive
and affective reactions that can either facilitate or inhibit
achievement-related behavior (Weiner, 1974). In particular, those

9
students who have acquired a "learned helplessness" — who attribute
repeated failure to a misguided lack of ability -- do not expect to
achieve any future goals and believe that their own ability and
effort will remain stable and insufficient as always. In
self-defense, they will not attend to or apply themselves to the
task. Their attribution results in maladaptive behavior. Recent
intervention programs aimed to change misattributions among students
report positive results (Bar-Tal, 1978; Fennema et al., 1981).
For the most part high school mathematics teaching has taken a
singular approach to content and method which capitalizes on some of
our students’ strengths and emphasizes others' weaknesses. The use
of alternative strategies to help make the transition from concrete
to formal thinking, to accommodate individual differences in
hemispheric styles of learning, and to mediate achievement-related
behavior has not been fully explored.
Purpose of the Study
Exploratory in nature, the purpose of this study is to examine
the role of hemispheric dominance as an attitude factor and as a
mediating factor in attitude change. The investigator hypothesizes
that an instructional treatment that would capitalize upon students
preferred mode of learning and develop their secondary mode might
better accommodate individual differences among adolescent learners
and foster conditions for achievement-related behavior.

10
Specifically, this study proposes an instructional design that will
activate right hemisphere processing as well as the more traditional
left hemisphere orientation and examine its effect upon mathematical
attitudes, self-confidence, and causal attributions.
Research Questions
1. Is there a relationship between mathematical attitudes and hemispheric dominance?
At present, most mathematics classes require formal operational
thinking, and are linguistically-oriented. The studies of Wheatley
et al. (1978) have shown that the shift to left hemispheric brain
activity may mark the onset of formal operational thinking. Yet
while the reasoning and logical structure of many mathematical
concepts will demand processing from the left linguistic-oriented
hemisphere of the brain, the right spatial-oriented hemisphere is
the leading hemisphere for many students (Wheatley, 1978). Many of
the activities offered in high school mathematics classes are
"brain-incompatible" (Hart).
Those students who do not experience much success in a
left-brain oriented class use their poor performance, social
norms, and amount of control (i.e., internal factors of ability
or effort vs. external factors of task difficulty or luck), as
specific cues to causal judgment of success or failure. The
affective and cognitive reactions range from shifts in goal
expectation to increments of pride or shame. The correlated fac
tors of self-confidence and problem solving are selected to be

11
important attitude constructs for their hypothesized relationship to
cognitive style and for outcome measures other than achievement.
2. Is there an interaction between hemispheric dominance and instruction?
Since Cronbach and Snow introduced the paradigm of aptitude X
treatment interaction (ATI) in 1957, various aptitude variables have
been hypothesized to interact with treatments. The initial results
were disappointing and equivocal since many findings were unsubstan¬
tiated through replication. Snow points out that much of ATI
research has not yet concentrated on educational outcomes other than
achievement. The framework of more traditional aptitudes has at
best shown that general ability plays an important role in ATI.
Manning comments that ATI outcomes prove more interesting and
fruitful if measured in terms of mathemagenic (giving birth to
learning) behavior. He believes that researchers should raise such
questions as what aptitudes interact with which treatments to
produce activities that give birth to creative problem solving.
One line of ATI research investigated aptitude variables with
inductive-deductive teaching. Eastman and Carry (1975) reported a
significant interaction between general reasoning and
inductive-deductive treatments in quadratic inequalities.
(Replication studies were unable to reproduce their results.)
McLeod and Briggs (1980) found a similar interaction between
high-low general reasoning and deductive-inductive treatment.

12
However, they state in their closing remarks
There seems to be no well-supported theoretical explanation as to why students who are strong in general reasoning would do well in deductive as opposed to inductive instruction....Perhaps students who are particularly adept at performing these kinds of serial operations are handicapped by the nonserial nature of inductive instruction (p.102).
Their use of the terms "serial” and "nonserial," however, fits
well with the comparison of left and right hemispheric
processing respectively. Wittrock (1977) cited the Hartnett
study (1974) which offers a plausible explanation. Hartnett
found that (a) the inductive method of teaching Spanish was as
effective or more effective for right hemisphere dominant
students, and (b) the deductive method of teaching Spanish was
more effective for left hemisphere dominant students. The work
of Wheatley and Hartnett suggests that the individual
difference variable that may explain this ATI is hemispheric
dominance.
3. Can students' mathematical attitudes and causal attributions of success and failure be improved with instruction that
exercises both styles of hemispheric processing?
Students' attitudes can often be a mediating factor in
learning. Various studies have shown a slight positive correlation
between attitudes and achievement (Aiken, 1972). Aiken (1972) also
reported that students who reported a more positive attitude toward
mathematics tended to like detailed work and saw themselves as more

13
persevering and self-confident. Self-confidence has been deemed an
important variable in learning mathematics for many reasons (Aiken,
1972; Fennema, 1978). Furthermore, girls more often suffer a lack
of self-confidence than boys, even though the level of performance
did not justify such feelings among the girls (Fennema, 1978).
Present sex-role socialization patterns contribute a great deal to
this phenomena. Various problem solving projects have identified
self-confidence as a distinguishing characteristic of better problem
solvers. Self-confidence then would appear to facilitate applying
one's efforts and abilities to task performance.
These factors of efforts and abilities play an important role
in how one perceives success and failure. Weiner (1971)
hypothesized that causal perception of success/failure would affect
achievement-related performance. He developed an Attribution
Causal Model in which success and failure could be causally related
to the internal sources of ability and effort or to the external
sources of task and luck. Persons then who believe their success to
be the direct result of their ability or effort will experience an
increase in pride and self-esteem and be more willing and
persevering fn future tasks. If they perceive their failure to be
the result of bad luck, lack of effort, or the nature of the task,
they also will be more likely to try again with more exerted
effort. However, if learners blame their failure on lack of
ability, they will feel shame and be unwilling to continue since
their futile efforts will only further decrease their pride.
14
Bar-Tal cited studies demonstrating that individual differences in
causal perception of success and failure can account for differences
in achievement-related behavior. He urged that intervention studies
should be conducted to assist students in perceiving ability and
effort as causes for success and lack of effort as cause of failure.
Wittrock believes that while teaching methods that stimulate
each type of processing should be matched to the learners’ aptitude,
a more sound educational approach should not just cater to a single
preferred mode but offer mutliple modes toward the development of an
integrated brain. Accessing students' respective strengths and
developing their weaker modes of learning might bring more success.
The cognitive and affective reactions that accompany success would
facilitate achievement-related behavior and more positive attitudes.
Definitions of Terms
Mathematics Laboratory — a teaching strategy to accommodate individual differences by providing varied materials and activities through which students, alone or in small groups, can discover, conceptualize, and verify concepts and principles
by dominant and secondary modes of learning.
Cognitive Style — consistent perceptual and intellectual modes of
functioning
Inductive Reasoning — reasoning that proceeds from the particular
to arrive at a general conclusion or rule
Deductive Reasoning — reasoning that proceeds from generalizations
to specific instances, using rules to infer conclusions.
Mathematical attitudes — students' perceived beliefs and feelings
to mathematical content, characteristics, teaching practices, and classroom activities. Two particular attitudinal constructs, self-confidence in learning and attitude toward problem solving, are the focus of this study.

15
Self-confidence — belief that one Is able to perform the task.
Attributions of cause belief that causally relates internal and
external sources to success or failure. The Weiner Model
designates ability and effort as the internal sources; and task and luck as the external sources.
Problem solving a search for appropriate action to proceed from
an initial blocked state to the goal state of a situation/task.
L-Mode — left hemispheric style of learning that processes
information analytically, linearly, verbally and logically.
R-Mode — right hemispheric style of learning that processes
information synthetically, holistically, nonverbally and
intuitively.
Implications of the Study
Educators have always been concerned with accommodating
individual differences. Oftentimes this resulted in setting
different learning outcomes for various subgroups in school
populations, placing students in a particular track on the basis of
achievement and/or ability scores, or isolating students in an
individualized programmed format. Unfortunately, such efforts as
these have at the same time perpetuated disparity in educational
opportunity and achievement along race and sex lines.
Although it is generally acknowledged that there are "parallel
ways of knowing" (Bogen) within and across individuals, it has
proven more difficult to determine characteristics of learners that
match teaching strategies and to design curricular materials that
optimize conditions for meaningful learning.

16
The school setting involves a complex aptitude-instruction
interaction. The social context of the classroom, the attitudes and
beliefs that each student brings with himself, and each student's
cognitive style, confront the competence of teacher and student,
resulting in performances that may sometimes delight and other times
frustrate. Causal ascriptions of success or failure may very well
predict the learner's mode of behavior and achievement.
The issue of attitude—achievement causation holds strong
implications for change. Yet one of the pitfalls in the area of
research on mathematical attitudes has been the lack of theoretical
rationales for hypothesis-testing experiments (Kulm). With the
intent of contributing to theory development, this study hopes to
provide some insight into the process of attitude change based upon
attribution theory. Weiner's Attribution Model of Achievement
Motivation was used to develop a set of hypotheses examining the
mediating effect of cognitive style upon achievement-related
behavior. A better understanding of the relationship of
self-confidence and effectance motivation to hemispheric styles of
learning should prove relevant to the area of problem solving,
identified as an important priority for the 1980s, as well as to
mathemagenic behavior.
It seems reasonable to theorize, pursuant to recent lines of
investigation, that a learning environment more responsive to
hemispheric dominance will affect student participation and
attitudes in short range, and achievement and development in long

17
range. If students can become sufficiently confident to risk and
accept challenges as well as increase their awareness of their own
learning strengths and weaknesses, they will have acquired skills
for lifelong learning.
The need for higher levels of mathematical sophistication
increases as our society becomes more technologically dependent. If
present trends in student enrollment in mathematics and science
classes continue, we will be unable to meet these demands. Efforts
must be made to reverse this pattern.
One approach suggested by this study is that by attending to
cognitive styles we may breed success and self-confidence among more
students. If we can change their causal attributions and rebuild
the linkage between attitude and achievement, we may be opening our
classroom doors to more students, and more successful students.
Limitations
The possibility of carry-over effects is recognized as a major
drawback to repeated measures studies involving learning. Since
preference for instructional mode and attitude gain scores are the
criteria to be examined in this study and not achievement gains, the
investigator believes that such an effect is negligible.
While self-report instruments to assess attitude are manageable
in terms of administrative ease and objective scoring, they do have
disadvantages. They can raise sensitivity to the issues in
18
question. As a result an individual may respond according to what
he thinks he should feel rather than how he actually feels. An
additional problem with a 5-point Likert-style scale may arise if
the respondent does not interpret similar statements to equally
express "for" or "against" values.
Ihe instructional treatment used in this study dealt with
mathematical concepts in a General Mathematics course which lend
themselves to right-hemispheric processing. Generalizations could
not be made to the broad range of mathematical topics nor to all
disciplines.
A teacher's (students's) cognitive style may influence his way
of teaching (learning) (Witkin, 1977). While this interaction was
beyond the scope of this study, it may be a limiting factor. The
investigator completed the Your Style of Learning and Thinking
Form B. Using as a reference the results of 213 teachers in
service, the investigator classifies herself as a left-hemispheric
thinker. The instructional treatment was designed consciously to
balance methods of presentation, with right-hemispheric techniques
complementing the left-hemispheric techniques. However, one must
consider the possibility that, in spite of good intentions, the
investigator's learning style may have subconsciously contaminated
the right-hemispheric strategies.
Due to unforeseen scheduling problems and a high mortality rate
among student participants over the six-week period, the sample size
(n"5) was much smaller than anticipated, thereby limiting the
study's generalizability•

19
Remaining Chapters
Chapter II Is a review of the literature in the following
topics: mathematics laboratories; adolescent cognitive development
and recent brain research; problem solving and subject variables;
and attribution theory. Details concerning the pilot study, the
design of the main study, the instructional treatment, the
variables, and the procedures are contained in Chapter III. Chapter
IV provides the description and analysis of the data. The
conclusions and recommendations for further research are contained
in Chapter V.

CHAPTER II
LITERATURE REVIEW
While the traditional expository method of teaching can produce
conditions for meaningful learning, it will be only effective for
those students who bring a "meaningful set," to use Ausubel's term,
to the classroom. In order to narrow the range of important
variables that enter into individal differences, the investigator
was guided in surveying the research by the following questions.
What constraints does adolescence impose upon the learner?
With problem solving recommended as a priority for the 1980s by the
NCTM, what role do subject variables play upon problem solving
ability and performance? How do students’ beliefs regarding their
successes and failures influence their achievement behavior?
Since much of the innovation in mathematics teaching during the
last decade has taken place at the elementary level and in the form
of a mathematics laboratory model, does empirical research support
advocates’ claims and can it be extended to high school?
These concerns led me to review the literature in four areas:
1) implementation and evaluation of mathematics laboratory
2) adolescent reasoning and recent brain research
3) problem solving and subject variables. 4) attribution theory and achievement-related behavior.
Mathematics Laboratories
The mathematics laboratory has a history in the writings of
20

21
mathematical educators and to a lesser degree in implementation.
From Moore in the 1900s to Dewey in the 1920s to more recent
advocates in the 70s, the argument for utility and applications of
school mathematics to real world situations has consistently had its
proponents. Although the dual nature of mathematics (applied vs.
pure) is often conceived as antithetical, many think that a deeper
understanding is reinforced by applications.
The term mathematics laboratory has been ambiguous, and can
refer to any of the following in multiple combinations: discovery
method; use of manipulative materials; activity oriented curricula;
concrete embodiments; applied problem solving. Jack Wilkinson
(1974) has proposed a useful framework to interpret the varied forms
assumed under the term mathematics laboratory: the first connotes
the notion of a place that houses hardware with a multisensory
emphasis on learning; the second refers to a teaching/learning
strategy with an emphasis on reshaping roles. (Many of the
forementioned terms predate the idea of a mathematics laboratory but
can be incorporated into either interpretation and therefore have
been included as descriptors in reviewing the literature).
Wilkinson further proposes that the ideal should synthesize
both these aspects. Donald Kerr, Jr. (1974) offers this definition.
A mathematics laboratory is a strategy of instruction
in which the learner himself interacts with mathematics
and its real world applications. The techniques may
include discussion, discovery activities, model construction or even some directed teaching... But the laboratory strategy focuses the learner's attention and activities on the relationship between mathematics and its
real world applications.
22
Kidd, Myers, & Cilley (1970) stated that the inherent values of the
laboratory approach are that it relates learning to past experiences
and provides new experiences when needed; provides interesting
problems for the students to investigate; provides a non-threatening
atmosphere conducive to learning; and allows the student to take
responsibility for his own learning and to progress at his own rate.
The theories of Bruner and Piaget fostered a climate amenable
to and a rationale for experimentation with instructional aids and
alternative teaching methods. Piaget's work on intellectual
development and Bruner's theory of instruction heralded a period of
increased attention to how children learn. The resulting awareness
that children think qualitatively different than adults has had
direct implications for classroom practice. For Piaget, thinking is
an active process: the individual organizes and adapts to his
environment. Bruner's theory of instruction postulated that
students learn through action, imagery, and language. The work of
Dienes and Davis supported Piaget's theory and has had a great
impact on the laboratory movement. Dienes identified six stages in
learning of mathematics abstractions that proceed from free play and
games to more formal representations. The thread that runs
throughout their theories is that activity and play are important
conditions for meaningful learning. (More recently the work and
writings of enthusiastic proponents for student-controlled computing
as Papert & Dwyer resound with similar arguments for activity and
play in instructional and curricular innovations). Using the
theories of Piaget & Bruner for a theoretical justification, many

23
experiments were conducted (mainly at the elementary level) with
manipulative materials and instructional aids that embodied mathe¬
matical concepts to develop and deepen understanding. Thomas Kieren
(1971) summarized the arguments for play and manipulation: that they
have a fundamental position in sequence of expanded learning; can
provide an information-seeking, non-authoritarian environment;
should best include a wide variety of concrete referents; and can
contribute a readiness foundation for later ideas.
Although Bruner indicated a potential weakness in secondary
level instruction that did not incorporate concrete aids (Kieren,
1971), most of the experimental studies and curricular projects were
conducted at the elementary and junior high school levels.
Returning to Wilkinson’s framework for the conceptualizing of
labs, a good portion of the research in the first category falls
under the heading of manipulative materials. Nearly one hundred
studies have been reported since 1960 on the effects of various
manipulative activities for acquiring arithmetic concepts and
skills. The typical study compared two or more of the well-known
materials. Due to the diversity of instructional designs with
respect to content, age-grade levels, time factors, no clear
conclusions can be based upon this research. However, Marilyn
Suydam and Jon Higgins (1977) reported the following trends revealed
by the research on materials at the elementary school level, (a) in
studies comparing use of manipulative versus non-use, greater
mathematics achievement was more probable with lessons using
manipulatives; (b) multiple embodiments may aid concept formation

24
but no studies have proven this; (c) teacher demonstration can be just as
effective as hands-on experience for each student; (d) use of materials
appears to be as effective across ability and achievement levels; (e)
students with lower socioeconomic status backgrounds tend to find use of
manipulatives helpful; and (f) although no effect in attitudes emerged,
no firm conclusions should be drawn since attitude assessment was not
often conducted nor a priority. Wilkinson (1974) earlier reported these
same tendencies. In addition he commented that while there was no
significant difference in achievement with older children, manipulative
activity appeared not to favor them. Fey (1980) explains that the
studies to examine concrete versus abstract representation for older
children become confounded by previous learning experiences and
particular skills of individual teachers. Effectiveness often can be
more the result of the teacher than the materials per se (Sole, 1957;
Edison, 1956; Brownell, 1968).
Studies on the effects of mathematics laboratories similarly have
had problems in summarizing the state-of-the-art due to varying degrees
that the laboratory strategy has enriched or replaced the traditional
methods. James Fey (1980) cited R.L. Miller’s review of 23 studies which
examined for the most part the effects of a laboratory method on
composite achievement and general attitudes, covering a wide range of
content, grade, and ability levels. While one study produced a
significant gain in achievement for those students receiving traditional
instruction, eleven studies indicated superior performance for laboratory
treatment. None of the studies indicated that the traditional method was
more effective in producing better student attitudes. Suydam and Higgins

25
(1977) reveal the same trends: namely, that at least equivalent
achievement can be expected and that there Is no significant difference
in attitudes. They recommend that further Inquiry into the relationship
between student characteristics and attitudes, and the frequency of the
treatment and attitudes might shed further light upon attitudinal
changes. The use of standardized achievement tests or general attitude
scales might not be the most appropriate method of evaluation. Many
projects propose to motivate. Improve attitudes toward mathematics,
Increase self-confidence, promote interpersonal skills, develop problem
solving skills, etc. Instruments need to be designed that are sensitive
to these desired cognitive and affective outcomes.
The laboratory approach has been introduced, on a small scale, at
the high school level. Using SMSG text with two instructional
treatments, the laboratory method vs. the abstract method, Schippert
(1965) found a significant difference in achivement in arithmetic skills
favoring the laboratory treated group but found no significant attitude
change with either group. Higgins (1969) evaluated the SMSG-produced
Math Through Science unit for Grade 8 entitled Graphing, Equations &
Linear Functions." He found that most students did not make general
strong changes in attitude. He commented that while many students
appeared to be enthusiastic about participating in laboratory activities,
they were not affected by change in content. Many attitude scales do not
ask about interactions in class. He raised an important question about
changing attitudes toward mathematics class vs. attitudes toward
mathematics.
26
Although Jackie Beal (1972) was unable to conclude that
activity-oriented materials for basic skills produced positive gains
in attitude and achievement, verbal comments by students indicated
enjoyment of usage of these materials. On the other hand, Patricia
Dejarnette-Ondrus (1977) did find in her study of the effects of a
laboratory approach in a 9th Grade remedial class that although
there was no significant difference in achievement there was a more
positive attitude toward mathematics measured in terms of enjoyment,
motivation, self-concept, value and degree of anxiety. Brenda Tapp
(1977) found a similar gain in self-concept for laboratory treated
low-achievers in a semi-rural junior high school.
Comparing poor laboratory students and good laboratory students
selected from 3 ability levels and from both the city and rural
community, Thomas Hicks (1974) was unable to relate any one single
student characteristic to achievement in a junior high school
mathematics laboratory. He commented that other factors need to be
considered or more appropriate instruments need to be designed.
In examining the effects of using materials to teach problem¬
solving to 7th and 9th graders, Shoecraft (1971) found that the
materials~treated group scored highest on transfer instruments and
the low-achievers seemed to benefit most. Carmody (1970) also
showed that concrete and semi-concrete treatments support the goal
of transfer.
Patricia Synder (1975) developed a model for a secondary school
mathematics laboratory through 4 rounds of questioning mathematics

)
27
educators who demonstrated expertise in the field, satisfying at least
one of three criteria: 1) led a mathematics laboratory workshop; 2)
received an NSF grant for research on mathematics laboratories; and/or
3) published articles or books on mathematics laboratories. (Refer to
Figure 1) In her overall analysis, she categorized and ranked in order
the following elements as being important in developing a good
laboratory: student activities and roles, teacher involvement, physical
facility and equipment, and laboratory technique.
The experiments with the laboratory approach on the high school
level then, for the most part, have been conceived to teach basic
competencies for the less able or low-achiever. Although the results
have been mixed, it does seem to effect a more positive attitude toward
math. More importantly, informal feedback by students indicated that
students enjoyed and/or preferred participating in laboratory
activities. Higgins’ remarks about the distinction between attitudes
toward mathematics and attitudes toward mathematics class need further
investigation.
While the typical question raised in the research has compared
activity learning with another approach, Kieren suggests that
Cronbach's advice to study interaction among subject matter,
instructional type, timing, type of pupil, and desired outcome should
be heeded.
Adolescent Reasoning
Research indicates that the cognitive abilities available to an
individual are different at distinct points in the life cycle.

28
VI. MATHEMATICAL CONCEPTS • related to specific math-
ematcis objectives • interrelate mathematics and
the real world • relate concepts to real world • relate concepts to materials • concepts presented concretely • problem solving • modeling
V.
CONCEPTUAL FRAMEWORK
• inquiry oriented • discovery oriented • independent investigation
encouraged • relate concepts to real world • relate concepts to materials
PHYSICAL FACILITY AND EQUIPMENT • Files of modules, challenge problems, and
diagnostics • sufficient space for each student to work • materials for making things • audio visual materials • inexpensive materials • measurement devices • computer access • calculators
TEACHER INVOLVEMENT • continuous teacher
development • supplies indiviudal
attention • time to do the job • resource person
MATHEMATICS LABORATORY
IV. LABORATORY TECHNIQUES AND PROCEDURES • independent investigation • graph producing experiments • data producing experiments • solving problems • experimentation • open-ended • guessing • discovery • hands-on
STUDENT ACTIVITIES AND ROLES interaction with other students explortion of patterns problem devising hypothesis testing data gathering data analysis
FIGURE 1. Secondary School Mathematics Model developed by Patricia Snyder.

29
Piaget formulated a comprehensive theory of cognitive development
that has had great impact on mathematics education. From infancy to
childhood virtually all children pass through his described stages
of sensori-motor, pre-operational, and concrete operation. At the
onset of early adolescence, formal reasoning abilities may emerge.
During the concrete stage, the child is capable of thinking about
things and applying logic of class and of relations to things. What
is actual is in the foreground. As he enters the last stage of
development, he is capable of thinking about his own thinking, can
extract attributes from things, and can focus on the form or the
proposition about things. He can also consider all possibilities.
Evidence suggests that the normal developing adolescent may not
reach this stage and that Piaget's theorized last stage may be more
ideal than typical. Piaget (1972) himself conceded that at this
stage indiviudal aptitude, interest and experience appear to play a
significant role in determining which tasks an individual can
complete successfully. Karplus (1975) found that less than 1/4 of
13-14 year-olds used formal reasoning and the "control-the-variable'
strategy on a ratio problem. He did discover that by removing
visual clues, more students were not distracted by perception and
tended to the task of proportional reasoning. Dulit (1972) also
agreed that it is not routine or commonplace for adolescents to
think formally. He believes that rather than one single path of
development after the concrete stage, that there are alternative
partially-developed tracks. He accounts for the attainment of
formal operations as the successful balance of all the alternative

30
tracks after the concrete stage.
Some researchers believe that the low occurrence of formal
thinkers is proportional to the low demand for it. Everyday life
demands more concrete thinking while the more rigorous aspects of
formal reasoning are called upon in mathematics instruction (Dulit,
1972).
Elkind (1981) has found that secondary curricular materials that
seem simple actually required mental operations and thinking levels
that many students are unable to perform from a Piagetian perspective.
Psychologists have produced strong support from recent brain
growth research for a Piagetian-oriented cognitive theory. It has
been determined that there are 5 discrete periods of extra brain
growth: 3-10 months; 2-4 years old; 6-8 years old; 10-12 years old;
and 14-16 years old. Their correspondence to Piaget's stages suggests
that they may very well be the biological basis for his theory
(Epstein, 1978). Note that this last period of great brain growth
occurs during the early years of high school. Furthermore it appears
that there are significant sex differences: during the 10-12 year
growth spurt female brain growth is almost 3 times that of males';
while the pattern is reversed during the last growth spurt. While it
would be premature to totally reorganize schools on this basis, this
evidence offers reasonable implications: periods of growth spurt
enable the learner to assimilate and accommodate many more new varied
experiences than during slow growth periods. Our instructional
practice should emphasize reinforcement and application of already

31
acquired concepts, a "variation of the themes" during plateau
periods. During spurts, we should assist new concept attainment.
Studies on the effects of damage to the brain and so-called
"split-brain" patients as well as physiological assessments of
"normal" functioning brains have enabled neuroscientists to map
regions of the brain to specific functions. Each half of the brain
directs primary motor- and sensory-activities in opposing visual and
body fields. While many tasks are processed through the integrated
hemispheres, each hemisphere does assume some specialized functions.
The right hemisphere which processes stimuli in an all-at-once gestalt
fashion, is better at spatial tasks, recognizing faces, and music;
whereas the left side treats stimuli in a one-at-a-time serial manner
thereby controlling speech, reasoning, and arithmetical tasks.
Bogen (1977) reports that the earlier work which led to the
belief that the right hemisphere is visuo-spatially oriented is not
totally accurate. The distinction is not simply along verbal-visual
lines, although this partially characterizes their respective
functions. Bogen defines the left-right dimensions to be
"propositional-appositional": while the left hemisphere focuses on
features and abstracting essentials from a field the right is superior
for part-whole relationships. He states:
What distinguishes one hemisphere from the other is not
so much certain kinds of materials (e.g., words for the
left, faces for the right) but the way in which the
material is processed, (p. 138)

On the basis of a survey of the research on specialized
functioning, Torrance, Reynolds, et al. offer the following
lists as an abridged summary of hemispheric specialization:
32
LEFT
recognizing/remembering names responding to verbal instructions
systematic and controlled in
experimenting/learning/thinking inhibited emotionally dependent upon words for meaning produces logical ideas/thoughts processes verbal stimuli serious, systematic, planful in
solving problems receptive likes to have definite plan
not psychic little use of metaphors and
analogies responsive to logical, verbal
appeals deals with one problem at a time,
sequentially critical and analytical in
reading, listening, etc. logical in solving problems gives instructions/information
verbally uses language in remembering
grasps certain, established
truths
RIGHT
recognizing/remember faces responding to visual and
kinesthetic instructions playful and loose in
experimenting/learning/thinking responds with emotion/feeling interprets body language easily produces humorous idlas/thoughs processes kinesthetic stimuli playful in solving problems, uses
humor, experiments self acting likes to improvise highly psychic frequent use of metaphors and
analogies responsive to emotional appeals
deals simultaneously with several problems at a time
creative, synthesizing, associ- acting, applying in reading, etc.
intuitive in solving problems gives much information through
movement, gesture, etc. uses images in remembering grasps new, uncertain truths
Similar lists have been proposed by other researchers (Refer to
Figure 2).
Recent work in the neurological sciences suggests that
hemisphere specialization (as well as brain growth spurts) may
accompany changes in cognitive development. In reviewing studies
from various fields, Grayson Wheatley found that while the right

FIGURE 2. A Sample of Specialized Functions of the Left and Right Hemisphere Identified by Researchers.
intellect convergent digital secondary abstract directed propositional analytic j
lineal rational sequential analytic
objective
successive
Edwards verbal analytic symbolic abstract temporal
rational digital logical linear
Rubenzer verbal memory verbal scale IQ logic, reality testing analytical thinking reading technical/scientific
reading external focus apprehension
field dependence verbal problem solving logical discriminations
writing verbal-numerical abilities
analytic style convergent,rational style
sequential, logical relations education of relations algebra, mathematics consistent affect affect related to consistency
Right
intuition divergent analogic primary concrete free imaginative relational
nonlineal intuitive multiple holistic
subjective
simultaneous
nonverbal synthetic concrete analogic nontemparal
nonrational spatial intuitive holistic
(in addition to Torrance’s) visuo-spatial abilities memory for visual field musical patterns nonsequential visual field internal focus peak experience
field independence nonverbal skills
problem finding aesthetic discriminations metaphoric expression spatial abilities nonverbal symbols
tactile sensitivities bodily orientation divergent, holsitic style
diffusion geometry affect in general affect related to aesthetics
33

34
hemisphere seems to be the "leading hemisphere" in most children
that the left tends to be more active for adults. Using EEGs to
monitor hemisphere activity of concrete- and formal- operational
thinkers, Dilling, Wheatley, and Mitchell (1978) determined more
left hemispheric activity for formal operational thinkers. They
hypothesize that many students' poor performance in problem solving
and higher-order thinking may result from too early an emphasis on
left hemisphere tasks. Wheatley (1978) believes that "Early and
continued emphasis on rules and algorithms" which draw on the left
side of the brain "may inhibit the development of creativity,
problem solving and spatial ability." (p. 26) As the right
hemisphere leads in early development, so it seems to lead in the
learning of new information or the unfamiliar with action and
perception being processed through the right side of the brain. As
this information becomes more familiar, it will be encoded in words
and symbols to be processed on the left side. Both Wheatley & Bogen
urge that educators provide more laboratory and field activities
which require the use of the right hemisphere so as to enable
students to reach new levels of thinking.
Use of the right hemisphere may also inadvertently account for
affective factors. Emotion and "state of mind" have been
traditionally associated with the Limbic System. In recent years it
has been discovered that the right hemisphere of the cortex also
contributes to our state of mind (Geschwind, 1979). Brain based
theory states that the neocortex does not function well under

35
threat”: when learners see activities as threatening, learning that
should occur in the neocortex is inhibited (Hart, 1978).
Some researchers and psychologists have denounced the schools
for neglecting the right hemisphere. Betty Edwards declares
Even today, though educators are increasingly concerned with the importance of intuitive and creative thought, school systems in general are still structured in the left hemisphere mode....
The right brain - the dreamer, the artificer, the artist - is lost in our school system and goes largely untaught....
Yet educators value these skills and have apparently hoped that students would develop imagination, perception, and intuition as natural consequences of a training in verbal, analytic skills... But the emphasis of our culture is so strongly slanted toward rewarding left brain skills
that we are surely losing a very large proportion of the potential ability of the other halves of our children’s brains, (pp.36-37)
While Conrad Toepfer, Jr. (1982) urges middle school and secondary
school educators to consider alternatives to left hemisphere
dominated curricula, he also cautions that results will be nominal
until earlier schooling reorganizes to meet learning needs and
preferred learning styles among younger students.
Leslie Hart takes a much stronger position when he states that
schools are "brain antagonistic." He contends that present
knowledge derived from the work of neuroscientists supports the
theory that the brain is "aggressive," i.e., that it seeks out and
will accept only what it needs and perceives. Both Wittrock and
Hart agree that what the teacher presents has little to do with
learning. Learning occurs only through active construction of
meaning. Attention, perception, motivation, and use of memory

36
greatly influence what stimuli we process. The teacher's
responsibility then in a "brain-compatible" school setting is to
foster pattern detection, a main feature of brain functioning in
learning, by providing great amounts of input.
...[T]eachers must move from being the instrument of instruction to a far broader, more professional role: directing the whole learning process...Students can and will learn from suitable materials, devices, and tutoring, all designed to promote fail-proof guidance in building useful
programs, on a largely self-service basis. (Hart, p. 296)
Problem Solving
Research on problem solving has been disorganized and chaotic.
Earlier research was within the domain of psychology, and tended to
involve trivial, artifical tasks not usually conceived as problems.
The results of such studies were not readily applicable to the
classroom. In addition, research before the 1970s was product-
oriented: problem solving ability was measured in terms of the
number of correct responses (Suydam, Riedesel, and Kilpatrick).
Since then interest has shifted to the processes employed in problem
solving over the actual solution.
What constitutes a problem? Newell and Simon list the
following four as necessary conditions for a mathematics problem:
1) a situation must exist involving an initial state and a goal state
2) the situation must involve mathematics;
3) a person must desire a solution; and 4) there must be some blockage between the given and desired states;
Criteria established by Nelson and Kilpatrick (1975) are.
1) mathematical significance

37
2) real objects or simulation of real objects 3) interesting to solver
4) require transformation or modification of materials 5) allow for different levels of solution 6) many physical embodiments possible 7) solution believable and possible
Polya (1945) states "to have a problem means: to search
consciously for some action appropriate to attain a clearly
conceived but not immediately attainable aim."
A host of models for general problem solving and mathematical
problem solving have been hypothesized. Refer to Figure 3 for
outlines of various models.
Although the terminology and the actual number of steps may
differ among the models, they share common key ingredients to
success in problem solving. The scope of this discussion will focus
more upon the earlier stages, designated as the most difficult yet
critical, and the last stage, the most instructive.
As previously stated, a problem must have blockage built in as
the first step. The student must be unable to find immediately an
appropriate algorithm. Yet it is overcoming this initial inability
to succeed that presents itself as the major first hurdle. One of
the best ways to overcome this hurdle is devising a plan, determined
to be the most difficult stage for students (Lester, 1978). One
source of difficulty arises from lack of experience with problems.
Students more often than not are asked to complete exercises at the
end of a unit that requires easy application of newly acquired
skills, but are not problems according to our definition. As a
result students are not accustomed to the planning stage in problem

Po
lya’
s M
odel
Sam
ple
’s M
odel
Lac
y’s
Cre
ativ
e P
roce
ss
un
ders
tan
din
g t
he p
rob
lem
pla
n f
orm
ula
tio
n (
rig
ht
bra
in)
pro
ble
m a
ware
ness
dev
isin
g a
pla
n
imple
men
tati
on o
f pla
n (
left b
rain
) pro
ble
m d
efin
itio
n
carr
yin
g o
ut
the p
lan
refl
ecti
on (
right
bra
in a
ctiv
ity)
incu
bat
ion (
affe
ctiv
e an
d r
ight
bra
in a
ctiv
ity)
38
c
2 § 2 is
I! — 0
0) T3 O 2 </> E n i_ o> o
ro 2 >* c 3 o o 0) c ro
c o 0 3 E &_ o "“I c >. o
0
o E 0 o •a c E a) CD E .Q o <D E a»
0 ~ E
0 E 0
0 -Q 0 O 0 k_ ■C 0 CL
c c $ > 0 0 0 05 C
1 05 05 1 C C
0 0 0 .C P
0 o 3 P
05 0 o c
o o
O) I O .b= 1 3 05
-§ I co _> E ° CO (/)
I T3 v (0 a cd CO -C
JD CO
05 05 c c
L* lx o o o o
o CO
05 c s o o
a> T3 o 2 CO 0) (/) 3
c g C/5 C
05 <D 05 -C CD CD
E Q- * E § o co o E E 05 0
n x) o o L. k— CL CL
C CD
05 q_
05 _0
i?' 0 _±! CO > ‘ C CD CO "O
CO iZ a o i5 iu
c o
c ^ o o
■5 w cE CD CO
0 05
c = E -o - CD c g co o
05 CL CL CL CD
o 05 C o
0 N 0 0 0 O
■O 0 , £ 0 0 -C 0 v_ >. 05 0 C
0 tf 3 o
■O 0 o Q
0 0 0 ■e X! 0 o X 0 O c
0 0 0 0 x:
0 -X 0
0 ■*—1
0 ■o
0 x: o
O 0 x= E 0 $
> ^ 0
.9- E o g 53 £
cd "o a r o 05 05 E
-CO CD -Q T3
— c O CO CO
Q_ CO
!« ii
05
05
CL
E co
CO
0 05 -«
— 05 ti O 0 E
co -j -S E 05-g 0 c £
X5 > — O o o
* ”3 05 C 3 0 0
0 >
X5 0 o -o
0 3 0
05 E ~
.9 0 0. Q- 05
E .e 0 SZ
co g 0 0 -O ■ c
CO
0 o c 0
o M c
UJ cr =)
the
right
hem
isp
here
in
pro
ble
m s
olv
ing.

39
solving because they have not been asked or required to do so. Even the
routine problems with which they are presented are done passively: they
watch the teacher do the problem on the board which they copy and then
replicate in a very similar problem. Yet watching others solve problems
has been regarded as an important experience to improve problem solving
ability (Polya, 1945; Hatfield, 1978). This means witnessing a good
problem solver walking through all the phases of many different types of
problems, talking through choices made, and making external the inner
dialogue that shapes his thinking. This awareness of strategies being
used to solve a problem is probably the most important step in the
development of a pupil's problem solving abilities. George Polya (1945)
says that his suggested list of questions can
...keep the ball rolling. When discouraged by lack of success, we are inclined to drop the problem. They may suggest to us a new trial, a new aspect, a new variation
of the problem, a new stimulus; they may keep us thinking.
(p. 149)
From my own teaching experience I can recall students frequently
remarking how they understood in class but were unable to complete the
assignment at home. I believe that this is due to their failure to
internalize this questioning strategy that the teacher uses during
class. Again Polya (1945) observed:
The intelligent problem solver often asks himself
questions similar to those contained in our list. He perhaps discovered questions of this sort by himself; or,
having heard such a question from somebody, he discovered its proper use by himself. He is possiDly not conscious at all that he repeats that same stereotyped question
again and again.

40
Various techniques have been successfully employed to raise in
bas-relief students* thinking for self-inspection. Lesh argues that
inner thinking, subject to centering and egocentrism, often will
focus on the more obvious or filter information through preconceived
notions. Thus when inner strategies are externalized through small
group activities, they are exposed for sharing, self-examining, and
cross-referencing. Papert and many other computer enthusiasts have
shown that when students write computer programs they are tutoring
the computer. Their written programs serve as "glassboxes of their
thinking" (Peelle) which they then can examine, refine, and debug.
Whimbey and Lochhead (1980) implemented a paired problem solving
approach in the classroom based on the Bloom and Brody (1950)
study. Students formed pairs and then alternately served as
listener or presenter of their ideas. They claimed that such
verbalizing "improved” their problem solving ability. The value of
these studies lies in their demonstration that verbal
interaction—either with a computer or another person—facilitates
reflective thinking.
Research shows that good problem solvers use more strategies.
Younger- and less able students tend to use only trial-and-error.
Although many educators believe that there is a qualitative
difference between poor and good problem solvers, they also believe
that instruction can help the poor problem solver become a better
one. Richard Lesh argues that average students may have access to
more problem solving processes that are presently underdeveloped.

41
> \ '5w S2
\ azueinoiped
§.■§ S£ / tuasajday 2_/ /azijeujaqos
FIG
UR
E
4.
Th
e m
odel
ing
pro
cess
es t
hat
mat
hem
atic
ians
use
con
sist
of
mat
chin
g an
ide
a w
ithin
one
rep
rese
nta
tio
nal
mo
de
wit
h a
corr
esp
on
din
g i
dea
with
in a
noth
er r
epre
sent
iona
l m
ode. (
Les
h, p
. 16
6)

42
Imposing relational and operational systems on materials in a
laboratory setting helps the learner overcome these difficulties.
Expanding the embodiments that refer to a concept builds its power
and generalizability. The many pairs of reversible processes that
are involved in this translation can help expand the learner's
repertoire. In addition to using more strategies, it is necessary
to know when and- where to use it. Alan Schoenfeld argues that
students may have strategies available to them, but lack a
managerial strategy to help them select the most appropriate
strategy for different situations.
Achievement does correlate to problem solving ability as well
as mathematical knowledge and experience. However, Meyer (1978)
determined that prior knowledge is not enough for success in problem
solving. As has been discussed, equipping students with a variety
of strategies, providing experiences in solving a variety of
problems in a variety of ways, and watching/interacting with other
problem solvers can nurture problem solving ability. But the
process is not just a search for an algorithm or a rule; it is not
simply an analytical task. Wheatley hypothesizes that an
instructional emphasis on applying rules and algorithms to verbal
problems that utilize the left hemisphere may be a major source of
students’ poor performance on problem solving. The process is not
necessarily linear. The solver needs to look at the problem as a
whole, to "mull over the situation," to let his ideas incubate.
Stimuli treated as a gestalt is processed through the right
Wheatly recommends that problem solving ability will be hemisphere.

43
enhanced by activating the right hemisphere through open-ended tasks
such as puzzles, tessellations, and tangrams.
The very nature of problem solving requires affective as well
as cognitive responses. Webb, Moses, and Kerr (1977) report that
the staff of the Mathematical Problem Solving Project found that
willingness, perseverance, and self-confidence were strong factors
on problem solving performance among 700 intermediate grade
children. Robinson (1973) found that good problem solvers in the
6th grade had higher self-esteem than poor problem solvers. Lewis
Aiken (1972) presented the following conclusions regarding
mathematics attitudes:
Mathematics attitudes are directly related to interest in
problem solving tasks in general but are inversely related to
interest in language arts, social studies and other verbal
pursuits.
Attribution theory
Weiner admits that intuition and common sense were the basis
for his early theorizing of causal attributions of success and
failure. He proposes a model which explains the effect of
attribution of success and failure upon goal expectancy and behavior
(refer to Figure 5). His research proceeded in two directions: how
these causal judgments are formed and what is their effect upon
consequent behavior.
To reach causal inferences individuals use cues which they then
reach a causal judgment. Employing combine and synthesize to

BE
HA
VIO
RA
L
AN
TE
CE
DE
NT
S
CA
US
AL A
SC
RIP
TIO
NS
CA
US
AL D
IME
NS
ION
S
CA
US
AL E
FF
EC
TS
CO
NS
EQ
UE
NC
ES
44
CD
>>« O C CD (6
1.8 ■§ a s cd o 52 g-t
CD
« E 11 o 1/5 ro "o a> c *- TO I -g
II 5
CO e £
CO
>N o c ro o cd a. x a)
-O ro To
~ r — o •O 2= CD CD
CD > 0>
CD CD CJ O
c c c O “ « ® CD '~r W »— E 9 o o h c t: t
>.•§»&& s ■; Si b = in _ Jin,,
.« f ° S 55 .E “■ <2 ^ s ~ ro
S. E CD Q. (/)
rd D a. o
co 03
Q 2 CO i; o
CO (0 E i2 o a c >
11 o n co o
co ro 3
2) 5> y) T3 o .c $
^ O O’ O (D o o s ro c 2 E « ® =
CO CD O c CD 3 O' CD
co o ,c
S = > a. o = o 5 5 v. > « o ° E « 5
C 0) o £ 3 (/)
<0 m D jO co 03 m
E > (D >,
U CD rn w 'J) CO
ro 8 « « a c O
CO •a ID CD 2 c CD
E CD > CD 3
CD
<
FIG
UR
E
5.
Att
ribu
tion
al M
odel
of
Ach
iev
emen
t M
otiv
atio
n

45
principles of information synthesis, Frieze and Weiner conducted a study
which demonstrated that there are identifiable and highly significant
judgment rules used by all subjects:
1) outcomes that conform to the social norm are attributed to the task;
2) success is attributed internally while failure is attributed externally;
3) a surprise performance is ascribed to unstable factors of effort and luck;
4) the greater the degree of prior success (failure) the
greater likelihood of continued success (failure).
In addition to causal schemata, permanent cognitive structures that
refer to the beliefs that a person holds about the perceived causes of an
event and its effects, influence causal judgments. Causes can be
identified as either sufficient or necessary. Kelley believes that a
single sufficient schemata accounts for common events while multiple
necessary schema account for unusual events. For example, succeeding at
an easy task will be attributed to ability or effort while succeeding at
a difficult task to ability and effort.
The most important factor in individual differences of causal
ascription is the need for achievement (Weiner, Bar-Tal). Those high in
achievement needs ascribe success to their ability and failure to lack of
effort; those low in achievement needs do not take credit for their
success and assign failure to lack of ability. Bar-Tal cites sex
difference as another source of individual differences. Females tend to
attribute more externally than males and rate their ability less highly
than males.

46
Weiner integrated his causal attributions with the goal expectancy
concept of traditional cognitive motivational models to offer a process
that appears almost self-evident yet is substantiated by empirical
evidence. With dimensions of stability and locus of control superimposed
upon causal ascriptions, Weiner believes that they influence goal
expectations and affective reactions which in turn determine
goal-directed behavior.
Perceived ability and task difficulty in conjunction with
anticipated effort and luck will set estimated goal expectancy. In
general, success brings about an increase in goal anticipation while
failure yields a decrement in the likelihood of goal attainment. Weiner
argues that attributing an outcome to stable factors will produce greater
typical shifts in expectancy than attributions to unstable factors. That
is, a successful experience attributed to ability will increase the
perceived probability of future success whereas a person who experiences
failure which he ascribes to low ability more than likely anticipates
future failures.
While the stability of the causal factor is related to shifts in
goal expectancy, the locus of control (internal vs. external) influences
the affective reactions. Success attributed to high ahility or hard work
will result in increased pride more so than success ascribed to any easy
task or good luck. On the other hand failure attributed to low ability
or lack of effort will produce an increase in shame more than failure
assigned by a difficult task or bad luck.
The resulting affect in concert with goal expectancy then determine
goal-directed behaviors.

47
Weiner believes that attributions to effort play a particularly
important role in school settings. His researchers have found that
rewards and punishments by teachers or self-rewards for achievement
related behavior is greatly influenced by the amount of effort
exerted. Students who have acquired a "learned helplessness" — who
expect repeated failure due to perceived lack of ability — see no
reason to try. The helpless have been found to make more external
and stable attributions, which characterize persons low in
achievement needs. Those high in achievement needs differ in
significant ways:
1) They are more likely to initiate achievement activities. Their attribution of success to internal factors result
in increased pride which facilitates the likelihood of achievement behavior.
2) They are more persistent when confronted with failure.
Their ascription of failure to unstable factors does not lower their goal expectations.
3) They work with greater intensity.
They believe that outcome and effort covary.
4) They choose more tasks of intermediate difficulty. (p. 190-1)
The attributionist’s belief that causal perceptions mediate between
the need for achievement and achievement behavior welcomes the
possibility of intervention. Bar-Tal suggests the following to
change misattributions:
1) that teachers provide tasks suitable to the person’s ability
thereby raising self-confidence through success;
2) that teachers give feedback ascribing causality to ability
and effort.

48
A few intervention studies have been conducted which provide
encouragement in this direction of research. Bar-Tal cites the
Dweck study in which he trained elementary school children to
attribute failure to lack of effort. Dweck reported that these
children started to improve their performance and attribute failure
to insufficient effort. This study was replicated with children
experiencing reading difficulty and found ‘that the attribution-
retrained group was more persistent.
Fennema et al. (1981) designed, implemented, and evaluated an
intervention program "Multiplying Options and Subtracting Bias" to
increase high school women's participation in mathematics courses by
changing the attitudes of female students and others in the
educational community. They reported a significant difference in
the change scores for female students in the experimental group on
the following scales: Knowledge of sex-related differences in
Mathematics, Usefulness of Mathematics, Attribution of Success to
Ability (p < .01), and Stereotyping Mathematics as a Male Domain,
Effectance Motivation in Mathematics, Failure-Ability and Anxiety
Towards Mathematics (p < .10).
Summary of the Literature Review
There are differing consequences of the causal attributions
that students make to their success and failure. The student that
assigns failure to an innate lack of ability is less likely to

49
continue trying. Yet this belief that lack of ability accounts for
failure may at times be inappropriate. Teaching that caters to
left-hemispheric dominance, which prevails at the high school level,
may contribute to many misattributions. Students for the most part
must acquire and demonstrate their knowledge and skills along a
verbal/symbolic deductive scale which evaluates their performance
from poor to excellent and low to high. The cues and social norms
within such a setting are powerful tools in shaping self-images and
achievement-related behavior.
To be "mathematically-minded" may be perceived by some to be
single-minded. Yet the mind of the mathematician processes along
varied modalities. Translating an idea across modes builds its
generalizability and its relationship to other ideas. Just as
important, such representations and translations would offer
"parallel ways of knowing" and address the cognitive and affective
needs of the right-hemispheric learner. Teaching based on a bipolar
strategy which values and exercises the distinct characteristics of
both hemispheres allows opportunities for increased self-awareness
and self-pride as well as the development of an integrated brain.

CHAPTER III
METHOD
Introduction
This chapter contains the procedures of the study in two parts:
first, an overview of the pilot study, a discussion of the
development of instructional procedures, and the results of the
pilot study; second, specific details of the study relating to the
design, instruments used for each hypothesis, the course content,
modification of instructional procedure, data collection and
analysis procedures.
The following research questions and hypotheses were formulated
to examine the relationship between attitudes and hemispheric style
of learning:
Research Question One: Is there a relationship between
mathematical attitudes and hemispheric
dominance?
1. H0: There is no correlation between mathematical
attitudes as measured by the Fenneman-Sherman
subscales on confidence and problem solving and
hemispheric dominance, determined by Your Style of
Learning and Thinking (YSLT) among mathematics
students in the study.
Research Question Two: Is there an interaction between hemispheric dominance and instruction?
2. h : In an environment which accommodates both hemispheric
styles of learning, students will show no preference
for selecting cognitively compatible quizzes to
incompatible quizzes.
50

51
Research Question Three; Can students' mathematical attitudes
3a. H0:
and causal attributions of success and failure be improved with
instruction that exercises both
styles of hemispheric processing?
There is no change in students' attitudes toward
problem solving and self-confidence when instruction is brain-compatible.
3b. Hq: There is no change in reasons assigned by students
for success and failure when instruction is
brain-compatible.
4a. H0: When instruction is brain-compatible, the
right-hemispheric dominant group will show no greater
gain in attitude change toward problem solving and
self-confidence than the left-hemispheric dominant
group.
4b. H0: When instruction is brain-compatible, the
right-hemispheric dominant group will show no greater
gain in changing causal attributions of success and
failure than the left-hemispheric dominant group.
Participants
Pilot Study
A pilot study was conducted during the first 6 weeks of the
fall semester 1982. Due to a schedule change, the anticipated
General Mathematics (Grade 9) classes were changed to 2 Basic
Mathematics classes which enrolled all grade levels except
freshmen. The ages of students ranged from 15 to 19.
The purpose of the pilot was to test the feasibility of the
proposed instructional treatment and to measure attitude change as a

52
result of the experiment. The focus of the Instructions! treatment
during this period was the Inclusion of more right-hemispheric
processing activities.
/"N
Course Content
The topics used for the study during this period were systems
of numeration, explorations with numbers and numerals, and
explorations with geometric figures.
The content is outlined below:
I Other Systems of Numeration
A. Base Five, Base Eight, Binary numbers
II Explorations with Numbers and Numerals: Number Patterns
A. Prime and Composite Numbers
B. Arithmetic and Geometric Sequences
C. Triangular and Square Numbers
III Explorations with Geometric Figures: Geometric Patterns
A. Tessellations of Regular Polygons
These topics were selected because they steer away from a singular
emphasis on computational drill common to basic mathematics classes
yet approach the often neglected intuitive nature of mathematics.
Pretests were administered for topics I and II. Poor student
performance on the pretest was mainly attributed to no previous
learning experience. Content was presented by lecture and/or guided
discovery. Activities included those that assist in developing
right hemispheric processing either by the modal nature of the task,
or by method of reasoning. Lectures were supplemented by textbook
assignments and worksheets to be completed in class or as homework.

53
Development of Instructional Procedures
In this study it was assumed that the thought processes of the
R-Mode were distinct from the L-Mode. Springer offers the following
5 hierarchical characteristics as the most frequently cited:
Left
verbal
sequential, temporal, digital
logical, analytic
rational
Western thought
Right
nonverbal, visuo-spatial
simultaneous, spatial, analogic
gestalt, synthetic
intuitive
Eastern thought
As one reads down the list, the justification moves from empirically
based to theoretically based, and from universally accepted to
speculative. The earlier emphasis by researchers on the
verbal-nonverbal hemispheric differences reflects historically how
many thinkers have organized philosophy into dichotomies. Some
investigators have proposed that the type of response required from
the subject is the psychological property that distinguishes one
hemisphere from the other. Others argue that the all important
factor is the type of stimulus material. More current thinking
argues that basic differences lie in the processing strategies of
each hemisphere, which allow for stimulus and response factors to be
seen as a manifestation either of the left hemisphere’s superior
analytic skills or the right hemisphere's synthetic, holistic
approach.

54
The instructional procedures were designed to correspond
distinctive features of each hemisphere:
to the
Left Instructional Procedure
1) propositions about data that
resulted from visuo—tactile
experiences were stated;
2) relevant rules were presented;
3) examples of applying rules
were provided and explained.
Right Instructional Procedure
1) demonstrations on the use of
manipulative aids were presented;
2) examples of figural representa¬
tions were given and explained;
3) pattern detection and guided
discovery were encouraged.
The characteristics of the first two R—Mode procedures relate to the
response- or stimulus-factors which some researchers believe are the
basis for hemispheric differences, whereas the third procedure falls
along the line of information processing which perceives and
organizes data in complex wholes.
In the R-Mode treatment concepts were presented by a
visual/tactile-inductive method. During the pilot study the use of
manipulative materials — such as chips for trading in other bases,
an electric lightboard for computer numerals, and cut-out geometric
shapes — in conjunction with pictorial representations — the
hundred board for sorting prime numbers, dot drawings of number
sequences, and design-making by tessellations — were used to
introduce and develop concepts.
Inductive reasoning was exercised in particular within the
topics of sequences by asking students to analyze a variety of
patterns without being given a statement of the inference patterns.

Verbal Instruction and boardwork were kept to a minimum for the
right instructional procedure.
In contrast, the stimulus-response factors of the L-Mode
require more verbal actions and the processing strategy abstracts
details and associates them with verbal symbols. The L-Mode
treatment then presented the same concepts in a symbolic-deductive
mode. Students translated visual modes into symbolic forms, and
applied rules to classify and extend patterns.
During the first week the topic of Egyptian, Greek and Roman
numerals was taught in a traditional expository manner while the
investigator waited for the class membership to stabilize. The
first four topics were taught in a right to left sequential
treatment; the sequence in teaching each topic involved either a
visual-to-symbolic presentation or inductive-to-dedutive reasoning.
The last topic is by nature R-Mode oriented.
Developmental exercises were prepared in the form of
worksheets. Commercial textbooks and workbooks were used in
compiling some of the exercises.
Results of the Pilot Study
At the end of the first week of classes, students were asked t
complete the Your Style of Learning and Thinking (YSLT) form. The
following week they completed the Aiken-Dreger Mathematics Attitude
Scale (Appendix C). Four weeks later the attitude scale was
administered again as a post test.

56
As can be seen in Table 1, at .05 level of significance the
students in the pilot were significantly more left-dominant and less
right-dominant than the reference group. This difference could
reasonably be attributed to the YSLT Children’s form. While this
form had been selected as being more appropriate in terms of its
reading level, the content of some of its items was interpreted by
some of the students as childish. Their reactions formed the basis
for the decision to use Form B, the adult form, for the study (Refer
to Appendix D). The students in the pilot were classified as more
right-dominant if their score on the right scale fell at or above
the median of the group, and less right-dominant if it did not.
The obtained t-values for between group comparison in Table 2
indicate a significant difference between the mean scores on both
the pretest and posttest of the Basic Mathematics group and the
Algebra group used as the control. One may conclude that students
in the Algebra classes hold a more positive attitude toward
mathematics than that of the Basic Mathematics group. This does not
seem inconsistent with the findings that indicate a slight
correlation between achievement and attitude.
T-values computed for within group comparisons (Table 3) of the %
experimental group yielded no significant differences; that is the
attitudes of neither the more right- or less right-dominant showed
any significant improvement over the experimental period. In
addition the attitude gain scores obtained by the less right-
dominant group was not significantly different compared to the

57
Table 1
Means and Standard Deviations for "Your Style of Learning and Thinking’ Hemisphere
Left
Right
Integrated
tGrade 10-12 InnerCity Students *N = 12
Reference Groupf Pilot Study* Mean S.D. Mean S.D. t-value
8.72 3.00 11.58 4.19 2.12 9.21 3.97 7.42 1.59 2.13
17.19 5.04 15.25 3.72 1.39
N = 32
Table 2
T-values to Test the Statistical Significance of Attitude Scores Between Groups
Attitude Scale Experimental Groupt Control Group* t-value
pretest 63.25 73.14 3.4136
posttest 62.5 72.86 3.24
fN = 12 *N = 7
Table 3
T-values to Test the Significance of Attitude Gain Scores
Hemisphere Dominance t-value
more right (N = 6) -.188
less right (N = 6) . .33
intergroup .63
58
gain scores of the more right-dominant. While the investigator had
intended to employ the Fennema-Sherman Subscales for the attitude
instrument, they did not arrive in time. The Aiken Scale was not
sufficiently sensitive to the specific constructs of problem solving
and self-confidence.
It should be noted that only a portion of the sample
responded. Sample size, selection bias and mortality were sources
of internal validity that particularly affected the pilot study.
The composition of both the experimental and control groups was very
inconsistent from pretesting to posttesting. In particular, late
admissions, high drop-out rates, high absenteeism, and schedule
changes reduced the number of subjects who responded to both the
pretest and posttest, resulting in a small sample size. While the
intended population had been students in Basic Mathematics classes,
subjects responding were not representative of the population.
Students enrolled in the Basic Mathematics class were upperclassmen
who had taken for the most part only Basic Mathematics classes
throughout their careers. Many of these students had experienced
little or no success in school and/or mathematics classes. These
groups then were characterized by higher rates of absenteeism/
tardiness and mathematics anxiety, lower motivation, and a history
of more failure in mathematics than students observed in Algebra
classes.
Throughout this period, students in the experimental group
often asked when we were going to do some "real mathematics.
During an informal discussion following the experimental period,

59
many students expressed an interest in learning algebra. The
paradox emerges that while these students may not have been happy
about being in a Basic Mathematics class, they definitely had very
strong perceptions and expectations about proper course content.
Students at this age are very well aware of the typical high school
mathematics sequence, and I suspect feel stigmatized in taking a /!
Basic Mathematics course.
The Study
Participants
Students included in this study were those in a Basic
Mathematics 10 Class of an inner-city comprehensive high school.
Students were assigned by the data processing office from a
population of students to be scheduled for sections of this course.
While the original class list contained twenty-nine students, eleven
had been enrolled in my class the previous semester and therefore
were eliminated from the class. Of the remaining eighteen, six
never reported to class. On the second day the sample was
administered the Your Style of Learning and Thinking Form B for the
purpose of classifying each student as being a right-dominant or
left-dominant thinker. The groups formed by cognitive style of
hemispheric dominance were as follows:
right-dominant — 4
left-dominant — 6
Total 10

60
The students received both levels of Instructional treatment. Since
one student dropped out of school and five more attended less than
50%, the final sample totaled five.
Design of the Study
Because the topics in the term course are not commonly taught
in a Basic Mathematics class, the use of another class as a control
was deemed inappropriate to make comparisons.
A single-factor repeated measures design in which one group in
the study received all instructional presentations, rendering each
student as his/her own control, was selected as the basic
experimental design. The course in which the experiment was
conducted was Basic Mathematics 10, which met 5 times a week in the
same room for a 45-minute period each session. A term course,
piloted during the first term of fall semester 1982, which focussed
on incorporating more right-brain processing, was modified and was
employed during the experimental period (Refer to Appendix A).
While many of the topics of the course reinforced computational
skills, the exercises in addition aimed to develop ability in
pattern recognition and to improve skill in visualization. The
materials/activities selected included those that assist in
developing right hemispheric processing either by the visual/tactile
nature of the task or by the method of inductive reasoning as well
as the more traditional symbolic-deductive method. Worksheets were

61
provided to guide students in the use of materials and to guide them
In inductive-deductive methods of reasoning (Appendix B).
Questions, discussions, and dialogue between teacher and students
were encouraged. Student-student interaction occurred through
sharing of manipulative materials. Students were allowed to work
alone or with a partner of their choice. Each weekly lesson plan
allotted the first 2 days for the right hemisphere instructional
procedure (one for manipulatives; the second for figural
representations), 2 days for the left hemisphere instructional
procedure and the fifth day for review and quiz.
During the first week of the study students completed the Your
Style of Learning and Thinking form, the Mathematical Attribution
Scale, and the Attitude Scale.
Students were informed verbally that:
o the course aimed to improve their basic skills through topics possibly new to them;
o the instructor was interested in how they felt about learning mathematics and would appreciate their cooperation
in completing the Your Style of Learning and Thinking (YSLT) form, the Mathematics Attribution Scale (MAS), and the Attitude Scale, but they were not required to do so;
o there were no right or wrong answers on any of the above
forms;
o the forms did not contribute in any way to their school grade (students received a written statement explaining that the basis for determining grades was the average of quiz scores, contributing 50%, added to completed class- and
homework assignments, offering the remaining 50%); and
o anonymity was ensured.

62
At the end of the term, MAS and The Attitude Scale were
administered again as posttests. Upon completion of the experiment,
the students who participated received a full explanation as to the
intent of the study and their role, had the opportunity to ask
questions, and were asked for a written release to use the data they
provided (Appendix K). While followup oral interviews with the
written consent of each participant or legal guardian had been
desired, no participant agreed to be interviewed.
Instruments
Research Question One: Is there a relationship between
mathematical attitudes and hemispheric dominance?
1. Hq: There is no correlation between mathematical attitudes, measured by the Fennema-Sherman subscales on confidence and problem solving, and hemishperic dominance, determined by Your Style of Learning and Thinking (YSLT) among mathematics students at the beginning of the study.
Instruments used for hypothesis 1. Hemispheric dominance was
designated as the aptitude factor. The two dimensions of cognitive
style — R-Mode and L-Mode — were measured by the instrument Your
Style of Learning and Thinking Form B (YSLT) (Appendix D).
Form A is appropriate for adults; the authors modified the
wording and added 4 items to Form A to make Form B more suited for
younger adults.

63
The form is a self-report inventory of forty questions aimed to
classify the learner’s dominant mode of information processing into
one of three categories: right, left, or integrated. For the
purpose of this study, only two classifications, the left and right,
were used.
The authors report the following alternate forms reliability,
based on a sample of fifty undergraduate students:
Right hemishpere .84 Left hemisphere .74
The test-retest study involved 192 gifted and talented high school
students participating in an intervention program designed to give
practice and produce changes in styles of learning and thinking.
The authors provide the following reliability coefficients for Form
B given 5 weeks apart:
Right hemishpere .72
Left hemisphere .74
To conduct the item analyses of Form B, the authors treated the
three choices (R, L, I) for each of the forty items of YSLT as
independent, individual items. The responses of the previously
mentioned 192 honor students were used and point-biserial
correlation coefficients were computed for each of the 120 "items.*
One hundred fifteen of the 120 "items" correlated highest to its
original classification.

64
The authors used a variety of approaches to assess the validity
of the forms. They state that a major source of their validation is
research findings concerning the specialized hemispheric functions.
In another approach, they sought correlations between various
personality/psychology instruments and the scales of the YSLT. They
found either strong tendencies or significant relationships between
figural creative thinking; verbal creative thinking; self-directed
learning; visual imagery; disciplined imagination; and awareness of
others with right hemispheric processing. Remote associations,
acceptance of authority, and self-confidence were found to be
significantly higher for left-hemispheric dominance.
Two Fennema—Sherman Subscales were used to measure the two
affective variables of self-confidence and attitude toward problem
solving. Each scale consists of six positively stated and six
negatively stated items with five response choices ranging from
strongly agree to strongly disagree. One instrument, the Attitude
Scale, was constructed by the investigator by randomly distributing
items from each scale. A score between 1 and 5 is given to each
response, with 5 being assigned to the response that is hypothesized
to produce a positive effect on learning.
The authors report a split-half reliability of .93 for their
Confidence in Learning Mathematics Scale (Appendix D), and a
reliability of .87 for their Effectance Motivation in Mathematics
Scale (E) (Appendix E), intended to measure problem solving

65
attitude. In order to account for any changes due to teacher
effectiveness, items from their Teacher Scale (T) (Appendix F),
designed to measure students' perceptions of their teachers’
attitude toward them as learners of mathematics, were also
distributed throughout the attitude instrument. They report a
split-half reliability of .88 for the Teacher Scale.
Research Question Two: Is there an interaction between
hemispheric dominance and instruction?
2. Hq: In an environment which accommodates both hemispheric
styles of learning, students will show no preference for selecting cognitively compatible quizzes to incompatible quizzes.
Instruments used for hypothesis 2. The quizzes following each
of the first five topics of instruction were intended to measure
students' preference for the instructional mode. Each topic quiz
was constructed as a two-page quiz, pairing one page of more R-Mode
items with another page of more L-Mode items. Students were asked
to select and complete the page of their preference. Quizzes were
scored for the purpose of the study by assigning a value of 1 to a
selection matched to the student's cognitive style and a value of 0
to an unmatched choice.
Research Question Three: Can students' mathematical attitudes and causal attributions of success and failure be improved with instruction that exercises both
styles of hemispheric processing?

66
There is no change in students' attitudes toward problem solving and self-confidence when instruction is brain-compatible.
There is no change in reasons assigned by students for success and failure when instruction is brain-compatible.
4a. H0: When instruction is brain-compatible, the right-hemispheric dominant group will show no greater gain in attitude change toward problem solving and self-confidence than the left-hemispheric dominant group.
4b. H0: When instruction is brain-compatible, the
right-hemispheric dominant group will show no greater gain in changing causal attributions of success and failure than the left-hemispheric dominant group.
Instruments used for hypotheses 3 and 4. The Attitude Scale as
described in an earlier section, instruments for hypothesis 1, was
employed to measure the constructs of self-confidence and attitude
toward problem solving.
Causal attributions were measured by the eight subscales
Success-Ability, Success-Effort, Failure-Ability, Failure-Effort,
Failure-Task, Failure-Environment, Success-Task, and
Success—Environment —■— of the Mathematics Attribution Scale (MAS)
(Appendix H), developed by Fennema, Wolleat, and Pedro (1979).
Ability refers to skill, talent, one's being able to understand an
idea; the task, to the ease or difficulty of performance; effort, to
the amount of time or degree of concentration/determination; and the
environment, to teacher effectiveness or peer facilitativeness.

67
The scale was modified for use with the general mathematics
class by substituting words appropriately in events B, D, F and I,
and items 6 and 7 (Refer to Appendix H).
Item 8, an abibity attribution associated with a success event
was incorrectly typed and undetected until after the experimental
period. Therefore, while each of the other subscales consisted of
four items, the Success-Ability subscale had to be reduced to
three.
The authors report the following reliability coefficients:
Success - Ability Subscale .77 Success - Effort Subscale .79 Success - Task Subscale .39
Success - Environment Subscale .48 Failure - Ability Subscale .63 Failure - Effort Subscale .66 Failure - Task Subscale .48 Failure - Environment Subscale .48
The authors felt that the variety of types of environment and tasks
included could explain the low coefficients for the Task and
Environment subscales.
Content validity for the final version of HAS was ensured by 8
educational researchers familiar with attribution theory who sorted
64 statements into attribution categories. The authors state a 96%
agreement among the sorters on categorizing of items.
Course Content
The term course for the main study was essentially the same
course as that designed for the pilot study but expanded slightly.

68
The content is outlined below:
!• Other Systems of Numeration
A. Egyptian, Greek, and Roman Numerals B. Base Five, Base Eight, Binary Numbers
II» Exploration with Numbers and Numerals: Number Patterns
A. Prime and Composite Numbers B. Arithmetic and Geometric Sequences C. Triangular and Square Numbers
III* Exploration with Geometric Figures: Geometric Patterns
A. Tessellations of Regular Polygons B. Transformations
Appendix A delineates the course objectives.
Modification of Instructional Procedures
Through the pilot study, the investigator realized that the
right hemispheric strategies for some topics relied heavily on
manipulative materials and for others on visual materials. An
effort then was made to make a smoother transition from tactile to
visual to symbolic modes for as many objectives as possible.
With the inclusion of the Egyptian, Greek, and Roman numerals
in the instructional treatments, an abacus for representing and
computing basic operations in Roman numerals, and drawings of
sand-computers and abaci were used to exercise right hemispheric
processing.
During the pilot study, the students were sensitive to cutting
out paper shapes for tiling activities. They felt it was an

69
activity for younger students. Plastic templates prepared by the
Investigator replaced the paper cut-out shapes. The list that
follows summarizes the rlght-hemlsphertc materials and activities
that were used within each topic. The asterisk Indicates those
Items Included after the pilot study.
FIGURE 6
Content I. A. Egyptian,
Greek, and Roman numerals
B. Base Five Base Eight computer numerals
II. A. Prime and composite numbers
B. Arithmetic and Geometric Sequences
C. Triangular and Square Numbers
III. A. Tessellations B. Transformations
R-Mode Materials Manlpulatlves Pictorial Repreaentatlona abacus* sand-computer*, abacus*
chip-training grouping activities electric lightboard
hundred board
Paper folding/cutting activities*
Geoboard*
templates* templates*
diagrams*
dot drawings of number sequences
Esher-type drawings*
A sample packet of R-Mode and L-Mode activities for the course Is
presented In Appendix B. Activities were verified as either R-Mode
or L-Mode by Professor Mary Cullen, Mount Wachusett Community
College, Gardner, Massachusetts (Appendix I).

Data Collection and Analysis Procedures
70
Figure 6 provides specific details of the instruction schedule and
data collection.
The first hypothesis was tested by seeking correlations between
hemispheric dominance and pretest scores on attitude instruments. In
order to test the second hypothesis of no detectible pattern in the
students' preferred quiz mode over time, the Q-statistic which
approximates the chi-square distribution was used. The difference scores
obtained by subtracting the pretest scores from the posttest scores on
the attitude and attribution instruments were used in two-tailed t-tests
to determine the effect of the instructional treatment upon attitude
change.
The following decisions were made before the data were analyzed:
(a) In accordance with the recommendation of the Research Consulting Service, the level of significance (a ) was not to exceed 0.05;
(b) The complete set of results would be reported;
(c) A nonsignificant result was accepted as valuable when it was accompanied by a confidence interval which confirmed that the parameter was in the hypothesized location (Games, p.424-425).
In describing the decision making of his research, Kenneth Vos writes
I found it most valuable to have available the p values for all results rather than referring to only specific p-value limits. I believe a more flexible range of p values should be considered in an educational setting. A range of from .05 to .01 may be unrealistic for experiments conducted in classroom settings....I was comfortable in making reference to p values as large as .20 when these were part of an overall pattern of
"significance." (p.128)
Therefore, while caution was employed in interpreting results as
significant, references to oi levels as large as .25 were made in
identifying trends

71
pretests: February YSLT
1-2 MAS Attitude Scale
INSTRUCTION
Other February 10-17 Numeration Quiz 1
1st week Systems
March 2-8 Other Quiz 2
2n d week Bases
Prime and March 9-16 Composite Quiz 3
3rd week Numbers
March 21-25
4th week
Arithmetic and
Geometric Sequences
Quiz 4
March 28-April 1 Triangular
and Quiz 5
5th week Square Numbers
Tessellations April 4-8 and 6th week Transformations
posttests: MAS
April 11 Attitude 7th week Scale
FIGURE 6. Timeline Outlining The Study.

CHAPTER IV
RESULTS OF THE STUDY
Introduction
This study examined associations among hemispheric styles of
learning and attitudes and the effect upon attitude change of an
instructional design to stimulate right-hemispheric processing as
a complementary strategy to the more traditional left-hemispheric
orientation.
The following questions were raised:
Research Question One: Is there a relationship between mathe¬ matical attitudes and hemispheric dominance?
Research Question Two: Is there an interaction between hemispheric dominance and instruction?
Research Question Three: Can students' mathematical attitudes and causal attributions of success and failure be improved with instruction that exercises both styles of hemispheric processing?
This chapter presents the descriptive data and the statistical
results as they pertain to each hypothesis.
72

73
Analysis of Data
Research Question One: Is there a relationship between mathematical attitudes and hemispheric dominance?
1* HQ: There is no correlation between mathematical attitudes as measured by the Fenneman-Sherman subscales on confidence and problem solving and hemi¬ spheric dominance, determined by Your Style of Learaing and Thinking (YSLT) among mathematics students in the study.
The YSLT was administered to all students for the purpose of
determining their hemispheric dominance. In order to determine
whether the study group differed significantly from the norm,
t-values were computed and found not to be significant (Table 4).
Table 4
YSLT Means and Standard Deviations
Reference Group* Studyf
Hemisphere Mean S.D. Mean S.D. t-value
Left 9.1 4.1 11.15 4.2 1.39
Right 11.3 4.5 9.4 3.8 1.45
*High school students, public and private. N = 189
fN = 9
Table 5 gives the summary pretest data about each of the
cognitive groups. In comparing the pretest mean scores of the
R-mode group to the L-mode group, no significant differences in
attitudes were found.

74
Table 5
A Comparison of Pretests of the R-mode Group versus L-mode Group
Criterion Lett (N
Mean
= 5)
S.D.
Right (N
Mean
= 4)
S.D.
t-value
Confidence 39.2 11.82 50.25 4.023 -1.57*
Effectance Motivation 37.2 6.493 37.75 4.867 -.124
Success - Ability 9.4 2.65 8.5 1.8 .511
Success - Effort 13 3.162 12.25 1.785 .373
Failure - Ability 13 4.147 13 0 0
Failure - Effort 12.4 1.85 10.5 1.5 1.46*
*df = 7 significant at .125 level
Biserial Correlation Coefficients were computed and reported in
Table 6, The correlation coefficient between YSLT and Failure-
Effort was .943, significant at .01 level. The 99% confidence
interval extends from +.5 to +1.0. There exists then a strong
positive linear relationship between the left hemispheric dominant
students and their attributions of failure to effort. A lower level
of significance (a= .10) between hemispheric dominance and
confidence was found. While it appears there is a degree of
association between the right-hemispheric dominance and confidence,
the 95% confidence interval from -0.2 to +0.94 questions the
stability of this result.

75
YSLT
Table 6
Biserial Correlation Coefficients between Cognitive Style and Attitudes
Confidence
- .644*
Effectance Motivation
- .0595
Success - Ability
.2378
Success - Effort
.037
Failure - Ability
Failure - Effort
.943**
‘significant at .10 level “significant at .01 level
Because there was such a high dropout rate among the students
in the study, the investigator believed it might prove worthwhile to
compare the pretest scores of the dropouts with those who completed
the study (refer to Table 7). With the expectation that the
participants' attitudes would be more positive than the dropouts', a
one-tailed t-value was computed and yielded a low-level of
significance for success-ability (a= .125) and success-effort
(a= .10). A 90% confidence interval from -3.76 to -0.24 was
found for Success-Ability; a 95% confidence interval from +0.28 to
+4.52 was found for Success-Effort. It seems then that the
participants were more likely to attribute their success to ability
whereas the dropouts were more likely to attribute their success to
effort. While the t-value for Failure-Ability (a= .25) is not
significant, an 87.5% confidence interval from +0.10 to +3.1 would
support the finding that the dropout group tends to attribute their
failure to ability more than the study group.

76
Table 7
A Comparison of Pretests of the Dropout Group versus the Study Group Criterion Dropout (N = 5) Study (N = 5) t-value
Mean S.D. Mean S.D.
Confidence 43.8 8.59 45 11.58 -.167 Effectance Motivation 39.6 4.93 36.6 6.41 .47 Success - Ability 8.4 2.58 10.4 2.06 -1.21*
Success - Effort 14 1.41 11.6 2.87 1.5“
Failure - Ability 13.6 2.33 12 3.35 .78
Failure - Effort 11.4 2.06 11.4 1.74 0
‘significant at .125 level “significant at .10 level
The hypothesis that there is a correlation between hemispheric style
of learning and failure attributed to effort is accepted.
Research Question Two: Is there an interaction between hemispheric dominance and instruction?
2. H0: In an environment which accommodates both hemispheric styles of learning, students will show no preference for selecting cognitively compatible quizzes to incompatible quizzes.
To test the null hypothesis, the Q statistic which approximates
a chi-square distribution was used to determine the amount of change
in the percentage of quizzes matched to hemispheric dominance
repeatedly measured over the five term topics. For an ot level
2 test the critical value for the Q is X^_a (k-1) with k equal
to the number of repeated measures (Winer, p. 304).

77
Table 8
Summary of the Analysis of Variance of the Quizzes of the Study Group Source of Variation SS df MS
between people .96
within people 5.2
time 1.76 4 .44 residual 3.44 16 .215 total 6.16
n(le-l) SS With n = 5, k = 5, Q = Clme = 6.77
SS w. people
Since the observed Q statistic does not exceed the chi-square
value at .05 level, the null hypothesis is accepted.
Research Question Three: Can students' mathematical attitudes and causal attributions of success and failure be improved with instruction that exercises both styles of hemispheric processing?
3a. Hq: There is no change in students' attitudes toward
problem solving and self-confidence when instruction is brain-compatible.
3b. Hq: There is no change in reasons assigned by students for success and failure when instruction is brain-compati ble.
Table 9 gives the t-test results on the gain scores of the
study group for all the outcome measures. A significant difference
was found for the Failure-Environment Subscale. With a 95%
confidence interval from -5.0 to -0.6, one could reasonably conclude

78
that the students' attributions of failure to such causes as their
teacher or peers decreased. A 90% confidence interval from +0.7 to
+10.9 for effectance motivation lends support to accepting that the
instructional treatment improved all the students' attitude toward
problem solving. For success-effort a 87.5% confidence interval from
-3.2 to 0 indicates the instability of the result and would support no
change in their attributions of success to effort. The tendency that
all the students were less likely to attribute their failure to ability
is supported by a 87.5% confidence interval from -3.0 to -.2. A 90%
confidence interval from -4.0 to -.4 for failure-task supports the
tendency for all the students to lower their attribution of failure to
the task.
Table 9
t test for Gain Scores of the Study Group
Criterion t-value
Confidence .236
Effectance Motivation 2.42**
Success - Ability 187
Success - Effort -1 -55
Success - Environment -1.36
Success-Task 1-24
Failure - Ability -1.725* *
Failure - Effort - .48329
Failure - Environment - 3.5’**
Failure-Task -2.58**
*df = 4, significant at .125 level "significant at .10 level "’significant at .05 level
While the null hypothesis 3a for no change in students' attitudes
toward problem solving and self-confidence Is accepted, the null
hypothesis 3b for no change for failure attributed by students to
the environment is rejected.

79
A.a H o *
4b. H o *
When instruction is brain-compatible, the right- hemispheric dominant group will show no greater gain in attitude change toward problem solving and self- confidence than the left—hemispheric dominant group.
When instruction is brain-compatible, the right- hemispheric dominant group will show no greater gain in changing causal attributions of success and failure than the left-hemispheric dominant group.
Table 10 summarizes the pretest and posttest data for each
cognitive group.
Table 10
Attitude Variables Statistics by Group
Variable Left (N = 3) Right (N = 2) t-value
Mean S.D. Mean S.D.
Confidence Pretest 42.0 4.25 49.5 5.5 -1.33
Posttest 43.3 8.18 49.0 2.0
Effectance Pretest 39.0 7.35 33.0 0.0 1.34
Motivation Posttest 41.3 4.50 44.0 0.0
Success - Pretest 10.67 2.49 10.0 1.0 0.28
Ability Posttest 11.66 0.471 9.0 1.0 3.11"
Success - Pretest 12.0 3.56 11.0 1.0 0.30
Effort Posttest 10.67 0.94 9.0 1.0 1.50
Failure - Pretest 11.33 4.19 13.0 0.0 0.44
Ability Posttest 9.0 0.82 10.5 0.50 1.80’
Failure - Pretest 12.0 1.6 10.5 1.5 0.81
Effort Posttest 11.0 2.45 10.0 0.0 0.45
Success - Pretest 12.67 1.25 13.5 1.5 0.52
Task Posttest 15.67 0.47 13.0 1.0 3.11"
Success - Pretest 14.3 1.7 14.0 1.5 0.19
Environment Posttest 13.0 1.41 13.5 1.0 -0.29
Failure - Pretest 10.67 4.5 14.0 1.0 0.80
Task Posttest 9.3 3.4 10.5 2.5 0.33
Failure - Pretest 10.3 3.8 11.5 0.5 0.43 n n
Environment Posttest 8.0 0.58 8.0 0.0 u.u
df = 3 significant at .20 level
"significant at .10 level

RO
In order to obtain gain scores, the pretest score was subtracted
from the posttest score for each outcome measure considered. The
Information relevant to Hypotheses 4a and 4b Is reported in Tahl e
11. While no significant difference in the amount of change between
right-dominant and left-dominant was found, trends were found on
effectance motivation (a = .10 level), success-task (a = .20),
and failure-task (ot= .25). A 99% confidence interval from 1.3 to
16.1 contains the true difference of the average gain scores of the
two cognitive groups for effectance motivation. The fact that both
limits of the interval are positive indicates that the right-
dominant group's attitude toward problem solving improved more than
the left-dominant. A 90% confidence interval for success-task from
0.7 to 6.0 would support the trend that the left-dominant were more
likely to attribute their success to the task than the right. A
87.5% confidence interval for failure-task from -4 to -.4 suggests
that the right-dominant were less likely to attribute their failure
to the task than the left-dominant.
Table 11 A Comparison of the Gain Score of the
Criterion
Confidence
Effectance Motivation
Success - Ability
Success - Effort
Success - Environment
Success - Task
Failure - Ability
Failure - Effort
Failure - Environment
Failure - Task
*df = 3, significant at .25 level “significant at ,20 level “‘significant at .10 level
R-mode Group versus L-mode Group
t-value
-3491
3.041“*
-.8944
-.292
.667
-1.54“
- .7474
.1285
.68127
-1.378*
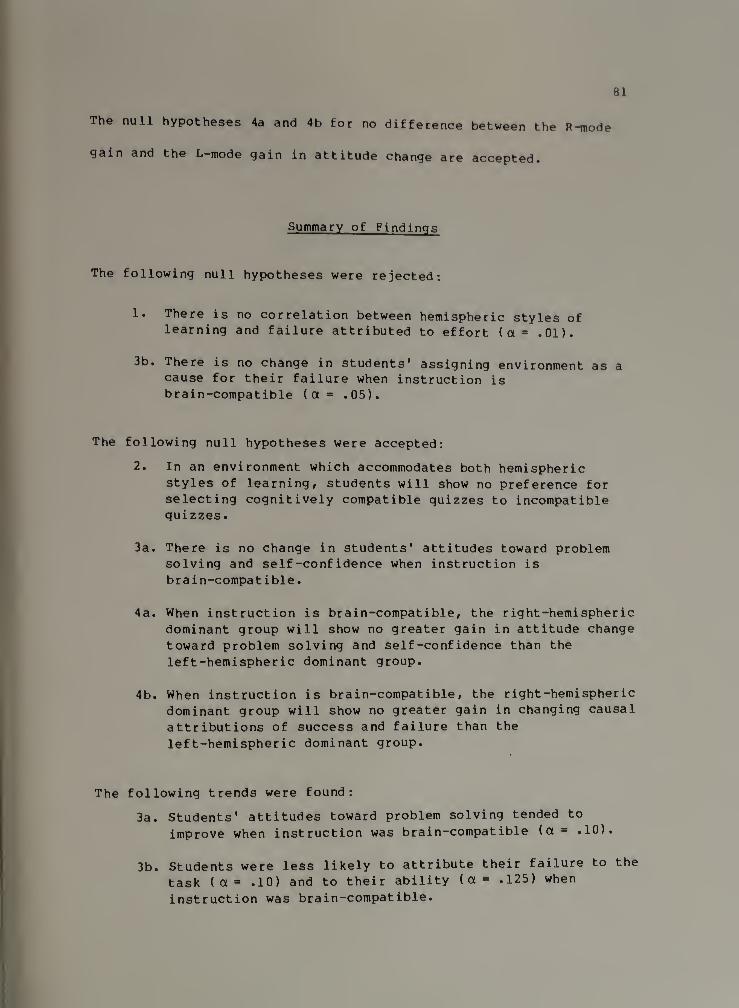
81
The null hypotheses 4a and 4b for no difference between the R-mode
gain and the L-mode gain in attitude change are accepted.
Summary of Findings
The following null hypotheses were rejected:
1. There is no correlation between hemispheric styles of learning and failure attributed to effort (a* .01).
3b. There is no change in students' assigning environment as a cause for their failure when instruction is brain-compatible (a= .05).
The following null hypotheses were accepted:
2. In an environment which accommodates both hemispheric styles of learning, students will show no preference for selecting cognitively compatible quizzes to incompatible quizzes.
3a. There is no change in students' attitudes toward problem solving and self-confidence when instruction is brain-compatible.
4a. When instruction is brain-compatible, the right-hemispheric dominant group will show no greater gain in attitude change toward problem solving and self-confidence than the left-hemispheric dominant group.
4b. When instruction is brain-compatible, the right-hemispheric dominant group will show no greater gain in changing causal attributions of success and failure than the left-hemispheric dominant group.
The following trends were found:
3a. Students' attitudes toward problem solving tended to improve when instruction was brain-compatible (a = .10).
3b. Students were less likely to attribute their failure to the task ( a = .10) and to their ability (a= .125) when
instruction was brain-compatible.

82
4b. The right hemispheric dominant group showed a greater gain In attitude change toward problem solving (a ■ .10).
In addition, when comparing the pretest scores on the attitude
instruments of those students who completed the study with the
pretest scores of those who dropped out, the following trends
emerged:
1. The participants were more likely to attribute their success to ability (a - .125).
2. The dropout students were more likely to attribute their success to effort (a" .10) and their failure to ability
(a - .25).

CHAPTER V
SUMMARY, CONCLUSIONS, RECOMMENDATIONS
This chapter contains a summary of the study and results of the
study. The conclusions drawn from these results are presented,
followed by recommendations for future research and the concluding
statement•
Summary of the Study
Weiner’s Causal Attribution Model served as the theoretical
base for this study. The manner in which students place the credit
for their failures and successes can determine achievement-related
behavior. Ascriptions of failure to ability can result in a "learned
helplessness," in which the students believe it is fruitless for
them to even try, since lack of ability has predetermined any result.
In addition, effort in school settings is perceived as an important
factor by teachers.
The investigator believes that the mismatch between many of the
learning activities/tasks in mathematics classes and the hemispheric
dominance of students contributes to causal judgments and decisions
that students formulate. Taking their cues from the left-hemisphere
oriented class, students would be more likely to base their
ascriptions to internal factors such as ability or effort rather
than to the task.
83

84
The problem that was Investigated then was the effect of
instructional procedures upon the attitudes and
attributions of students who had been classified according to their
hemispheric dominance.
Four hypotheses were generated:
1. H0: There is no correlation between mathematical attitudes as measured by the Fennema-Sherman subscales on confidence and problem solving and hemispheric dominance, determined by Your Style of Learning and Thinking (YSLT) among mathematics students in the study.
2. H0: In an environment which accommodates both
hemispheric styles of learning, students will show no preference for selecting cognitively compatible quizzes to incompatible quizzes.
3a. HQ: There is no change in students' attitude toward problem solving and self-confidence when instruction is brain-compatible.
3b. H0: There is no change in reasons assigned by students for their success and failure when instruction is brain-compatible.
4a. H0: When instruction is brain-compatible, the right hemispheric dominant group will show no greater gain in attitude change toward problem solving and self-confidence than the left-hemispheric dominant
group.
4b. H0: When instruction is brain-compatible, the right-hemispheric dominant group will show no greater gain in changing causal attributions of success and failure than the left hemispheric
dominant group.
An intact class served as the experimental group in a single
factor repeated measures design. Based on the scores of YSLT Form B
administered two days before the beginning of the treatment,

85
students were classified as being in either a right-hemispheric
dominant or left-dominant group. Pretests on attitudes and
attributions were administered the day before the instructional
treatment began. The instructional procedures corresponded to the
distinctive features of the right- and left-hemispheric specialized
f unctions.
The students received both instructional treatments over a 7
week period. Following the presentation of each topic by both
instructional procedures, students selected the quiz form of their
choice. Hypothesis 1 was tested by use of the data from the pretest
scores of the right-dominant student in comparison with the pretest
scores of the left-dominant. In addition, the pretest scores of the
study group were compared to those of the dropout group. Hypothesis
2 was tested by use of the students' quiz selections coded 0 for
unmatched to their cognitive style and 1 for matched to their
cognitive style. T-tests computed on the gain scores of all the
students were used to accept or reject Hypotheses 3a and 3b.
Hypotheses 4a and 4b were tested by comparing the gain scores of the
right-domlnant group with the left-dominant group.
Results of the Study
A t-value was computed to determine any difference between the
cognitive style classification data from the students in the study
with data from a reference group and found not to be significant.

86
For Hypothesis 1 a strong correlation was found between
left-dominant cognitive style and attributions of failure to
effort. An unstable tendency was found between confidence and
right-hemispheric dominance, contrary to the anticipated direction.
At a lower level of significance, it was found that in
comparing those students who dropped out with those who
participated, the former were more likely to attribute their success
to effort and their failure to ability whereas the latter their
success to ability.
To test Hypothesis 2 a Q-statistic was computed on the repeated
measures of quiz preference. Although there was a difference
between the proportion of students who preferred cognitively
compatible quizzes to incompatible, the null hypothesis that
cognitive style and quiz preference are independent was accepted.
The instructional treatment had a significant effect in
changing students' attributions of failure to the environment, and
tended to improve their attitudes toward problem solving.
Tendencies to lower their attributions of failure to the task and to
ability were found.
The data relevant to Hypotheses 4a and 4b were analyzed by
t—tests for each criterion. While no signficant differences were
found in comparing the gain scores of the R-Mode group with the
L-Mode group, trends on effectance motivation, success-task and
failure-task were reported.

87
Conclusions
The conclusions are drawn with the following considerations and
limitations:
1. Each student was classified as either a right-dominant or
left-dominant thinker according to a self-report instrument.
2. Generalizations are restricted by the small sample size.
Quinn McNemar stated:
when group comparisons are made and when the Ns are
relatively small, the null hypothesis is apt to be
accepted too often for the simple reason that a
real difference has to be sizeable before it is
demonstrable by a small sample.
(p. 96)
Therefore the investigator set lower levels of significance
than commonly accepted but also reported confidence
intervals for true population parameters to substantiate the
results.
3. Generalizations are restricted to mathematical concepts
similar to those used in the study.
4. This study presents strategies for more right-hemispheric
thinking that require a minimum of equipment and utilizes
inexpensive materials. During the development and
implementation of this study, microcomputers were not
available in the cooperating public school. It is
conjectured that microcomputers may be an effective tool to
stimulate right-hemispheric processing.

88
Firstly, it appears that there is a relationship between
mathematical attitudes and hemispheric dominance. While the
hypothesized association between confidence and hemispheric
dominance was not supported in this study, relationships between
causal ascriptions of success and failure and hemispheric dominance
were established.
The mean pretest scores of Success-Ability, Success-Effort, and
Failure-Effort were higher for the L-Mode than the R-Mode group.
Such ascriptions would enable the L—Mode group to be more hopeful
about future successes. It seems that the more familiar
left—instructional procedure which offers more learning
opportunities compatible to the L-Mode group may give them an
advantage over the underdeveloped R-mode group in their outlook.
Furthermore, the findings regarding the differences between the
dropouts and the participants substantiate Weiner's Attribution
Achievement Motivation Model. The dropouts attributed their failure
to the stable factor of ability and their success to an unstable
factor of effort. Their resulting expectation of only future
failures does not seem to contradict common sense nor experience.
In contrast, the participants who ascribed their success to ability
expect more success in the future. Their respective shifts in goal
expectations mediated unfortunate behavioral consequences for the
former group and achievement-related behavior for the latter.
Secondly, no strong interaction between hemispheric dominance
and instruction emerged. The reasons why their independence is not

89
refuted is speculative. While it was assumed that, given the
opportunity, students would prefer to exercise their primary mode of
learning, the less familiar R—mode of instruction coupled with
unfamiliar concepts may have caused the students to regress to the
more traditional L-mode. Since the quizzes were not designated by
their hemispheric dominance for the students, they may not have been
sufficiently adept in selecting cognitively compatible quizzes or
may have anticipated one form as being more acceptable than the
other.
Thirdly, it can be inferred from the data that students'
attitudes and causal attributions tend to improve with
brain-compatible instruction. The instructional treatment was
effective in producing a more positive attitude toward problem
solving among all the students, with the R-Mode group showing a
greater gain than the L-Mode. Many of the instructional
actitivies/tasks were designed to engage the right hemisphere which
is theorized to play a role in problem solving. One could speculate
that this experience expanded their reference file of problems and
their repertoire of strategies sufficiently to cause them to enjoy
the challenge and the focalization inherent in problem solving.
For all the students, most of the success-subscales showed a
loss or no significant change. In contrast the failure-subscales
for the entire group showed the most change. One could conjecture
that the unfamiliarity of the right instructional procedure and
tasks interfered with the cues of norms and task characteristics

90
operative in making causal judgments. This interference might have
created an anxiety which had more of an impact upon students’
perception of their success than of their failure. All the students
might have felt the alternative that this new mode offered and
proceeded cautiously by changing their perceptions about failure.
Modest gains in the success-subscales were achieved by the
L-Mode group in their attributions to ability and to the task.
However, the L-Mode group whose primary style of learning is
augmented by this secondary mode can afford to expect success in the
future.
In sum, it may be necessary that students must first make more
favorable attributions to failure prior to success.
Recommendations for Future Research
While some of the findings were not statistically significant,
valuable information was garnered that needs further exploration and
examination.
A correlational study of hemispheric dominance and attitudes
with a larger sample might yield significant differences
undemonstrable by the small sample. Variables such as age, sex,
specific content attitudes (i.e., Algebra versus Geometry), could be
investigated. A similar study of attitudes among dropouts or
potential dropouts with a larger sample could further delineate
common attributes. If attributing failure to ability is a highly
identifiable characteristic for these students, then more
91
then more intervention studies to change misattributions similar to
those mentioned in the literature review should be conducted.
A second recommendation is to examine any interaction between
achievement and cognitive style. While it would still be
interesting to determine if students would demonstrate a preference
for a learning mode with a larger sample of students, their
motivation for selecting could vary both within the individual and
between individuals. It might prove more vaulable to determine if
students' performance on items matched to their cognitive style was
superior to unmatched items.
While it was not within the scope of this study, the
interaction of the teacher's cognitive style with the learner's
style may be important.
The results of the study appear to imply that changes in
failure attributions might precede changes in success-attributions.
Replications could establish the truth of this pattern or other
possible combinations of attributions.
Concluding Statement
Weiner proposes a model that illustrates the relationship
between attitude and behavior and which serves well as a theoretical
rationale for research on mathematical attitudes. Based on Seiner s
theory, this study was undertaken to explore hemispheric styles of
learning as a mediating factor between attitude and achievement.

The results of the study provide evidence that attitudes do have
impact on mathematical learning behavior, and that hemispheric
dominance can be a medium for effecting improved attitudes.
This statement is made with considerable caution since
the limiting factor of the small sample size (n=5) might have
influenced the power of a statistical test and the generaliz-
akility of the results to other settings or to other populations.
In Teaching for the Two-sided Mind. Linda V. Williams writes
The role of the teacher and the classroom he creates is to offer possibilities in such a way that students will both want and be able to learn.
(p.194)
A bipolar teaching strategy may help motivate students by
intervening in the causal attribution-achievement cycle and may
empower them to learn by stimulating complementary sides of the
brain. In the process teachers may help more of their students
discover the dichotomies inherent in the nature of mathematics
and in the nature of learning.

REFERENCES
Aiken, L.R. Jr. Biodata Correlates of Attitudes toward Mathematics in Three Age and Two Sex Groups. School Science and Mathematics. 72 (1972) 386-95.
__• Update on Attitudes and Other Effective Variables in Learning Mathematics. Review of Educational Research. 146 (1976) 293-311.
An Agenda for Action; Recommendations for School Mathematics of the 1980s, Reston, VA: National Council of Teachers of Mathematics, 1980.
Barnett, J.C. & Eastman, P.N. The Use of Manipulative Materials and
Student Performance in the Enactive and Iconomic Modes. Journal for Research in Mathematics Education. 9 (1978), 94-102.
Barnett, J. & Vos, K. A Review of Selected Literature in Applied
Problem Solving Research. In R. Lesh, D. Mierkiewicz, & M.G. Kantowski (Eds.), Applied Mathematical Problem Solving. Columbus, Ohio: ERIC/SMEAC, 1980. (ERIC Reproduction Service ED
180816).
Bar-Tal, Daniel. Attributional Analysis of Achievement-related Behavior. Review of Educational Research. 48 (1978), 259-71.
Baumrind, D. Perspective and Recommendations for the Science Foundation Directorate. In P. DeHart Hurd (Panel Leader), Early Adolescence Perspectives and Recommendations to NSF.
Washington, D.C. : Government Printing Office, 1978.
Beal, J. An Evaluation of Activity Oriented Materials to Help the
Low Achiever Attain Basic Mathematical Competencies. Doctoral Dissertation, University of Nebraska, 1972.
Bell, M. Applied Problem Solving as a School Emphasis: An Assessment and Some Recommendations. In R. Lesh, D. Mierkiewicz, & M.G. Kantowski (Eds.), Applied Mathematical
Problem Solving. Columbus, Ohio: ERIC/SMEAC, 1980. (ERIC
Document Reproduction Service ED 180816).
Bezuszka, S. et al. Designs from Mathematical_Pattarns. Palo Alto,
CA: Creative Publications, Inc., 1978.
Bogen, J.E. Some Educational Implications of Hemispheric Specialization. In M.C. Wittrock, et al., The Human Brain.
Englewood Cliffs, N.J.: Prentice-Hall, Inc., 1977.
93

94
Bork, A. Interactive Learning. In R. Taylor (Ed.) The Computer in the School: Tutor, Tool, Tutee. New York: Teachers College- Press, 1980.
Browder, F.E. The Relevance of Mathematics. American Mathematical Monthly. April 1976 ---
Buckeye, D., Ewbank, W.A. & Ginther, J.L. A Cloudburst of Math Lab
Experiments. Troy, Michigan: Midwest Publications Co., 1971.
Buckeye, D. Cheap Math Lab Equipment. Troy, Michigan: Midwest. Publications Co., 1972.
Callahan, W.J. Adolescent Attitudes toward Mathematics. Mathematics Teacher. 64 (1971), 751-55.
Carpenter, T.; Lindquist, M. ; Matthews, W.; Silver, E. Results of the Third NAEP Mathematics Assessment & Secondary School. Mathematics Teacher, 76 (December 1983), 652-659.
Case, R. Gearing Instruction to Capacity. Review of Educational Research, 45 (1975), 59-87.
Conference Board of the Mathematical Sciences and the National Advisory Committee on Mathematical Education, Overview and Analysis of School Mathematics Grades K-12, Reston, VA: NCTM, 1975:
Cronbach, L.J., & Snow, R.E. Aptitudes and Instructional Methods. New York: Irvington Publishers, 1977.
Cullen, M.A., An Investigation into the Cognitive Styles of Comnunity College Students and the Effects of Instructional Treatment on Their Mathematics Achievement. Doctoral Dissertation, University of Massachuetts, 1980.
Day, M.C. Thinking at Piaget's Stage of Formal Operations. Educational Leadership. 1980, 45-46.
Dayton, C.M. The Design of Educational Experiments. New York: McGraw-Hill Co., 1970.
Dejarnette-Ondrus, P. A Study of the Effect of a Laboratory Approach in Conjunction with Classroom Instruction on Student Performance in and Attitude toward Mathematics. (Doctoral Dissertation, University of Toledo, 1977). Pissertation Abstracts International. 39/06, 3432A.
Dulit, E. Adolescent Thinking a la Piaget: The Formal State. Journal of Youth and Adolescence. 1 (1972), 281-301.

95
Dwyer, T. The Significance of Solo-Mode Computing for Curriculum
e0: 8n; R’ T*yJor The Computer in the School:Tutor. Too!, Tutee. New York: Teachers College Press, 1980.
Education. Heuristic Strategies for Using Computers to Enrich
Early Adolescence Perspectives and Recommendations to th. N.Mnn.1 Science Foundation.Final Report of NSF Early Adolescence Panel Meeting. By Paul DeHart Hurd, Panel Leader. Washington, D.C.: Government Printing Office, 1978.
Edwards, B. Drawing on the Right Side of the Brain. Los Angeles CA: J.P. Tarcher, Inc., 1979.
Epstein, H. & Toepfer, C. Jr. A Neuroscience Basis for Reorganizing Middle Grades Education. Educational Leadership. May 1978. 656—660.
Fennema, E. Mathematics Learning and the Sexes: A Review. Journal for Research in Mathematics Education, 5 (1974), 126-139~
Fennema, E. & Behr, M. Individual Differences and the Learning of Mathematics. In R.J. Shumway (Ed.), Research in Mathematics Education. Reston, VA: NCTM, 1980.
Fennema, E.H. & Sherman, J. Sex—related Differences in Mathematics Achievement and Related Factors: A Further Study. Journal for
Research in Mathematics Education 9 (1978), 189-203.
_. Fennema-Sherman Mathematics Attitudes
Scales. JSAS Catalog of Selected Documents in Psychology 9(6), (1976) Ms. No. 1225.
Fennema, E. Wolleat, P. , Pedro, J.D., & Becker, A. Increasing
Women’s Participation in Mathematics: An Intervention Study. Journal for Research in Mathematics Education. 12 (1981), 3-14.
_. Mathematics Attribution Scale: An Instrument Designed to Measure Students’ Attributions of the Causes of Their Successes and Failures in Mathematics. JSAS Catalog of Selected Documents in Psychology 9(2), (1979) Ms. No. 1837.
Fey, J.T. Mathematics Education Research on Curriculum and
Instruction. In R.J. Shumway (Ed.), Research in Mathematics
Education. Reston, VA: NCTM, 1980.
Fitzgerald, W. Mathematics in a Problem Solving Curriculum. School
Science and Mathematics, 75 (1975).

96
Fitzgerald, W. & Higgins, J. (Eds.) Mathematics Laboratories; Implementation Research and Evaluation. Columbus, Ohio: ERIC/SMEAC, 1974.(ERIC Document Reproduction Service No. ED
Flexer, R. Comparison of Lecture and Laboratory Strategies in a Mathematics Course for Prospective Elementary Teachers. Journal for Research in Mathematics Education 9 (1978), 103-117.
Games, P. & Klare, G. Elementary Statistics: Data Analysis for the Behavioral Sciences^ New York, NY: McGraw-Hill Book Co., 1967.
Gary, E.C. Brain Hemispheres and Thinking Styles. The Clearinghouse 54 (1980), 127-132.
Geschwind, N.. Specialization of the Human Brain. In The Brain. A Scientific American Book. San Francisco: W.H. Freeman and Co., 1979.
Haertel, G. Literature Review of Early Adolescence and Implications for Programming. In P. DeHart Hurd (Panel Leader), Early Adolescence: Perspectives and Recommendations to NSF. Washington, D.C.: Government Printing Office, 1978.
Hart, L. The New ’Brain' Concept of Learning." Phi Delta Kappan, LIX (1978), 293-296.
Hatfield, L.L. Instructional Computing in Mathematics Teacher Education. Journal of Research and Development in Education. 15 (1982), 30-44.
Hatfield, L.L. & Bradbard, P.A. Mathematical Problem Solving: Papers from a Research Workshop. Columbus, Ohio: ERIC/SMEAC, 1978. (ERIC Reproduction Service ED 156446)
Hicks, E.J. The Relationship of Student Characteristics to Achievement in a Junior High School Mathematics Laboratory. (Doctoral Dissertation, University of West Virginia, 1974). Dissertation Abstracts International 36/04, 2077A.
Higgins, J. Problems, Applications, Interest, and Motivation. In R. Lesh, D. Mierkiewicz, & M.G. Kantowski (Eds.) Applied Mathematical Problem Solving. Columbus: Ohio: ERIC/SMEAC, 1980. (ERIC Reproduction Service ED 180816)
_. The Mathematics through Science Study: Attitude Changes in a Mathematics Laboratory. School Mathematics Study
Group Report No. 8, 1969. (ERIC Document Reproduction Service
ED 064174)
Hill, J.P. Understanding Early Adolescence: A Framework. North Carolina: Center for Early Adolescence, 1980.(ERIC Document
Reproduction Service ED 192914).

97
Jacobs, H.R. Mathematics: A Human Endeavor. San Francisco: W.H. Freeman and Co., 1970.
Kantowski, M.G. Processes Involved in Mathematics Problem Solving. Journal for Research in Mathematics Education. 8 (1977), 163-
___• The Teaching Experiment and Soviet Studies of Problem Solving. In L.L. Hatfield & D.A. Bradbard (Eds.). Mathematical Problem Solving: Papers from a Research Workshop. Columbus, Ohio: ERIC/SMEAC, 1978. (ERIC Reproduction Service ED 156446).
Karplus, E.F., Karplus, R. & Wollman, W. Intellectual Development■ beyond Elementary School IV: Ratio, the Influence of Cognitive Style. School Science and Mathematics 74 (1974), 476-82.
Kerr, D. Jr. Mathematics Laboratory Evaluation. In W. Fitzgerald & J. Higgins (Eds.), Mathematics Laboratories: Implementation, Research, and Evaluation. Columbus, Ohio: ERIC/SMEAC, 1974. (ERIC Document Reproduction Service No. ED 102021)
Kidd, K., Meyers, S. & Cilley, F. The Laboratory Approach to
Mathematics. Chicago Science Research Associates. 1970.
Kieren, T.E. Manipulative Activity in Mathematics Learning. Journal for Research in Mathematics Education 2 (1971), 228-234.
Kilpatrick, J. Variables and Methodologies in Research on Problem Solving. In L.L. Hatfield & D.A. Bradbard (Eds.), Mathematical Problem Solving: Papers from a Research Workshop. Columbus,
Ohio: ERIC/SMEAC, 1978. (ERIC Reproduction Service ED 156446).
Konopka, G. Requirements for Healthy Development of Adolescent
Youth. Adolescence 8 (1973).
Kulm, G. Research on Mathematics Attitude. In R.J. Shumway (Ed.)
Research in Mathematics Education. Reston, VA: NCTM, 1980.
Kulm, G. & Bussmann. A Phase-Ability Model of Mathematics Problem
Solving. Journal for Research in Mathematics Education 11
(1980), 179-189.
Lacy, Grace. Creative Thinking and Problem Solving. NY State Department of Education. 1979 (ERIC Reproduction Service ED
192511)
Lane County Mathematics Program (LCMP) Introduction to LCHP Problem
Solving Programs. (ERIC Reproduction Service ED 178354)

98
Lesh’ R* Cognitive Psychology and the Mathematics Laboratory.
Voooio8t°n’ D,C*: DHEW/NItT: 1974 (ERIC Reproduction Service ED
Lesh, R., Mierkiewicz, D. & Kantowski, M.G. Applied Mathematical Problem Solving. Columbus, Ohio: ERIC/SMEAC, 1980 (ERIC Reproduction Service ED 180816)
Lester, F.K. Mathematical Problem Solving in the Elementary School:
Some Educational and Psychological Considerations. In L.L. Hatfield & D.A. Bradbard (Eds.), Mathematical Problem Solvine: Papers from a Research Workshop. Columbus, Ohio: ERIC/SMEAC
• 1978 (ERIC)
_• Research on Mathematical Problem Solving. In R.J. Shumway (Ed.) Research in Mathematics Education. Reston VA- NCTM, 1980.
Lochhead, J. On Learning the Basic Skills Underlying Analytical Reasoning: Teaching Intelligence through Pair Problem Solving. Paper presented at NIE/LRDC Conference on Thinking and Learning Skills, University of Pittsburgh, October 1980.
_• Problem Solving Research: Some Implications for Teachers. Educational Leadership. October 1981.
McLeod, D.B. & Briggs, J.T. Interactions of Field Independence and General Reasoning Ability with Inductive Instruction in Mathematics. Journal for Research in Mathematics Education. 11 (1980), 94-103.
Meiring, Steven. Problem Solving—A Basic Mathematics Goal 1: Becoming a Better Problem Solver. Washington, D.C.: Office of Education (DHEW). 1980 (ERIC Document Reproduction Service ED 186287)
. Problem Solving—A Basic Mathematics Goal 2: A
Resource for Problem Solving. Washington, D.C.: Office of Education (DHEW). 1980 (ERIC Document Reproduction Service ED
186288)
Nelson, D. A Trend in Problem Solving Research. In R. Lesh, D.
Mierkiewicz, & M.G. Kantowski (Eds.) Applied Mathematics
Problem Solving. Columbus, Ohio: ERIC/SMEAC. 1980. (ERIC
Reproduction Service ED 180816)
O'Daffer, P.G. and Clemens, S.R. Geometry: An Investigative Approach. Menlo Park, CA: Addison-Wesley Publishing Co., 1977.

Papejjv’ Windstorms: Children, Computers, and Powerful Ideas. NY: Basic Books, 1980. --
99
--_• Teaching Children Thinking. In R. Taylor (Ed.),
The Computer in the School: Tutor, Tool, Tutee. NY: Teachers College Press, 1980.
PeelJ®’ H*A* Teaching Mathematics via a Programming Language_A Class Box Approach. The Mathematics Teacher 72 (1978), 97-116.
Pluta, R.F. The Effect of Laboratory and Quasi-Lecture Modes of
Instruction on Mathematical Learning of Formal, Transitional,
and Concrete Operational College Students (Doctoral Dissertation
State University of NY at Albany, 1980). Dissertation Abstracts International 41/03, 925A.
Polya, G. How to Solve It Princeton, N.J.: Princeton University Press, 1945.
_• On Learning, Teaching, and Learning Teaching.
American Mathematical Monthly, July 1963, 605-619.
Results from the Second Mathematics Assessment of the NAEP: National
Council of Teachers of Mathematics, 1981.
Schoenfeld, A. Teaching Problem Solving in College Mathematics. In
.. R. Lesh, D. Mierkiewicz, & M.G. Kantowski (Eds.), Applied
Mathematical Problem Solving. Columbis: Ohio: ERIC/SMEAC,
1980. (ERIC Reproduction Service ED 180816)
Sells, L.W. The Mathematics Filter and the Education of Women and
Minorities. Paper presented at the annual meeting of the
American Association for the Advancement of Science. Boston,
MA, February 1976.
Shumway, R.J., ed. Research in Mathematics Education. Reston, VA:
National Council of Teachers of Mathematics, 1980.
Smith, G.W. Quantitative Methods of Research in Education.
Washington, D.C.: College and University Press, 1975.
Smith, K.J. The Nature of Modern Mathematics. Belmont, CA:
Wadsworth Inc., 1980.
Snyder, P.K. Development of a Model of a Mathematics Laboratory for
Secondary Schools. Doctoral Dissertation, University of Denver,
1975: Stone, C.A. & Day, M.C. Competence and Performance Models and the
Characterization of Formal Operational Skills. Human
Development. 23 (1980), 323-353.

100
Suydam, M. & Higgins, J. Activity-Based Learning in Elementary School Mathematics. Recommendations from Research. Columbus, Ohio: ERIC Information Analysis Center for Science, Mathematics and Environmental Education. September 1977. (ERIC Reproduction Service, ED 144840)
Talmage, H. & Hart, A. Investigative Teaching of Mathematics and its Effect on the Classroom Learning Environment. Journal for Research in Mathematics Education 8 (1977), 345-358^
Tapp, Brenda. The Effect of an Individualized Mathematics Laboratory Approach on the Self-Concept and Achievement of Low-achievers in a Semi-rural Junior High School. (Doctoral Dissertation, State University of Georgia, 1977). Dissertation Abstracts International 38/11, 6512A.
Toepfer, C.F., Jr. Curriculum in Design and Neuropsychological Development. Journal of Research and Development in Education. 15 (1982), 1-28.
Torrance, E.P. Hemisphericity and Creative Functioning. Journal of Research and Development in Education. 15 (1982), 29-41.
Tuckman, B. Conducting Educational Research. New York: Harcourt, Brace & Jovanovich, 1972.
Vos, K. Case Study 3: Experiment. In R.J. Shumway (Ed.), Research in Mathematics Education. Reston, VA: NCTM, 1980.
Wheatley, G. The Right Hemisphere's Role in Problem Solving. Arithmetic Teacher. 25 (1977), 36-39.
Wheatley, G., Mitchell, R. Frankland, R. & Kraft, R. Hemispheric Specialization and Cognitive Development: Implications for Mathematics Education. Journal for Research in Mathematics
Education (1978) 20-32.
Wildt, A. & Ahtola, 0. Analysis of Covariance. Sage University Paper series on Quantitative Applications in the Social Sciences, series no. 07-012. Beverly Hills and London: Sage
Publications, 1978.
Wilkinson, J. A Review of Research Regarding Mathematics Laboratories. In W. Fitzgerald & J. Higgins (Eds.), Mathemati cj> Laboratories: Implementation, Research, and Evaluation.
Columbus, Ohio: ERIC/SMEAC, 1974. (ERIC Document Reproduction
Servive No. ED 102021)
Winer, B.J. Statistical Principles in Experimental Design. New
York: McGraw-Hill Book Co., 1962.

101
Witkin, H.A., Moore, C.A., Goodenough, D.R., & Cox, P.W.
Field-dependent and Field-independent Cognitive Styles and Their Educational Implications* Review of Educational Research, 49 (1977), 1-64. --
Wittrock, M.C. The Generative Process of Memory. In M.C. Wittrock et al., The Human Brain. Englewood Cliffs, N.J.: Prentice-Hall, Inc., 1977.

Appendix A
102

103
Topic Objectives
Students should be able to:
la. represent numbers as Egyptian, Greek or Ro—n numeral and perform staple operations
lb. identify the repetitive/additive/ subtractive or positional properties of each
IA Egyptian, Greek Roman Numerals
, and
IB Base Plve, Base Binary Numbers
Number Patterns
Eight lc. change numerals from base ten to other bases
ld. express numerals in other bases in expanded fora and change to base tan
I IA Prime and composite Numbers
2a. Identify prime and composite numbers 2b. check divisibility of numbers by 2, 3,
4, 5, or 9 2c. express a number as the product of its
prime factors
I IB Arithmetic and Sequences
Geo—trie 3a. Identify arlth—tic and geometric sequences
3b. calculate the nth term in each sequence
IIC Triangular and Numbers
Square 4a. recognize the s—Her triangular and square numbers
4b —ke a drawing representing triangular and square numbers
Geo—trie Patterns
IIIA Tessellations Sa. Identify which regular polygons will tsssallate or tile the plane
IIIS Transfor—tione 6a. construct a basic design through a translation, rotation or reflection
Sources: Maths—ties - A Human gdwm by Harold R. Jacobs; W.H. Peas—n and Co. Publishers.
Gsnstal Maths—ties, A Probl— Solving Approach by Lucien Kinney st al.; Bolt Rinshact and Minston, me.
Ths Mature of Modern Maths—tics (third edition) by Karl J. Smith; Brooks/cole Publishers.
Designs from Hathe—tlcal Patterns by Stanley Bezuska et al.; creative Publications.
Geometry: An Investigative Approach by Phares G. O'Daffer 6 Stanley R. Cle—ns; xddison-Wesley Publishing Co.

Appendix B
104

105
0) a-
c « c § —rj ■M X C . C 41 3—**- o-- O i C o , V __o_. « C rH «
• — • -'O ■O C V -0
■o
>
►J
Q
3 1 <0 E
-M-
4H- V £ £
<*
lltl ■p -C CD
• CsG T3 (C-H o H tl E
a X
H > H _) H X O I
3 x
3 O CO

106
-o_ jC 0)
C. 3 JC
-MH
3 C *
-s-^s-g
« T3 CD
4HR
C XI 3
-US V o o
-r-rs cfl ~T77- c *o
. ° -nr^ . ™ >. c. <- oo-a UJ 0J o
t-t r— B-B—« .c j <3
<1) ■P £
• bO'O 03 -H O r( ti E
6 3
3
C 3
<go::t:» c-->
CT t
Coo ~> -c Coo ) CC
Cj • •
t (••OQOo)
l»QOO )
gC
G- <*■
(•E_ CZEE) Cmm)
♦
— (••oooo)
CCEoo^ 0-C5ZED
£c G-v-
l-C
tcc
O G-
+
D t
c-)
t
Cc
c-) C )
t
CC C I
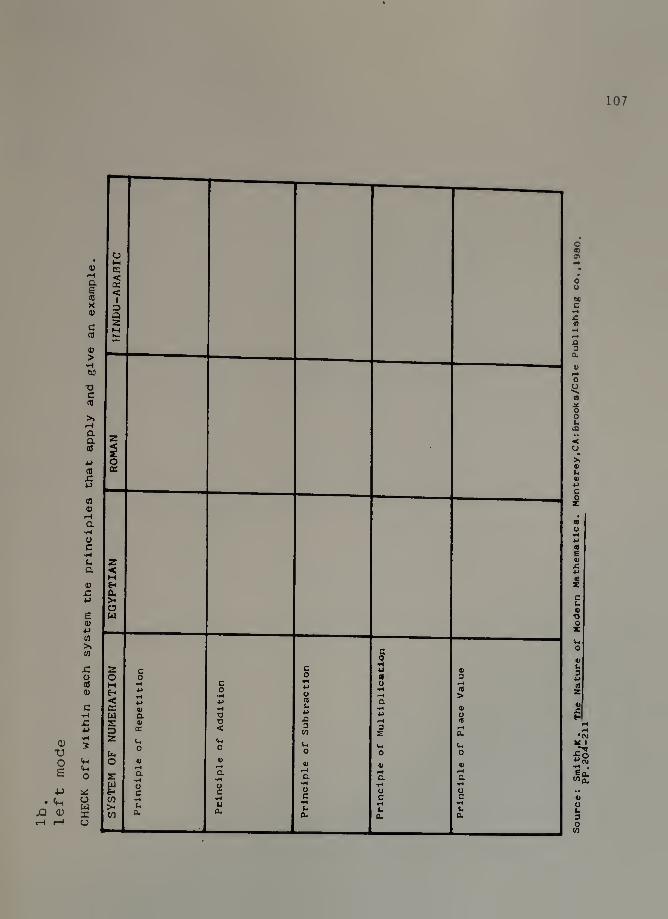
CH
EC
K
off w
ithin
each
sy
ste
m
the prin
cip
les
that
ap
ply
an
d
giv
e
an
exam
ple
. 107
So
urce:
Sm
ith.*
. T
he
Natu
re
of
Mo
dern
Math
em
ati
cs.
Monte
rey,C
A:B
rooks/C
ole
Pu
bli
sh
ing co.,1980.

right
mode
Chip
Trad
ing
Board
108
Usi
ng
yo
ur
ch
ips,
count
fro
m
1 to
20
on
the
board
in
base
fiv
e.

109
lc.
riqht mode
CHIP TPADIMG ACTIVITIES*
Since Base Ten groups by oowers of ten, base five groups by 5s.
Therefore 5 greens can be traded for _Which Is the same as
5 blues can be traded for _.which Is same as _
5 oranges can be traded for _which is 3ame as _
How much does 3_ oranges ^ blues 3_ greens or 333^ve represent?
How muchdoeseach of the following represent:
“five = 111 flve= 1111 five"
Count by fives using your chips and record the numeral below:
5 10 15 20 25 30 35 40 45 50 55 60 65 70 75 80 85 90 95
Count by 6a using your chips and record the numeral below:
6 12 18 24 30 36 42 48 54 60 66 72 78 84 90
Use your chips to do the following operations: (record your answer)
14flve 43 five
+ 31 five 14flve
12flve 3 )1133
X 3,, five
Use your chips to change each of the following to a base-five numeral:
23- -f lve
28- -f lve
61 = -five
150* -five
Can you make up a rule to change a base-ten numeral to a base-five numeral?
* Based upon The Chip Trading Activities Program by Patricia Davidson,
Grace Galton, and Arlene Fair ; Cuisenaire Co. of America, Inc.

lc no
right mode
GrouD the Xs by powers of five and then write the base-five numeral:
xxxxxxxxxx xxxx
•five
xxxxxxxxxx xxxxxxxxxx xxxxxxx
•five
XXXX
•five
XXXX xxxx
•five
xxxxxxx xxxxxxx xxxxxxx xxxxxxx xxxxxxx XX
•five
XXXXXXXXXXXXXXXXXXXX xxxxxxxxxxxxxxxxxxxx XXXXXXXXXXXXXXXXXXXX xxxxxxxxxxxxxxxxxxxx xxxxxxxxxxxxxxxxxxxx xxxxxxxxxxxxxxxxxxxx xxxxxxx
-five
Write the value of the underlined digit in each of the following:
-1f ive=-- 222-_402.. — five -
*1—five3 1234 five3 2031
five"
ld* base-five numerals in expanded form and how much it left represents (in base-ten): mode 24flve= _
300.. - five
1010 five*
lc. Change each of the following base-ten numerals to base-five: left 42a mode five
26-
99-
138-
675-
• five
-five
five
five
lc. Complete the multiplication and addition tables for base 5 below:
left _ mode o
1
2
3
4
0 12 3 4 0 12 3_4
Sources: CieslJinski .h. Modem Mathematics-Grade 7-Bookl. Hfcyes School PublishingCo Kinnay.L; Ruble,V. ;&Brown,G. General Mathematics, A Problem Solving Approach

Ill
1c . right mode
Usin* the light switchboard, count from
by 0 and on is ..represented by 1.
What base do you think this effectively
'What are the olaCe values that match the
1 to 32. Off is represented
represents?
switchboard?
What is the largest number that can be shown on the switchboard?
Write the base-two numeral represented by the switches and then
convert it to a base—ten numeral:
0 • • O OM Off ou
O • O • • OFF at a* Cf?f-
0 • 0 0
oep OH oti
Represent each as they would appear on the switches and then
express it as a base-two numeral:
13 29
Id.
left mode
Write each in expanded form and then how much it equals in base-ten:
1011^. two- ■ — ■ — — -
10101 two
1110 two
lc* Change each into a base-two numeral:
left mode -two
21- -two
41 = -two
Complete the addition and multiplication tables for base-twobelow:
0
1
0
1
Source: 1978, Science Research Associates, Inc. U.S.A. pp.19-20

rig
ht
mode
S
IEV
E
OF
ER
AT
OS
TH
EN
ES
112
0 -H O 0 to
0 f
0 ID
09
0 r*
0 CD
O <T
0 a
cr <T" Sf cr V>
cr 5 s £
0“ CD cr
CT
CD <0 r-» CO N
CO to
CO OD IP
CO vD
CO r-
CD CD 1
CD <r
r* r- H S vo N- T“ IP
r- f~- CO cr
o >0 tH rO * >0 IP
-0 £
vD CD
«sD cr
in ID H IP cn|
ID to
in T
in ID
in >D
LO \p co
\n cr
<r T-» S % £ <r in £ co
'T cr
K> ro tS
tO N
>0 K>
K> to in
>o v9
K> r-
to CP
to cr
<?4 *4 r-\
N <v|
N ro
c\J cvl in
cvl vS
Csl r-
<n[ CD
<vl ir
r\ j r-» T-l ol
-I—l hO
t-4 <r
7-1 In T—»
>n r-A T-4
CD y-A
<r
L jo saxan'Gnw :3mH
5 jo saidjunui :nwQH9 E JO aatdjiinuj :a3U Z J° S3idxauruu :N33HD
: A3M

3a,
113
1 hi-r~t :S
—t>-- 13 Cm 6 °- t —33-: ^ '
3 ♦* 1_ £ : 3 ^ c a co
2 w
[ *H > ! O b
•p >, —«—a-
-a
J
r jr
L_u_ , |
tt--4)-1
O -c_ 0) a
•o • -C-.
CO
ffl CO
*4- CO
& • 0) ~S—3"
JLSL O D
0) -a-
co a
JZ
'
i(jo
?
-
*H S 1 *0
!
- i
C CO
«H
O- J
D 0)
■
c , A •O
■ i
CO J-
2 1
2 3 C
- Q;
c fll
cO C
5 »
00 ?
0 P
■ rH
8 ~ 5 <H
o
“ o' ■P hi
a
o K.
1-2 i
■p p JL
z S
cr c
E A 0)
CJCTJ o
_4J_ QL ^ TJ
<u o»

3a. 114
right mode
Complete each set of_grawing._b*lqw by figuring out. the pattern another
drawing the next tw*, items thft.would fj>Uow_ln e^ch:
0000000
3a.
left mode
(e)_U_■■_ ■ HB wm_d hl i |
Si
1 ! - i ! 1
When -—*-*" ' ' *
vou have completed the drawin gs, go bad k and see if you can1 recognizei
and (record the' numerical sequence I it illustri t ptes. ;
1 , -1-!
-| !- 1
i 1-^-
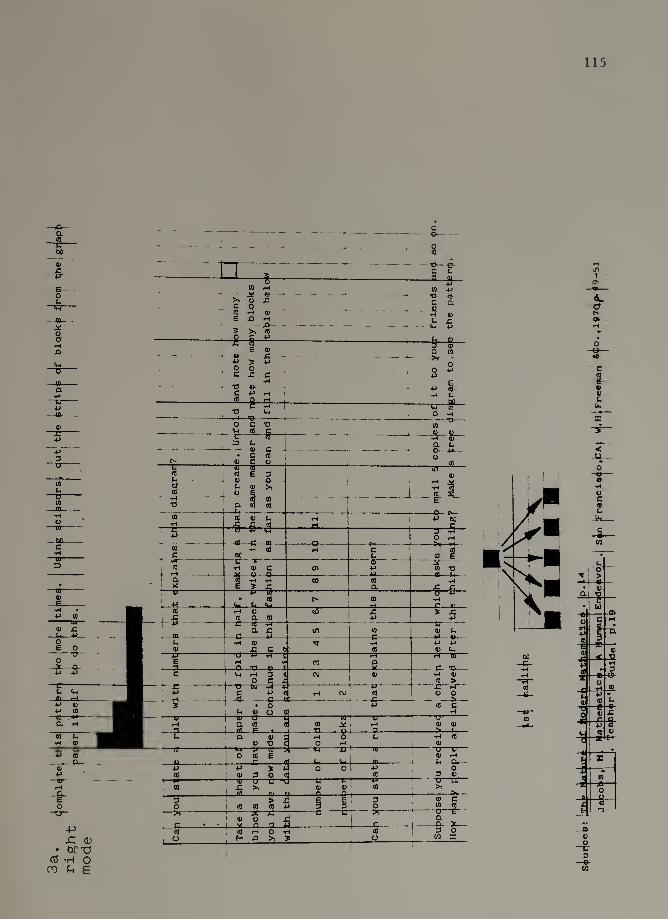
115

3a.
right mode
116
Fill in the missing terms : explain how you found them.
1 4 7 ] io Q
5 13 21 □ 11 15 □ 23 Q
3 □ 19 □ □ □ 22 31 40
5 □ □ 25 7 □ □ □
left Which among the following are arithmetic sequences? Explain your answer, mode
.01 .02 .03 .04
6 6 6 6 6
11 10 9 9
2 4 8 16 32
1/6 1/3 1/2 2/3 5/6
right Fill in the missing terms: explain how you found them, mode
1 5 25 1 I
4 12 36 1 1 D
2 14 n 686
□ □ 18 54 162
i □□ 64 256
o □ □ □ left Which among the following are geometric sequences? Explain your answer
mode 8 8 8 8
1 1/3 1/9 1/27
3 12 48
1 4 9 16 ...
Sources: The Nature of Modern Mathematics, pp.18-19
Mathematics. A Hunan Endeavor. pp.42-51

117
in * a a
a >
<*• >r
& CD
-4-4- H-A-
♦ in
'O c CM rH
4 O
to O *2 m
H <*• 4X
« T3 X „ 41 4) 0 C 6T3 A 4)
-a - 6 p (Q 1 4) V U £ •H . -* 3 “*» c
H C 0 8 3 >>. v 4) e c ce
41 3 » > ^0 o <o o - X £ |W V- T3
1 4) 0 rH E
C*' 0)
0)
Sir t* T3
rr
S TT c o
c- « 4) K O n 4)
*
c l o
8 4) 5 5
+ 4-
CO •
CO %
eg
ev¬ en •
CM
Q CO ..

118
— © — - >
-a— • re
•c —K
CU- > t ♦-»
X 1 1 ■h
oc 1 1 0)
2
re c*.. .
>*
T3 c -
X
e** - -• -
§ .*■ 7
as
-g-
k - V
c c.
k,
X © r
r ©
£
o
• ■ £
i in
tfie
sa
• j
/)
X
S) . ..._
re . 0)
> ©
► k- -
-£T -
rH - *4 — —
re c
©
*T
X
<T - -
a
, E #- — o- O <M
Zj « ’ « 3 ?
c 0
i
<n
X
a. k ©
w £r « k*
It •O 0
k & rH *J
C\J «
A £ jL3L
2 X •H
r •ft rH (U
0) - <£--
re H
<M ■ - - 0
<H
re re *->
Gf c
rH 0) a
c .-SL (0_
J X © ^ *
2 * -
a © rH ■jft-jj-
S 2
W. a
© D c
T7~ ©- tu a)
rH
*h re re A
V © 01. -A-
2-1- £ c.
re
0 JO
4-»
£
© k
■ KjJ--
C P k 4 © a ij
X ©
a 0
<u o or •H
u a) «J £
■ A - —C—E-
T 5" £ -H
- rH
D U.
-<> Qt
0
© fcl - •H w
M rH
« ' M a. .c|
<m <m re o. .on.
**•
02
1 - c-
4J re £
n (A- *4-
! 4-»
HH— I H o
* £J|_ ” rt

..j.T
,0+ ,«
ofo
,r4 ^l4
e|4
b,r
*, *
>4
“ f—
««
*P *
4»
V“‘I
b^.
pn<| c^.t
f H
“M
8-
119
Geo
metr
y.
An In
vesti
gati
ve A
ppro
ach
Sh
ill
Th
rou
gh P
att
erns
8
SB
A,
19
74
.

120
6a, right mode
Trace the triangle onto a plastic lid, .Out out the shaoe and use the lid
as a temDlate to follow the directions below:
A reflection is a flip of a figure overa vertical line or horizontal line.
Use your tenolate to flio the triangle vertically.
Use your temolate to flip the triangle over a horizontal line.
A translation is a slide left/right or up/down.
Use your template to slide the triangle to the right.
Use your template to slide the triangle down.
A rotation is a turning of the figure about a given point.
Use your template to turn the triangle 90° clockwise once, twice, & 3 times. about point C.
6

6a.
rig
ht
mode
121
SounH
: B
ezua*ka|,S
, ;K
en
«ejj
,M,
;&S
ilv
ejy
,l.
, Fro
m ,
Kajt
h^m
atl
call P
att
ern
s.j P
^lo A
?to
^;
Cre
ati
ve
Pu
bli
c*
tlp
nt,
J9'8
, p
,15

122 Quiz # 2
More Left-Mode NAME DATE
1) Write the place value for base-five numerals:
2) Gtoud the dots by powers of five. Then write it as a base-five numeral.
o o o o o 0 0 o 0 o o o o o
o o o o o o o o 0 o o o o 0 o o o o o 0 o o o
0 0 0 five o o o o 0 0 o o five o o o o o 0 0
3) Write the Diace value of the underlined digit:
42 314 4121 21 fivi ̂ five five five
4) Write in expanded form. Then write it as a base -ten numeral,
224five - -
34five - -
5) Change each number to base five:
30 __ 147 _ five five
6) Write the place value for base-two numerals:
7) Write the base-two numeral represented on the switches. Then
write it as a base-ten numeral. _
o o O • O •
two ON oN oN oFF ON OFF
g) Represent the number 47 on the row of switches. Then write in base-two.
O o o o o o
9) Write in expanded form. Then write it as a base-ten numeral.
Ill two
101101 two
1100 two

123 Quiz #2 More Right-Mode Name Date
1) v/rite the Diace value for base-five numerals:
2) Group the dots by powers of five.
five
o < o < o <
o <
o o o o o
five
Then write it as a base-five numeral.
five .o o o o
o o o o o o
five -five
3) Write the value of the underlined digit: 314 — five -
4) Write in expanded form. Then write it as a base-ten. numeral.
224,
34
five
five
5) Change each number to base-five:
30 -five
147 five
6) Write the place value for base-two numerals:
7) Write the base-two numerals represented n the switches.
Then write it as a base-ten numeral.
8) Represent each ;n the switches. Then write xn base-two.
9) Write the base-two numeral in expanded form.Then write it as a base-ten numeral.
Ill two

Appendix C
124

125
The Revised Math Attitude Scale
Directionst Plssss writs your name in the upper right hand corner. Each of the
statements on this opinionnaire expresses a feeling which a particular person
has toward mathematics. You are to express, on a five-point scale, the extent
of agreement between the feeling expressed in each statement and your own personal feeling. The five points aret Strongly Disagree (SD), Disagree (D),
Undecided (U), Agree (A), and Strongly Agree (SA). You are to encircle the letter(s) which best indicates how closely you agree on or disagree with the
feeling expressed in each statement AS IT CONCERNS YOU.
1. I am always under a terrible strain in a math class. 30 0 U A SA
2. I do not like mathematics, and it scares
me to have to taka it. SD D U A SA
3. Mathematics is very interesting to me,
and I enjoy math courses. SD D U A SA
4. Mathematics is fascinating and fun. SD D U A SA
5. Mathasmtics makes me feel secure and
at the same time it is stimulating. SD D U A SA
6. My mind goes blank, and I am unable to
think clearly whan working math. SD 0 U A SA
7. I feel a sense of insecurity when
attempting mathasmtics. SD D U A SA
a. Mathematics makes me feel uncomfortable,
restless, irritable, and ispatient. SD D U A SA
9. The feeling that i have toward mathe¬
matics is a good feeling. SD D U A SA
10. Mathematics makes me feel as though
I'm loot in a jungle of mabars and
can't find my way out. 30 D U A SA
11. Mathasmtics is something which Z enjoy
a great deal. SD D U A SA
12. When Z hear the word math, Z have a
a feeling of dislike. SD D U A SA
13. I approach math with a feeling of
hesitation, resulting from a fear of
not being able to do sath.
14. I really like mathematics. 15. Mathematics is a course in school which
I have always enjoyed studying. 16. It makes me nervous to even think about
having to do a math problem.
17. I have never liked math, and it is my
most dreaded subject.
SD SD
SO
SD
SD
D D
D
D
D
0 u
u
u
u
A A
A
A
A
SA SA
SA
SA
SA
18. I am happier in a math class than In
any other class. 19. I feel at ease in mathematics, and I
like it very much. 20. I feel a definite positive reaction to
mathematics; it's enjoyable.
30 D u A SA
SD D U A SA
SD 0 U A SA

126 1. 2. 3.
4.
5. 6. 7.
a. 9.
10. 11. 12. 13.
14.
15. 16.
17.
18.
19.
20. 21. 22. 23. 24.
25.
26.
27.
28. 29.
30.
31. 32.
33.
34.
35.
36.
Mathematics is enjoyable and stimulating to me.
I'm not the type to do well In math.
My teachers think I'm the kind of person who could do well in mathematics.
Most subjects I can handle O.K., but I have a knack for flubbing up math.
I'm no good in math.
I like math puzzles.
For some reason even though I study, math semi unusually hard for me.
I am sure I could do advanced work in mathematics.
Math has been my worst subject.
I do as little work in math as possible.
My math teachers would encourage me to take all the math I can.
My teachers have encouraged me to study more mathematics.
I would rather, have someone give me the solution to a
difficult math .problem than to have to work it out for myself.
I can get good grades in mathematics.
I would talk to my math teachers about a career which uses
math.
When it comes to anything serious I have felt ignored when
talking to math teachers.
Math teachers have made me feel I have the ability to go on
in mathematics.
When a math problem arises that I can't iamediately solve, I
stick with it until Z have the solution.
I think Z could handle more difficult mathematics.
Z don't think Z could do advanced mathematics.
The challenge of math problems does not appeal to me.
Whan a question is left unanswered in math class, Z continue
to think about it afterward.
Z have found it hard to win the respect of math teachers.
Z have had a hard time getting teachers to talk seriously
with me about math settles.
Getting a mathematics teacher to taka me seriously has
usually bean a problem.
Z don't understand how some people can spend so much tins on
math and seen to enjoy it.
Z am sure that Z can learn mathematics.
Math puzzles are boring.
Once Z start trying to work on a math puzzle, I find it hard
to stop.
My teachers think advanced math is a waste of time for me.
generally Z have felt secure about attempting mathematics.
Figuring out mathematic problems does not appeal to me.
My teachers would think Z wasn't serious if I told them I
was interested in a career in science and mathematics.
Z am challenged by math problems Z can't understand
losMdiately. I have a lot of self-confidence when it comes to math.
My math teachers have been interested in my progress in
mathematics.

Appendix D
127
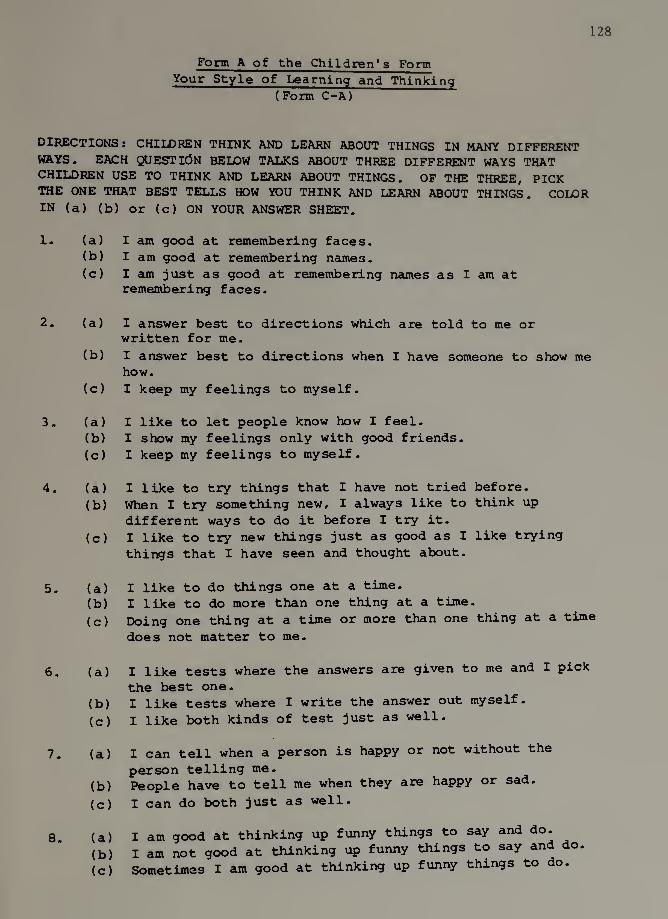
128
Form A of the Children's Form
Your Style of Learning and Thinking
(Form C-A)
DIRECTIONS: CHILDREN THINK AND LEARN ABOUT THINGS IN MANY DIFFERENT
WAYS. EACH QUESTION BELOW TALKS ABOUT THREE DIFFERENT WAYS THAT
CHILDREN USE TO THINK AND LEARN ABOUT THINGS. OF THE THREE, PICK
THE ONE THAT BEST TELLS HOW YOU THINK AND LEARN ABOUT THINGS. COLOR
IN (a) (b) or (c) ON YOUR ANSWER SHEET.
1. (a) I am good at remembering faces.
(b) I am good at remembering names.
(c) I am just as good at remembering names as I am at
remembering faces.
2. (a) I answer best to directions which are told to me or written for me.
(b) I answer best to directions when I have someone to show me
how.
(c) I keep my feelings to myself.
3. (a) I like to let people know how I feel.
(b) I show my feelings only with good friends.
(c) I keep my feelings to myself.
4. (a) I like to try things that I have not tried before.
(b) When I try something new, I always like to think up
different ways to do it before I try it.
(c) I like to try new things just as good as I like trying
things that I have seen and thought about.
5. (a) I like to do things one at a time.
(b) I like to do more than one thing at a time.
(c) Doing one thing at a time or more than one thing at a time
does not matter to me.
6. (a) I like tests where the answers are given to me and I pick
the best one.
(b) I like tests where I write the answer out myself.
(c) I like both kinds of test just as well.
7. (a) I can tell when a person is happy or not without the
person telling me. (b) People have to tell me when they are happy or sad.
(c) I can do both just as well.
8. (a) I am good at thinking up funny things to say and do.
(b) I am not good at thinking up funny things to say and do.
(c) Sometimes I am good at thinking up funny things to do.
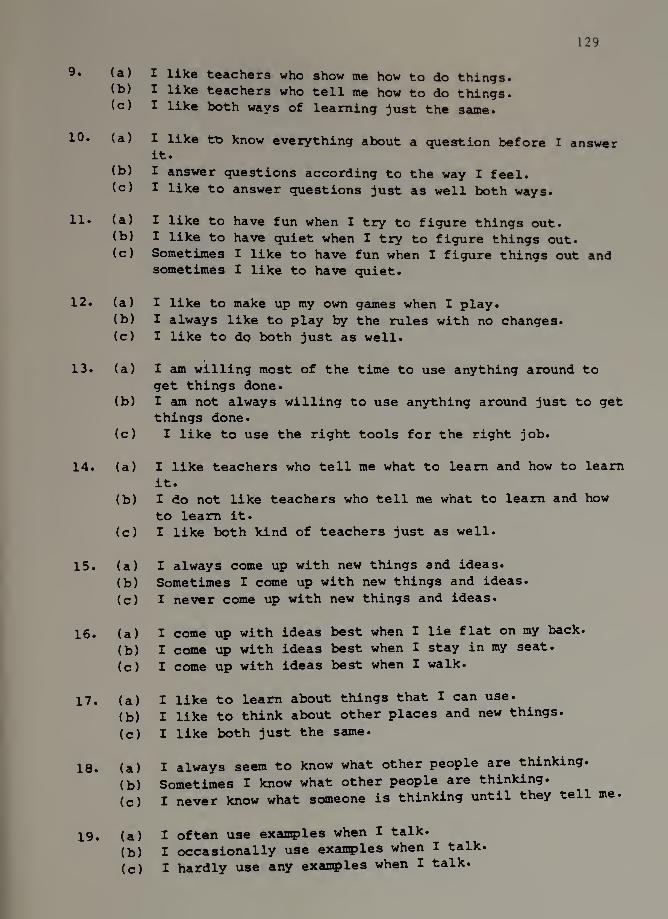
129
^ like teachers who show me how to do things*
1 like teachers who tell me how to do things*
(c) I like both ways of learning just the same.
10. (a) I like to know everything about a question before I answer it.
(b) I answer questions according to the way I feel.
(c) I like to answer questions just as well both ways.
11. (a) I like to have fun when I try to figure things out.
(b) I like to have quiet when I try to figure things out.
(c) Sometimes I like to have fun when I figure things out and
sometimes I like to have quiet.
12. (a) I like to make up my own games when I play.
(b) I always like to play by the rules with no changes.
(c) I like to do both just as well.
13. (a) I am willing most of the time to use anything around to
get things done.
(b) I am not always willing to use anything around just to get
things done.
(c) I like to use the right tools for the right job.
14. (a) I like teachers who tell me what to learn and how to learn
it.
(b) I do not like teachers who tell me what to learn and how
to learn it.
(c) I like both kind of teachers just as well.
15.
16.
17.
18.
19.
(a) I always come up with new things and ideas.
(b) Sometimes I come up with new things and ideas.
(c) I never come up with new things and ideas.
(a) I come up with ideas best when I lie flat on my back.
(b) I come up with ideas best when I stay in my seat.
(c) I come up with ideas best when I walk.
(a) I like to learn about things that I can use.
(b) I like to think about other places and new things.
(c) I like both just the same.
(a) I always seem to know what other people are thinking.
(b) Sometimes I know what other people are thinking.
(c) I never know what someone is thinking until they tell me.
(a) I often use examples when I talk.
(b) I occasionally use examples when I talk.
(c) I hardly use any examples when I talk.

130
20. (a)
(b)
(c)
I often get many ideas from examples.
I occasionally get ideas from examples.
I hardly get any ideas from examples.
21. (a)
(b)
(c)
I like tro answer easy questions.
I like to answer hard questions.
I like to answer both kinds of questions just the same.
22. (a)
(b) I am always like to answer to people who excite me.
I always like to answer to people who can show me that they are right.
(c) I like to answer to both kinds of people just the same.
23. (a)
(b)
(c)
1 like to work on one problem at a time.
I like to work on many problems at the same time.
I can do just as well both ways.
24. (a)
(b) I like to learn facts like names and dates.
( like to learn about what people think might happen
someday.
(c) I like to learn facts like names and dates just as well as
learning abut what people think might happen someday.
25. (a)
(b)
(c)
I like to make sense out of everything I read.
I like to use the things I read about.
I like to do both. •
26. (a)
(b)
(c)
The way I answer a problem depends on how I feel inside.
I answer a problem by carefully picking the best answer.
I answer problems both ways.
27. (a)
(b)
I like to picture the answer to a problem in my head.
I do not like to picture the answer to a problem in my
head.
(c) It does not make any difference to me.
28. (a) I like to answer questions by carefully picking out the
(b)
(b)
best answer.
I like to answer questions by guessing.
I like to answer questions either way.
29. (a)
(b)
I can explain myself better by talking.
I can explain myself better by moving my hands while I
(c)
talk. I can explain myself either by talking or by showing with
my hands.
30. (a)
(b)
I learn best when the teacher explains the lesson to me.
I learn better when the teacher shows me a picture of what
she/he wants me to do.
(c) I can learn either way.

131
31. (a)
(b)
(c)
I remember better when the teacher explains things to me.
I remember answers better to problems I picture in my head.
I can remember things just as well either way.
32. (a) I like to figure out all the steps in the answer to a problem.
(b) I like to write out everything about the answer to a
problem.
(c) I like answering problems either way.
33. (a)
(b)
(c)
• I like to tell a story by talking or writing it down.
I like to tell a story by drawing or giving a puppet show.
I like to tell a story either way.
34. (a)
(b)
(c)
I get lost very easily.
I can find my way around even in strange places.
Sometimes I find my way around; sometimes I get lost.
35. (a)
(b)
(c)
I like to do things.
I like to explain things.
I like both just as well.
36. (a)
(b)
(c)
In school, I like to read best of all.
In school, I like to draw things.
I like drawing and reading about the same.

July 14, 1982
132
Beverly A, Mawn
147 Winchester Street
Brookline, Massachusetts 02146
Dr. Cecil R. Reynolds
Department of Educational Psychology and Measurements 130 Bancroft Hall
Lincoln, Nebraska 68588
Dear Dr. Reynolds:
I am interested in using the children's form of "Your Style of
Learning and Thinking," in a study that I will be conducting this
fall. This study - to examine the interaction of right left learning styles with a math lab teaching strategy - is being
completed in partial fulfillment of my D.Ed. degree from the
Uhiversity of Massachusetts/Amherst•
I therefore am seeking your permission to reprint the children's
form and request that a copy of the most recent technical manual be
forwarded to me. I will be glad to pay for any costs for
reproduction or mailing.
BAM/blm

Form B of the Adult's Form Your Style of Learning and Thinking
133
INSTRUCTIONS: People differ in their preferred ways of learning and thinking. On the answer sheet provided, describe your style of learning and thinking by circling either (a) (b) or (c). In each item, three different styles of learning or thinking are described. Select the one that describes most accurately your strength or preference.
1* (a) not good at remembering faces (b) not good at remembering names (c) equally good at remembering names and faces
2. (a) respond best to verbal instructions (b) respond best to instruction by example (c) equally responsive to verbal instruction and instruction by
example
3. (a) able to express feelings and emotions freely (b) controlled in expression of feelings and emotions (c) inhibited in expression of feelings and emotions
4. (a) playful and loose in experimenting (in sports, art, extracurricular activities, etc.)
(b) systematic and controlled in experimenting (c) equal preference for playful/loose and
systematic/controlled ways of experimenting
5. (a) prefer classes where I have one assignment at a time (b) prefer classes where I am studying or working on many
things at once (c) I have equal preference for the above type classes
6. (a) preference for multiple-choice tests (b) preference for essay tests (c) equal preference for multiple-choice and essay tests
7. (a) good at interpreting body language or the tone aspect of
verbal communication (b) poor at interpreting body language; dependent upon what
people say (c) equally good at interpreting body language and verbal
expression
8. (a) good at thinking up funny things to say and/or do (b) poor at thinking up funny things to say and/or do (c) moderately good at thinking up funny things to say or do

134
(a) prefer classes in which I am moving and doing things
(b) prefer classes in which I listen to others
(c) equal preference for classes in which I am moving and
doing things and those in which I listen
10. (a) use factual, objective information in making judgments
(b) use personal experiences and feelings in making judgments
(c) make equal use of factual, objective information and
personal experiences/feelings in making judgments
11. (a) playful approach in solving problems
(b) serious, all-business approach to solving problems
(c) combination of playful and serious approach in solving
problems
12. (a) mentally receptive and responsive to sounds and images
more than to people
(b) essentially self acting and creative mentally with groups
of other people
(c) equally receptive and self acting mentally regardless of
setting
13. (a) almost always am able to use freely whatever is available
to get work done
(b) at times am able to use whatever is available to get work
done
(c) prefer working with proper materials, using things for
what they are intended to be used for
14. (a) like for my classes or work to be planned and know exactly
what I am supposed to do
(b) like for my classes or work to be open with opportunities
for flexibility and change as I go along
(c) equal preference for classes and work that is planned and
those that are open to change
15. (a) very inventive
(b) occasionally inventive
(c) never inventive
16. (a) think best while lying flat on back
(b) think best while sitting upright
(c) think best while walking or moving about
17. (a) like classes where the work has clear and immediate
applications (e.g., mechanical drawing, shop, home
economics) (b) like classes where the work does not have a clearly
practical application (literature, Algebra, history)
(c) equal preference for the above type of classes

135
18.
19.
20.
21.
22.
23.
24.
25.
26.
27.
(a) like to play hunches and make guesses when I am unsure about things
(b) rather not guess or play a hunch when in doubt
(c) play hunches and make guesses in some situations
(a) like to express feelings and ideas in plain language
(k) like to express feelings and ideas in poetry, song, dance, etc.
(c) equal preference for expressing feelings and ideas in plain language or in poetry, song, dance, etc.
(a) usually get many new insights from poetry, symbols, etc.
(b) occasionally get new insights from poetry, symbols, etc.
(c) rarely ever get new insights from poetry, symbols, etc.
(a) preference for simple problems
(b) preference for complex problems
(c) equal preference for simple and complex problems
(a) responsive to emotional appeals
(b) responsive to logical, verbal appeals
(c) equally responsive to emotional and verbal appeals
(a) preference for dealing with one problem at a time
(b) preference for dealing with several problems at a time
(c) equal preference for dealing with problems sequentially or
simultaneously
(a) prefer to learn the well established parts of a subject
(b) prefer to deal with theory and speculations about new
subject matter
(c) prefer to have equal parts of the two above approaches to
learning
(a) preference for critical and analytical reading as for a
book review, criticism of movie, etc.
(b) preference for creative, synthesizing reading as for
making applications and providing information to solve
problems
(c) equal preference for critical and creative reading
(a) preference for intuitive approach in solving problems
(b) preference for logical approach to solving problems
(c) equal preference for logical and intuitive approaches to
solving problems
(a) prefer use of visualization and imagery in problem solving
(b) prefere language and analysis of a problem in order to
find solutions
(c) no preference for either method

13* 28.
29.
30.
31.
32.
33.
34.
35.
36.
37.
(a) preference for solving problems logically
(b) preference for solving problems through experience
(c) equal preference for solving problems logically or through
experience
(a) skilled in giving verbal explanations
(b) skilled in showing by movement and action
(b) equally able to give verbal explanations and explanations
by action and movement
(a) learn best from teaching which uses verbal explanation
(b) learn best from teaching which uses visual presentation
(c) equal preference for verbal explanation and visual
presentation
(a) primary reliance on language in remembering and thinking
(b) primary reliance on images in remembering and thinking
(c) equal reliance on language and images
(a) preference for analyzing something that has already been
completed
(b) preference for organizing and completing something that is
unfinished
(c) no real perference for either activity
(a) enjoyment of talking and writing
(b) enjoyment of drawing or manipulating objects (c) enjoyment of both talking/writing and drawing/manipulating
(a) easily lost even in familiar surroundings
(b) easily find directions even in strange surroundings
(c) moderately skilled in finding directions
(a) more creative than intellectual
(b) more intellectual than creative
(c) equally creative and intellectual
(a) like to be in noisy, crowded places where lots of things
are happening at once (b) like to be in a place where I can concentrate on one
activity to the best of my ability (c) sometimes like both of the above and no real preference
for one over the other
(a)
(b)
(O
»rimary outside interests are aesthetically oriented, that
s, artistic, musical, dance, etc. ,rimary outside interst are primarily practical and
ipplled, that is, working, scouts, team sports,
:heerleading, etc. jarticipate equally in the above two types of activities

137
38. (a) vocational interests are primarily in the general areas of
business, economics, and the hard sciences, i.e.,
chemistry, biology, physics, etc. (b) vocational interests are primarily in the general areas of
the humanities and soft sciences, i.e., history, sociology, psychology, etc.
(c) am undecided or have no preference at this time
39. (a)
(b)
prefer to learn details and specific facts
prefer a general overview of a subject, i.e., look at the
whole picture
(c) prefer overview intermixed with specific facts and details
40. (a)
(b)
mentally receptive and responsive to what I hear and read
mentally searching, questioning, and self-initiating In
(c)
learning
equally receptive, responsive and searching/self-initiating

138
GEORGIA STUDIES OF CREATIVE BEHAVIOR 1SS RIVIRHIU. DRIVB
ATH1N*. GIOROIA 30601
uuMJ 'L
SOLD TO
INVOICE NO.
SHIPPED TO
Ms. Beverly A. Mawn 147 Winchester Street Same Brookline, MA 02146
OATi
2-1-83
OROIR NO
Letter VALliMAM
apt FIRMS SHIRR10 VIA
First Class I PRO I COLL |
x OUANflfv nis< UiPTIQN fHICf AMOUNT
Copying preliminary norme-technical manuals for Forms At, B, and C, TOUR STYLE OF LEARNING AND THINKING *5.00
Postage 2.07
TOTAL *7.07
Permission is granted to reproduce either Form B or C for use in research project.
(Notes In my opinion, Form C contains a better sampling of items for adults, especially graduate students.)
COT # M
ro«M NO MI01U ) AVAJLAAU PROM BUSINIU INVILONR AAANUPACTURIRS. INC • BRONX. N.V • CLINTON. FINN • MlLAOM. PARK. ILL. • AMAHIIAA. CAL IP

Appendix E
139

CONFIDENCE IN LEARNING MATHEMATICS SCALE (C)
Weight
1. + Generally I have felt secure about attempting mathematics.
2. + I am sure I could do advanced work in mathematics.
3. + I am sure that I can learn mathematics.
4. + I think I could handle more difficult mathematics.
5. + I can get good grades in mathematics.
6. + I have a lot of self-confidence when it comes to math.
7. I'm no good in math.
8. I don't think I could do advanced mathematics.
9. I'm not the type to do well in math.
10. For some reason even though I study, math seems
unusually hard for me.
11. Most subjects I can handle O.K., but I have a knack for
flubbing up math.
12. Math has been my worst subject.

Appendix F
141

142
EFFECTANCE MOTIVATION IN MATHEMATICS SCALE (E)
Weight
I like math puzzles.
Mathematics is enjoyable and stimulating to me.
When a math problem arises that I can't immediately
solve, I stick with it until I have the solution.
Once I start trying to work on a math puzzle, I find it
hard to stop.
5. + When a question is left unanswered in math class, I
continue to think about it afterward.
6. + I am challenged by math problems I can't understand
immediately.
7. Figuring out mathematic problems does not appeal to me.
8. The challenge of math problems does not appeal to me.
9. - Math puzzles are boring.
10. - I don't understand how some people can spend so much
time on math and seem to enjoy it.
11.
12.
I would rather have someone give me the solution to a
difficult math problem than to have to work it out for
myself.
I do as little work in math as possible.

Appendix G
143

TEACHER SCALE (T) HA
Weight
1. + 2. +
3. +
4. +
5.
My teachers have encouraged me to study more mathematics.
My teachers think I'm the kind of person who could do
well in mathematics.
Math teachers have made me feel I have the ability to go
on in mathematics.
My math teachers would encourage me to take all the math
I can.
My math teachers have been interested in my progress in
mathematics.
6. I would talk to my math teachers about a career which
uses math.
7.
8.
9.
10.
11.
When it comes to anything serious I have felt ignored
when talking to math teachers.
I have found it hard to win the respect of math teachers.
My teachers think advanced math is a waste of time for
me.
Getting a mathematics teacher to take me seriously has
usually been a problem.
My teachers would think I wasn't serious if I told them
I was interested in a career in science and mathematics.
I have had a hard time getting teachers to talk
seriously with me about mathematics.
12.

Appendix H
145

146
MATHP1ATICS ATTRIBUTION SCALE
(Algebra ) '
Elizabeth Fennama, Patricia Wolleat, and Joan Daniala Padro
Univarsity of Wisconsin - Madison
You ara going to raad about an avant which could hava happanad to you. In
addition, you ara going to saa four possibla causas of that avant. You ara going
to raspond to how you faal about whathar tha causas listad could raally axplain tha
avant if it had happanad to you. Each avant and its possible causas ara listad In a group. In aach group an avant is followad by four possibla causas. You are to
raad the event carefully and then respond to how you feel about each of the causes of the event.
EVBfr At A part of your math haamork waa wrong.
Causes
1. You just can't seen to remember to do the steps.
2. You were careless about completing it.
3. The part marked wrong included a step which was more difficult.
4. You were unlucky.
Event A says, "A part of your math homework was wrong." Number 1, 2, 3, and 4
are probably causas for that event. Look at Number 1. Think about whether this
could be a causa for event A, "A part of your math homework was wrong." It says,
"You just can't seam to remember to do tha step." Do you STRONGLY AGREE or just
AGREE? Are you UNDECIDED, do you DISAGREE, or STRONGLY DISAGREE with that as a
cause of Event A? Find Number 1 on your answer sheet. Indicate how you feel about
Number 1 as a cause of the event. Fill in the correct circle. Remember A*Strongly Agree, B»Agree, OOndacided, ^Disagree, and E-Strongly Disagree.
Now look at Number 2, "You were careless about completing it." Do you
STRONGLY AGREE, AGREE) are you UNDECIDED, do you DISAGREE or STRONGLY DISAGREE with
Number 2 as a cause for Event A? Mark your answer sheet in the appropriate
circle. Now mark how you feel about Number 3 and 4 as possible causes of Event A.
Then go to Event B, read it and mark on your answer sheet how you feel about each
cause for that event.
EVENT Bt You got the grade you wanted for the semester in Algebra.
5. 'Hie content of the class is easy. 6. You spent a lot of time each day studying Algebra.
7. The teacher is good at explaining Algebra.
8. You have trouble with some of the problems in the daily assignment.
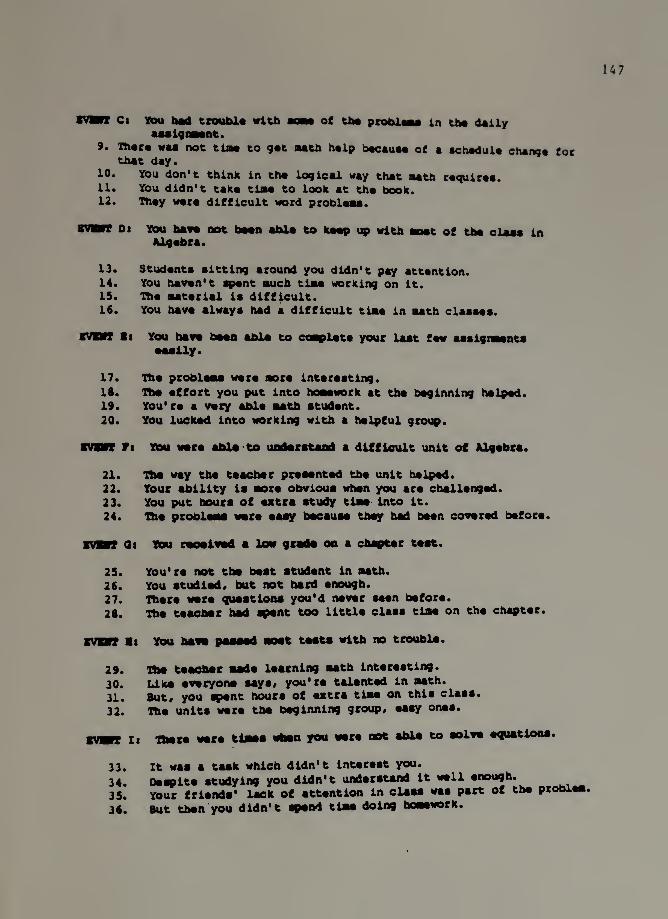
IVMT Ct You bad trouble with memo of the probleas In the daily assignment.
9. There wee not tiae to get aath help because of a schedule change for that day.
10. You don't think in the logical way that aath requires. 11. You didn't take tiae to look at the book. 12. They were difficult word probleas.
SW Oi You have not been able to keep up with aoat of the class in Algebra.
13. Students sitting around you didn't pay attention. 14. You haven't spent auch tiae working on it. 15. The aaterlal is difficult. 16. You have always had a difficult tiae in aath classes.
ffvnrr It You have been able to complete your last few assignments easily.
17. The probleas were aore interesting. 18. The effort you put into hoaswotk at the beginning helped. 19. You're s very able aath student. 20. You lucked into working with a helpful group.
not Ft YOu were able to understand a difficult unit of Algebra.
21. The way the teacher presented the unit helped. 22. Your ability is aore obvious when you are challenged. 23. You put hours of extra study tiae into it. 24. The probleas were easy because they had been covered before.
MT <31 You received a low grade on a chapter test.
25. You're not the best student in aath. 26. You studied, but not hard enough. 27. There were questions you'd never seen before. 28. The teacher had spent too little class tiae on the chapter.
IVOR It You have passed aoat tests with no trouble.
29. The teacher node learning aath interesting. 30. Lika everyone says, you're talented in aath. 31. But, you spent hours of extra tins on this class. 32. The units were the beginning group, easy ones.
xvnr? Zt There were times when you were not able to solve equations.
33. It was a task which didn't interest you. 34. Despite studying you didn't understand it well enough. 35. Your friends' lack of attention in class was part of the problen. 36. But than you didn't vend time doing homework.

Appendix I
148

149
tSeUi'
TELEPHONE: 632-WOO
January 25, 1982
Ma. Bavarly Mawn 14? Wincester Straat Brookline, MA. 02146
Dear Beverly,
The sample exercises and activities found in your Appendix A should be both interesting and thought provoking for your students. As I read them, Sections la, 2a, 2b, 2c, 4a, 4b, 5a and 6a are all activities which require the use of the right hemisphere of the brain. Use of the left brain is needed for exercise lb. Activities lc and 3a have sections using the right portion of the brain while other portions in these two seetions have exercises which appear to require the use of the left hemisphere of the brain. After our conversation I realised that you wanted the contrasts exemplified
It will be very.interesting to see if these very appropriate right-brain activities alter the achievement level or improve the attitude toward mathematics of your ninth grade students. Congratulations on a fine project. Anything that will improve the achievement level of student, especially in mathematics, is a worthwhile project. Ours is a quantstive society where many of its citisens are mathematical illiterates. If I can be of further assistance in this valuable project, please let me know.
Sincerely yours.
Mary A. Cullen Professor Department of Mathematics

Appendix J
150

151
THE SCHOOL COMMITTEE OF THE CITY OF BOSTON
James Corscadden Headmaster
BOSTON PUBLIC SCHOOLS THE ENGLISH high SCHOOL
P’;u-.3ea 1321
Deer Student or Parent: May 25, 1983
I have been a teacher in the Boaton Public Schools for the past eleven years. My studies in the Graduate School of the University
of Massachusetts/Amherst have focussed on teaching and learning mathematics. For the past year I have been exploring the relationship of students' attitudes toward their learning and the possibility of improving their attitudes. A one term Basic Mathematics course on niaaerical and geometric patterns was designed to improve numerical ability while giving students choices in how they can learn mathematics.
The study is being completed as a degree requirement for a doctoral degree in education. The purpose of the study then is to find out
whether, and to what degree, this learning experience had been successful in improving attitudes and learning.
In order to measure how you felt about learning mathematics and to better understand how learning takas place, I reviewed and selected
various questionnaires, that have been used in other studies on
learning, to be completed by you. As explained to you orally, the
questionnaires you completed at the beginning and the end of the course were not required and did not contribute in any way to your
course grade. I refer you to the written page on classroom policies I gave you during the first week which declared that half of your
grade was determined by the quizzes and the other half by class and home assignments. I am now requesting your permission to release
the information collected on the questionnaires you answered. Your granting permission is completely voluntary.
If you agree, you may be assured of complete anonymity. The identification number on the questionnaire was necessary to match
the post-test with the pre-test. Your name will never be used, and
at the end of the study, identifying records will be destroyed.
Vetnod of Qeveiooing Er‘»c;iv« Lejrnim
AVENUE LOUIS PASTEUR • BOSTON, V.ASSACH JSST~3 02115 • *33-6300 ATEA 61 7

In addition, I will be intere.ted in aaking you some question, about
your experience as a student in my class. The purpose of the
interview will be to find out in further detail how various part, of
the course affected you. The interview will last about 1 sVESs!
Again your participation is completely voluntary and all of your answers will be anonymous. your
If you have any questions, please feel free
pleased to answer them. Thank you for your to ask and I will be
cooperation.
Sincerely,
Beverly Mawn
I give my permission to release the information provided on the questionnaires I completed.
student's or guardian'. date
I do not give ay permission to release the information provided on
the questionnaires I collated.
student's or guardian's data
I am willing to be interviewed and I give ay permission to release
the information obtained through my voluntary interview. I also
understand that it does not affect ay course grade in any way.
student's or guardian's name date
I am not willing to be interviewed and understand that it does not
affect my coarse grade in any way.
student's or guardian1s name date

Appendix K.
153

Ap
pen
dix
154
u o o CN o CO ao
< 00 CN o CN kJ CO ^4 tfl to V 0> 4J u r-* SO U 0 oa ^ n» ro CO o
£ C/5
U r- *■0 r* ^4 CN in m ro
Ski CN <* o o CO -«
•u o ao (0 CO < Os »-4 0 « CO MJ u <V 0 U o ro a\ ao ro o CL w OU 00 P0 ro ro
U ^ SO in ro *• in m in CN
(TJ 4J
to 4J £ c >
’ 4> ■ * 00 ao ao ao ao c <U CN CN CN CN CN O' e \ \ \ \ \
( •«* *• Os o p* ro Os (0 Q. H CN (0 < !
■U
0) £ Q \ c ■U
e CN
TJ • 1 ™ CN CN CN
c i n» n» \ 0) j£ i \ \ \ V 4J <• i : r* SO in 4J < •
N
2
iff J o in © •n o cn ro cn n» sO
* J 00 o o in
OB 00 in sO o J I
1
i ro CL 00 CN ao CN r* ro ao as ao
CN J o o vo ro o 00 ao ao ao SO
-i mi CO in so ro CN
in CN ao <Tv Os
B •
"4 u (X mi •J (X mi
6- <1 Jl cn x| J 00
H m
16
ex in CN
12
*n
4J c a> TJ CN ro m
3 u CO