The Relationship between Trade and Investment: A Case ... · KIEP Korea Institute for International...
26
Korea Institute for International Economic Policy The Relationship between Trade and Investment: A Case Study of Korea and India November 2, 2012 Misu Kim & Choongjae Cho <ARTNeT Conference on Empirical and Policy Issues on Integration in Asia and the Pacific>
Transcript of The Relationship between Trade and Investment: A Case ... · KIEP Korea Institute for International...
Korea Institute for International Economic Policy
The Relationship between Trade and Investment:A Case Study of Korea and India
November 2, 2012
Misu Kim & Choongjae Cho
<ARTNeT Conference on Empirical and Policy Issues on Integration in Asia and the Pacific>
KIEP Korea Institute for International Economic Policy
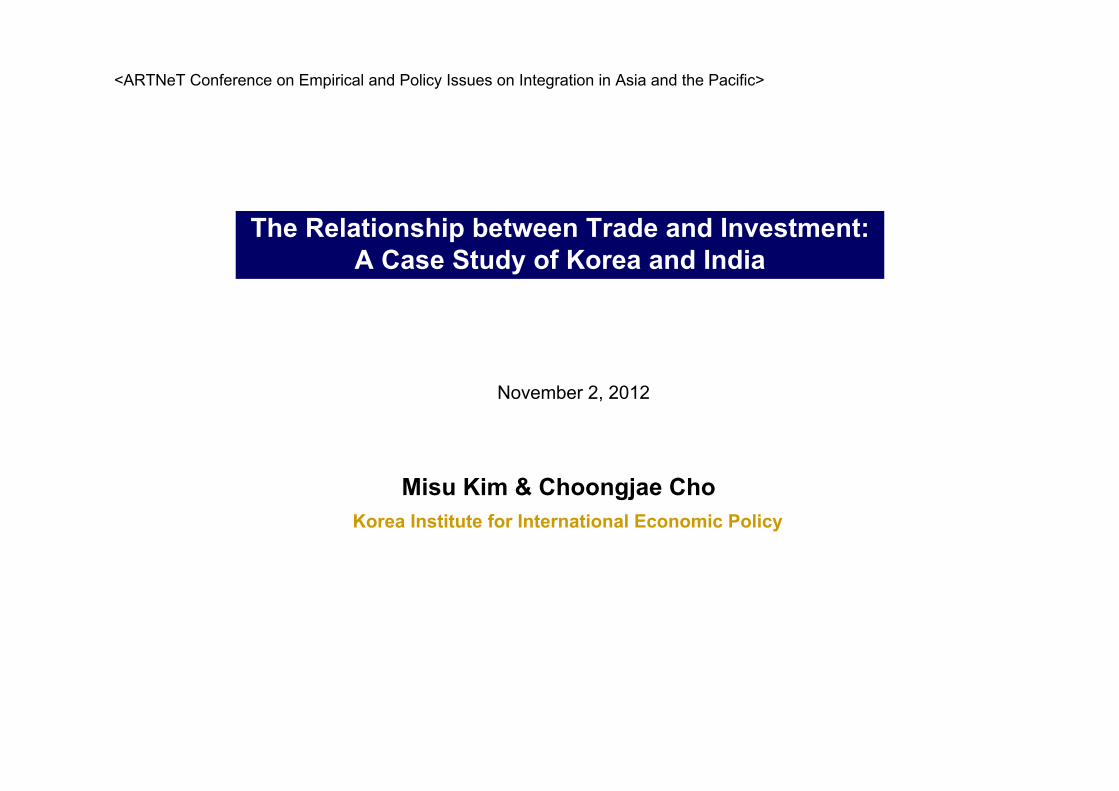
Introduction
Literature Review
Trend of Trade and Investment
Conclusion
Estimation and Results
1
Contents
KIEP Korea Institute for International Economic Policy
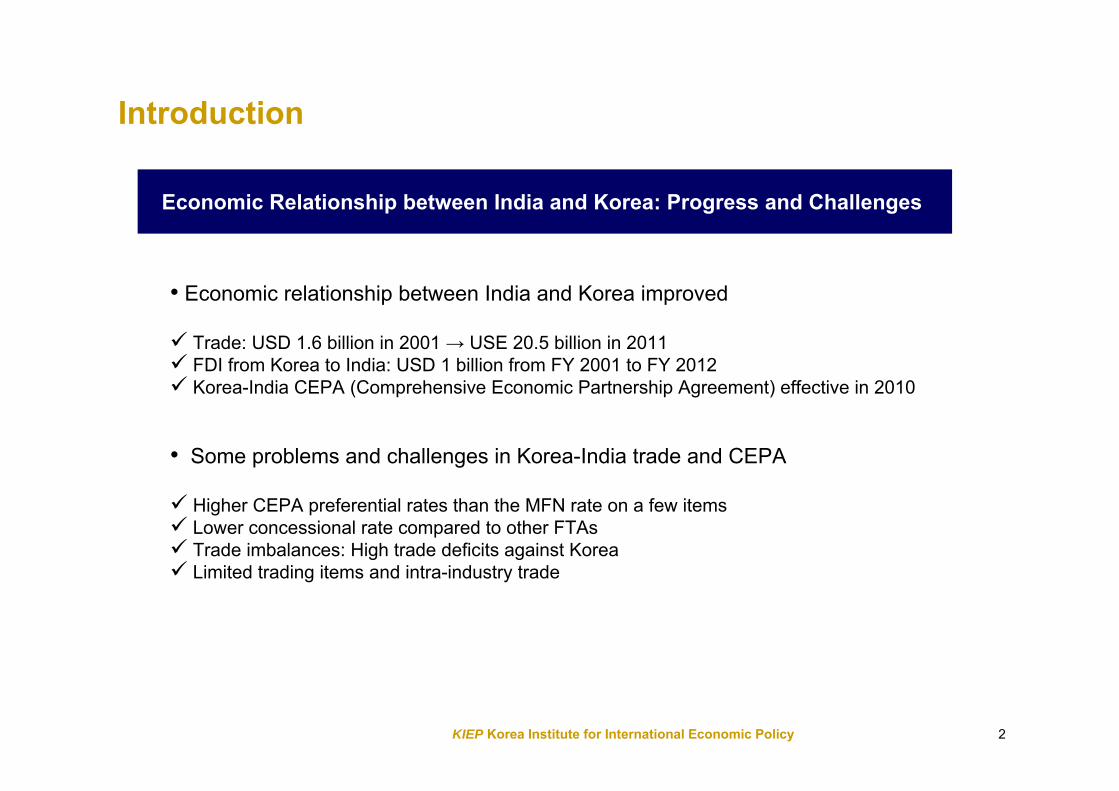
Economic Relationship between India and Korea: Progress and Challenges
2
• Economic relationship between India and Korea improved
Trade: USD 1.6 billion in 2001 → USE 20.5 billion in 2011 FDI from Korea to India: USD 1 billion from FY 2001 to FY 2012 Korea-India CEPA (Comprehensive Economic Partnership Agreement) effective in 2010
• Some problems and challenges in Korea-India trade and CEPA
Higher CEPA preferential rates than the MFN rate on a few items Lower concessional rate compared to other FTAs Trade imbalances: High trade deficits against Korea Limited trading items and intra-industry trade
Introduction
KIEP Korea Institute for International Economic Policy
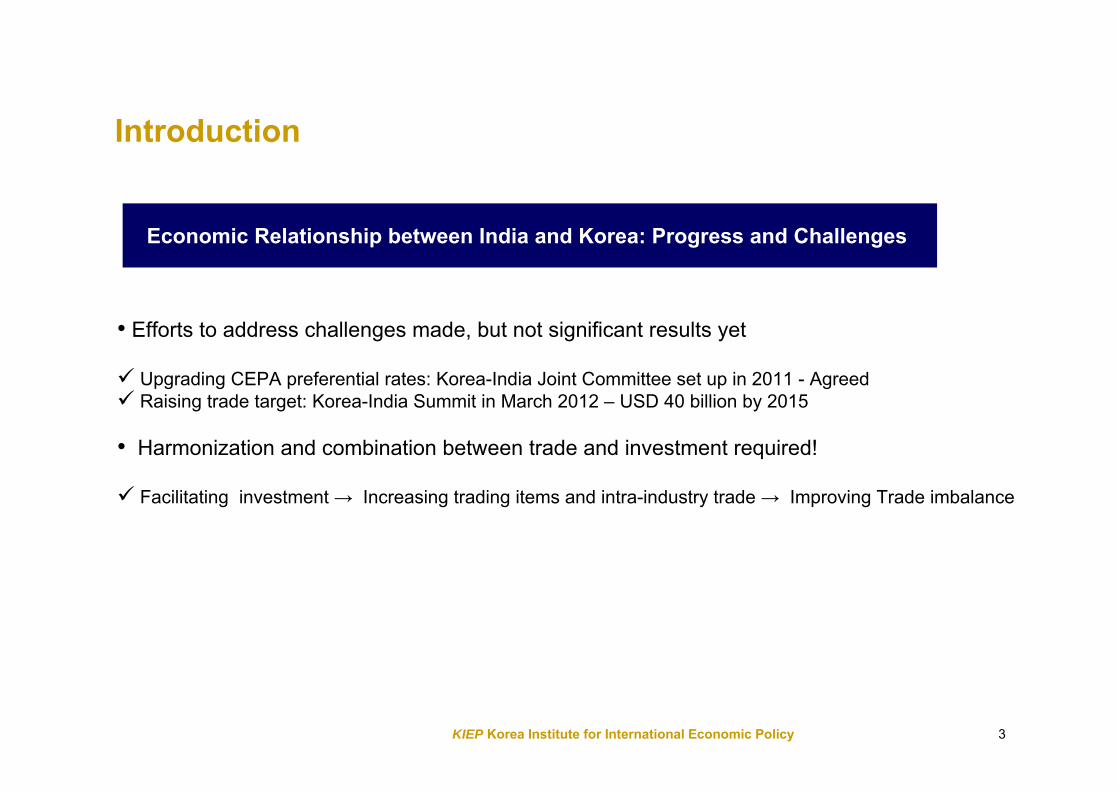
Economic Relationship between India and Korea: Progress and Challenges
3
• Efforts to address challenges made, but not significant results yet
Upgrading CEPA preferential rates: Korea-India Joint Committee set up in 2011 - Agreed Raising trade target: Korea-India Summit in March 2012 – USD 40 billion by 2015
• Harmonization and combination between trade and investment required!
Facilitating investment → Increasing trading items and intra-industry trade → Improving Trade imbalance
Introduction
KIEP Korea Institute for International Economic Policy
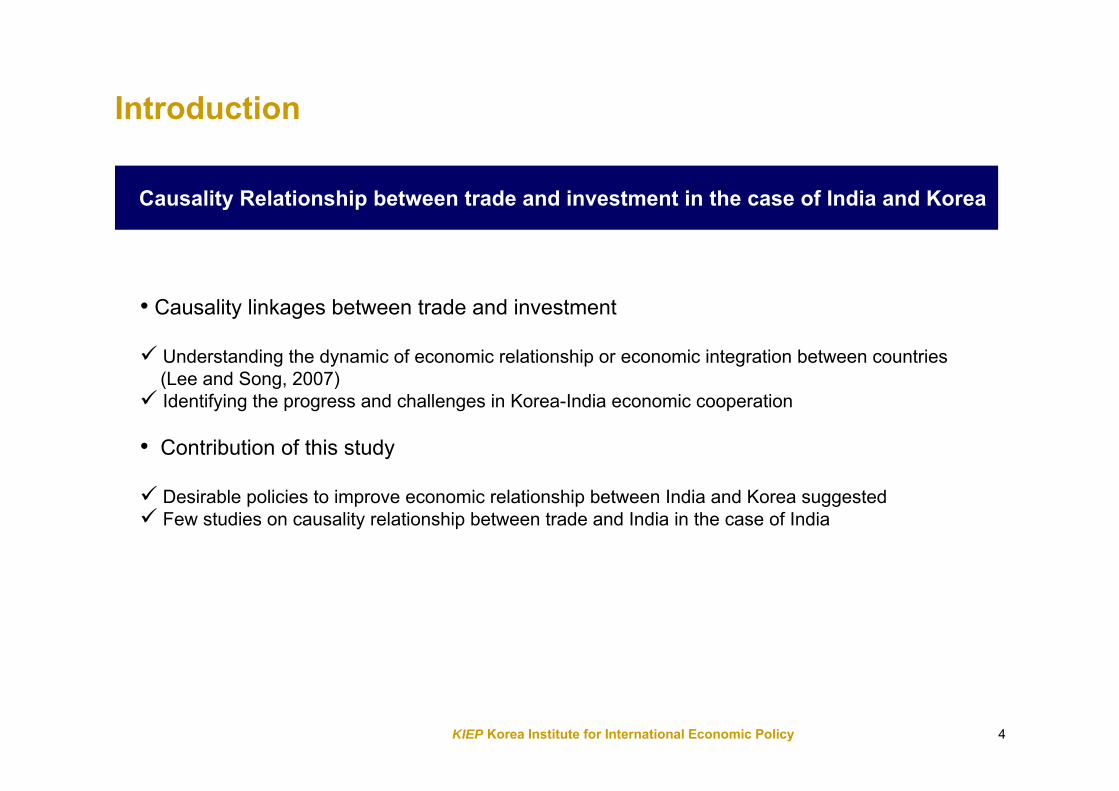
Causality Relationship between trade and investment in the case of India and Korea
4
• Causality linkages between trade and investment
Understanding the dynamic of economic relationship or economic integration between countries (Lee and Song, 2007)
Identifying the progress and challenges in Korea-India economic cooperation
• Contribution of this study
Desirable policies to improve economic relationship between India and Korea suggested Few studies on causality relationship between trade and India in the case of India
Introduction
KIEP Korea Institute for International Economic Policy
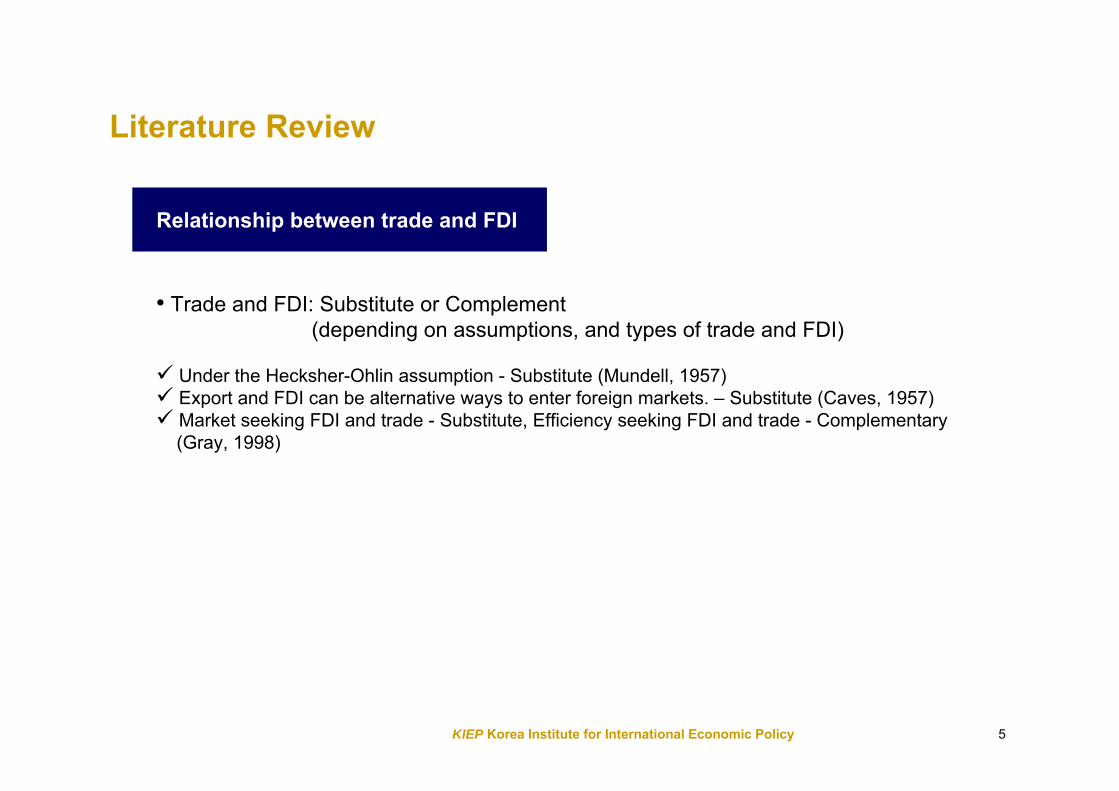
Relationship between trade and FDI
5
• Trade and FDI: Substitute or Complement (depending on assumptions, and types of trade and FDI)
Under the Hecksher-Ohlin assumption - Substitute (Mundell, 1957) Export and FDI can be alternative ways to enter foreign markets. – Substitute (Caves, 1957) Market seeking FDI and trade - Substitute, Efficiency seeking FDI and trade - Complementary
(Gray, 1998)
Literature Review
KIEP Korea Institute for International Economic Policy
Causality Relationship between trade and FDI
6
• FDI → The pattern of production changing to manufacturing sector → Facilitating trade or export
Hsiao and Hsiao (2006): 8 East and Southeast Asian countries from 1986 to 2004Min (2005): A Case Study of Malaysia
• The growth of Imports → The growth in inward FDI from home countries → The growth of exports from China to the home country → The growth of imports
Liu et al. (2001): A Case Study of China Internationalization Process of MNCs (Su and Poisson, 2008)
• Bi-directional relationship between export and FDI, and between import and FDI
Pacheco-Lopez (2005): A Case Study of Mexico
• Few studies on the case of India
Jayachandran and Seilan (2010) – Not a significant result between trade and FDI
Literature Review
KIEP Korea Institute for International Economic Policy 7
Trend of Trade and Investment
Trade
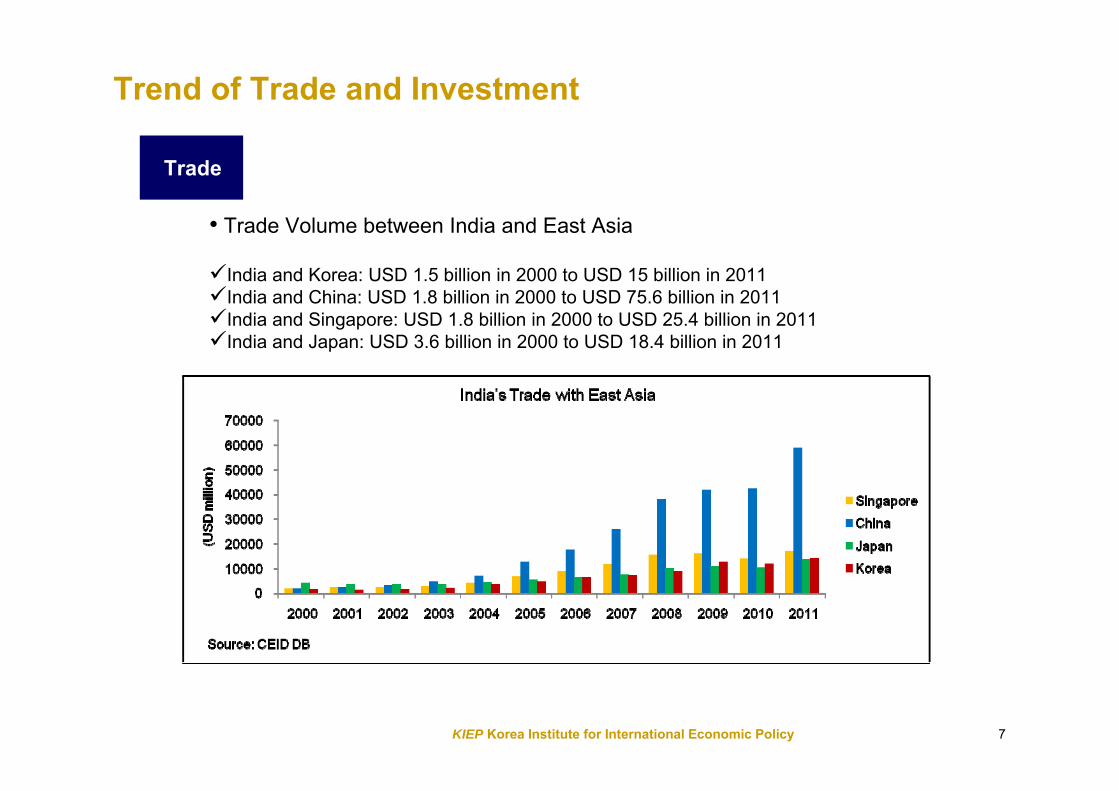
• Trade Volume between India and East Asia
India and Korea: USD 1.5 billion in 2000 to USD 15 billion in 2011India and China: USD 1.8 billion in 2000 to USD 75.6 billion in 2011India and Singapore: USD 1.8 billion in 2000 to USD 25.4 billion in 2011India and Japan: USD 3.6 billion in 2000 to USD 18.4 billion in 2011
KIEP Korea Institute for International Economic Policy 8
Trend of Trade and Investment
Trade
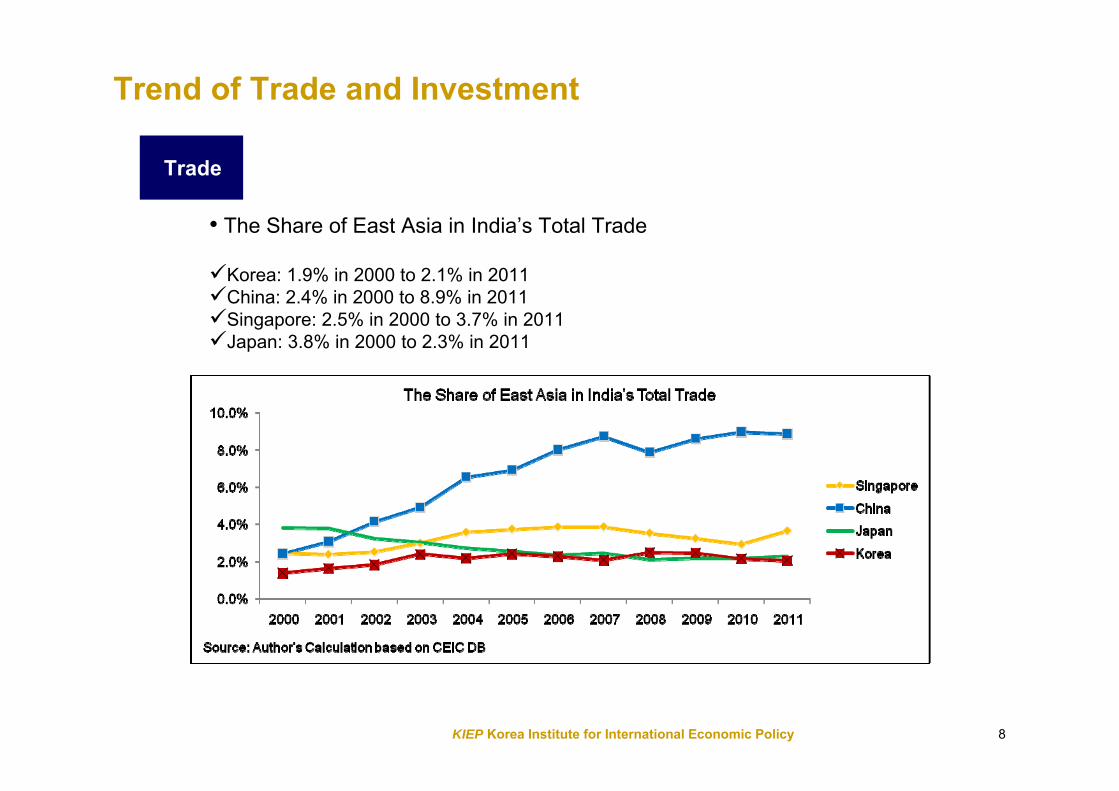
• The Share of East Asia in India’s Total Trade
Korea: 1.9% in 2000 to 2.1% in 2011China: 2.4% in 2000 to 8.9% in 2011Singapore: 2.5% in 2000 to 3.7% in 2011Japan: 3.8% in 2000 to 2.3% in 2011
KIEP Korea Institute for International Economic Policy 9
Trend of Trade and Investment
Trade
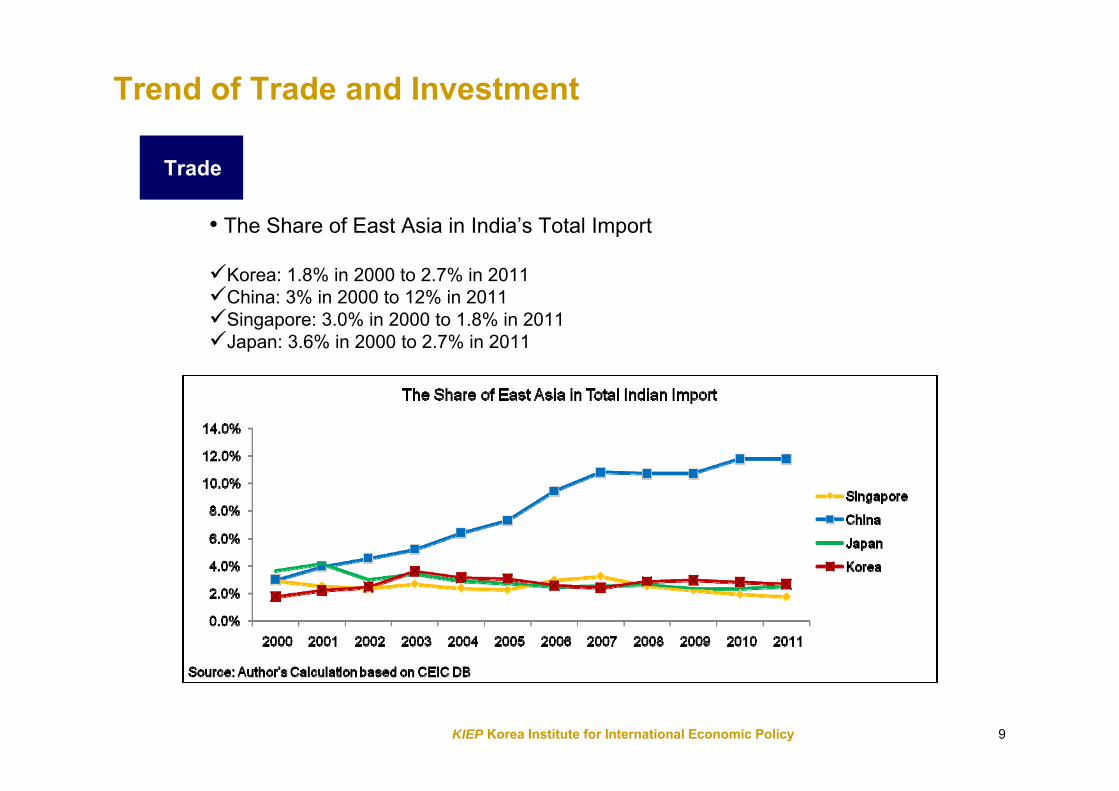
• The Share of East Asia in India’s Total Import
Korea: 1.8% in 2000 to 2.7% in 2011China: 3% in 2000 to 12% in 2011Singapore: 3.0% in 2000 to 1.8% in 2011Japan: 3.6% in 2000 to 2.7% in 2011
KIEP Korea Institute for International Economic Policy 10
Trend of Trade and Investment
Trade
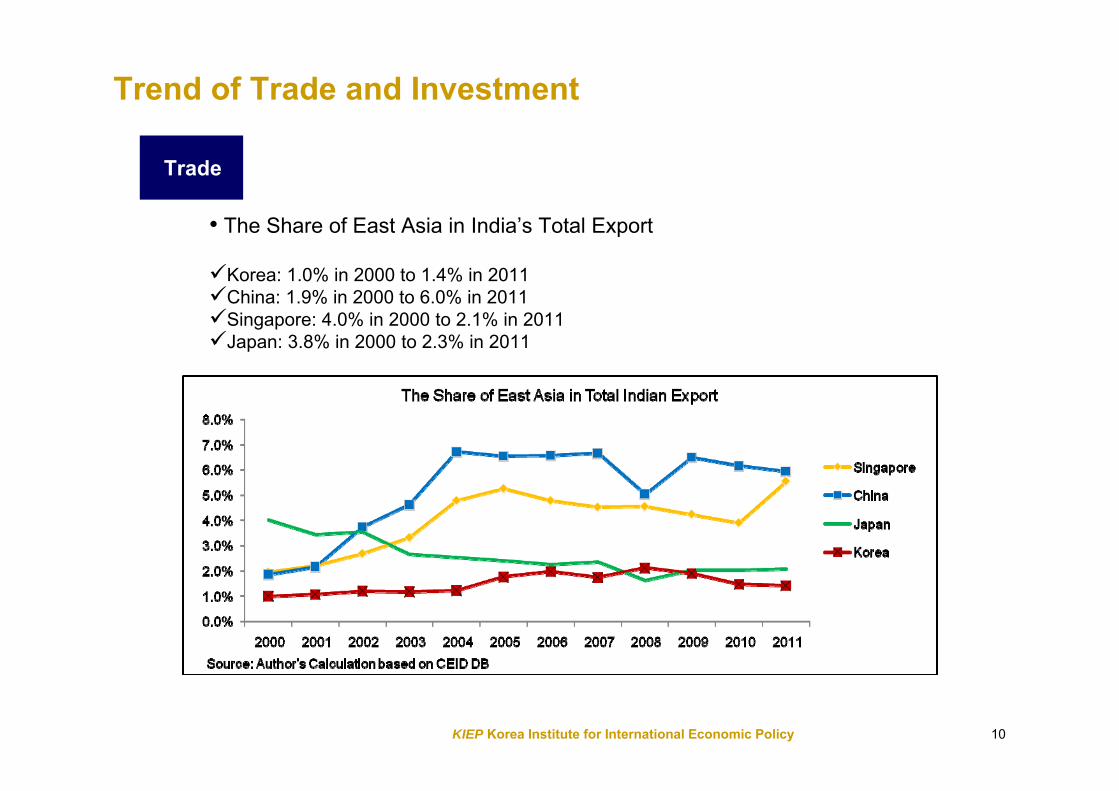
• The Share of East Asia in India’s Total Export
Korea: 1.0% in 2000 to 1.4% in 2011China: 1.9% in 2000 to 6.0% in 2011Singapore: 4.0% in 2000 to 2.1% in 2011Japan: 3.8% in 2000 to 2.3% in 2011
KIEP Korea Institute for International Economic Policy 11
Trend of Trade and Investment
Investment
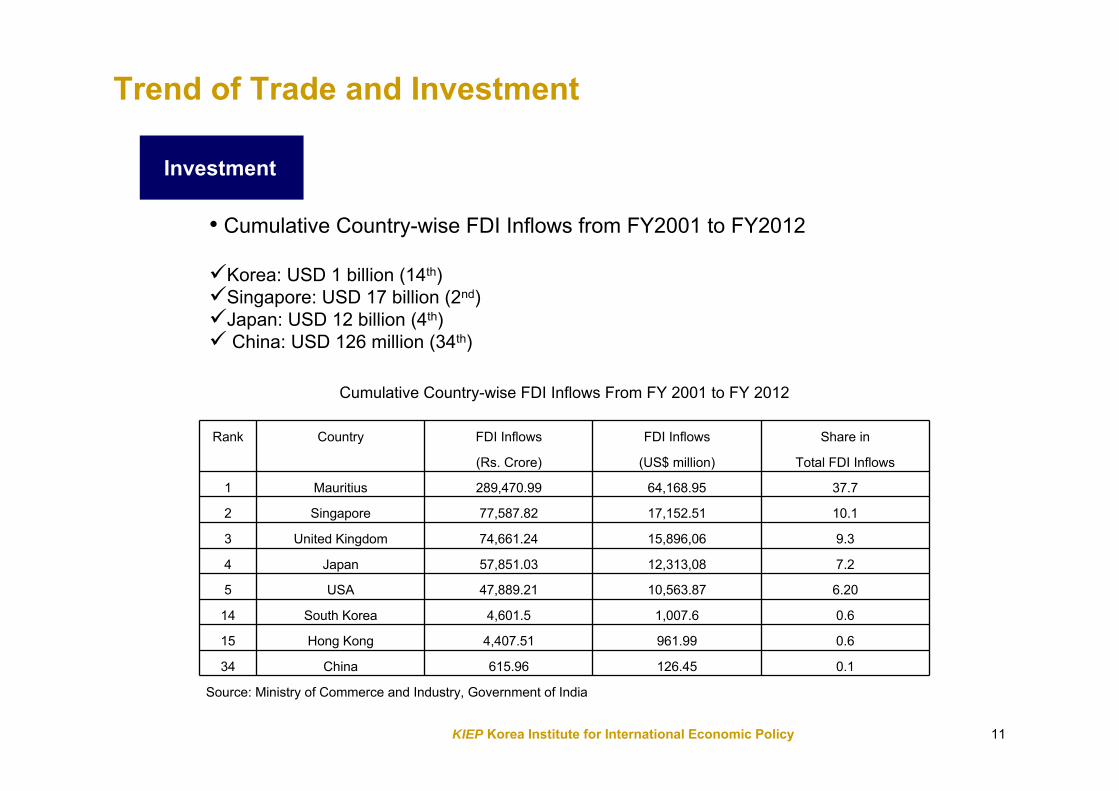
• Cumulative Country-wise FDI Inflows from FY2001 to FY2012
Korea: USD 1 billion (14th)Singapore: USD 17 billion (2nd)Japan: USD 12 billion (4th) China: USD 126 million (34th)
Cumulative Country-wise FDI Inflows From FY 2001 to FY 2012
Rank Country FDI Inflows
(Rs. Crore)
FDI Inflows
(US$ million)
Share in
Total FDI Inflows
1 Mauritius 289,470.99 64,168.95 37.7
2 Singapore 77,587.82 17,152.51 10.1
3 United Kingdom 74,661.24 15,896,06 9.3
4 Japan 57,851.03 12,313,08 7.2
5 USA 47,889.21 10,563.87 6.20
14 South Korea 4,601.5 1,007.6 0.6
15 Hong Kong 4,407.51 961.99 0.6
34 China 615.96 126.45 0.1
Source: Ministry of Commerce and Industry, Government of India
KIEP Korea Institute for International Economic Policy 12
Trend of Trade and Investment
Investment
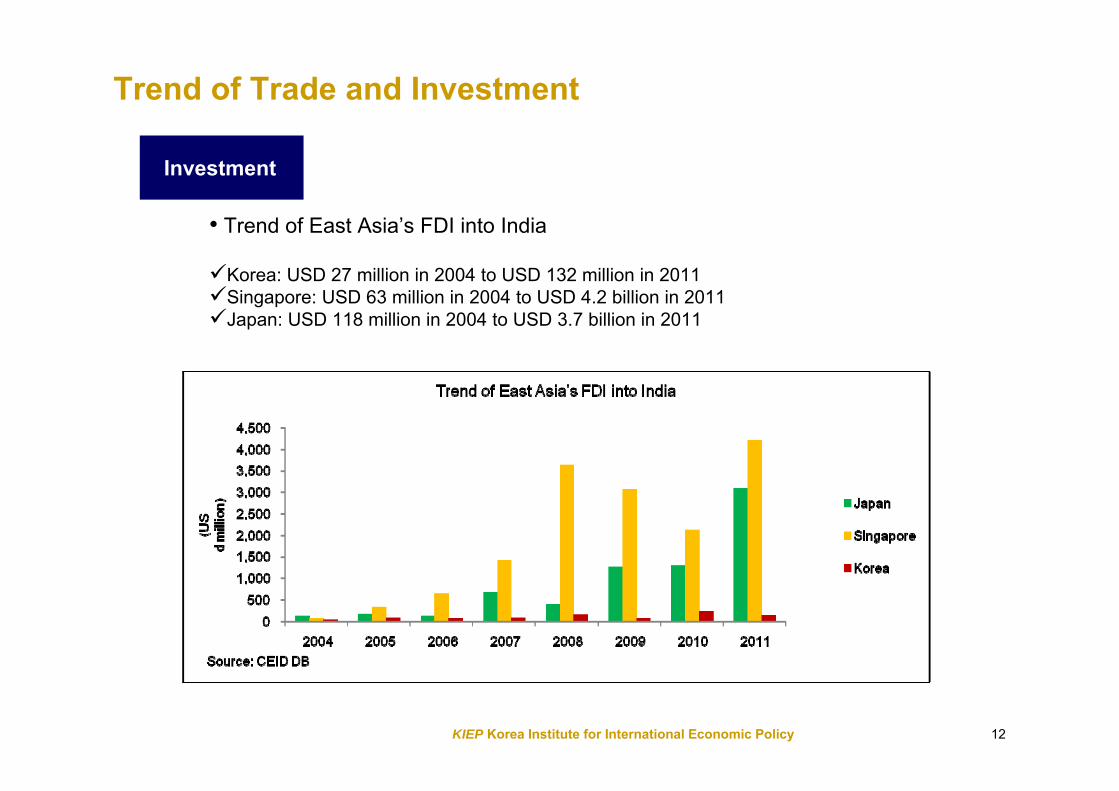
• Trend of East Asia’s FDI into India
Korea: USD 27 million in 2004 to USD 132 million in 2011Singapore: USD 63 million in 2004 to USD 4.2 billion in 2011Japan: USD 118 million in 2004 to USD 3.7 billion in 2011
KIEP Korea Institute for International Economic Policy 13
Trend of Trade and Investment
Investment
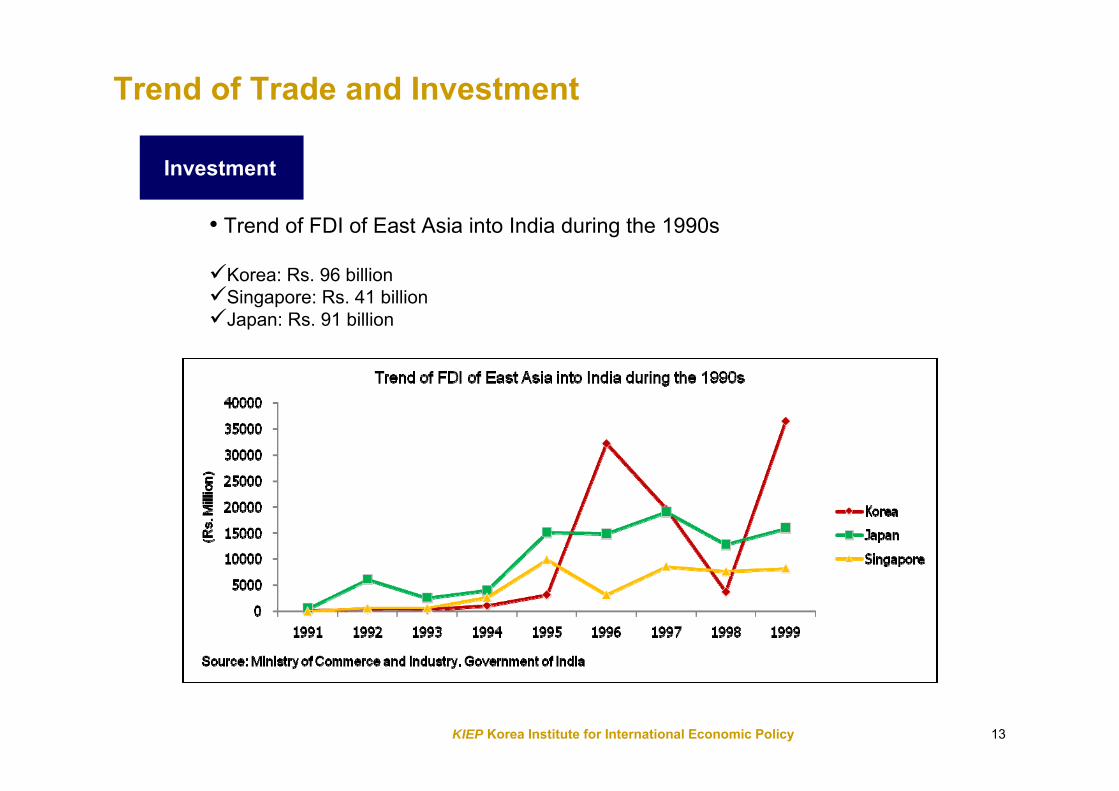
• Trend of FDI of East Asia into India during the 1990s
Korea: Rs. 96 billionSingapore: Rs. 41 billionJapan: Rs. 91 billion
KIEP Korea Institute for International Economic Policy 14
Trend of Trade and Investment
Investment
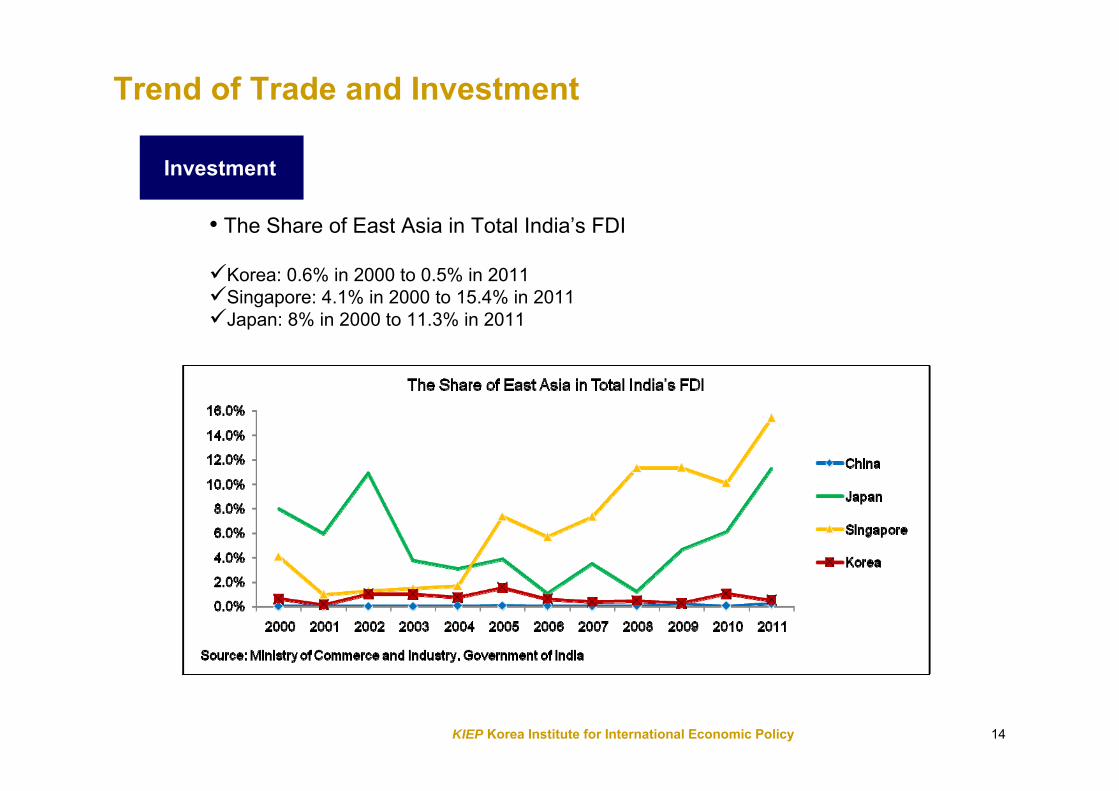
• The Share of East Asia in Total India’s FDI
Korea: 0.6% in 2000 to 0.5% in 2011Singapore: 4.1% in 2000 to 15.4% in 2011Japan: 8% in 2000 to 11.3% in 2011
KIEP Korea Institute for International Economic Policy 15
Estimation and Results
Granger Causality Test
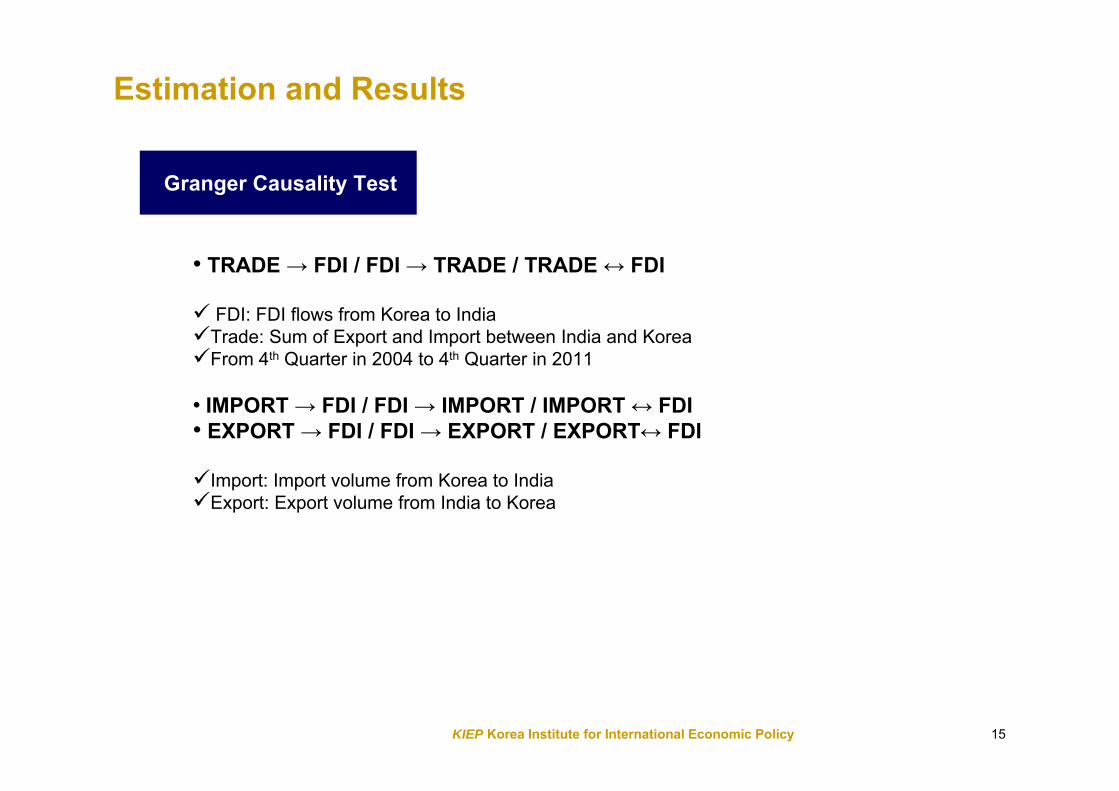
• TRADE → FDI / FDI → TRADE / TRADE ↔ FDI
FDI: FDI flows from Korea to IndiaTrade: Sum of Export and Import between India and KoreaFrom 4th Quarter in 2004 to 4th Quarter in 2011
• IMPORT → FDI / FDI → IMPORT / IMPORT ↔ FDI • EXPORT → FDI / FDI → EXPORT / EXPORT↔ FDI
Import: Import volume from Korea to IndiaExport: Export volume from India to Korea
KIEP Korea Institute for International Economic Policy 16
Estimation and Results
Granger Causality Test
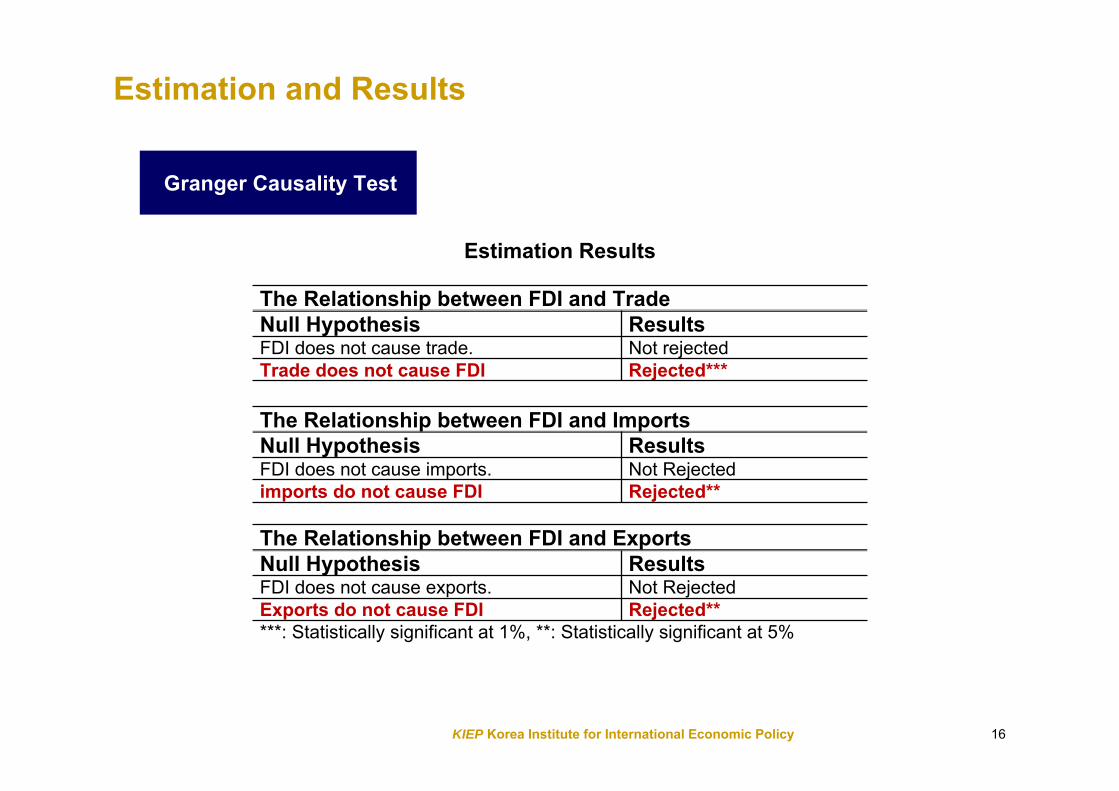
Estimation Results
The Relationship between FDI and TradeNull Hypothesis ResultsFDI does not cause trade. Not rejectedTrade does not cause FDI Rejected***
The Relationship between FDI and ImportsNull Hypothesis ResultsFDI does not cause imports. Not Rejectedimports do not cause FDI Rejected**
The Relationship between FDI and ExportsNull Hypothesis ResultsFDI does not cause exports. Not RejectedExports do not cause FDI Rejected*****: Statistically significant at 1%, **: Statistically significant at 5%
KIEP Korea Institute for International Economic Policy 17
Estimation and Results
OLS Estimation
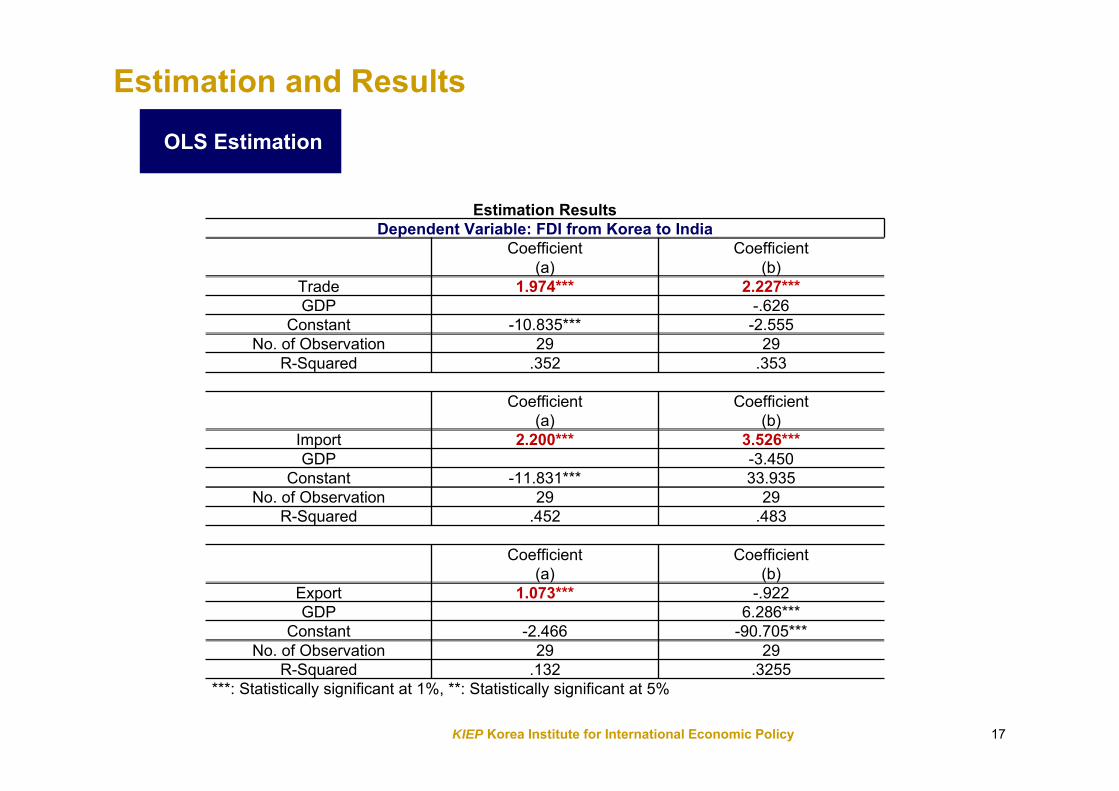
Estimation ResultsDependent Variable: FDI from Korea to India
Coefficient Coefficient(a) (b)
Trade 1.974*** 2.227***GDP -.626
Constant -10.835*** -2.555No. of Observation 29 29
R-Squared .352 .353
Coefficient Coefficient(a) (b)
Import 2.200*** 3.526***GDP -3.450
Constant -11.831*** 33.935No. of Observation 29 29
R-Squared .452 .483
Coefficient Coefficient(a) (b)
Export 1.073*** -.922GDP 6.286***
Constant -2.466 -90.705***No. of Observation 29 29
R-Squared .132 .3255***: Statistically significant at 1%, **: Statistically significant at 5%
KIEP Korea Institute for International Economic Policy 18
Estimation and Results
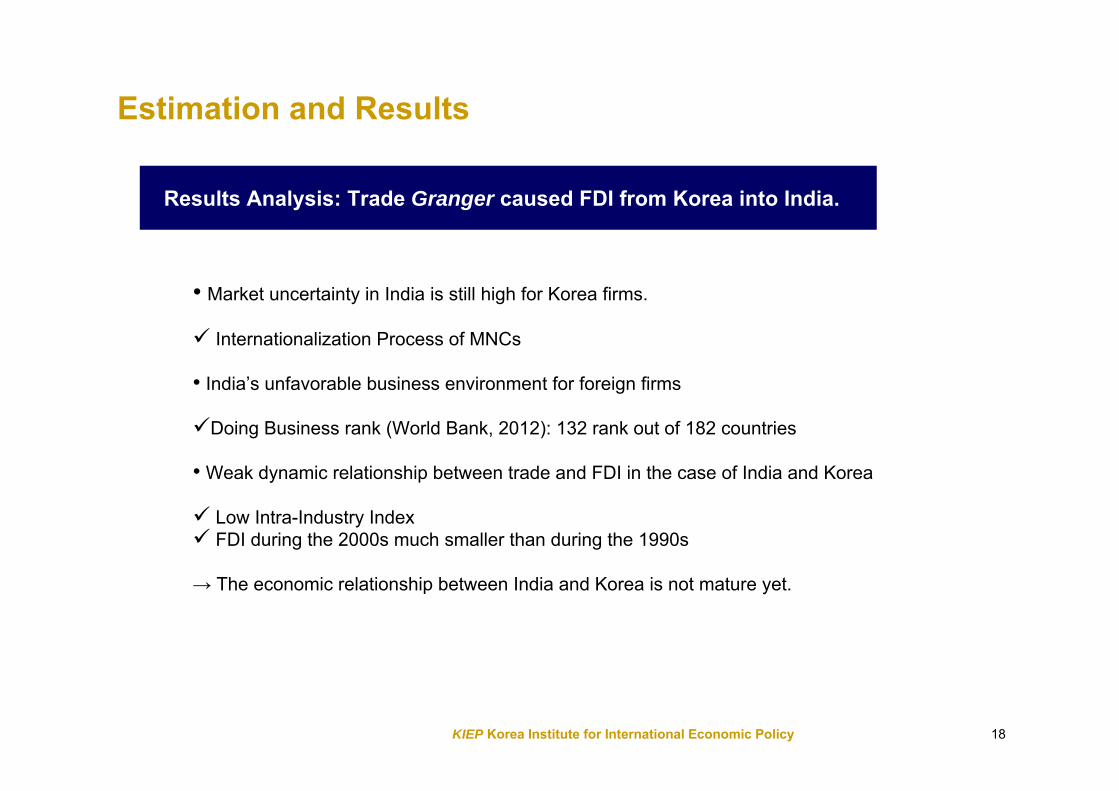
Results Analysis: Trade Granger caused FDI from Korea into India.
• Market uncertainty in India is still high for Korea firms.
Internationalization Process of MNCs
• India’s unfavorable business environment for foreign firms
Doing Business rank (World Bank, 2012): 132 rank out of 182 countries
• Weak dynamic relationship between trade and FDI in the case of India and Korea
Low Intra-Industry Index FDI during the 2000s much smaller than during the 1990s
→ The economic relationship between India and Korea is not mature yet.
KIEP Korea Institute for International Economic Policy 19
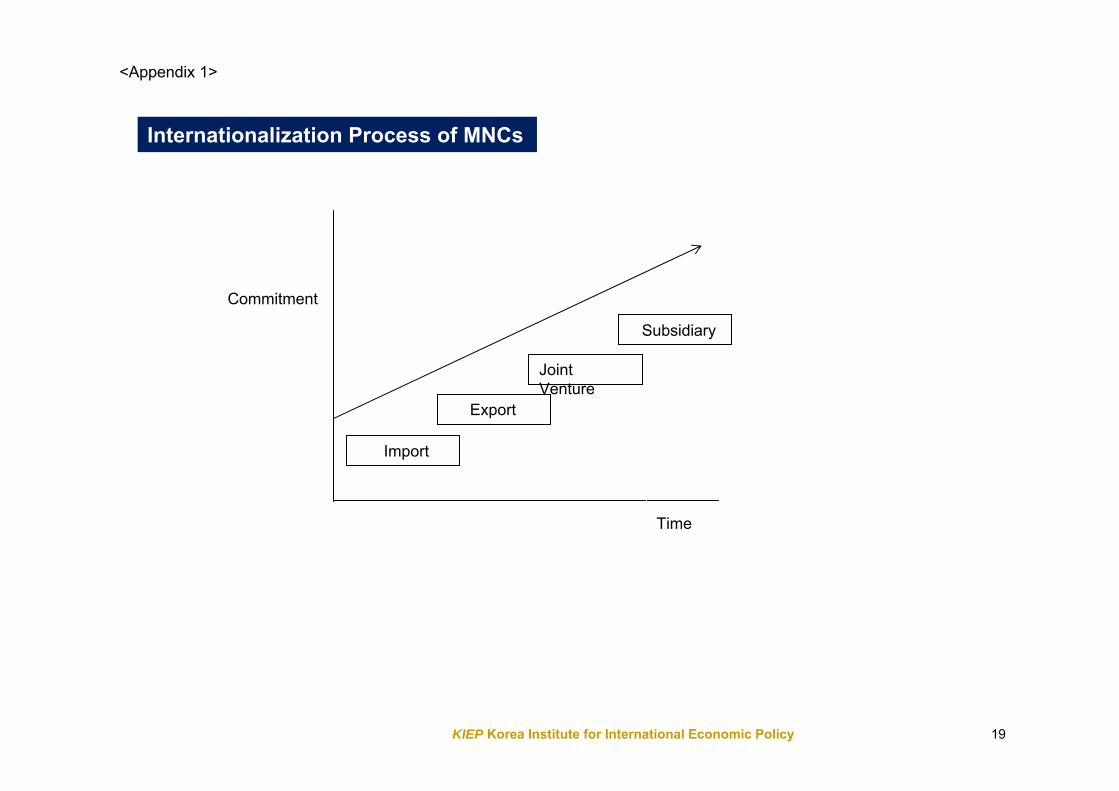
Commitment
Subsidiary
Export
Import
Joint Venture
Time
Internationalization Process of MNCs
<Appendix 1>
KIEP Korea Institute for International Economic Policy 20
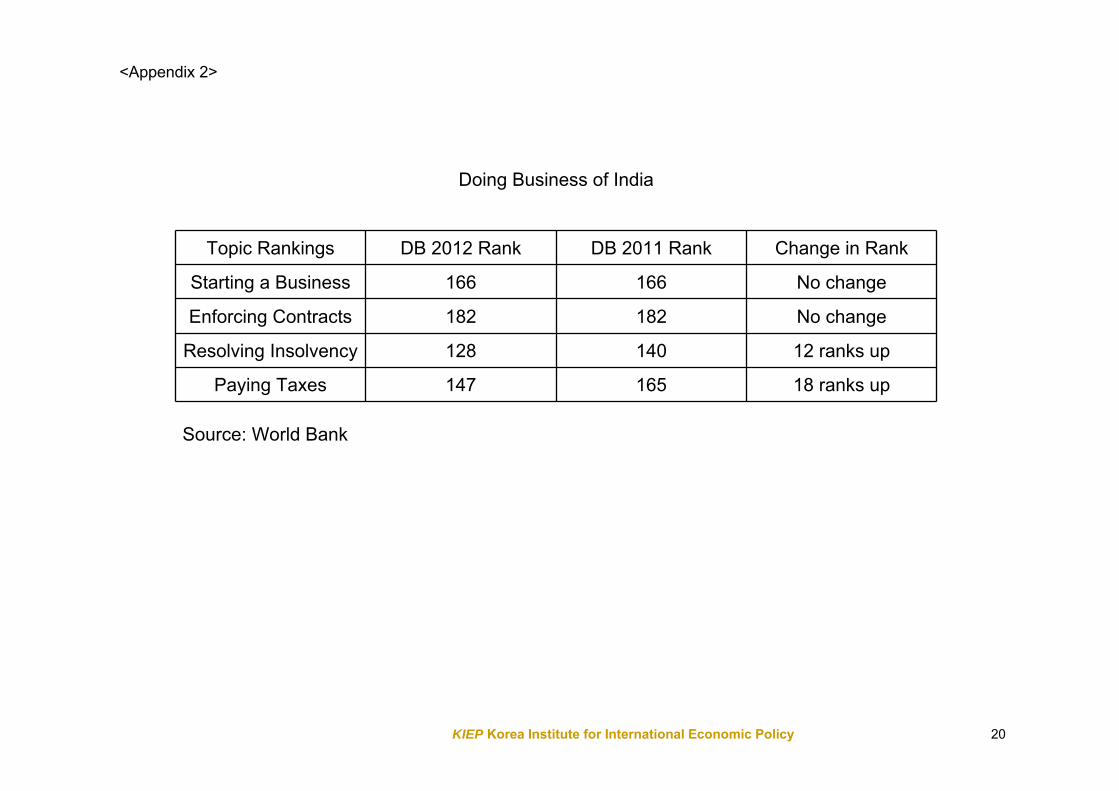
Doing Business of India
Topic Rankings DB 2012 Rank DB 2011 Rank Change in Rank
Starting a Business 166 166 No change
Enforcing Contracts 182 182 No change
Resolving Insolvency 128 140 12 ranks up
Paying Taxes 147 165 18 ranks up
Source: World Bank
<Appendix 2>
KIEP Korea Institute for International Economic Policy 21
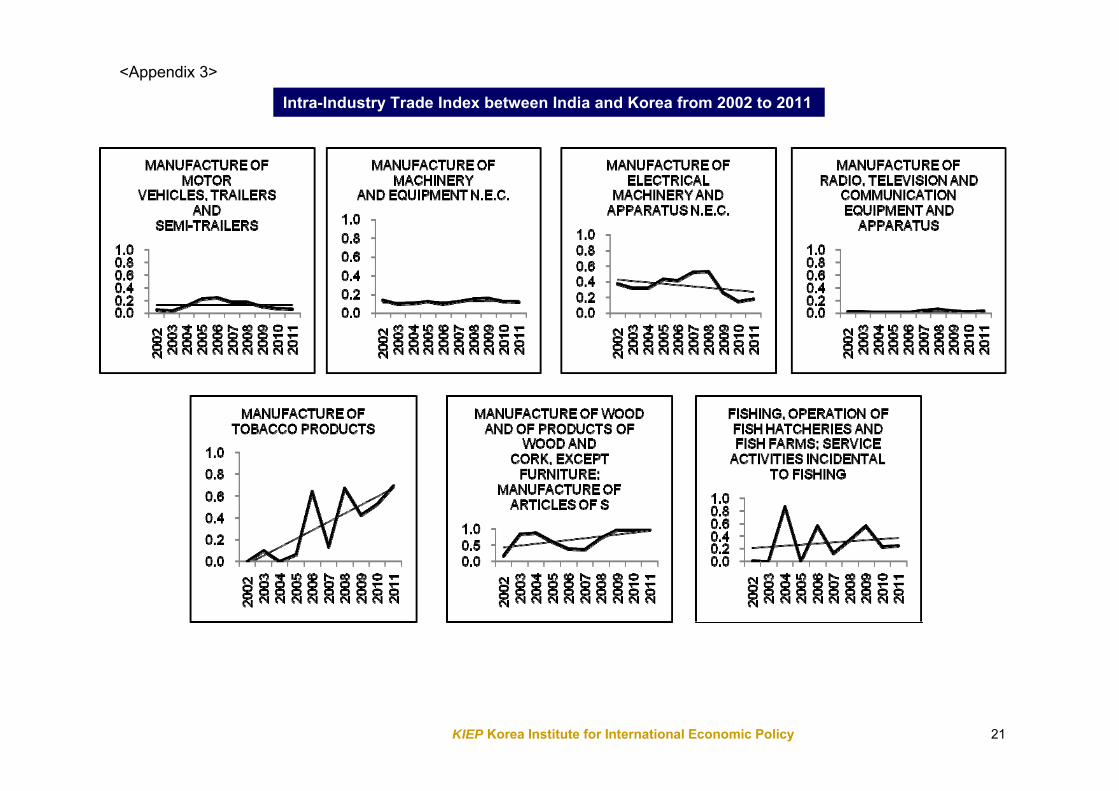
Intra-Industry Trade Index between India and Korea from 2002 to 2011
<Appendix 3>
KIEP Korea Institute for International Economic Policy 22
Conclusion
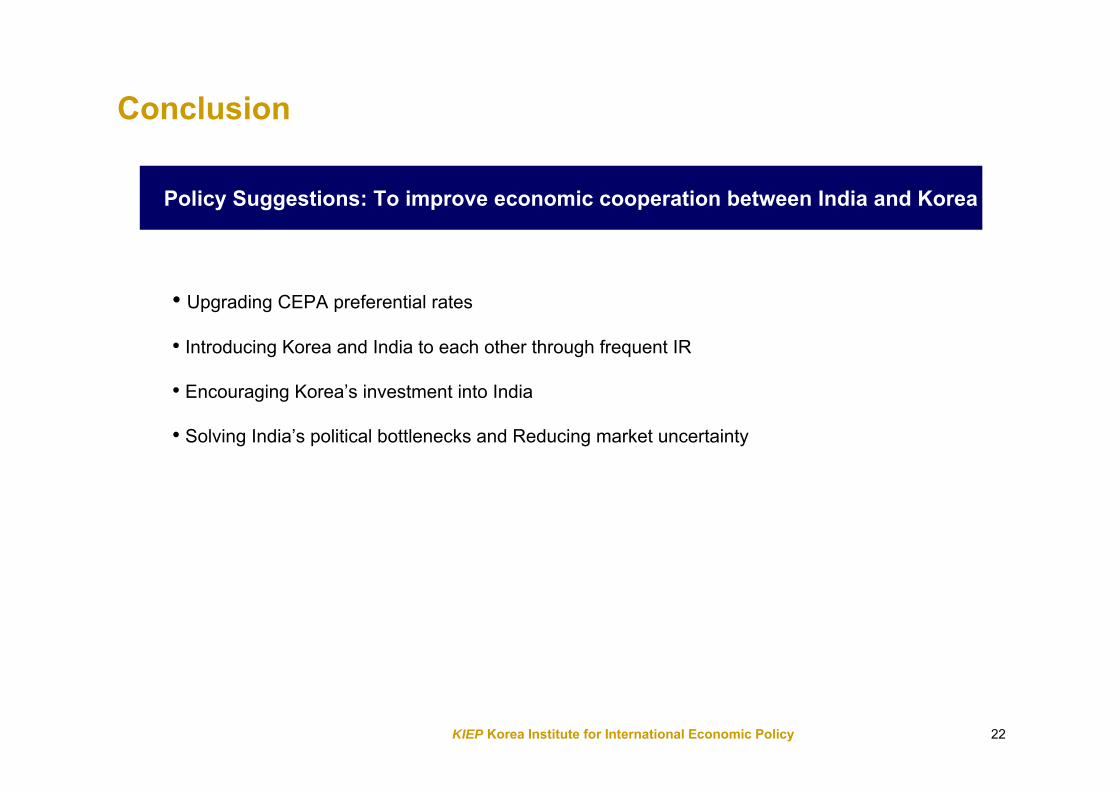
Policy Suggestions: To improve economic cooperation between India and Korea
• Upgrading CEPA preferential rates
• Introducing Korea and India to each other through frequent IR
• Encouraging Korea’s investment into India
• Solving India’s political bottlenecks and Reducing market uncertainty
KIEP Korea Institute for International Economic Policy 23
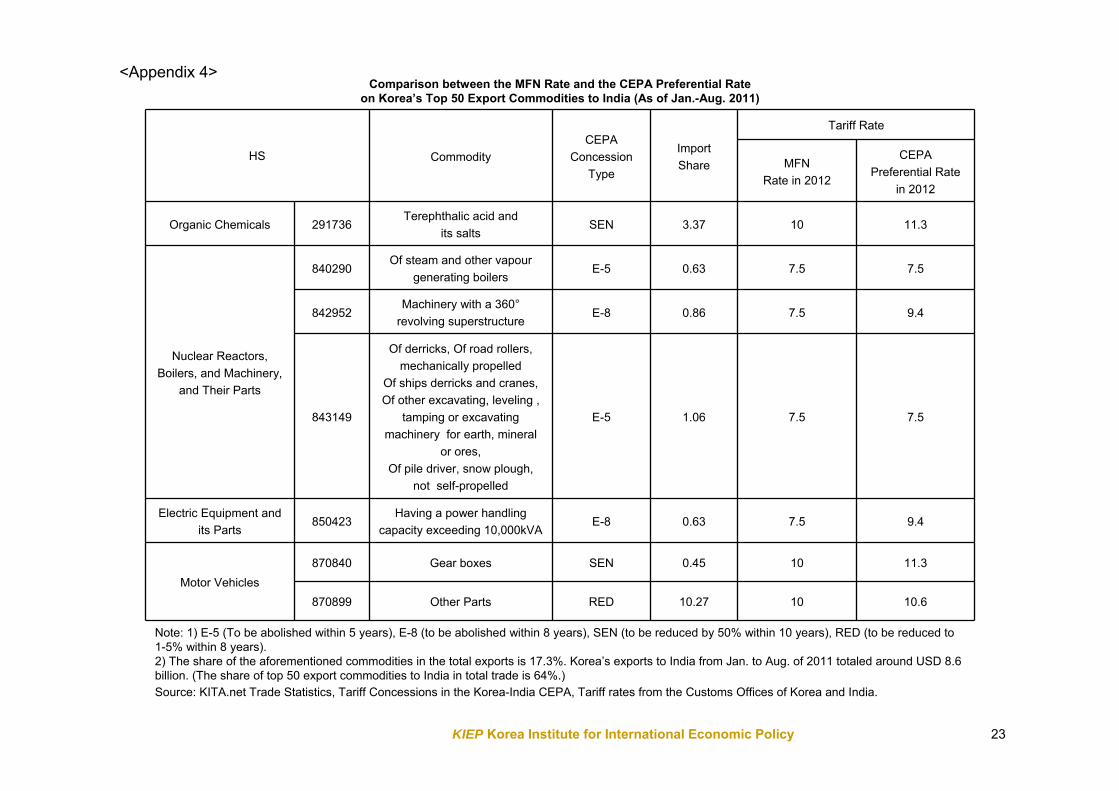
Comparison between the MFN Rate and the CEPA Preferential Rate on Korea’s Top 50 Export Commodities to India (As of Jan.-Aug. 2011)
HS CommodityCEPA
Concession Type
Import Share
Tariff Rate
MFN Rate in 2012
CEPA Preferential Rate
in 2012
Organic Chemicals 291736Terephthalic acid and
its saltsSEN 3.37 10 11.3
Nuclear Reactors, Boilers, and Machinery,
and Their Parts
840290Of steam and other vapour
generating boilersE-5 0.63 7.5 7.5
842952Machinery with a 360°
revolving superstructureE-8 0.86 7.5 9.4
843149
Of derricks, Of road rollers, mechanically propelled
Of ships derricks and cranes,Of other excavating, leveling ,
tamping or excavating machinery for earth, mineral
or ores,Of pile driver, snow plough,
not self-propelled
E-5 1.06 7.5 7.5
Electric Equipment and its Parts
850423Having a power handling
capacity exceeding 10,000kVAE-8 0.63 7.5 9.4
Motor Vehicles 870840 Gear boxes SEN 0.45 10 11.3
870899 Other Parts RED 10.27 10 10.6
Note: 1) E-5 (To be abolished within 5 years), E-8 (to be abolished within 8 years), SEN (to be reduced by 50% within 10 years), RED (to be reduced to 1-5% within 8 years). 2) The share of the aforementioned commodities in the total exports is 17.3%. Korea’s exports to India from Jan. to Aug. of 2011 totaled around USD 8.6 billion. (The share of top 50 export commodities to India in total trade is 64%.)Source: KITA.net Trade Statistics, Tariff Concessions in the Korea-India CEPA, Tariff rates from the Customs Offices of Korea and India.
<Appendix 4>
KIEP Korea Institute for International Economic Policy 24
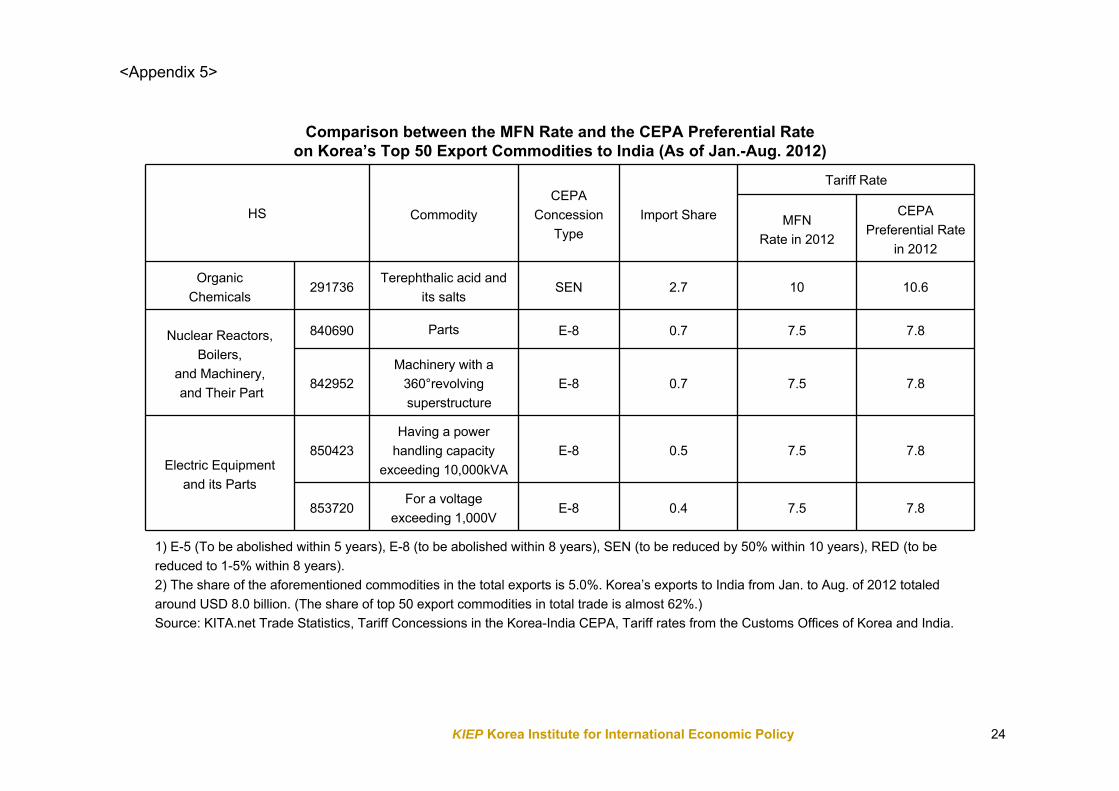
Comparison between the MFN Rate and the CEPA Preferential Rate on Korea’s Top 50 Export Commodities to India (As of Jan.-Aug. 2012)
HS CommodityCEPA
Concession Type
Import Share
Tariff Rate
MFN Rate in 2012
CEPA Preferential Rate
in 2012
Organic Chemicals
291736Terephthalic acid and
its saltsSEN 2.7 10 10.6
Nuclear Reactors, Boilers,
and Machinery,and Their Part
840690 Parts E-8 0.7 7.5 7.8
842952Machinery with a
360°revolving superstructure
E-8 0.7 7.5 7.8
Electric Equipment and its Parts
850423Having a power
handling capacity exceeding 10,000kVA
E-8 0.5 7.5 7.8
853720For a voltage
exceeding 1,000VE-8 0.4 7.5 7.8
1) E-5 (To be abolished within 5 years), E-8 (to be abolished within 8 years), SEN (to be reduced by 50% within 10 years), RED (to be reduced to 1-5% within 8 years). 2) The share of the aforementioned commodities in the total exports is 5.0%. Korea’s exports to India from Jan. to Aug. of 2012 totaled around USD 8.0 billion. (The share of top 50 export commodities in total trade is almost 62%.) Source: KITA.net Trade Statistics, Tariff Concessions in the Korea-India CEPA, Tariff rates from the Customs Offices of Korea and India.
<Appendix 5>
KIEP Korea Institute for International Economic Policy
Thank you!