Organizational culture and personality type: relationship ...

1
THE RELATIONSHIP BETWEEN PERSONALITY TYPES AND
REWARD PREFERENCES
RONéL NIENABER
Promoter: Prof M H R Bussin
Co-promoter: Dr C Henn
Department of Industrial Psychology and People Management
University of Johannesburg
ABSTRACT
Against the continuous need to attract, retain and motivate key employees, theaim of this study was firstly to determine the relationship between personalitytypes and reward preferences. Furthermore, the relationships betweendemographic variables such as age, gender, race, educational qualifications andreward preferences were explored, an empirical total rewards model wasdeveloped and the reward categories that mostly contribute to the attraction,retention and motivation of employees, were assessed. The research design wasquantitative and exploratory relational. Data was collected through two web-based questionnaires, the MBTI® and the Rewards Preferences Questionnnairethat assessed the respondents’ personality types and reward preferencesrespectively. The results indicated that there is a significant relationship betweenpersonality preference, personality temperament, different demographic variablesand reward preferences, but a less significant relationship between personalitytype and reward preferences. Based on the research findings a new totalrewards model was developed incorporating a different combination of rewardscomponents than those indicated in rewards models in existing literature.
Key words: rewards management, total rewards model, personality type, reward
preferences, motivation, retention, flexible reward practices.

2
INTRODUCTION
A work environment characterised by a global shortage of key skills (Corporate
Leadership Council, 2008); changing needs of employees (Claus, 2007; Grant
Thornton, 2008); and more flexible reward practices (Abboud, 2007; Olson, Van
Bever & Verry, 2008) form the rationale for this study. Increasingly, employers
realise that the core asset of the modern business enterprise does not lie in
buildings and in investments, but in the intelligence, skills and experience of
employees who need to be retained (Harvard Business Review, 2003). The
attraction and retention of employees was in fact cited as the key priority for HR
professionals in 2004 and continues to be at the end of 2008 (Frank, Finnegan &
Taylor, 2004; Giancola, 2008).
Retention is critical for employers as it influences expenses on two levels, namely
directly through staff turnover expenses (for example recruitment costs, lost
productivity, training and development and lost opportunity costs) and indirectly
through aspects such as engagement (Corporate Leadership Council, 2004).
There is a high correlation between retention, engaged employees and financial
sustainability of organisations (Bussin, 2008a; Bussin, 2008b; Deloitte, 2004;
Schaufeli & Enzmann, 1998).
One way in which organisations can respond to employee demands is by
understanding the reward preferences of employees (Linkow, 2006). More
specifically, there are many rewards other than pay that should be considered by
management (Grant Thornton, 2008; Murlis, 1996). While Armstrong (2006)
indicates that most employers do not have high levels of sensitivity towards the
reward preferences of their employees, employees themselves, especially those
with key skills, are becoming more demanding and require organisations to make
exceptions on the basis of their individual preferences (Herman & Gioia, 2000).
Kaliprasad (2006) confirms that when management actively listens to the
preferences of employees, this results in higher levels of motivation and
engagement.
3
One solution to this dilemma is to address employee needs through a holistic,
integrated and business-aligned approach to reward management. This total
rewards strategy flows from the organisation’s business and human resources
strategies, and aligns to the organisational goals (Armstrong & Thompson, 2002).
The total rewards concept is multi-dimensional and developed from an array of
different disciplines. The interest in reward practices has increased significantly
over the past 10 – 15 years, emanating from the initial basic understanding of pay
and benefits to what is now commonly categorised into financial (also referred to
as transactional or tangible rewards), non-financial (also referred to as relational
or intangible rewards), intrinsic and extrinsic rewards as part of a total rewards
model (Du Toit et al., 2007; WorldatWork, 2007). If total reward models are
flexible and adapt to environmental, individual and organisational changes it is a
critical lever to motivate, attract and retain talented employees and can positively
influence productivity by up to 35% (Hill & Tande, 2006; Lawler, 1990; Menefee &
Murphy, 2004).
There is a wide range of approaches on the development of total rewards models.
Despite differing opinions around the nomenclature used in the reward categories,
and the categorisation thereof, the inherent meaning of the different categories is
mostly similar. In addition, typically organisations arrive at their own definition of
total rewards and brand it accordingly (Milkovich & Newman, 1999; Keuch,
Chuang, May & Sheldrake, 2006). Based on an analysis of the literature
(Armstrong & Brown, 2006; Berger & Berger, 2004; Corporate Leadership
Council, 2008; Crawford & Giowa, 2008; Gross & Friedman, 2007; Herman &
Gioia, 2000; Lawler, 2000; Milkovich & Newman, 1999; Towers Perrin, 2007 and
Zingheim & Schuster, 2007) a total rewards model with key components has been
developed. This model, depicted in Figure 1, encompasses all the key
components identified in the literature.

4
Figure 1: Categories of the theoretical total rewards model
The categories shown in Figure 1, as well as the underlying components thereof,
play a critical role in the motivation and retention of employees (Hankin, 2005).
The prevailing view is that salary is still considered a major determinant of work
motivation and appropriate work behaviours (Deci & Ryan, 2000; Harvard
Business Review, 2001; Henderson, 2003). Yet, if an organisation focuses solely
on remuneration, this may not be sufficient to sustain motivation (Bergmann &
Scarpello, 2001). Organisations that incorporate financial and non-financial
rewards are more likely to compete successfully in the global employment market
(Gerhart & Rynes, 2003; Stein, 2007).
There is paucity of empirical research on the efficacy of different components of
the total rewards model, especially within a South African context. Research
conducted amongst employees in Europe and North America indicate that people
have different reward preferences, that different categories of the rewards model
have different value for employees and ultimately that understanding and
responding to employee reward preferences drive commitment, engagement and
retention (Armstrong & Thompson, 2002; Corporate Leadership Council, 2002).
In addition, employees working for one organisation but within different
geographic locations such as China, Japan, Germany and the USA, have
distinctly different reward preferences and motivators; and where rewards models
are tailored according to cultural differences, the motivational effectiveness

5
thereof increases (Chiang, 2005; Gunkel, 2006; MacGrain Herkenhoff, 2000;
Rehu, Lusk & Wolff, 2006).
Flexible total rewards models may sound appealing to many employees, but the
reality is that for most organisations it is impossible to administer unique
individualised reward requests due to the onerous administrative burden. A way
of overcoming this difficulty is to segment the workforce and to structure reward
models according to the preferences of different employee segments (Gross &
Edelsten, 2006). Total rewards models designed in accordance with the reward
preferences of employee segments can have maximum impact at no additional or
even lower cost (Harris & Clements, 2007).
Literature abounds with research that proves that motivated employees are more
productive and engaged (Furnham, 2003; Mkhehlane, 2008). Motivation
influences the direction, intensity and persistence of behaviour and impacts
organisational performance (Weiten, 1992). Motivation levels are strongly
influenced by, amongst others, personality, work environment and rewards (Miner,
2005). It is therefore important for managers to understand more about all these
components that influence motivation levels of their employees. (Linder, 2000;
Moss-Kanter, 2003; Nohria, Groysberg & Lee, 2008; Steel & König, 2006;
Thomas, 2002).
Personality is considered to be formed as a result of combined hereditary
(genetic) and environmental factors, moderated by situational conditions and has
a big impact on how people are motivated (Murphy, 2008; Robbins, Odendaal &
Roodt, 2003). Personality is typically described in terms of traits or types.
Personality traits are characteristics exhibited in a large number of situations and
are used to describe peoples’ behaviour in different situations (Robbins et al.,
2003). Traits are relatively stable and enduring aspects of individuals that
distinguish them from other people (Martin, 2005). Personality type, on the other
hand, refers to a combination of various personality traits and preferences (Myers,
1998). Personality types, in terms of Jungian theory (1971) refer to the mental
functions involved in gathering information and making decisions on the basis of
this information. Jung (1971) concludes that differences in behaviour result from
peoples’ inborn tendencies to use their minds in different ways. As people act on

6
these tendencies, they develop predictable patterns of behaviour (McCaulley,
1998). When people differ systematically in what they perceive and in how they
reach conclusions, this contributes to different interests, reactions, values,
motivations and skills (Bayne, 2004). The Myers-Briggs Type® Indicator, one of
the most widely used personality assessment instruments used worldwide, has
been designed in accordance with Jung’s theory of personality types (CPP, 2008;
DuBrin, 2005; Kroeger & Thuesen, 1998; Reinhold, 2008).
.
The eight personality preferences originally identified by Jung, are clustered into
four polar personality dimensions of Extraversion (E) and Introversion (I), Sensing
(S) and Intuition (N), Thinking (T) and Feeling (F) and Judging (J) and Perceiving
(P). A combination of the personality preferences make up a psychological
typology (Myers, 1998). The inherent different characteristics of the eight
preferences, give rise to the uniqueness of personality types when these
preferences are combined into 16 different types. The 16 different types are
indicated in Table 1.
Table 1: MBTI® 16 personality types(Myers & Myers, 1995)
Sensing Types Intuitive Types
Thinking Feeling Feeling Thinking
Temperaments -ST- -SF- -NF- -NT-
Introvert I-J ISTJ ISFJ INFJ INTJ
I-P ISTP ISFP INFP INTP
Extravert E-P ESTP ESFP ENFP ENTP
E-J ESTJ ESFJ ENFJ ENTJ
Table 1 indicates the combination of the different personality preferences forming
16 different personality types. Also indicated in Table 1 are the four
temperaments that are considered a sub-set of behaviour. There are four
variations of each of the four temperaments representing the sixteen personality
types (Kroeger & Thuesen, 1988; Linder, 2000).

7
The relationship between pay and personality traits has been the subject of past
research. Findings showed that extraverts are more inclined to be motivated by
money and introverts are more motivated by fear of punishment; conscientious
people prefer equity (fair differentiation) over equality (similar) in reward systems
(Furnham & Argyle, 1998). A positive relationship between certain personality
traits (extraversion, conscientiousness, aggression) and levels of earnings has
also been confirmed as well as a correlation between gender and earnings
(Bartlett, Grant & Miller, 1990; Bowles, Gintis & Osborne, 2001; Müller & Plug,
2005). There appears to be limited research on the relationship between
personality types and reward preferences which is surprising given the universal
importance of money and the role that rewards play in the attraction and retention
of employees. Personality types and different demographic groups were therefore
selected as employee segments for which reward preferences were explored.
Total rewards positively contribute to employee engagement, retention,
organisations’ employee value propositions and organisational performance. The
influence is even more significant when the reward offering is designed in
accordance with employee preferences (Butler & Waldroop, 2004; Giancola,
2007; Sung & Todd, 2004; Werhane, 2008). Differences in reward preferences
can be assessed in a number of different ways. In this study, reward preferences
are measured for demographic groups as well as respondents with a preference
for different personality types, preferences and temperaments.
The following research questions formed the basis of this study:
The primary research question was:
Is there a relationship between personality type and reward preferences?
The secondary research questions were:
What is the relationship between the reward categories and underlying
components of the total rewards model?
What influence do the demographical variables have on reward preferences?

8
What categories of the total rewards model contribute to the attraction,
retention and motivation of employees?
RESEARCH DESIGN
The research design was quantitative and exploratory relational. The research
variables were defined as follows:
a) the independent variable was the employee’s personality type as defined by
the MBTI® instrument;
b) the dependent variables were the categories and components that form part
of the total rewards model, and
c) demographic variables namely age, gender, race and educational
qualifications.
Two measuring instruments were used namely the Rewards Preferences
Questionnaire (Annexure 1) and the web-based MBTI® Form GRV (Global
Research Version) questionnaire. The Rewards Preference Questionnaire was
informed by the theoretical total rewards model (Figure 1 with additional
underlying components) and tested on a pilot group. A combination of nominal,
semantic differential and forced ranking scales were used in the design of the
questionnaire. The Cronbach Alpha coefficient yielded a good reliability
coefficient of 0.84. The MBTI® Form GRV has recently been made available by
CPP, Inc and is a combination of the response items contained in Forms M and Q
(CPP, 2008). Forms M and Q have been well researched and the psychometric
properties thereof have been well established. Internal consistency, reliability and
validity have been confirmed (Taylor & Yiannakis, 2007; Taylor & Yiannakis,
2009).
The measuring instruments were distributed to 5,000 potential respondents
extracted from the client listing of 21st Century Business & Pay Solutions, one of
the largest reward consulting houses in the southern hemisphere; the member list
of the South African Reward Associations, a non-profit South African based
association aimed at promoting and developing the reward profession, and
Nedbank Group Ltd employees employed at its head office in Sandton,
9
Johannesburg. A total of 894 completed Rewards Preferences Questionnaires
and 787 Form GRV questionnaires were captured on two separate servers. This
represents a response rate of 17.88% and 15.74% respectively. Respondents
were requested to use the same unique password on both questionnaires in order
to match their personality type with their reward preferences, whilst protecting
anonymity. Of the returned Form GRV questionnaires, 195 questionnaires could
not be used as the passwords used on the two questionnaires did not match.
Sample one refers to the 592 Form GRV responses on which the relationship
between reward preferences and personality type, preferences and temperaments
respectively were assessed. Sample two refers to the 894 Reward Preferences
Questionnaires that were used to analyse reward preferences for different
demographic variables.
RESULTS
In Sample one (N=592), the majority of respondents were women (59.8%) and
white (74.7%). Most of the respondents (49.5%) fell in the age grouping 18 – 38
years, reported being married or living together (69.9%) with either no children
(39.2%) or more than two children (36.7%). In addition, 40% of the respondents
obtained a degree or diploma and 39.2% reported to have a post-graduate
qualification. A large portion of the respondents (37%) were employed in
specialist or professional positions and the second largest grouping (25.2%) were
employed in senior management positions. In terms of completed years’ of
service, 36% of the sample reported to have ten years or longer working
experience with their current employer.
In Sample two (N=894), the majority of respondents were women (59.1%) and
white (64.8%). The largest portion of the sample fell in the age category 28 years
– 38 years (43%), reported being married or living together (67%) with no children
(41.5%). A large grouping reported having ten years or more experience with
their current employer (34.3%), having at least a degree or diploma (40.3%), and
they are mostly employed in specialist or professional positions (35.3%). The
distribution in terms of the demographic variables of the two sample groups was
very similar.
10
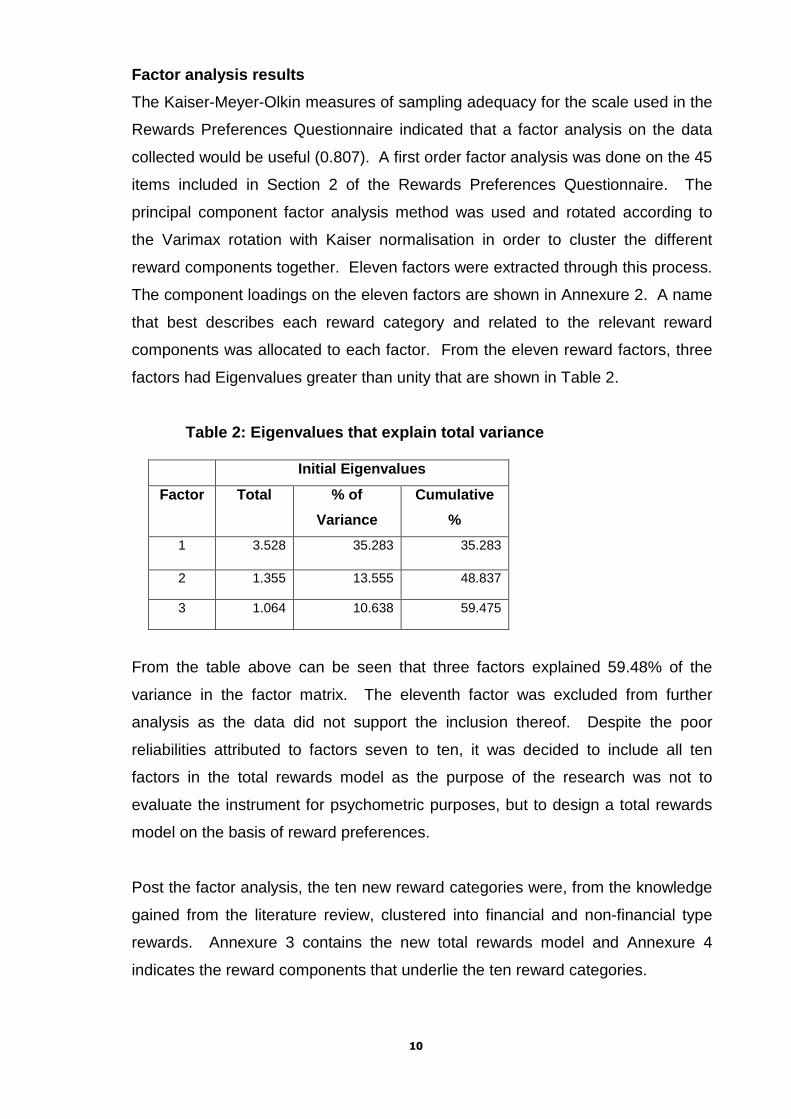
Factor analysis results
The Kaiser-Meyer-Olkin measures of sampling adequacy for the scale used in the
Rewards Preferences Questionnaire indicated that a factor analysis on the data
collected would be useful (0.807). A first order factor analysis was done on the 45
items included in Section 2 of the Rewards Preferences Questionnaire. The
principal component factor analysis method was used and rotated according to
the Varimax rotation with Kaiser normalisation in order to cluster the different
reward components together. Eleven factors were extracted through this process.
The component loadings on the eleven factors are shown in Annexure 2. A name
that best describes each reward category and related to the relevant reward
components was allocated to each factor. From the eleven reward factors, three
factors had Eigenvalues greater than unity that are shown in Table 2.
Table 2: Eigenvalues that explain total variance
Initial Eigenvalues
Factor Total % of
Variance
Cumulative
%
1 3.528 35.283 35.283
2 1.355 13.555 48.837
3 1.064 10.638 59.475
From the table above can be seen that three factors explained 59.48% of the
variance in the factor matrix. The eleventh factor was excluded from further
analysis as the data did not support the inclusion thereof. Despite the poor
reliabilities attributed to factors seven to ten, it was decided to include all ten
factors in the total rewards model as the purpose of the research was not to
evaluate the instrument for psychometric purposes, but to design a total rewards
model on the basis of reward preferences.
Post the factor analysis, the ten new reward categories were, from the knowledge
gained from the literature review, clustered into financial and non-financial type
rewards. Annexure 3 contains the new total rewards model and Annexure 4
indicates the reward components that underlie the ten reward categories.

11
Personality type distribution
The primary research question was to determine the relationship between
personality type and reward preferences. In terms of the distribution of
personality types, ISTJ was the most prevalent personality type (19.5%) and
ESTJ the second most prevalent type (9.8%). In six of the personality types, the
sample size was less than 30 of which three were less than 20. It was decided
that the types for which fewer than 20 responses were received, would be
excluded from the analysis namely ENFJ, ISFP and INFJ. Therefore, 13 types
were used in the analysis of the data.
The relationship between personality and reward preferences
The distribution of preferences (in terms of the mean scores) for different reward
categories as reported by different personality types is depicted in Figure 2.
Figure 2: Preferences for reward categories as indicated by personalitytypes
Figure 2 illustrates that different mean scores were reported for the different
personality types of which the highest preference reported by almost all
personality types, was for Control over my pay. Other reward categories where
different mean scores were apparent on the graph were medical aid and

12
retirement funds, flexible work practices, development opportunities, family care
and quality work environment. However, when the Test of Normality
(Kolmogorov-Smirnov) and Levene’s test of Equal variances were conducted on
the raw data, the principles were violated and a normal distribution was not
always evident. This could be as a result of the fact that the sample sizes on the
different personality types were too small. The results of the One-Way ANOVA
calculated on the group of 13 types and ten reward categories showed no
statistical significant differences in the mean scores. With the use of the post hoc
Scheffe and Tamhane tests, however, some significant scores were observed. A
summary of the statistical significant differences between the different personality
types in respect of their preference for the reward categories is included in Table
3.
Table 3: Statistical significant differences between personality type andreward preferences (mean indicated in parenthesis)
Reward categories
Performance and careermanagement
Quality workenvironment
Work relationships andteamwork
ESFP (6.04) and ESTJ(5.34)
ESFJ (5.07) and ISTJ(4.08)
ESFP (6.60) and ISTJ(5.81)
ESFP (6.04) and INFP(5.30)
ESFP (6.04) and INTP(5.27)
ESFP (6.04) and ISTJ(5.33)
ESFP (6.04) and INTJ(5.24)
From Table 3 it can be seen that personality types ESFP, ESTJ, INFP, INTP, ISTJ
and INTJ indicated significantly different preferences for performance and career
management. Personality types ESFJ and ISTJ indicated significant different
preferences for quality work environment. Personality types ESFP and ISTJ
indicated significant different preferences for work relationships and teamwork.

13
A secondary analysis was conducted on the dataset where the relationship
between personality preference and reward preferences was explored. More
statistical significant differences were found compared to the analysis done on
personality types. Table 4 provides a summary of the results.
Table 4: Significant differences between personality preferences andpreferences for reward categories (mean scores indicated in parenthesis)
Personality preferences
Rewardcategories
Extraversion(E) /Introversion(I)
Sensing (S) /Intuition (N)
Thinking(T)/ Feeling(F)
Judging (J) /Perceiving(P)
Performance andcareermanagement
E (5.64) and I(5.35)
T (5.42) andF (5.63)
Quality workenvironment
E (4.45) and I(4.12)
T (4.17) andF (4.48)
Family careE (3.51) and I(3.22)
T (3.24) andF (3.58)
EmpowermentE (6.17) and I(6.13)
Flexible workpractices
S (5.40) and N(5.73)
T (5.66) andF (5.32)
Medical Aid andRetirement funds
S (5.71) and N(5.43)
Rewardperformance
E (5.61) and I(5.44)
Control over mypay
E (6.60) and I(6.49)
Workrelationships andteamwork
E (6.16) and I(5.95)
T (5.99) andF (6.16)
Developmentopportunities
E (4.67) and I(4.38)
J (4.40) and P(4.68)
From Table 4 can be seen that respondents with a preference for Extraversion
reported higher scores on all reward categories compared to respondents with a
preference for Introversion. Different preferences were also reported for five of
the reward categories in terms of a Thinking/Feeling preference, with respondents
preferring Feeling indicating a higher preference for four of these reward
categories. The significant differences reported under work relationships and
teamwork are a reflection of the differences reported for personality types ESFP
and ISTJ. This is similar for quality work environment where the differences in
personality preferences reflect the results reported for personality types ESFJ and
ISTJ.

14
A third analysis on the dataset was done to assess the relationship between
personality temperament and reward preferences. In the one-way ANOVA test
and the post hoc Scheffe and Tamhane tests, statistical meaningful differences in
the reward preferences were reported as shown in Table 5.
Table 5: Significant differences between personality temperaments andreward preferences (mean scores indicated in parenthesis)
Reward categoriesTempera-
mentTempera-
ment*p eta
Flexible workPractices
SP(5.28)
NT(5.86)
0.050 0.123
Medical aid andretirement funds
SP(5.91)
NF(5.39)
0.046 0.118
Work relationships and teamwork
SJ(5.97)
SP(6.27)
0.007 0.144
Developmentopportunities
SJ(4.32)
SP(4.74)
0.040 0.155
SJ(4.32)
NT(4.72)
0.016 0.155
*p<0.05
Table 5 shows that statistical significant differences between the temperaments
were reported in respect of four of the reward categories. In terms of the eta
squared values, the practical significance of these differences were small.
Rewards preferences for different demographic variables
The relationships between preferences for reward categories and different
demographic variables (race, age, gender and educational qualifications) were
investigated. The data from Sample two (N=894) was used for this exercise.
Some of the main findings are herewith reported.
In terms of race, there were statistical significant differences in the mean scores of
seven reward categories. In six of these reward categories (performance and
career management, quality work environment, family care, empowerment,
reward performance and development opportunities), significant differences were
reported between the African and White respondents with mean scores for the
African respondents in all cases being higher. For work relationships and
15
teamwork, Indian respondents had the highest mean score and White
respondents the lowest.
In terms of age, statistical significant differences in reward preferences were
reported for six of the ten reward categories (performance and career
management, quality work environment, family care, flexible work practices,
control over my pay and development opportunities). The most significant
differences were between the age groups 18 – 27 years and 49 years + in terms
of their preference for performance and career management, quality work
environment and development opportunities, where the mean scores for the
youngest age group were significantly higher than the older groups. In contrast to
this, the younger group had the lowest preference for flexible work practices. In
respect of control over my pay the age group 39 – 48 years’ indicated a
significantly higher preference.
The analysis on gender indicated statistical significant differences between men
and women in respect of five reward categories. Women have a higher
preference for performance and career management, quality work environment,
family care, medical aid and retirement funds and work relationships and
teamwork. The mean scores on all reward categories were lower for men than
the scores reported for women.
In terms of educational qualification, statistical significant differences in mean
scores were reported for eight reward categories (performance and career
management, quality work environment, family care, flexible work practices,
medical aid and retirement, reward performance, work relationships and
teamwork and development opportunities). In terms of flexible work practices and
development opportunities the highest preference was reported by the
respondents with a post graduate qualification. For the remaining six categories,
respondents with a qualification of Up to certificate reported the highest
preference. In respect of performance and career management, quality work
environment, family care, medical aid and retirement funds, reward performance
and work relationships and team work, the lower the qualification, the higher the
preference for the reward category.

16
Preferences for reward components
An analysis was done on the data collected from the Rewards Preference
Questionnaire to understand for which reward components (collectively forming
the reward categories), respondents had the highest and lowest preferences. The
responses to Sections 2(a) and (b) of the questionnaire were collapsed to reflect
the two extreme points on the seven point scale. The lowest scores (least agreed
or important) are indicated by ratings 1 and 2 and the highest scores are indicated
by ratings 6 and 7 (totally agreed or very important). The reward components
with the highest and lowest scores are indicated in Table 6.
Table 6: Highest and lowest preferences for reward components included inthe total rewards model
Responses to Section 2(a) Responses to Section 2(b)
Highest scores
(ratings 6 & 7)
Lowest scores
(ratings 1 & 2)
Highest scores
(ratings 6 & 7)
Lowest scores
(ratings 1 & 2)
Salary (83.2%) On-site child
care (36%)
Market related
salaries (93.5%)
Subsidy for
financially
dependent
parents (60%)
Quality of co-
workers (80.5%)
Dedicated
parking bay
(33.6%)
Accountable for
personal job outputs
(91.2%)
Holiday
programmes for
children (51.7%)
Flexible hours
(80.2%)
Subsidised
tuition for
children (26.4%)
Challenging job
(89.3%)
Housing
assistance
(34.1%)
Safety in the
workplace
(78.8%)
On-site
convenience
store (25.6%)
Bonuses linked to
personal
performance
(88.4%)
Inflation linked
increases
(32.4%)
Annual bonus
(76.6%)
Sabbatical leave
(25.4%)
Merit increases
linked to personal
performance
(86.5%)
Good working
relationship with
colleagues
(76.2%)
Career path
planning (78.7%)
Growth opportu-
nities (75.6%)

17
The reward components listed in Table 6 as very important (ratings 6 and 7) are
critical for inclusion in a total rewards model whereas more flexibility would exist
with the components that received lower ratings (ratings 1 and 2).
Attraction, retention and motivation of employees
Another secondary research question was to identify the reward categories that
mostly contribute to the attraction, retention and motivation of employees. The
following graph presents the results:
Figure 3: Reward categories that mostly influence the attraction, retentionand motivation of respondents
As can be seen in Figure 3, Monthly salary has the greatest influence on an
employee’s decision to join an organisation (73.5%). Performance and career
management has the greatest influence on employees’ decisions to remain with
an organisation (27%) as well as to motivate (34.3%). Variable pay (29.7%) also
plays a significant role in motivating employees.
DISCUSSION
A review of the literature highlighted that people with different personality types,
traits and preferences, as well as from different cultures and geographic locations,
are motivated differently. The golden thread through all the motivational theories
is that there should not be too much reliance on financial rewards only to attract,

18
retain and motivate key employees. Organisations that offer a total rewards
package in accordance with employee preferences are more likely to be
successful in the global war for talent.
Relationship between personality type and reward preferences
In the initial high level analysis of the reward preferences per personality type,
optical differences in preferences for the reward categories, between the different
personality types were visible (Figure 2). The statistical analysis however only
reported statistical significant differences between certain personality types in
three of the reward categories. The most significant differences are herewith
discussed.
The statistical significant difference in the preference for performance and career
management was evident between people with a personality preference ESFP
and INTJ where the mean score for ESFP was the highest. Descriptors of the
ESFP type indicate a strong need to work with others, to find enjoyment in people,
to make things happen through people and to learn by trying a new skill with other
people (Meyers, 1998). People with a preference for INTJ prefer a more
independent approach, are less reliant on others to perform a task and are self-
driven and tough-minded. The differences in the descriptors for these two types,
explain the difference in preference for performance and career management.
The strong focus on people, explains the ESFPs higher preference for
performance and career management which could also indicate a belief in
performance and career management processes that collectively strive to meet
common goals, shared rewards and building careers for employees in an
organisation. These processes should however not be too structured as the
people with an ESFP preference do not generally enjoy structure and routine.
This result does not indicate that people with a preference for INTJ do not require
performance and career management in the workplace. They do however have a
lower preference for this type of reward category and would indeed be effective
implementers of a performance and career management policy if they report to a
manager they respect, and can use this process as a vehicle to manage their and
others’ performance. This could potentially be a growth area for the person with a
preference for INTJ as performance and career management, where effectively

19
implemented, could provide an opportunity for the line manager to give feedback
on behaviour – especially where behaviour is perceived as aloof, too independent,
abrupt or single-minded; descriptors often associated with the INTJ personality
type.
In four of the personality types, the lowest mean scores reported in respect of
performance and career management, were for people with a preference for
Introversion (INFP, INTP, ISTJ and INTJ). This result could relate to the
Introverts’ preference to work contentedly alone, to focus more on their own
interests and privacy in contrast to people with a preference for Extraversion who
prefer to communicate through talking, are sociable and expressive and readily
take initiative. Descriptors for people with a preference for Introversion support
the finding that they will have a reduced preference for personal interaction
through for example performance and career management processes and be
more reliant on themselves to manage their own performance.
The biggest statistical significant difference in the reward category quality work
environment was between personality types ESFJ and ISTJ where people with an
ESFJ type preference indicated a higher preference for a quality work
environment than people with an ISTJ personality type. Quality work environment
refers to a comfortable work environment that could include on-site amenities as
well as flexible work practices. People with a preference for type ESFJ are
sensitive to the needs of others and their satisfaction comes from the comfort of
seeing others happy. They are furthermore energized by interaction with other
people, enjoy comfortable, structured situations and order. They tend to have a
focus on logistics to support people and maintain organisations. Given the
additional structure and convenience as well as the benefit to others that a quality
work environment brings to the workplace, it is understandable that people with a
preference for ESFJ, would indicate the highest preference for this reward
category.
On the other hand, people with a preference for ISTJ, tend to have a strong sense
of responsibility, duty and great loyalty to organisations; they will go the extra mile
in completing tasks that are meaningful and they enjoy standard procedures. It is
possible therefore that these employees do not necessarily expect the employer

20
to provide a quality work environment. Being fiercely loyal, and comfortable with a
standard working environment, they probably will support the employer regardless
of what the employment offering is or what the working environment entails.
Furthermore, with their structured approach, they will arrange for childcare
facilities and fitness centres outside of the work environment if it is not provided
within the working environment. It is however interesting that given that these two
types (ESFJ and ISTJ) belong to the same temperament (SJ), one would have
expected a closer alignment on their preferences for this reward category.
The statistical significant difference in the reward category work relationships and
teamwork was between personality types ESFP and ISTJ where ESFP types
placed greater value on work relationships and teamwork than people with a
preference for ISTJ. Work relationships and teamwork refers to quality colleagues
that value teamwork and sound working relationships. People with a preference
for ESFP find their enjoyment in people and are generally good team players in
comparison with people that have a preference for ISTJ and generally prefer to
work alone. The higher preference for work relationships and teamwork reported
by the respondents with a preference for ESFP is therefore in line with the general
descriptions of behaviour.
Statistical significant differences in preferences for three non-financial reward
categories were reported. This provides insight to organisations in the structuring
of total rewards models for different employee segments. It is however
recommended that personality types not be used as an employee segment to
design a total rewards model.
Relationship between personality preference and reward preferences
More statistical significant differences in reward preferences were found for
personality preferences than for personality types. In all ten of the reward
categories, the respondents with a preference for Extraversion indicated higher
mean scores, of which there were significant differences between respondents
with a preference for Extraversion and respondents with a preference for
Introversion, in respect of eight of the ten reward categories (all except flexible
work practices and medical aid and retirement funds). This result compares
favourably with previous research that people with a preference for Extraversion
21
are more inclined to be motivated by money (and would then have a higher
preference) (Furnham & Argyle, 1998). Although the differences between
respondents with a preference for Extraversion and Introversion in Flexible work
practices and Medical aid and retirement funds were not statistical significant, the
respondents with a preference for Extraversion still reported higher mean scores.
According to Myers and Myers (1995), the present Western civilisation is
dominated by people with a preference for Extraversion who are more vocal than
people with a preference for Introversion. If people with a preference are
therefore more expressive, this would support the results. In respect of all
statistical significant differences reported, the results support the current view of
different personality preferences and contribute to a broader understanding of the
reward preferences for different personality preferences.
Relationship between personality temperaments and reward preferences
In terms of flexible work practices respondents with a preference for the NT
temperament reported the highest mean score and SP the lowest. A preference
for NT refers to people who inter alia tend to trust logic and reasons, who have a
need for flexibility within structure and a strong drive for competence (Myers,
1998). The higher preference for flexible work practices on the side of the NT
temperament seems to fit the NT descriptors. Working within a flexible structure,
enables them to apply their structures and schedules within defined parameters.
In respect of work relationships and teamwork the SP temperament had the
highest mean score and SJ temperament the lowest. The typical behavioural
descriptors for people with a preference for the SP temperament, include a need
to get things done through people, adaptable, and seeking adventure and new
experiences involving people (Kroeger & Thuesen, 1988). The higher mean score
for the people with a SP temperament in respect of work relationships and
teamwork could align with the strong need to work with and through people in
order to accomplish tasks. This is in comparison to people with a SJ
temperament who are typically more concerned with authority and traditional
structures and who may prefer to report to a line manager instead of working as
part of a team and be collectively responsible for the results.

22
People with a preference for the NT temperament indicated a significantly
stronger preference for development opportunities compared to the SJ
temperament. People with a preference for NT are described as people who
seek competence and thorough knowledge thus explaining the result. The
development needs of people with a preference for NT should therefore be
carefully considered in terms of their career plans to enhance retention of these
employees.
The relationship between reward preferences and demographic variables
The results indicated statistical significant differences in most of the demographic
variables analysed. The significant difference in the preferences for African and
White respondents is specifically worth noting. In most reward categories, the
African respondents reported a higher preference than the white respondents.
This supports previous research that culture and background plays a role in
reward preferences (Macgrain Herkenhoff, 2000). A history marked by
marginalisation could explain why African respondents have stronger feelings in
terms of their reward preferences. These feelings could potentially extend beyond
reward preferences to broader employment practices.
In terms of age the general finding is that the older respondents are, the lower
their preferences for the different categories. Previous research indicated that the
different preferences are related to where employees are in terms of their life
cycles (Giancola, 2007). The lack of significant differences for medical aid and
retirement funds is surprising as it would have been expected that the preference
for this reward category, increases as employees grow older.
Statistical significant differences were identified in terms of gender, with higher
scores for women than for men in all the reward categories. This could be
indicative that women have a higher preference for a broader total rewards
package, as opposed to consisting of financial components only. The differences
in earnings between women and men (Müller & Plug, 2005) could also be as a
result of women having a higher preference for non-financial types of rewards that
organisations offer such as flexible work practices that are not necessarily added
into the financial package offered and could contribute to the discrepancies noted
in financial earnings. There is also an increase in working mothers who are also
23
primary caregivers (Hankin, 2005). This fact contributes to the stronger need for a
broader reward offering that includes more than just financial rewards.
Educational qualifications also play a role in reward preferences. In the case of
respondents with matric or a certificate, preferences were much higher than
graduates and post graduates. It can only be speculated that this is as a result of
the graduates being confident that they will experience the benefits that they
require, and if not, that they have more opportunities to move to other
organisations that would oblige. It is also assumed that the earnings of graduates
are higher than that of people with a matric qualification and therefore they can
afford to purchase benefits such as medical aid and retirement outside of the
organisation where this is potentially less possible for people without the
qualifications.
The new total rewards framework
The most statistical significant differences in respect of the different reward
categories have been integrated into the total rewards model, forming the total
rewards framework shown in Table 7. The reward component control over my
pay consistently received the highest mean score. In addition, the more senior
employees are within an organisation, the higher the preference to have control
over their reward package. As control over pay refers to the implementation of
reward practices and policies (market related salary; performance related
increases) as opposed to a specific benefit, policy or practice, it was not included
in the total rewards model as a reward category, but as an overarching statement
that indicates the importance to the respondents of having control over the
structuring and composition of their total rewards package. The mean scores for
respondents with a preference for Extraversion were higher in respect of all
reward categories and were not included in the model.

24
Table 7: Total Rewards Framework
Total package(Financial or Extrinsic rewards)
Additional Rewards(Non-financial or Intrinsic rewards)
Medical aid and retirement funds Female 10 years+ service No formal post matric qualification Administrative positions Divorced or widowed or separated ESFP & ENFJ People with a preference for S
Performance and career management Female 0-2 years service Younger employees, 18 – 27 yrs No formal post matric qualification Administrative positions ESFJ & ESFP People with a preference for F
Reward performance No formal post matric qualification Junior management Divorced or widowed or separated ESFJ & ENTJ
Quality work environment Female 0-2 years service Younger employees, 18 – 27 years Administrative or clerical level positions No formal post matric qualification ESFJ & ESFP People with a preference for F
Family care Female No formal post matric qualification Junior management Employees with at least one child Preference reduce as employees
get older ESFJ & ESFP People with a preference for F
Empowerment General management positions ENTP & ISTP
Flexible work practicesGeneral need but more specifically: 28 – 38 years Post graduate qualification Married / living together 3 – 6 years’ service General management positions ENTJ & ENTP People with a preference for N People with a preference for T People with a temperament of NTWork relationship and teamwork Female Administrative or Clerical level positions No formal post matric qualification ESFJ & ESFP People with a temperament of SP People with a preference for FDevelopment opportunities Female 18 – 27 years Post graduate qualification Administrative positions ESTP & ENTP People with a temperament of NT People with a preference for P
CONTROL OVER MY TOTAL REWARDS PACKAGE

25
Table 7 provides a view of the different employee segments analysed in this study
that have the most statistical significant preferences for the respective reward
categories. People have very different individual motivations and preferences
often in complex combinations and motivation is not necessarily only influenced
by monetary inducements; money is however definitely a key component, either
directly or indirectly, in motivating, attracting and retaining employees and
ultimately contributes towards engagement.
Attraction, retention and motivation
Previous research has indicated that pay is the most important reward component
for employees (Corporate Leadership Council, 2002). What has been reported
through this study is that pay plays a smaller role in the retention and motivation
of employees and that the line managers play a much bigger role. Rewards,
retention and engagement are all closely linked constructs and if they are
structured in accordance with employee preferences, this can have a significant
impact on organisational performance.
It is hoped that this research would trigger a curiosity amongst employers to find
out what the specific reward preferences for their employees are and to respond
by developing a ‘best fit’ total rewards model for their organisations.
CONCLUSION
The following outcomes were obtained from this study:
a) A Rewards Preferences Questionnaire was designed and tested for validity;
b) An empirical total rewards model was designed and enhanced with the most
preferred reward categories creating the total rewards framework;
c) The relationships between personality preferences, temperaments and types
and reward preferences were assessed;
d) The influence of demographic variables on reward preferences was
explored; and
e) The reward categories that play the most important role in the attraction,
retention and motivation of employees were identified.

26
Overall the study confirmed that there are significant differences in reward
preferences of employees. Rewards should expand beyond monetary rewards to
also include non-financial rewards and be and tailored to meet individual
preferences. The findings of this research are expected to assist particularly
South African managers, human resources and rewards professionals in having a
better understanding of reward preferences of their employees. Differentiating in
reward offerings contribute to higher levels of attraction, retention, engagement
and motivation that positively influence organisational performance.
Limitations of this research
The following aspects are viewed to be potentially limiting in terms of this study:
The relatively lower number of respondents on Form GRV®, especially in
analysing the type results where the samples for some of the types were
below twenty;
The respondents could not be identified in terms of the industries they
present and it is possible that the results could be skewed in favour of
rewards preferences of individuals working within the financial services
industry.
Suggestions for future research
The following suggestions are made in terms of future research within this field:
Analysing the reasons why such significant differences were found in the
reward preferences of White and African respondents specifically; and
Conducting a conjoint analysis on understanding the relative importance of
the rewards categories, namely if people have to choose between different
reward categories, which ones they would prefer.
Facing the current worldwide economic downturn, a lot of managers find
themselves wrestling with possibilities of reducing staff complement whilst clinging
to talented to employees and motivating them to enhance their levels of
performance. There is no simple answer to the question of how good employees

27
can be attracted, retained and motivated. Can money motivate? Although the
prevailing view is that money is the primary motivator, it is clearly not the only one.
This study confirms that reward offerings should firstly be diverse and not only
contain monetary rewards and secondly, be tailored to meet individual
preferences. The challenge is therefore to design pay practices that will support
sound management practices and aid in the achievement of business goals by
motivating employees to perform at continuously high levels.
The key to attracting and retaining the best employees lies in an enriched,
diversified total rewards model that is an essential building block in the employee
value proposition.
...........it’s not only money that counts..........

28
Annexure 1: Rewards Preferences Questionnaire

29

30

31
Annexure 2: Factor loadings on reward factorsFactor loadings
Rewardcatego-ries
Reward components as listed in RewardsPreferences Questionnaire 1 2 3 4 5 6 7 8 9 10 11
Performance andcareermanagement
Growth opportunities, learning and developmentare … 0.654
Constructive and honest feedback on myperformance is … 0.625
Having a balanced scorecard or performanceagreement / contract with agreed objectives is... 0.606
Monthly communication sessions about businessprogress with my manager are … 0.598
I think coaching and mentoring are….. 0.551The opportunity to take study leave for furtherstudies is… 0.523 0.423
Informal recognition for a job well done (forexample a thank you note) is …. 0.511
Bursaries / funding for tertiary qualifications is… 0.509 0.278 0.356
Personal safety and security in the workplace is… 0.383 0.300 0.345
Qualityworkenvironment
An on-site medical centre is… 0.754
An on-site convenience store is… 0.741 0.245
An on-site staff restaurant is… 0.672 0.253
An on-site fitness centre is… 0.666
On-site or subsidised childcare facilities is … 0.514 0.493A comfortable work environment (décor,equipment) is… 0.272 0.445 0.324A dedicated parking bay in the building where Iwork is … 0.334
The ability to work flexible working hours is… 0.329

32
Factor loadingsRewardcatego-ries
Reward components as listed in RewardsPreferences Questionnaire 1 2 3 4 5 6 7 8 9 10 11
Familycare
My employer should provide holiday programs formy children 0.738My employer should provide me with an allowanceor subsidy to care for my financially dependantparents 0.654
Subsidised tuition for my children is… 0.298 0.611
My employer should provide me with financialassistance to buy a house 0.520
I think employers should provide phased in returnto work after maternity / paternity leave 0.501 0.328Increases should be linked to inflation and not topersonal performance 0.283
-0.251
Empo-werment
My job should be challenging and test my abilities 0.298 0.695
I should be held accountable for my personal joboutputs 0.686 0.363I enjoy having total control over my work methodswithout my manager's interference 0.546
My career path planning should align with mypersonal interests and goals 0.259 0.529
I would like to structure my remunerationaccording to my own needs 0.295
Flexibleworkpractices
I need a laptop and 3G card to perform optimally 0.891I need to log into the employer's network fromhome 0.839
Medicalaid andretire-mentfunds -
Retirement and disability benefits are… 0.794
Medical aid benefits through a medical aidscheme are… 0.710

33
Factor loadings
Rewardcategories
Reward components as listed inRewards Preferences Questionnaire 1 2 3 4 5 6 7 8 9 10 11
Rewardperformance
My annual performance bonus / incentive is… 0.605
My salary / guaranteed remuneration is... 0.283 0.487
Formal recognition for a job well done (forexample a fully paid overseas trip) is…. 0.386 0.263 0.401
Annual allocations of shares and or shareoptions are… 0.354 0.285
Control overmy pay
Merit increases should be linked to personalperformance 0.622
Bonus allocations should be linked to mypersonal performance 0.542
My salary must be market related 0.291 0.311
Workrelationshipsandteamwork
Having a good working relationship withcolleagues is… 0.402 0.583
The quality of co-workers in my team is… 0.346 0.496Management should encourage teamperformance 0.280 0.307 0.260
Developmentopportunities
I would like to go on an internationalsecondment 0.518The opportunity to rotate and experiencedifferent types of jobs is … 0.396 0.406
The opportunity to take sabbatical leave is … 0.354

34
Annexure 3: The new total rewards model
Total Package
(Financial or Extrinsic rewards)
Additional rewards
(Non-financial or intrinsic rewards)
Medical aid and retirement funds
Live healthy and retire well through
access to medical aid and retirement /
disability schemes
Performance and career management
A well-defined performance contract,
regular discussions with management on
progress and constructive feedback on
performance and informal recognition.
Learning and development opportunities
(formal and informal) and access to
coaching and mentoring programs.
Reward performance
Base salary, bonus, long term
incentives and formal recognition
Quality work environment
A comfortable work environment that could
include on-site convenience store, medical
centre, fitness centre and childcare
facilities and a parking bay. Flexible work
practices contribute to a quality working
environment.
Family care
Care for children, family and
financially dependent parents.
Empowerment
A challenging job where I am held
accountable for my outputs and have
control over my work methods. My
preferences are considered in career and
remuneration structuring.
Flexible work practices
Facilities to enable flexible work practices
such as laptops, 3G cards and access to
networks.
Work relationship and teamwork
Quality colleagues that value teamwork
and sound working relationships
Development opportunities
Opportunities for international
secondments, rotation and sabbatical
leave
CONTROL OVER MY TOTAL REWARDS PACKAGE

35
Annexure 4: Sorting reward components under ten reward categoriesin the empirical total rewards model
Performance and career management
Growth opportunities, learning and development
Constructive and honest feedback on performance
A balanced scorecard or performance agreement / contract with agreed objectives
Monthly communication sessions about business progress with my manager
Coaching and mentoring
Study leave for further studies
Informal recognition for a job well done (for example a thank you note)
Bursaries / funding for tertiary qualifications
Personal safety and security in the workplace
Quality work environment
An on-site medical centre
An on-site convenience store
An on-site staff restaurant
An on-site fitness centre
On-site or subsidised childcare facilities
A comfortable work environment (décor, equipment)
A dedicated parking bay
The ability to work flexible working hours
Family care
Holiday programmes for children
Subsidised care for financially dependent parents
Subsidised tuition for children
Financial assistance to buy a house
Phased-in return from maternity / paternity leave
Inflation-linked increases
Empowerment
Challenging job that tests abilities
Accountability for personal job outputs
Control over work methods
Career path planning aligned with personal interests and goals
Remuneration is structured according to own needs
Flexible work practices
A laptop and 3G card
Ability to log into employer’s network from home
Medical aid and retirement funds – live healthy and retire well
Retirement and disability benefits
Medical aid benefits
Reward performance
Annual performance bonus / incentive
Salary / guaranteed remuneration
Formal recognition for a job well done (for example a fully paid overseas trip)
Annual allocations of shares and or share options

36
Control over my pay
Performance linked / merit increases
Performance linked bonus allocations
Market related salary
Work relationships and teamwork
A good working relationship with colleagues
Quality co-workers in the team
Encourage team performance
Development opportunities
International secondment opportunities
Rotation opportunities
Sabbatical leave opportunities

37
Alphabetical List of References:
Abboud, S. (2007). Best Buy uses flexibility and choice to improve long term incentive design.Workspan, 10/07, p. 33. Scottsdale, United States: WorldatWork Press.
Armstrong, M. & Brown, D. (2006). Strategic Reward Making it Happen. USA: Kogan PageLimited.
Armstrong, M. & Thompson, P. (2002, July). A Guide To Total Reward: Part 1. E-Reward.co.uk. research report. E-Reward Fact Sheets, no. 2. Retrieved on 10 October2007 from the World Wide Web: http://www.sara.co.za.
Armstrong, M. (2006). A Handbook of Human Resource Management Practice. 10th
edition.United Kingdom: Cambridge University Press.
Bartlett, R.L., Grant, J.H. & Miller, T.I. (1990). Personality differences and executivecompensation. Eastern Economic Journal, Volume XVI, No. 3, July – September 1990,pp. 187 – 195.
Bayne, R. (2004). Psychological Types At Work: An MBTI® perspective. United Kingdom: TJInternational, Padstow, Cornwall.
Berger, L.A. & Berger, D.R. (2004). The Talent Management Handbook. United States: TheMcGraw Hill Companies.
Bergmann, T.J. & Scarpello, V.G. (2001). Compensation Decision Making. 4th edition. USA:Harcourt, Inc.
Bowles, S., Gintis, H. & Osborne, M. (2001, May). Incentive-enhancing preferences:Personality, behaviour and earnings. American Economic Association.
Burchman, S., Jones, B. & Tourney, D. (2007). Compensation discussion & analysis: lessonslearned. Workspan, 05/07. pp. 90 – 97. Scottsdale, United States: WorldatWork Press.
Bussin, M. (2008a, May). Smart retention strategies, part 1. HR Future, 05/2008, p. 13.
Bussin, M. (2008b, June). Smart retention strategies, part 2. HR Future, 06/2008, pp. 12 & 13.
Butler, T. & Waldroop, J. (2004, June). “People” People. Harvard Business review, pp. 78 –86.
Chiang, F. (2005, September). A critical examination of Hofstede’s thesis and its application tointernational reward management. International Journal of Human ResourceManagement 16 : 9 September 2005, pp. 1545 – 1563.
Claus, L. (2007, March). Employee retention – Best practices in keeping and motivatingemployees. B
2B, p. 11.
Corporate Leadership Council. (1999a). Chapter 2. Understanding Employee Values.Washington DC: Corporate Executive Board.
Corporate Leadership Council. (2002). The Compelling Offer Revisited: Changes in EmployeePreferences over time. Washington DC: Corporate Executive Board.

38
Corporate Leadership Council. (2004). The Effort Dividend – Driving Employee PerformanceAnd Retention Through Engagement. Washington DC: Corporate Executive Board.
Corporate Leadership Council. (2005). Total Rewards Philosophy Components andStatements. Washington DC: Corporate Executive Board.
Corporate Leadership Council. (2007). Building and Managing a competitive employment valueproposition in the United Kingdom. Washington DC: Corporate Executive Board.
Corporate Leadership Council. (2008). CLC Quarterly report on HR news and trends.Retrieved on 16 June 2008 from the World Wide Web.http://www.clc.executiveboard.com.
CPP (2008). Myers-Briggs Type Indicator® Assessment (MBTI®). Retrieved on 20 May 2008from the World Wide Web: http://www.cpp.com.
Crawford, N. & Giowa, T. (2008, May). Getting to the Right Flexrewards program for yourorganisation. Paper presented at the 2008 Total Rewards WorldatWork Conference andExhibition, 26 – 29 May 2008, Philadelphia, USA.
Deci, E.L. & Ryan, R.M. (2000). The what and why of goal pursuits: human needs and self-determination of behaviour. Psychological Inquiry 2000, Vol. 11, No. 4, pp. 227 – 268.
Deloitte. (2004). It’s 2008: do you know where your talent is. United Kingdom: Deloitte.
Du Toit, G.E., Erasmus, B.J. & Strydom, J.W. (2007). Introduction to Business management.7
thedition. South Africa: Oxford University press.
DuBrin, A.J. (2005). Fundamentals of Organizational Behaviour. 3rd
edition. Canada:Thomson South-Western.
Frank, F.D., Finnegan, R.P., & Taylor, C.R. (2004, April). The race for talent: retaining andengaging workers in the 21
stcentury. Manpower Planning, April 2004.
Furnham, A. & Argyle, M. (1998). The Psychology of Money. UK: T.J. International Ltd,Padstow, Cornwall.
Furnham, A. (2003). Personality, Individual Differences and Incentive Schemes. NorthAmerican Journal of Psychology, 2003, Vol. 5, No. 3, pp. 325 – 334.
Gerhart, B,. & Rynes, S. L. (2003). Compensation: Theory, Evidence and StrategicImplications. California: Sage Publications, Inc.
Giancola, F. (2007). Employee engagement: what you need to know. Workspan, 10/07, pp.57– 59. Scottsdale, United States: WorldatWork Press.
Giancola, F. (2008). Employee retention efforts. Workspan, 12/08, pp. 30 – 35. Scottsdale,United States: WorldatWork Press.
Gross, S. E. & Edelsten, M. (2006). Paying the price of global expansion. Workspan, 09/2006,pp. 42 – 46. Scottsdale, United States: WorldatWork Press.
Gross, S. E. & Friedman, H. E. (2007). Creating an effective Total Rewards Strategy: Holisticapproach better supports business success. Mercer Human Resources Consulting CD –Your guide to the age of talent. United States.
Gunkel, M. (2006). An exploratory comparison of employees’ performance reward preferencesin Germany, China, Japan and the USA. DUV. Retrieved on 14 June 2008 from the

39
World Wide Web: http://www.springerlink.com.
Hankin, H. (2005). The New Workforce. USA: AMACOM books.
Harris, S. & Clements, L. (2007). What’s the perceived value of your incentives? Workspan,02/07. pp. 21 – 25. Scottsdale, United States: WorldatWork Press.
Harvard Business Review. (2001). Harvard Business Review on Compensation. USA: HarvardBusiness School Press.
Harvard Business Review. (2003). Harvard Business Review on Motivating People. USA:Harvard Business School Press.
Henderson, R.I. (2003). Compensation Management in a Knowledge-based World. 9th
Edition.New Jersey: Pearson Education, Inc.
Herman, R.E. & Gioia, J.L. (2000). How to Become an Employer of Choice. USA: OakhillPress.
Hill, B. & Tande, C. (2006). Total rewards – the employment value proposition. Workspan,10/06, pp. 19 – 22. Scottsdale, United States: WorldatWork Press.
Jung, C.G. (1971). Psychological Types. (E.C. Hull, Ed.). Princeton, N.J:Princeton UniversityPress. (Original work published in 1923).
Kaliprasad, M. (2006, June). Attracting, retaining and motivating capable people. CostEngineering, Vol. 48, No. 6, June 2006, pp. 20 – 26.
Keuch, R.W., Chuang, J., May, J.E & Sheldrake, N. (2006). What do you call Total Rewards inyour organisation? Workspan, 10/06, p. 38. Scottsdale, United States: WorldatWorkPress.
Kroeger, O. & Thuesen, J.M. (1988). Type Talk. USA: Delacorte Press.
Lawler, E.E. (1990). Strategic pay. San Francisco: Jossey-Bass Publishers.
Lawler, E.E. (2000). Rewarding Excellence. San Francisco: Jossey-Bass Publishers.
Linder, R. (2000). What will I do with my money? USA, Chicago: Northfield Publishing.
Linkow, P. (2006). Winning the competition for talent. Workspan, 10/06, pp. 29 – 32.Scottsdale, United States: WorldatWork Press.
MacGrain Herkenhoff, L.M. (2000). Motivational remuneration (pay) preferences: Culturalanalysis within the Hofstede model. USA: Dissertation.com.
Manning, J. (2008, April). Managing Flexibility. Training Journal, pp. 17 – 19.
Martin, J. (2005). Organisational Behaviour and Management. 3rd
edition. Italy: G. Canale & C.
Masarech, M. (2008). Employee engagement in Europe. Workspan, 12/08, pp. 98 – 101.Scottsdale, United States: WorldatWork Press.
McCaulley, M.H. (1998). MBTI® Manual: A guide to the development and use of the Myers-Briggs Type Indicator®. 3
rdedition. USA: CPP Inc.
Menefee, J.A. & Murphy, R.O. (2004). Rewarding and retaining the best. Benefits Quarterly,Third Quarter, 2004.

40
Milkovich, G.T. & Newman, J.M. (1999). Compensation. 6th
Edition. USA: McGraw-HillCompanies, Inc.
Mkhehlane, B. (2008, June). Motivation: an inside job. HR Future, 06/2008, pp. 42 & 43.
Moss-Kanter, R. (2003). On the frontiers of management. USA: Harvard Business SchoolPublishing Corporation.
Müller, G. & Plug, E. (2005). Estimating the effect of personality on male-female earnings.Tinbergen Institute Discussion paper, Faculty of Economics, Erasmus UniversityRotterdam and Tinbergen Institute, pp. 1 – 38.
Murlis, H. (1996). Pay at the crossroads. UK: Institute of Personnel and Development.
Murphy, P. (2008). Motivation and Personality – which Type are you? Retrieved on 25 April2008 from the World Wide Web: http://www.sykronix.com
Myers, I.B. (1998). Introduction to TYPE. 6th
edition. USA: CPP, Inc.
Myers, I.B. & Myers, P.B. (1995). Gifts differing: understanding personality type. USA,California: Davies-Black Publishing.
Nohria, N., Groysberg, B. & Lee, L. (2008, July – August). Employee motivation: A powerfulnew model. Harvard Business Review, July – August 2008, pp. 78 – 84.
Olson, M.S., Van Bever, D. & Verry, S. (2008, March). When growth stall. Harvard BusinessReview, pp. 50 – 61.
Rehu, M. Lusk, E.J. & Wolff, B. (2006). Sustainable human resource management in China: astudy of a German multinational corporation. World Review of Entrepreneurship,Management and Sustainable Development, Vol. 2, Nos. ½, 2006, pp. 57 – 72.
Reinhold, R. (2008). Introduction to Myers-Briggs Personality Type. Retrieved on 24 April2008 from the World Wide Web: http://www.personalitypathways.com.
Robbins, S.P., Odendaal, A. & Roodt, G. (2003). Organisational Behaviour. South Africa:Creda Communications.
Schaufeli, W. & Enzmann, D. (1998). The burnout companion to study and practice. UK: T.J.International Ltd.
Steel, P. & König, C. J. (2006). Integrating theories of motivation. Academy of ManagementReview 2006, Vol. 31, No. 4, pp. 889 – 913.
Stein, S.J. (2007). Make your workplace great. Canada: John Wiley & Sons, Ltd.
Sung, A. & Todd, E. (2004). Line of sight: moving beyond the catch phrase. Workspan, 10/04,
pp. 65 – 69. Scottsdale, United States: WorldatWork Press.
Taylor, N. & Yiannakis, C. (2007, November). South African MBTI Form M Data Supplement.
Jopie van Rooyen & Partners SA (Pty) Ltd. Johannesburg: JvR Head Office.
Taylor, N & Yiannakis, C. (2009). South African MBTI Form Q Data Supplement. Jopie van
Rooyen & Partners SA (Pty) Ltd. Johannesburg: JvR Head Office.

41
Thomas, K. W. (2002). Intrinsic motivation at work. San Francisco: Berrett-Koehler Publishers,
Inc.
Towers Perrin (2007). Using total rewards to build an effective employee value proposition.
Retrieved on 15 May 2008 from the World Wide Web: http://www.towersperrin.com.
Watson Wyatt 2008/9 WorkUSA report (2008). Employee engagement is crucial in tough
economic times. Retrieved on 26 February 2009 from the World Wide Web:
http://www.watsonwyatt.com
Weiten, W. (1992). Psychology – Themes and Variations. 2nd
edition. Belmont California:
Wadsworth Inc.
Werhane, W. (2008). Hay Group Insight. Retrieved on 23 June 2008 from the World Wide
Web: http://www.promo.haygroupinsight.com
WorldatWork. (2007). The WorldatWork Handbook of Compensation, Benefits & Total
Rewards. Hoboken, New Jersey: John Wiley & Sons, Inc.
Zingheim, P.K. & Schuster, J. R. (2007). High Performance Pay. USA: WorldatWork Press.