THE RELATIONSHIP BETWEEN LEARNING STYLES AND ONLINE EDUCATION AMONG ENTRY
85
1 THE RELATIONSHIP BETWEEN LEARNING STYLES AND ONLINE EDUCATION AMONG ENTRY-LEVEL DOCTOR OF PHARMACY DEGREE STUDENTS By JOSE BERNIER A DISSERTATION PRESENTED TO THE GRADUATE SCHOOL OF THE UNIVERSITY OF FLORIDA IN PARTIAL FULFILLMENT OF THE REQUIREMENTS FOR THE DEGREE OF DOCTOR OF EDUCATION UNIVERSITY OF FLORIDA 2009
Transcript of THE RELATIONSHIP BETWEEN LEARNING STYLES AND ONLINE EDUCATION AMONG ENTRY
1
THE RELATIONSHIP BETWEEN LEARNING STYLES AND ONLINE EDUCATION AMONG ENTRY-LEVEL DOCTOR OF PHARMACY DEGREE STUDENTS
By
JOSE BERNIER
A DISSERTATION PRESENTED TO THE GRADUATE SCHOOL OF THE UNIVERSITY OF FLORIDA IN PARTIAL FULFILLMENT
OF THE REQUIREMENTS FOR THE DEGREE OF DOCTOR OF EDUCATION
UNIVERSITY OF FLORIDA
2009

2
© 2009 Jose Bernier

3
To my family

4
ACKNOWLEDGMENTS
I thank my family and committee members for their continuous support throughout
the entire process. Dr. Campbell for his leadership and encouragement, Dr. Oliver for
her continuous support during my time at the Division of Continuing education and
afterwards, Dr. Honeyman for making himself available to answer my questions, and I
also thank Dr. Ried for making the data that he collected over the years available to me.
I want to finally thank the College of Education administrative office for their help
throughout the process.

5
TABLE OF CONTENTS page
ACKNOWLEDGMENTS .................................................................................................. 4
LIST OF TABLES ............................................................................................................ 7
LIST OF FIGURES ........................................................................................................ 10
ABSTRACT ................................................................................................................... 11
CHAPTER
1 INTRODUCTION .................................................................................................... 12
Introduction ............................................................................................................. 12
Statement of the Problem ....................................................................................... 13 Purpose .................................................................................................................. 14
Research Questions ............................................................................................... 14 Research Hypothesis .............................................................................................. 15 Significance of the Study ........................................................................................ 15
Limitations ............................................................................................................... 15 Conceptual Framework ........................................................................................... 16
Distance Education and Learning Styles ................................................................ 16 Definition of Terms .................................................................................................. 17
2 REVIEW OF LITERATURE .................................................................................... 19
Origins of Online Professional Education Programs ............................................... 19 Quality of Online Professional Education Programs ............................................... 20
College of Pharmacy PharmD Program .................................................................. 22 Learning Styles ....................................................................................................... 23
VARK................................................................................................................ 25 The VARK categories ....................................................................................... 25
Visual (V) ................................................................................................... 25
Aural / Auditory (A) ..................................................................................... 26 Read/write (R) ............................................................................................ 26 Kinesthetic (K) ............................................................................................ 26 What about mixtures? multimodals (MM) ................................................... 26
Learning Styles Inventory (LSI) ........................................................................ 27
Gregorc Learning Style Model .......................................................................... 28 Learning and Study Strategies Inventory (LASSI) ............................................ 29
Benefits of Learning Styles Research to Students and Instructors ......................... 31
3 METHODOLOGY ................................................................................................... 33
Participants ............................................................................................................. 33 Study Design .......................................................................................................... 33

6
Operational Definition of Variables ......................................................................... 34
Instrumentation ................................................................................................. 34
Validity and Reliability....................................................................................... 35 Data Collection ................................................................................................. 36 Data Analysis ................................................................................................... 36 Specific Aim 1 ................................................................................................... 36 Specific Aim 2 ................................................................................................... 37
4 FINDINGS ............................................................................................................... 38
Frequencies for the Variables of Interest ................................................................ 38 Correlations ............................................................................................................ 44 Oneway Analysis of Variance (ANOVA) and T-Test ............................................... 45
Female and Male Comparison on NABP and GPA .......................................... 45
White and Non-white Comparison on NABP and GPA ..................................... 47
Oneway Analysis of Variance (ANOVA) .................................................... 47 Visual and Non Visual Learning Styles Comparison on NABP and GPA ......... 49
Oneway Analysis of Variance (ANOVA) .................................................... 49
Aural and Non Aural Learning Style comparison on NABP and GPA ............... 51 Oneway Analysis of Variance (ANOVA) .................................................... 51
Read/Write and non Read/Write Learning Styles comparison on NABP and GPA .............................................................................................................. 53
Oneway Analysis of Variance (ANOVA) .................................................... 53
Kinesthetic and Non Kinesthetic Learning Style comparison on NABP and GPA .............................................................................................................. 55
Oneway Analysis of Variance (ANOVA) .................................................... 55
Multi-Modal and Non Multi-Modal comparison on NABP and GPA .................. 56
Oneway Analysis Of Variance (Anova) ...................................................... 56 T-Test for Groups Female versus Male ............................................................ 58
T-Test for Groups White versus Not White ....................................................... 59 T-Test for Groups Visual versus Not Visual ...................................................... 60 T-Test for Groups Aural versus Not Aural ........................................................ 61 T-Test for Groups Read/Write versus Not Read/Write ..................................... 62
T-Test for Groups Kinesthetic versus Not Kinesthetic ...................................... 63 T-Test for Groups Multi-Modal versus Not Multi-Modal .................................... 64
5 CONCLUSION ........................................................................................................ 66
APPENDIX
A THE VARK QUESTIONNAIRE ............................................................................... 69
B DATA DICTIONARY ............................................................................................... 73
LIST OF REFERENCES ............................................................................................... 80
BIOGRAPHICAL SKETCH ............................................................................................ 85

7
LIST OF TABLES
Table page 2-1 Five years of growth in Online Learning ............................................................. 20
4-1 Frequencies ........................................................................................................ 38
4-2 Race ................................................................................................................... 38
4-3 Age ..................................................................................................................... 39
4-4 GPA .................................................................................................................... 40
4-5 NABP Score ....................................................................................................... 42
4-6 Visual or Not-Visual ............................................................................................ 43
4-7 Aural or Not-Aural ............................................................................................... 43
4-8 Read or Not-Read .............................................................................................. 43
4-9 Kinesthetic or Not-Kinesthetic............................................................................. 44
4-10 MultiModal or Not-MultiModal ............................................................................. 44
4-11 Correlations ........................................................................................................ 45
4-12 Correlations ........................................................................................................ 45
4-12 Descriptives ........................................................................................................ 46
4-13 Descriptives ........................................................................................................ 46
4-14 Test of Homogeneity of Variances ...................................................................... 46
4-15 ANOVA ............................................................................................................... 47
4-16 Descriptives ........................................................................................................ 48
4-17 Descriptives ........................................................................................................ 48
4-18 Test of Homogeneity of Variances ...................................................................... 48
4-19 ANOVA ............................................................................................................... 49
4-20 Descriptives ........................................................................................................ 49
4-21 Descriptives ........................................................................................................ 50

8
4-22 Test of Homogeneity of Variances ...................................................................... 50
4-23 ANOVA ............................................................................................................... 50
4-24 Descriptives ........................................................................................................ 51
4-25 Descriptives ........................................................................................................ 51
4-26 Test of Homogeneity of Variances ...................................................................... 52
4-27 ANOVA ............................................................................................................... 52
4-28 Descriptives ........................................................................................................ 53
4-29 Descriptives ........................................................................................................ 53
4-30 Test of Homogeneity of Variances ...................................................................... 54
4-31 ANOVA ............................................................................................................... 54
4-32 Descriptives ........................................................................................................ 55
4-33 Descriptives ........................................................................................................ 55
4-34 Test of Homogeneity of Variances ...................................................................... 55
4-35 ANOVA ............................................................................................................... 56
4-36 Descriptives ........................................................................................................ 57
4-37 Descriptives ........................................................................................................ 57
4-38 Test of Homogeneity of Variances ...................................................................... 57
4-39 ANOVA ............................................................................................................... 58
4-40 Group Statistics .................................................................................................. 58
4-41 Independent Samples Test ................................................................................. 59
4- 42 Group Statistics .................................................................................................. 59
4-43 Independent Samples Test ................................................................................. 60
4-44 Group Statistics .................................................................................................. 61
4-45 Independent Samples Test ................................................................................. 61
4-46 Group Statistics .................................................................................................. 62

9
4-47 Independent Samples Test ................................................................................. 62
4-48 Group Statistics .................................................................................................. 63
4-49 Independent Samples Test ................................................................................. 63
4-50 Group Statistics .................................................................................................. 64
4-51 Independent Samples Test ................................................................................. 64
4-51 Group Statistics .................................................................................................. 65
4-52 Independent Samples Test ................................................................................. 65

10
LIST OF FIGURES
Figure page 2-1 VARK Learning Model (from Hawk and Shah) ................................................... 27
2-2 Kolb LSI scoring ................................................................................................. 28
2-3 Gregorc Style Delineator (from Hawk and Shah)................................................ 29
2-4 LASSI Scores ..................................................................................................... 30
3-1 Factors impacting performance in online education ........................................... 34

11
Abstract of Dissertation Presented to the Graduate School of the University of Florida in Partial Fulfillment of the Requirements for the Degree of Doctor of Education
THE RELATIONSHIP BETWEEN LEARNING STYLES AND ONLINE EDUCATION
AMONG ENTRY-LEVEL DOCTOR OF PHARMACY DEGREE STUDENTS
By
Jose Bernier
December 2009
Chair: Dale F. Campbell Major: Higher Education Administration
The goal of this study is to investigate the relationship between the preferred
learning styles of professional pharmacy students and their performance/success in a
hybrid PharmD pharmacy program making extensive use of online content.
Consequently, the study will look for early detection factors which can impact the
performance of the student enrolled in the program. A post hoc dataset using data
collected from the 16 question “VARK” questionnaire will be used. VARK is a
questionnaire that provides users with a profile of their learning preferences. The
ultimate goal of the study is to improve the online curriculum to better accommodate
students with different learning styles.
The results showed that there is not relationship between the preferred learning
style and their performance in the program. However, looking at the implications for
Higher Education Administration, the study also shows that when designing a hybrid
course, faculty will benefit from understanding the students and their learning styles to
create a learner-centered course which would maximize the online learning experience.

12
CHAPTER 1 INTRODUCTION
Introduction
The importance and impact of online education is undeniable in higher education.
According to Moloney & Oakley (2006), during the 2003-04 academic year, there were
approximately two million enrollments in online courses and demand is growing rapidly.
Some schools are struggling to keep up with the demand of converting classroom
courses to the online environment. By 2005, about 3.2 million students took at least
one online course (Foster & Carnvale, 2007) and enrollments are expected to grown at
a yearly rate of 20% (Moloney & Oakley, 2006).
The differences between face-to-face and online courses may be obvious at first
glance. However, distance education classes can be as effective and, in some ways,
even more effective than face-to-face courses. The tools and technologies used for
distance education courses facilitate learning opportunities not possible in the face-to-
face classroom (Howard,Schenk, & Discenza, 2004).
Although online education has advantages, it is not for everyone. Online
education was not designed to replace face-to-face courses, but instead to enhance
programs. For example, online classes can make the university more accessible to
mature students who cannot physically come to campus sites. In addition, these classes
provide greater flexibility to students who benefit from being able to control the time
during which they study the course materials. If online classes do fulfill such needs, one
would expect the online section to have older and nontraditional students (Dutton,
Dutton, & Perry, 2002).

13
The online hybrid Doctor of Pharmacy (PharmD) program at a Southeastern
University has encountered students who initially expressed concerns about the online
components of the hybrid program and showed more interest in an all face-to-face
approach. However, a number of these students ended up preferring the hybrid mode
program. One of the most cited causes for the change in perception was the increased
flexibility added by the online component. Early detection of these students could allow
the college to better guide and serve them by designing a course plan that fit their
needs and by addressing any concerns or reservations the students may have had
about the hybrid model.
Statement of the Problem
The goal of this study is to investigate the relationship between the preferred
learning styles of professional pharmacy students and their performance/success in a
hybrid PharmD pharmacy program making extensive use of online content.
Consequently, the study will look for early detection factors which can impact the
performance of the student enrolled in the program. A post hoc dataset using data
collected from the 16 question “VARK” questionnaire will be used. VARK is a
questionnaire that provides users with a profile of their learning preferences. These
preferences are about the ways that they want to take-in and give-out information
(http://www.vark-learn.com/english/page.asp?p=faq ). The sample population for this
study was one of the cohorts that enrolled and graduated from a Southeastern
University Pharmacy program (PharmD) and whose academic progress was followed
for the duration of the program, approximately 4-years. Although VARK is not the only
readily available survey to measure learning styles, the PharmD program utilized it
because there was no cost to administer it.

14
The ultimate goal of the study is to improve the online curriculum to better
accommodate students with different learning styles. Traditionally, online education was
designed to accommodate non-traditional students as well as students who live in
remote areas. Over time, more “traditional” students have chosen to attend an online
course even though a face-to-face version is available. Coffield, Moseley, Hall, and
Ecclestone (2004) suggested that students will become more motivated to learn by
knowing more about their own strengths and weakness as learners.
Purpose
The purpose of this study is to determine if there is a relationship between the
preferred learning style of online students and their performance in the online PharmD
program at a Southeastern University. The ultimate goal of the study is to improve the
online curriculum to better accommodate students with different learning styles.
Research Questions
This study is based on a positivism theoretical framework, using a survey research
methodology and surveys administered by the College of Pharmacy at a Southeastern
University to the students of their PharmD program.
Research questions include the following:
What are the predictors (i.e., student’s demographics, learning styles) of academic
performance as measured by Grade Point Average (GPA)? Specifically
1. Is there a relationship between the demographics of the student and Grade Point Average (GPA)?
2. Is there a relationship between the preferred learning style of the student and the Grade Point Average (GPA)?
3. What are the predictors (i.e. student’s demographics and learning style, GPA, and academic performance measured by National Association of Bards of Pharmacy Licensure Exam (NAPBLEX)?

15
4. Is there a relationship between the National Association of Boards of Pharmacy Licensure Exam (NAPBLEX) results and the student’s demographics, learning styles and GPA?
Research Hypothesis
1. H0: There will be no relationship between the students’ preferred learning styles and their grade point average (GPA).
2. H0: There will be no relationship between the students’ demographics and their grade point average (GPA).
3. H0: There will be no relationship between the students’ demographics and their NABPLEX scores.
Significance of the Study
Faculty of the UF College of Pharmacy has observed that certain students who are
initially hesitant towards the online section of the hybrid program end up favoring it after
experiencing its flexibility. Faculty members have also observed that some students
evaluated in front of a board of professors have difficulty overcoming their fear of social
interaction.
Subsequent to the logic of long life learning described by Coffield et al.(2004) that
students will be more motivated to learn by knowing more about their own strengths and
weaknesses, this study will determine the relationship between the preferred learning
style of the students enrolled in the program and their success in the program as
measured by grade point average (GPA) and success on the NAPLEX.
Limitations
The study is limited to students registered at a Southeastern University’s College
of Pharmacy professional PharmD program whose classes began in fall 2003 and fall
2004 and graduated in Spring 2007 and Spring 2008 from the PharmD program and
have completed the VARK questionnaire.

16
Conceptual Framework
The framework for this study is based on Online Education and Learning Styles.
Although these topics will be discussed in more detail in chapter two, a brief introduction
is included in this section
Distance Education and Learning Styles
Distance education has evolved from the posting syllabi online to a sophisticated
world of course management systems and online applications. Distance learning and
corporate universities are growing at unprecedented rates. Enrollment in distance
learning is growing at three times the pace of classroom-based programs (Christensen,
Aaron, & Clark, 2001). Although there are several different ways to define learning
styles, this study will utilize the Learning Styles associated with the VARK questionnaire
(http://www.vark-learn.com/english/index.asp ). Based on the VARK there are 4
different styles. A summary follows;
“V” refers to visual learners. Visual learners prefer the depiction of information in
maps, diagrams, charts, graphs, flow charts, labeled diagrams, symbolic arrows, circles,
hierarchies and other devices that instructors use to represent what could have been
presented in words.
“A” refers to auditory or aural learners. These students prefer to learn when
information is "heard or spoken."
“R” refers to students who prefer to read the written words
“K” refers to kinesthetic learners whose perceptual preference is related to the
use of experience and practice (simulated or real). Although such an experience may
invoke other modalities, the key is that people who prefer this mode can touch or feel
what they are learning,

17
“MM” refers to learners who are multimodal and can learn through many modes.
Definition of Terms
DISTANCE EDUCATION: A system and process that connects learners with distributed learning resources characterized by the following: 1) separation of place and/or time between instructor and learner, among learners, and/or between learners and learning resources, and 2) interaction between the learner and the instructor, among learners, and/or between learners and learning resources conducted through one or more media; use of electronic media is not necessarily required. (Accessed January 31, 2008 at http://www.ribghe.org/distance%20learning.pdf )
LEARNING STYLES: The way that each learner begins to concentrate on, process, absorb, and retain new and difficult information (Dunn and Dunn, 1992; 1993; 1999 accessed at: http://www.learningstyles.net/index.php?option=com_content&task=view&id=20&Itemid=70&lang=en on February 4, 2008).
COURSE MANAGEMENT SYSTEMS: computer software that facilitates Web-based distance education (Schlosser & Simonson, 2002).
VARK: The acronym VARK stands for Visual, Aural, Read/write, and Kinesthetic sensory modalities that are used for learning information. Fleming and Mills (1992) suggested four categories that seemed to reflect the experiences of the students and teachers. (http://www.vark-learn.com/english/page.asp?p=categories )
E-MODERATORS: The new generation of teachers and trainers who work with learners online.
ASYNCHRONOUS LEARNING NETWORKS (ALN): A form of distance learning in which the teacher and student are separated in both time and space. An ALN uses computer-networking technology for teaching and learning activities (Schlosser & Simonson, 2002).
VALIDITY: According the APA Standards (1985), the concept of validity refers to “the appropriateness, meaningfulness, and usefulness of specific inferences made from test scores” (Rothenberg & Hessiling, 1990).
NABP: National Association of Boards of Pharmacy
NAPLEX: North American Pharmacist Licensure Examination
SPSS: Statistical Package for the Social Sciences
ANOVA: Analysis of Variance. Statistical technique for determining the degree of difference or similarity between two or more groups of data. It is based on the comparison of the average value of a common component. (accessed at
18
http://www.businessdictionary.com/definition/analysis-of-variances-ANOVA.html on July 9, 2009)
T-TEST: A statistical test involving means of normal populations with unknown standard deviations

19
CHAPTER 2 REVIEW OF LITERATURE
To fulfill the purpose of this study, this chapter contains a review of the research
relevant to the origins of professional programs within distance education, as well as the
different learning styles and their pedagogical relationship to online learning.
Origins of Online Professional Education Programs
Distance education is not a new concept. However, what began in the 1800s as a
special form of education using nontraditional forms of delivery has evolved into a
complex form of education. Advancements in technology as well as wide spread
availability have triggered an increase in demand for distance learning. Through
advancements like the Internet, and faster, more affordable telecommunications
channels, distance education has been transformed into online education. Academic
institutions are devoting a large amount of resources to make this transition. Online
education is the fastest growing form of domestic and international education. Web-
based and web-enhanced courses are appearing in traditional programs that are now
racing to join the “any time, any place” educational frenzy (Jonnassen, 2004). In a time
where budget cuts in education funds are an everyday occurrence and physical space
limitations a reality, colleges and universities look at online learning as the solution to
overcome those barriers. Jonnassen (2004) reported an annual growth in Distance
learning programs enrollment of 41 percent. By 2006 Moloney & Oakley reported a 20%
annual growth in enrollment. Thirty percent of the programs are being developed to
meet the needs of adults who seek professional continuing education (Jonnassen,
2004). Today there are many institutions that run two different sections of the same

20
program, face-to-face and distance to provide education for on- and off-campus
students.
Quality of Online Professional Education Programs
The Sloan-C Consortium identified the “anytime, anyplace” notion, as well as the
cost-benefit ratio, as key components for this increase in demand. According to the
Sloan-C report, the enrollment growth is noticeable at all levels of higher education and
more than 59% of academic leaders report online as part of their long-term strategy.
Table 2-1 Five years of growth in Online Learning
Online Education is Critical to the Long-term Strategy of My Institution – Fall 2002 to Fall 2006
2002 2003 2004 2005 2006
Agree 48.80% 53.50% 56.00% 58.40% 59.10% Neutral 38.10% 33.70% 30.90% 27.40% 27.40% Disagree 13.10% 12.90% 13.10% 14.20% 13.50%
(from Online Nation: Five years of growth in Online Learning)
As the popularity of the online education grows, concern for its quality increases.
Accountability for online professional education programs grows as institutions continue
to compete for the vast online student populations. In 2004, the White House
representatives announced that it would establish an e-learning clearinghouse, making
it obvious that the lack of research in this area has political connotations (Allen &
Seaman, 2005). Since then, there have been many attempts to introduce policies and
standards to guarantee the quality of online programs. In many cases it is up to the
institution to regulate and police the quality of its online programs. According to
Amason (2007), there is either an absence of policies to regulate online education from
the state, consortia and institutional level, or a lack of funding for implementation when
the policy exists. This represents a problem at any institution but especially at large
institutions where quality control may be decentralized. Although the use of curriculum

21
committees is widely used in the academic world, there seems to be a large gap
between face-to-face course approval and the approval of its equivalent virtual version.
Further, approval for virtual courses does not seem to require the review and
endorsement of a curriculum committee. Another significant factor affecting the quality
of online education is the faculty workload and its relationship to their wiliness to engage
in new technology. Amason (2007) found no documentation associated to faculty
rewards or release time to learn about new technologies at the state and consortium
level. There is some evidence of faculty rewards at the institution level, but in many
cases it is up to the faculty member to acquire the requisite skills needed to effectively
adapt his/her course to an online environment. Many times the sacrifice is not worth the
reward, according to Howell, Williams, and Lindsay (2003) who reported “As long as
distance education contributions are not considered in tenure and promotion decisions .
. . many faculty members will be reluctant to participate in online courses”.
However, despite the adversities, the reputation of the quality of the online
education programs is on the rise. According to the Sloan-C report “Making the Grade”
published in 2006, most Chief Academic Officers believe that the quality of online
instruction is equal to or superior to that of face-to-face learning. In 2003, 57 percent of
academic leaders rated the learning outcomes in online education as the same or
superior to those in face-to-face. That number is now 62 percent, a small but noteworthy
increase. According to Allen and Seaman (2006), the proportion of educators who
believe that online learning outcomes are superior to those for face-to-face is still
relatively small but has grown by 4.8 percent since 2003 from 12.1 percent in 2003 to
16.9 in 2005.

22
College of Pharmacy PharmD Program
In order to provide educational opportunities for geographically bound students
and to increase the number of pharmacist in the state, a Southeastern University’s
College of Pharmacy created the Online PharmD program in 2002. This Southeastern
University’s College of Pharmacy has distance education sites located in Jacksonville,
Orlando, and St. Petersburg since the academic year 2002-2003. These campuses
accommodate 50-60 students at each site. Students receive instruction in pharmacy via
distance education technology. The Doctor of Pharmacy curriculum offered by faculty
on the Gainesville campus is reproduced in an asynchronous format for students at the
distance education campuses. Faculty at the distance education sites facilitate
discussion groups, administer examinations, answer questions, and provide instruction
as needed to supplement the distance education program. A support staff in student
affairs is available at each campus site” (From http://www.cop.ufl.edu/studaff/disted.htm
on February 2, 2008).
Students attending the College of Pharmacy professional program need to meet
the same admission requirements as the other students in the college. According to the
web site, the requirements are as follows;
Admission Requirements
1. Associate of Arts (AA) or higher degree (must complete general education requirements)
2. Completion of pre-professional course requirements, minimum pre-professional GPA of 2.5
3. Pharmacy College Admission Test (PCAT), minimum 50th percentile composite score
4. Foreign language required in high school (2 yrs), or college (8-10 cr), or TOEFL IBT score

23
5. Test of English as a Foreign Language (TOEFL) – if English is your second language
a. TOEFL (http://www.ets.org/toefl/) IBT version with a minimum composite score of 80, but 100 or higher is preferred. For each subject area, the following minimum score is required: Reading = 20+, Listening = 20+, Speaking = 25+, Writing = 23+
Submission of ALL application materials by the application deadline including:*
1. UF online application for admission – Select Entry Level - Professional PharmD 2. PharmCAS application – Submit official transcripts and PCAT scores 3. Two letters of recommendation (available through PharmCAS website) 4. Personal Profile & Essay (submit online through UF College of Pharmacy website) 5. Campus Ranking form (submit online through UF College of Pharmacy website)
*Only completed application files will be reviewed. Detailed application procedures
are available on the website.
Meeting all the requirements only guarantees that the application will be reviewed,
but admission into the program is very competitive. For example, in fall 2007, only 300
students out of 2000 applicants were admitted into the program. The Admission
Committee based its decisions on the following factors:
1. Pre-Professional Science/Math GPA, although the minimum GPA to apply is 2.5, in fall 2007 the average GPA for admitted students was 3.53
2. PCAT Pharmacy College Admissions Test, although the minimum score is 50% to be considered, in fall 2007 the averaged admitted student score was 82%.
In addition to the requirements mentioned in their website, a high demand also
contributed to the development of the online program to accommodate the non-
traditional students.
Learning Styles
Individuals have perceptual and processing strengths and weaknesses. In the
same way that students as individuals differ from each other on other dimensions, such
as personality, they also have their own unique strengths and preferences. From these

24
sets of preferences, a favored learning style develops. Some students prefer to work
with concrete information (facts, experimental data) while others are more comfortable
with abstractions (theories, symbolic information, mathematical model). Some are
partial to visual presentation of information; pictures, diagrams, flowcharts, schematics,
and others get more from verbal explanations. Some like to learn by trying things out
and seeing and analyzing what happens while others would rather reflect on things they
plan to do and understand as much as they can about them before actually attempting
them (Felder & Spurlin, 2005). Learning strategies are defined as, “any thoughts,
behaviors, beliefs or emotions that facilitate the acquisition, understanding or later
transfer of new knowledge and skills” (Weinstein, Husman, & Dierking, 2000, p. 727).
There are different conceptual models that govern learning styles and evaluating
the different models requires an understanding of their complexity. Most researchers
agree with the general assumption that no one style applies to all learners. Students
hold a preference or tendency to feel more comfortable with one of the styles. Learning
style models are usually divided into four categories. Although different models do not
follow the same naming convention when it comes to categories, they are usually
comparable when it comes to the description. For example, according to Felder and
Silverman, there are four different groups of learners: “sensing” or “intuitive” are those
learners who are more oriented towards facts and procedures, “visual” are those who
prefer visual representations, “active” describes learners who learn by trying things out
and “sequential” are those who are the linear thinkers. These four styles have parallel
categories in other models. For example, the VARK system has four equivalent
categories: visual, aural, read/write and kinesthetic. Out of the multiple models, the

25
College of Pharmacy at a Southeastern University selected the VARK from others, due
to its availability to the public. In addition to the VARK Learning system, the Learning
Style Inventory (LSI),Gregorc Learning Style Model, the Learning and Study Strategies
Inventory (LASSI), and the Learning Type Measure (LTM) will be described in this
chapter.
VARK
VARK is a questionnaire that provides users with a profile of their learning
preferences. These preferences are about the ways that they want to take-in and give-
out information. Accessed on February 4, 2008 from (http://www.vark-
learn.com/english/page.asp?p=faq)
The VARK categories
The acronym VARK stands for Visual, Aural, Read/write, and Kinesthetic sensory
modalities that are used for learning information. Fleming and Mills (1992) suggested
four categories that seemed to reflect the experiences of the students and teachers.
Although there is some overlap between categories, they are defined as follows;
Visual (V):
Preference for visual media includes the depiction of information in maps, spider
diagrams, charts, graphs, flow charts, labeled diagrams, and symbolic arrows, circles,
hierarchies and other devices, which instructors use to represent what could have been
presented in words. It could have been called Graphic (G) as that better explains what it
covers. It does NOT include movies, videos or PowerPoint. It does include designs,
whitespace, patterns, shapes and different illustrative formats that are used to highlight
and convey information. (http://www.vark-learn.com/english/page.asp?p=categories )

26
Aural / auditory (A)
This perceptual mode describes a preference for information that is "heard or
spoken." Students with this modality report that they learn best from lectures, tutorials,
tapes, group discussions, email, using mobile phones, speaking, web chat and talking
things through. It includes talking out loud, as well as talking to themselves. Often
people with this preference want to sort things out by speaking, rather than sorting
things out and then speak. (http://www.vark-learn.com/english/page.asp?p=categories )
Read/write (R)
This preference is for information that is displayed as words. Not surprisingly,
many academics have a strong preference for this modality. This preference
emphasizes text-based input and output - reading and writing in all its forms. People
who prefer this modality are often addicted to PowerPoint, the Internet, lists, filofaxes,
dictionaries, thesauri, quotations and words. (http://www.vark-
learn.com/english/page.asp?p=categories )
Kinesthetic (K)
By definition, this modality refers to the "perceptual preference related to the use
of experience and practice (simulated or real)." Although such an experience may
invoke other modalities, the key is that people who prefer this mode are connected to
reality, "either through concrete personal experiences, examples, practice or simulation"
[See Fleming & Mills, 1992, pp. 140-141]. It includes demonstrations, simulations,
videos and movies of "real" things, as well as case studies, practice and applications.
What about mixtures? multimodals (MM)
Life is multimodal. There are seldom instances where one mode is used, or is
sufficient, so we have a four-part VARK profile. That is why the VARK questionnaire

27
gives you four scores. Those who prefer many modes almost equally are of two types.
There are those who are context specific who choose a single mode to suit the occasion
or situation. There are others who are not satisfied until they have had input (or output)
in all of their preferred modes. They take longer to gather information from each mode
and, as a result, they often have a deeper and broader understanding. (http://www.vark-
learn.com/english/page.asp?p=categories )(VARK questionnaire appendix A)
The scores are represented in a 2 axes
Figure 2-1. VARK Learning Model (from Hawk and Shah)
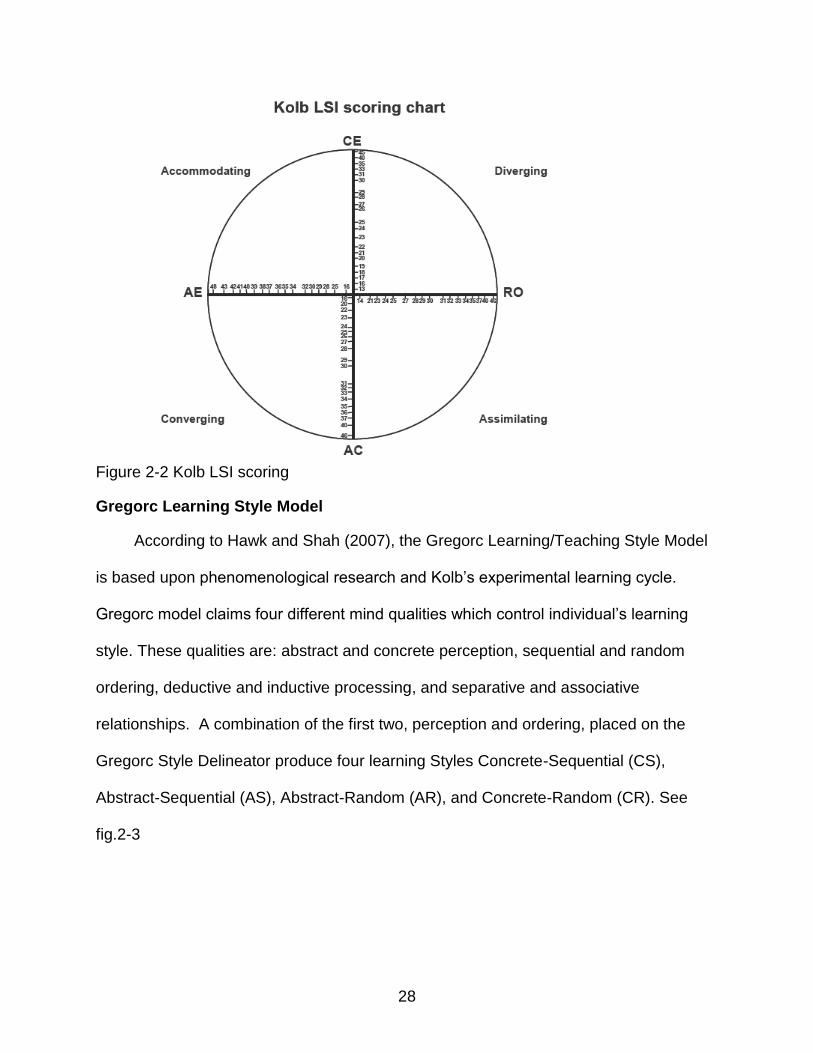
Learning Styles Inventory (LSI)
The LSI method is another method used to determine the preferred learning style
of College of Pharmacy students. The LSI was developed by Kolb and is based on
theoretical work by Piaget and Guilford related to intelligence, thinking, and creativity.
The learning styles model is similar in structure to Basadur’s creative problem-solving
model, although it emphasizes how learners absorb and deal with new information
(Adamcik, Hurley,& Erramousque,1996). As the VARK system, the LSI divides the
learners in four different groups representing preferred learning styles, feelings (CE),
watching and listening (RO), thinking (AC) and doing (AE). The preferences are scored
and mapped in two axes (see fig.2)
28
Figure 2-2 Kolb LSI scoring
Gregorc Learning Style Model
According to Hawk and Shah (2007), the Gregorc Learning/Teaching Style Model
is based upon phenomenological research and Kolb’s experimental learning cycle.
Gregorc model claims four different mind qualities which control individual’s learning
style. These qualities are: abstract and concrete perception, sequential and random
ordering, deductive and inductive processing, and separative and associative
relationships. A combination of the first two, perception and ordering, placed on the
Gregorc Style Delineator produce four learning Styles Concrete-Sequential (CS),
Abstract-Sequential (AS), Abstract-Random (AR), and Concrete-Random (CR). See
fig.2-3

29
Figure 2-3. Gregorc Style Delineator (from Hawk and Shah)
According Hawk and Shah (2007) the CS learner is described as a learner who
prefers direct, hands-on experience, wants order and a logical sequence to tasks, and
follows directions well. The AS learner is one who likes working with ideas and symbols,
is logical and sequential in thinking, and likes to focus on the task without distractions.
The AR learner focuses attention on the people and the surroundings, prefers
discussions and conversations that are wide ranging, and wants time to reflect on
experiences. Finally, the CR learner is experimental and a risk taker, likes to explore
unstructured problems, makes intuitive leaps in solving them, and uses trial and error to
work out solutions. Coffield, Mosoley,Hall, Eccleston (2004), after reviewing the
reliability and validity of the instrument suggested that the Gregorc Learning/Teaching
Style Model should not be used in education.
Learning and Study Strategies Inventory (LASSI)
Developed at the University of Texas at Austin by Claire E. Weinstein, Ann C.
Schulte, and David R. Palmer, according to Cano (2006), the Learning and Study
Strategies Inventory (LASSI) is a self-report instrument to assess learning styles which
is based on a general model of learning and cognition and on a model of strategic

30
learning. It is a 10 point scale, 80 item assessment of students’ awareness about and
use of learning and study strategies related to skill, will and self-regulation components
of strategic learning. The skill component of LASSI measures information processing,
selecting ideas, and testing strategies through processes related to identifying,
acquiring and constructing meaning for new information and how one prepares for and
demonstrates new knowledge on tests. The will component of LASSI measures
students’ receptivity to learning new information and their wiliness to exert the effort
necessary to successfully complete academic requirements. The Self-regulation
component measures how the students manage the whole learning process through
using their time effectively, focusing their attention and maintaining their concentration.
(http://www.hhpublishing.com/_assessments/LASSI/index.html ).
LASSI Scores 01 05 10 15 20 25 30 35 40 45 50 55 60 65 70 75 80 85 90 95 99
ANX ------------------------->
ATT --------------------------------->
CON ------------->
INP ------------------------------------->
MOT ------------------------->
SFT ----------------------------------------------------->
SMI --------------------------------------------->
STA --------------------------------->
TMT ----------------->
TST --------->
01 05 10 15 20 25 30 35 40 45 50 55 60 65 70 75 80 85 90 95 99
Figure.2-4. LASSI Scores
The LASSI has been used to assess abilities directly related to academic
performance of Pharmacy students, Lobb, Wilkin, McCaffrey, Wilson, and Bentley
(2006) reported that the results of the LASSI, Defining Issues Test (DIT) and Watson-
Glasser Critical Thinking Appraisal (WGCTA) didn’t appear to assess abilities directly

31
related to academic performance in students, but it may be useful in assessing other
attributes that are highly desirable for the practice of pharmacy. Melancon (2002),
reported reliability and validity scores within .03 of the alpha coefficient as reported in
the LASSI manual, but it also reported that the LASSI doesn’t measure the 10 scales
described in the manual. These findings were in agreement with previous research
results reported by Deming, Valeri-Gold, and Idleman (1994).
Benefits of Learning Styles Research to Students and Instructors
As the student body varies in diversity, so do the students’ learning styles. All the
research and methods described in this study are looking for different approaches to
successfully develop or modify curricula to accommodate these learning styles and
maximize the learning experience. Not only can the curriculum accommodate learning
styles but, according to Hein & Bundy (1999), any learning style can be adapted for use
with any population. Performance Learning System reports a series of benefits
associated with the research and study of learning styles.
Tailor your lesson plans to be more lively and interactive.
Create an interesting and motivating classroom.
Reach peak performance by matching your teaching and learning styles to those of your students.
Teach students about their learning styles.
Develop effective classroom management skills.
Motivate students according to their interests.
However, Coffield, Mosoley,Hall, Eccleston (2004), warned us about the dangers
in commending detailed strategies to practitioners because the theories and
instruments are not equally useful and no consensus about the recommendations.

32
During the 2003-04 academic year, approximately two million learners were
engaged in higher education via Asynchronous Learning Networks (ALN), and online
enrollments are expected to grow at a 20% annual rate during the next few years
(Moloney & Oakley, 2006). Despite this increase in popularity, there are still questions
related to the adequacy of online education for different students. In 2003, the College
of Pharmacy at the Southeastern University created their own online PharmD program.
It is obvious that just by reading a passage; some students don’t necessarily have
understanding and knowledge of the material. Therefore, if students are asked to give
their interpretation of a page after they are finished reading it, a wide range of
understanding will be their answers. This wide range exists because people absorb
information in different ways.
In 2003, Pungente, Wasan, and Moffett used learning styles to evaluate first-year
pharmacy student’s preferences toward different activities associated with the problem-
based learning approach. They found a relationship between the different learning
styles and the preferences for activities associated with problem-based learning
approach. However, their conclusion calls for future efforts to link the individual learning
students’ preferences and their academic success.
33
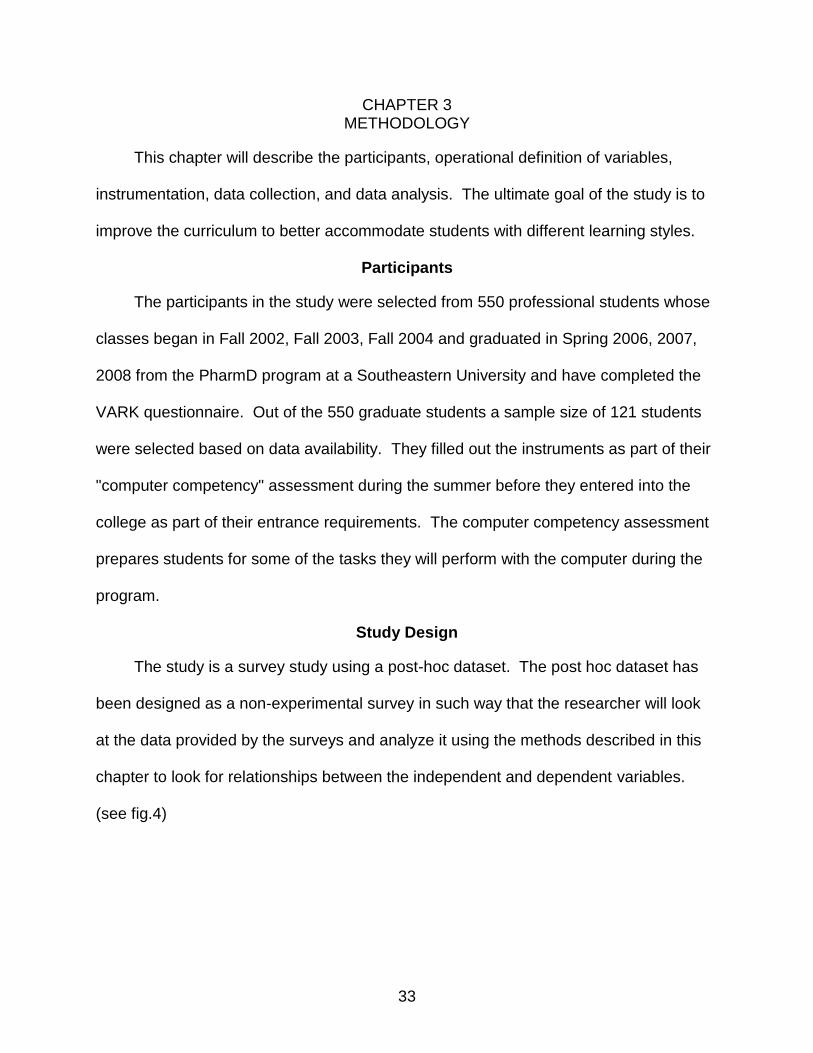
CHAPTER 3 METHODOLOGY
This chapter will describe the participants, operational definition of variables,
instrumentation, data collection, and data analysis. The ultimate goal of the study is to
improve the curriculum to better accommodate students with different learning styles.
Participants
The participants in the study were selected from 550 professional students whose
classes began in Fall 2002, Fall 2003, Fall 2004 and graduated in Spring 2006, 2007,
2008 from the PharmD program at a Southeastern University and have completed the
VARK questionnaire. Out of the 550 graduate students a sample size of 121 students
were selected based on data availability. They filled out the instruments as part of their
"computer competency" assessment during the summer before they entered into the
college as part of their entrance requirements. The computer competency assessment
prepares students for some of the tasks they will perform with the computer during the
program.
Study Design
The study is a survey study using a post-hoc dataset. The post hoc dataset has
been designed as a non-experimental survey in such way that the researcher will look
at the data provided by the surveys and analyze it using the methods described in this
chapter to look for relationships between the independent and dependent variables.
(see fig.4)

34
Demographics
GPA (Admission)
Gender
Race/Ethnicity
Learning Style
(Vark)
Instructional Delivery
On line
Internal (Program
Performance)
Grades (GPA)
External
Board Exam Results
Draft 1
Factors impacting performance in online education
Figure. 3-1. Factors impacting performance in online education
Operational Definition of Variables
Instrumentation
As mentioned in the literature review there are many instruments to measure and
define the student’s preferred learning style (LSI, LASS, LTI, VARK) The PharmD
program at a Southeastern University selected the VARK questionnaire to collect data
about students’ learning styles. This 16 question instrument provides information about
the ways that students take-in and give-out information, and creates a profile of their
learning preferences.
The VARK questionnaire is a sensory model created as an extension of the earlier
neuro-linguistic model by Neil D. Fleming and Charles C. Bonwell. Neil D. Fleming has
over forty years of experience in education, while Charles C. Bonwell directed for over
five years Centers for Teaching and Learning at Saint Louis College of Pharmacy and is
an instructional consultant and author among other professional activities.

35
The acronym VARK stands for Visual, Aural, Read/write, and Kinesthetic sensory
modalities that are used for learning information. Fleming and Mills (1992) suggested
four categories that seemed to reflect the experiences of the students and teachers.
The VARK questionnaire was administered to students online with specific
instructions following the guidelines published by their creators. Fleming and Bonwell
suggest advising students to make a selection (a, b, c or d) for each question, but allow
them to omit a question or choose more than one option if they want to. In order to
avoid being biased to any particular answer, additional information about specific
questions was avoided. Students were encouraged to choose more than one response
if they think the context is not clear.
Validity and Reliability
From his own database, Fleming (2007) reports that, with a population of over
44,000, 39.1% prefer a single learning style, and 59.6% have multimodal learning
styles. To answer the question about validity, Fleming (2007) reports that the strength
of VARK is the fact that his questions and options are drawn from real life and that
59.4% of the participants said that the results match their own perceptions. However,
Dr. Marilla Svinicki at the University of Texas at Austin, Dr. Leite and Dr. Shi at the
University of Florida conducted a statistical research to report the statistical validity of
VARK. According to Svinicki, Leite and Shi (2008) the popularity of the VARK comes
from its face validity, simplicity and practicality. But the authors also indicated that the
VARK has not yet received a comprehensive validation, and it should be used with
caution when using it as a predictor.
36
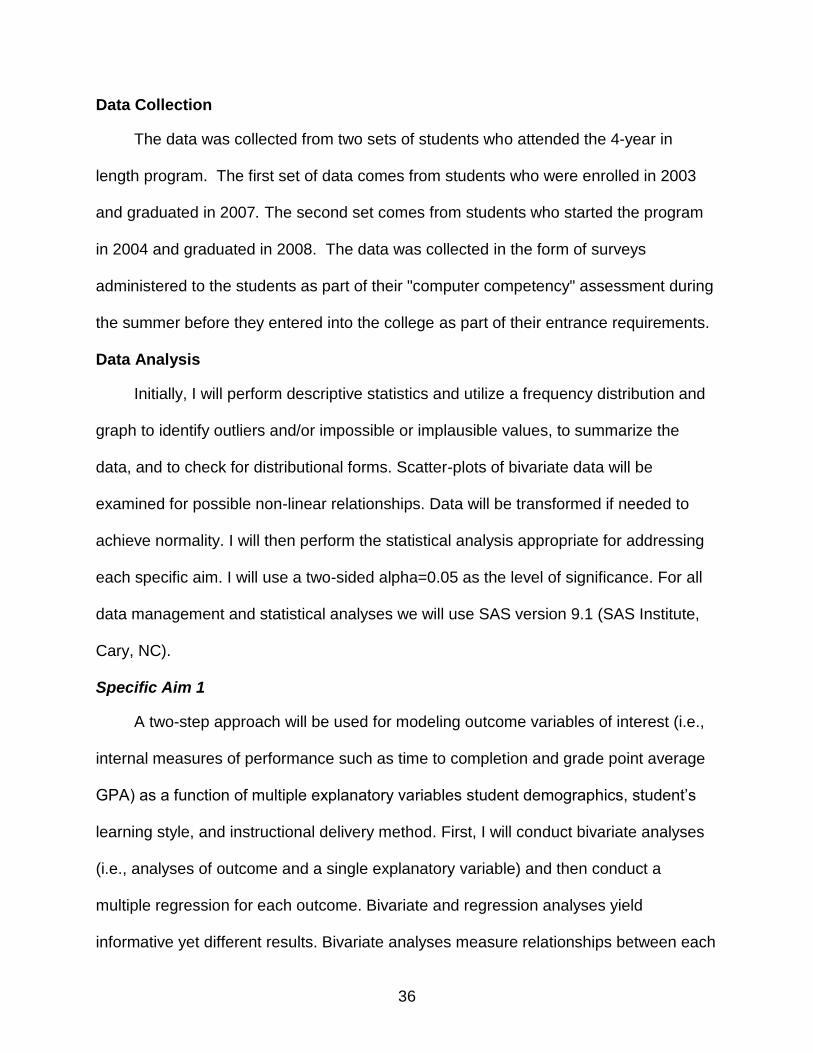
Data Collection
The data was collected from two sets of students who attended the 4-year in
length program. The first set of data comes from students who were enrolled in 2003
and graduated in 2007. The second set comes from students who started the program
in 2004 and graduated in 2008. The data was collected in the form of surveys
administered to the students as part of their "computer competency" assessment during
the summer before they entered into the college as part of their entrance requirements.
Data Analysis
Initially, I will perform descriptive statistics and utilize a frequency distribution and
graph to identify outliers and/or impossible or implausible values, to summarize the
data, and to check for distributional forms. Scatter-plots of bivariate data will be
examined for possible non-linear relationships. Data will be transformed if needed to
achieve normality. I will then perform the statistical analysis appropriate for addressing
each specific aim. I will use a two-sided alpha=0.05 as the level of significance. For all
data management and statistical analyses we will use SAS version 9.1 (SAS Institute,
Cary, NC).
Specific Aim 1
A two-step approach will be used for modeling outcome variables of interest (i.e.,
internal measures of performance such as time to completion and grade point average
GPA) as a function of multiple explanatory variables student demographics, student’s
learning style, and instructional delivery method. First, I will conduct bivariate analyses
(i.e., analyses of outcome and a single explanatory variable) and then conduct a
multiple regression for each outcome. Bivariate and regression analyses yield
informative yet different results. Bivariate analyses measure relationships between each
37
explanatory variable and outcome; multiple regression analyses show significant
relationships for explanatory variables after adjustment for other variables in the model.
Specific Aim 2
A two-step approach will be used for modeling outcome variables of interest (i.e.,
external measures of performance such as board exam result, and employment) as a
function of multiple explanatory variables: student demographics, student’s learning
style, instructional delivery method, and internal performance. First, I will conduct
bivariate analyses (i.e., analyses of outcome and a single explanatory variable) and
then conduct a multiple logistic regression for each outcome. Bivariate and regression
analyses yield informative yet different results. Bivariate analyses measure relationships
between each explanatory variable and outcome; multiple logistic regression analyses
show significant relationships for explanatory variables after adjustment for other
variables in the model.

38
CHAPTER 4 FINDINGS
Two different analyses were used to analyze the data, ANOVA and the T-test. The
T-test was selected for equality of means. It is a 2-tailed test of significance. By 2 tailed,
it is testing if the mean of one group is higher or lower. It is testing in both directions as
opposed to only one direction (one tailed).
Frequencies for the Variables of Interest
The frequencies for variables of interest were evaluated for all the available data:
gender, race, age, NABP, GPA and VARK groups (visual, aural, read, kinesthetic and
multimodal),
The analysis of the population shows that our sample is predominantly female
(85%), white (90%) between the ages 21-25 (79%).
Table 4-1.Frequencies
Gender
Frequency Percent Valid Percent
Cumulative
Percent
Valid Male 36 29.8 29.8 29.8
Female 85 70.2 70.2 100.0
Total 121 100.0 100.0
Table 4-2 Race
Frequency Percent Valid Percent
Cumulative
Percent
Valid Non-White 31 25.6 25.6 25.6
White 90 74.4 74.4 100.0
Total 121 100.0 100.0

39
Table 4-3 Age
Frequency Percent Valid Percent
Cumulative
Percent
Valid 20 1 .8 .8 .8
21 11 9.1 9.1 9.9
22 30 24.8 24.8 34.7
23 25 20.7 20.7 55.4
24 19 15.7 15.7 71.1
25 11 9.1 9.1 80.2
26 3 2.5 2.5 82.6
27 3 2.5 2.5 85.1
28 3 2.5 2.5 87.6
29 3 2.5 2.5 90.1
30 1 .8 .8 90.9
31 1 .8 .8 91.7
33 2 1.7 1.7 93.4
34 2 1.7 1.7 95.0
35 1 .8 .8 95.9
36 1 .8 .8 96.7
37 1 .8 .8 97.5
38 1 .8 .8 98.3
44 1 .8 .8 99.2
48 1 .8 .8 100.0
Total 121 100.0 100.0

40
Table 4-4 GPA
Frequency Percent Valid Percent
Cumulative
Percent
Valid 2.80 1 .8 .8 .8
2.90 1 .8 .8 1.7
2.91 4 3.3 3.3 5.0
2.97 1 .8 .8 5.8
2.98 1 .8 .8 6.6
2.99 3 2.5 2.5 9.1
3.00 1 .8 .8 9.9
3.01 1 .8 .8 10.7
3.02 2 1.7 1.7 12.4
3.06 1 .8 .8 13.2
3.09 2 1.7 1.7 14.9
3.10 1 .8 .8 15.7
3.12 3 2.5 2.5 18.2
3.14 2 1.7 1.7 19.8
3.15 1 .8 .8 20.7
3.17 1 .8 .8 21.5
3.18 3 2.5 2.5 24.0
3.20 3 2.5 2.5 26.4
3.25 2 1.7 1.7 28.1
3.26 2 1.7 1.7 29.8
3.27 1 .8 .8 30.6
3.28 2 1.7 1.7 32.2
3.30 2 1.7 1.7 33.9
3.33 1 .8 .8 34.7
3.34 1 .8 .8 35.5
3.36 3 2.5 2.5 38.0
3.39 1 .8 .8 38.8
3.42 1 .8 .8 39.7
3.43 1 .8 .8 40.5
3.45 2 1.7 1.7 42.1
3.46 2 1.7 1.7 43.8
3.49 4 3.3 3.3 47.1
3.52 1 .8 .8 47.9
3.53 1 .8 .8 48.8
3.54 1 .8 .8 49.6

41
Table 4-4. continued
Frequency Percent Valid Percent
Cumulative
Percent
3.55 3 2.5 2.5 52.1
3.56 1 .8 .8 52.9
3.57 1 .8 .8 53.7
3.58 1 .8 .8 54.5
3.60 2 1.7 1.7 56.2
3.61 3 2.5 2.5 58.7
3.62 4 3.3 3.3 62.0
3.63 4 3.3 3.3 65.3
3.64 3 2.5 2.5 67.8
3.65 2 1.7 1.7 69.4
3.66 1 .8 .8 70.2
3.67 1 .8 .8 71.1
3.69 1 .8 .8 71.9
3.70 1 .8 .8 72.7
3.71 4 3.3 3.3 76.0
3.73 1 .8 .8 76.9
3.76 1 .8 .8 77.7
3.77 1 .8 .8 78.5
3.78 3 2.5 2.5 81.0
3.82 2 1.7 1.7 82.6
3.83 2 1.7 1.7 84.3
3.86 2 1.7 1.7 86.0
3.87 1 .8 .8 86.8
3.88 2 1.7 1.7 88.4
3.89 1 .8 .8 89.3
3.90 1 .8 .8 90.1
3.91 2 1.7 1.7 91.7
3.92 1 .8 .8 92.6
3.93 2 1.7 1.7 94.2
4.00 7 5.8 5.8 100.0
Total 121 100.0 100.0

42
Table 4-5 Table 4-5. NABP Score
Frequency Percent Valid Percent
Cumulative
Percent
Valid 71 1 .8 .8 .8
80 1 .8 .8 1.7
81 1 .8 .8 2.5
91 2 1.7 1.7 4.1
93 2 1.7 1.7 5.8
94 2 1.7 1.7 7.4
95 1 .8 .8 8.3
96 2 1.7 1.7 9.9
97 1 .8 .8 10.7
98 1 .8 .8 11.6
101 1 .8 .8 12.4
103 1 .8 .8 13.2
106 2 1.7 1.7 14.9
107 4 3.3 3.3 18.2
108 2 1.7 1.7 19.8
109 1 .8 .8 20.7
110 2 1.7 1.7 22.3
111 2 1.7 1.7 24.0
112 1 .8 .8 24.8
113 2 1.7 1.7 26.4
115 2 1.7 1.7 28.1
116 5 4.1 4.1 32.2
117 1 .8 .8 33.1
118 4 3.3 3.3 36.4
119 2 1.7 1.7 38.0
120 2 1.7 1.7 39.7
121 1 .8 .8 40.5
122 4 3.3 3.3 43.8
123 5 4.1 4.1 47.9
124 2 1.7 1.7 49.6
125 1 .8 .8 50.4
126 4 3.3 3.3 53.7
127 4 3.3 3.3 57.0
128 3 2.5 2.5 59.5
129 2 1.7 1.7 61.2

43
Table 4-5. continued
Frequency Percent Valid Percent
Cumulative
Percent
130 4 3.3 3.3 64.5
131 6 5.0 5.0 69.4
132 6 5.0 5.0 74.4
133 3 2.5 2.5 76.9
134 4 3.3 3.3 80.2
135 3 2.5 2.5 82.6
136 9 7.4 7.4 90.1
137 5 4.1 4.1 94.2
138 2 1.7 1.7 95.9
141 4 3.3 3.3 99.2
142 1 .8 .8 100.0
Total 121 100.0 100.0
Table 4-6 Visual or Not-Visual
Frequency Percent Valid Percent
Cumulative
Percent
Valid Not Visual 38 31.4 31.4 31.4
Visual 83 68.6 68.6 100.0
Total 121 100.0 100.0
Table 4-7 Aural or Not-Aural
Frequency Percent Valid Percent
Cumulative
Percent
Valid Not Aural 54 44.6 44.6 44.6
Aural 67 55.4 55.4 100.0
Total 121 100.0 100.0
Table 4-8 Read or Not-Read
Frequency Percent Valid Percent
Cumulative
Percent
Valid Not Read/Write 44 36.4 36.4 36.4
Read/Write 77 63.6 63.6 100.0
Total 121 100.0 100.0

44
Table 4-9 Kinesthetic or Not-Kinesthetic
Frequency Percent Valid Percent
Cumulative
Percent
Valid Not
Kinesthetic
100 82.6 82.6 82.6
Kinesthetic 21 17.4 17.4 100.0
Total 121 100.0 100.0
Table 4-10 MultiModal or Not-MultiModal
Frequency Percent Valid Percent
Cumulative
Percent
Valid Not Multimodal 57 47.1 47.1 47.1
Multimodal 64 52.9 52.9 100.0
Total 121 100.0 100.0
H0: There will be no relationship between the students’ demographics and their grade
point average. H0: There will be no relationship between the students’ demographics and their board
exam results.
1. Correlations –
Correlations are used to find if there is a relationship between student
demographics and GPA & NABP exam results
The relationship between age and GPA is positively correlated. As age increases
so does GPA. It is not strong at .172 but is marginally statistically significant, p = .059.
There is a negative correlation (relationship) between age and NABP score. Age
and NABP go in opposite directions, as age increases NABP scores decrease. It is a
weak correlation at -.054, and is not statistically significant. Ideally, a score of .7 and
higher is desired

45
Table 4-11 Correlations
age GPA
age Pearson Correlation 1 .172
Sig. (2-tailed) .059
N 121 121
GPA Pearson Correlation .172 1
Sig. (2-tailed) .059
N 121 121
Table 4-12 Correlations
age NABP Score
Age Pearson Correlation 1 -.054
Sig. (2-tailed) .560
N 121 121
NABP Score Pearson Correlation -.054 1
Sig. (2-tailed) .560
N 121 121
2. Oneway Analysis of Variance (ANOVA) and T-Test
Female and Male comparison on NABP and GPA
The descriptive breaks down the NABP & GPA by gender, NABP scores for males
versus females and GPA by males versus females. In our sample, female students had
higher NABP scores and slightly higher GPA (higher by .0058) than their counterpart
male students.
The test of Homogeneity of Variance analyzes the equality of variances in the 2
groups regarding NABP scores and GPAs are equal, a requirement of the ANOVA.
They are not significantly different.

46
Table 4-12 Descriptives
N Mean Std. Deviation Std. Error
NABP Score Male 36 119.50 15.801 2.634
Female 85 122.05 14.607 1.584
Total 121 121.29 14.951 1.359
GPA Male 36 3.4783 .33674 .05612
Female 85 3.4841 .31664 .03434
Total 121 3.4824 .32135 .02921
Table 4-13 Descriptives
95% Confidence Interval for
Mean
Lower Bound Upper Bound Minimum Maximum
NABP Score Male 114.15 124.85 71 137
Female 118.90 125.20 80 142
Total 118.60 123.98 71 142
GPA Male 3.3644 3.5923 2.80 4.00
Female 3.4158 3.5524 2.91 4.00
Total 3.4246 3.5402 2.80 4.00
Table 4-14 Test of Homogeneity of Variances
Levene Statistic df1 df2 Sig.
NABP Score .321 1 119 .572
GPA .470 1 119 .494
The following table shows the results for two ANOVA test: A first test of the null
hypothesis that there is not a relationship between gender and NABP, and a second
ANOVA test of the null hypothesis that there is no relationship between gender and
GPA.

47
There was not a statistically significant difference in the mean NABP scores
between females and males. Therefore, the null hypothesis HO is accepted. Gender
does not influence NABP scores.
There was not a statistically significant difference in the mean GPAs between
females and males. The null hypothesis HO: There is no relationship between gender
and GPA is accepted. Gender does not influence GPA.
Table 4-15 ANOVA
Sum of
Squares Df Mean Square F Sig.
NABP Score Between Groups 164.064 1 164.064 .732 .394
Within Groups 26660.812 119 224.040
Total 26824.876 120
GPA Between Groups .001 1 .001 .008 .928
Within Groups 12.391 119 .104
Total 12.392 120
White and Non White Comparison on NABP and GPA
Oneway Analysis of Variance (ANOVA)
The descriptive statistics present the NABP & GPA by race, NABP scores for
whites versus non whites and GPA by whites versus non whites.
The descriptive data shows that Whites (120.84) had a lower mean NABP than
non-whites (122.58) and Non-whites (3.50) had a higher GPA than whites (3.48)
The Test of Homogeneity of Variances tests for significant difference in the
variances in scores between the two groups. There was not a statistically significant
difference in the mean NABP scores between whites and non-whites. Therefore, the
null hypothesis is accepted, race does not influence NABP scores.

48
Table 4-16 Descriptives
N Mean Std. Deviation Std. Error
NABP Score Non-White 31 122.58 16.413 2.948
White 90 120.84 14.485 1.527
Total 121 121.29 14.951 1.359
GPA Non-White 31 3.5013 .33910 .06090
White 90 3.4759 .31671 .03338
Total 121 3.4824 .32135 .02921
Table 4-17 Descriptives
95% Confidence Interval for
Mean
Lower Bound Upper Bound Minimum Maximum
NABP Score Non-White 116.56 128.60 80 142
White 117.81 123.88 71 141
Total 118.60 123.98 71 142
GPA Non-White 3.3769 3.6257 2.91 4.00
White 3.4096 3.5422 2.80 4.00
Total 3.4246 3.5402 2.80 4.00
Table 4-18 Test of Homogeneity of Variances
Levene Statistic df1 df2 Sig.
NABP Score .833 1 119 .363
GPA .264 1 119 .608
There was not a statistically significant difference in the mean GPAs between
whites and non-whites. Thus the null hypothesis, there is no relationship between race
and GPA, is accepted. Race does not influence GPA.

49
Table 4-19 ANOVA
Sum of
Squares df Mean Square F Sig.
NABP Score Between Groups 69.505 1 69.505 .309 .579
Within Groups 26755.371 119 224.835
Total 26824.876 120
GPA Between Groups .015 1 .015 .143 .706
Within Groups 12.377 119 .104
Total 12.392 120
Visual and Non Visual Learning Styles comparison on NABP and GPA
Oneway Analysis of Variance (ANOVA)
The descriptive statistics present the NABP & GPA by preferred learning style –
visual learning style versus those who do not prefer the visual learning style.
This tests the null hypothesis that there is not a relationship between preference or
no preference for Visual learning style and NABP. There is not a statistically significant
difference in the mean NABP scores between those who preferred a Visual learning
style and those who did not prefer a Visual learning style. As a result the null hypothesis
is accepted, preference or not for a Visual learning style does not influence NABP
scores.
Table 4-20 Descriptives
N Mean Std. Deviation Std. Error
NABP Score Not Visual 38 122.03 15.136 2.455
Visual 83 120.95 14.946 1.641
Total 121 121.29 14.951 1.359
GPA Not Visual 38 3.4508 .31611 .05128
Visual 83 3.4969 .32458 .03563
Total 121 3.4824 .32135 .02921

50
Table 4-21 Descriptives
95% Confidence Interval for
Mean
Lower Bound Upper Bound Minimum Maximum
NABP Score Not Visual 117.05 127.00 71 141
Visual 117.69 124.22 80 142
Total 118.60 123.98 71 142
GPA Not Visual 3.3469 3.5547 2.90 3.91
Visual 3.4260 3.5677 2.80 4.00
Total 3.4246 3.5402 2.80 4.00
Table 4-22 Test of Homogeneity of Variances
Levene Statistic df1 df2 Sig.
NABP Score .663 1 119 .417
GPA .117 1 119 .733
This tests the null hypothesis that there is not a relationship between preference or
no preference for Visual learning style and GPA. There was not a statistically significant
difference in the mean GPA between those who preferred a Visual learning style and
those who did not prefer a Visual learning style. The null hypothesis, preference or not
for a Visual learning style does not influence GPA, is accepted.
Table 4-23 ANOVA
Sum of
Squares df Mean Square F Sig.
NABP Score Between Groups 30.095 1 30.095 .134 .715
Within Groups 26794.781 119 225.166
Total 26824.876 120
GPA Between Groups .055 1 .055 .534 .466
Within Groups 12.336 119 .104
Total 12.392 120

51
Aural and Non Aural Learning Style comparison on NABP and GPA
Oneway Analysis of Variance (ANOVA)
Students who preferred the Aural learning style had a 0.21 lower mean NABP
score than those who did not prefer the Aural learning style. The reverse was true for
GPA. Students who preferred the Aural learning style had a 0.09 higher mean GPA than
those who did not prefer the Aural learning style. Mean differences were very small in
both areas.
Table 4-24 Descriptives
N Mean Std. Deviation Std. Error
NABP Score Not Aural 54 121.41 15.315 2.084
Aural 67 121.19 14.767 1.804
Total 121 121.29 14.951 1.359
GPA Not Aural 54 3.4328 .32825 .04467
Aural 67 3.5224 .31239 .03816
Total 121 3.4824 .32135 .02921
Table 4-25 Descriptives
95% Confidence Interval for
Mean
Lower Bound Upper Bound Minimum Maximum
NABP Score Not Aural 117.23 125.59 71 142
Aural 117.59 124.80 80 141
Total 118.60 123.98 71 142
GPA Not Aural 3.3432 3.5224 2.80 4.00
Aural 3.4462 3.5986 2.91 4.00
Total 3.4246 3.5402 2.80 4.00

52
Table 4-26 Test of Homogeneity of Variances
Levene Statistic df1 df2 Sig.
NABP Score .201 1 119 .655
GPA .154 1 119 .696
There was no significant differences were found in NABP or GPA values between
students who preferred the Aural learning style versus those who did not prefer the
Aural learning style.
This tests the null hypothesis that there is not a relationship between preference or
no preference for Aural learning style and NABP. There was not a statistically significant
difference in the mean NABP scores between those who preferred an Aural learning
style and those who did not prefer an Aural learning style. Accept the null hypothesis,
preference or not for an Aural learning style does not influence NABP scores.
This tests the null hypothesis that there is not a relationship between preference or
no preference for Aural learning style and GPA. There was not a statistically significant
difference in the mean GPA between those who preferred an Aural learning style and
those who did not prefer a Aural learning style. Accept the null hypothesis, preference
or not for an Aural learning style does not influence GPA.
Table 4-27 ANOVA
Sum of
Squares df Mean Square F Sig.
NABP Score Between Groups 1.361 1 1.361 .006 .938
Within Groups 26823.515 119 225.408
Total 26824.876 120
GPA Between Groups .240 1 .240 2.351 .128
Within Groups 12.152 119 .102
Total 12.392 120

53
Read/Write and non Read/Write Learning Styles comparison on NABP and GPA
Oneway Analysis of Variance (ANOVA)
Students who did not prefer the Read/Write learning style had a higher mean
NABP score than those who prefer the Read/Write learning style. The reverse was true
for GPA. Students who preferred the Read/Write learning style had a 0.08 higher mean
GPA than those who did not prefer the Read/Write learning style. Mean differences
were very small in both areas.
Table 4-28 Descriptives
N Mean Std. Deviation Std. Error
NABP Score Not Read/Write 44 124.59 12.646 1.906
Read/Write 77 119.40 15.892 1.811
Total 121 121.29 14.951 1.359
GPA Not Read/Write 44 3.4318 .31161 .04698
Read/Write 77 3.5113 .32524 .03706
Total 121 3.4824 .32135 .02921
Table 4-29 Descriptives
95% Confidence Interval for
Mean
Lower Bound Upper Bound Minimum Maximum
NABP
Score
Not
Read/Write
120.75 128.44 91 142
Read/Write 115.80 123.01 71 141
Total 118.60 123.98 71 142
GPA Not
Read/Write
3.3371 3.5266 2.80 4.00
Read/Write 3.4375 3.5851 2.90 4.00
Total 3.4246 3.5402 2.80 4.00

54
Table 4-30 Test of Homogeneity of Variances
Levene Statistic df1 df2 Sig.
NABP Score 2.701 1 119 .103
GPA .096 1 119 .757
Students who preferred a Read/Write learning style had a lower mean NABP
score than students who did not prefer a Read/Write learning style. However, the
difference between mean values was not statistically significant. The difference
between mean NABP values was marginally statistically significant at p = .066 level.
The null hypothesis HO: there is no relationship between preferring the Read/Write
learning style and not preferring the Read/Write learning style is accepted.
Students who preferred a Read/Write learning style had a higher mean GPA than
students who did not prefer a Read/Write learning style. However, the difference
between mean values was not statistically significant. The null hypothesis is accepted.
There is no relationship between students who preferred a Red/Write learning style and
their GPA.
Table 4-31 ANOVA
Sum of
Squares df Mean Square F Sig.
NABP Score Between Groups 753.720 1 753.720 3.440 .066
Within Groups 26071.156 119 219.085
Total 26824.876 120
GPA Between Groups .177 1 .177 1.723 .192
Within Groups 12.215 119 .103
Total 12.392 120
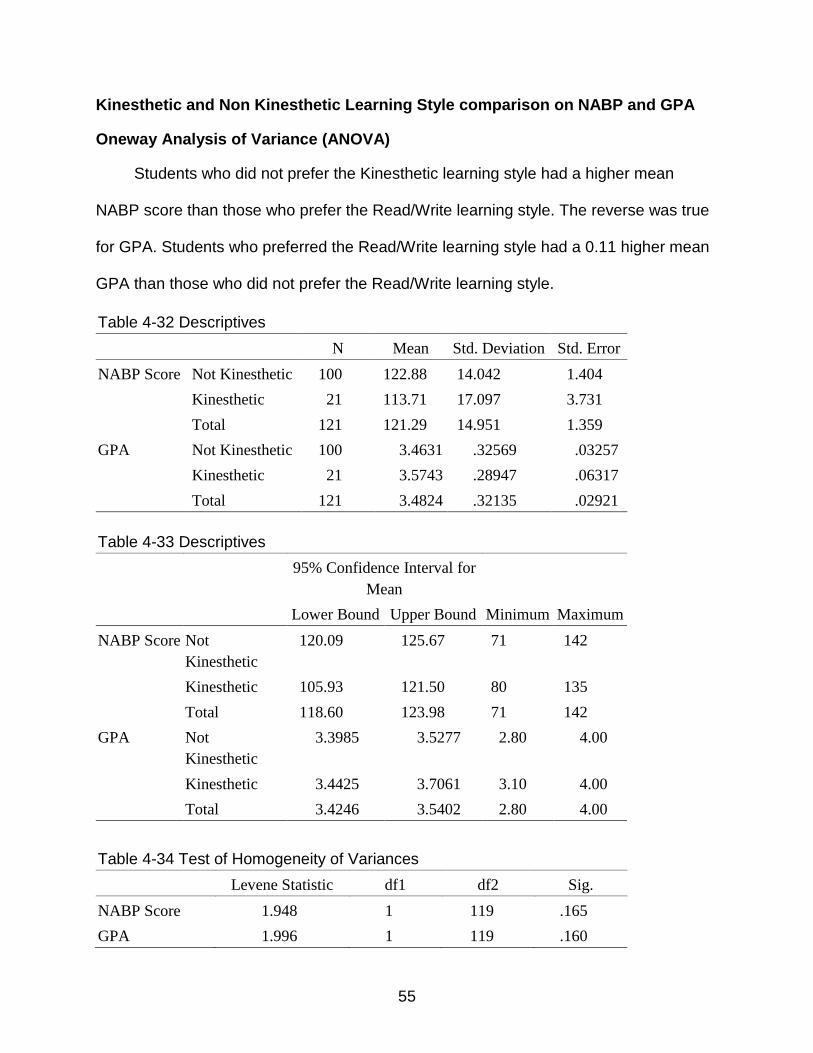
55
Kinesthetic and Non Kinesthetic Learning Style comparison on NABP and GPA
Oneway Analysis of Variance (ANOVA)
Students who did not prefer the Kinesthetic learning style had a higher mean
NABP score than those who prefer the Read/Write learning style. The reverse was true
for GPA. Students who preferred the Read/Write learning style had a 0.11 higher mean
GPA than those who did not prefer the Read/Write learning style.
Table 4-32 Descriptives
N Mean Std. Deviation Std. Error
NABP Score Not Kinesthetic 100 122.88 14.042 1.404
Kinesthetic 21 113.71 17.097 3.731
Total 121 121.29 14.951 1.359
GPA Not Kinesthetic 100 3.4631 .32569 .03257
Kinesthetic 21 3.5743 .28947 .06317
Total 121 3.4824 .32135 .02921
Table 4-33 Descriptives
95% Confidence Interval for
Mean
Lower Bound Upper Bound Minimum Maximum
NABP Score Not
Kinesthetic
120.09 125.67 71 142
Kinesthetic 105.93 121.50 80 135
Total 118.60 123.98 71 142
GPA Not
Kinesthetic
3.3985 3.5277 2.80 4.00
Kinesthetic 3.4425 3.7061 3.10 4.00
Total 3.4246 3.5402 2.80 4.00
Table 4-34 Test of Homogeneity of Variances
Levene Statistic df1 df2 Sig.
NABP Score 1.948 1 119 .165
GPA 1.996 1 119 .160

56
Students who did not prefer a Kinesthetic learning style had a higher mean NABP
score than students who preferred a Kinesthetic learning style. The difference between
mean NABP values was statistically significant at p = .01 level. Therefore reject the null
hypothesis that there is no difference in NABP scores between students who prefer a
Kinesthetic learning style and those who do not prefer a Kinesthetic learning style.
Students who prefer a Kinesthetic learning style had a higher mean GPA than
students who did not prefer a Kinesthetic learning style. However, the difference
between mean values was not statistically significant. Accept the null hypothesis that
there is no difference in mean GPAs between students who prefer a Kinesthetic
learning style and students who did not prefer a Kinesthetic learning style.
Table 4-35 ANOVA
Sum of
Squares Df Mean Square F Sig.
NABP Score Between Groups 1458.030 1 1458.030 6.840 .010
Within Groups 25366.846 119 213.167
Total 26824.876 120
GPA Between Groups .215 1 .215 2.097 .150
Within Groups 12.177 119 .102
Total 12.392 120
Multi-Modal and Non Multi-Modal comparison on NABP and GPA
Oneway Analysis Of Variance (Anova)
Students who preferred a Multi-modal learning style had a lower mean NABP
score than students who did not prefer a Multi-modal learning style but a higher mean
GPA.

57
Table 4-36 Descriptives
N Mean Std. Deviation Std. Error
NABP Score
Not Multimodal 57 122.63 14.630 1.938
Multimodal 64 120.09 15.247 1.906
Total 121 121.29 14.951 1.359
GPA Not Multimodal 57 3.4230 .30463 .04035
Multimodal 64 3.5353 .32888 .04111
Total 121 3.4824 .32135 .02921
Table 4-37 Descriptives
95% Confidence Interval for
Mean
Lower Bound Upper Bound Minimum Maximum
NABP Score Not
Multimodal
118.75 126.51 71 142
Multimodal 116.29 123.90 80 141
Total 118.60 123.98 71 142
GPA Not
Multimodal
3.3422 3.5038 2.80 3.92
Multimodal 3.4532 3.6175 2.91 4.00
Total 3.4246 3.5402 2.80 4.00
Table 4-38 Test of Homogeneity of Variances
Levene Statistic df1 df2 Sig.
NABP Score .229 1 119 .633
GPA .106 1 119 .745
The difference in mean NABP values was not statistically significant between the
groups, the students who preferred the Multi-modal learning style versus those who did
not prefer the Multi-modal learning style. Accept the null hypothesis of no relationship
between the Multi-modal learning styles and NABP scores.

58
Students who preferred a Multi-modal learning style had a higher mean GPA than
students who did not prefer a Multi-modal learning style. However, the difference
between mean values was not statistically significant. The difference between mean
GPA values was marginally statistically significant at p = .055 level. Reject the null
hypothesis because there is a statistically significant difference in the mean GPAs of the
two groups.
Table 4-39 ANOVA
Sum of
Squares df Mean Square F Sig.
NABP Score Between Groups 194.175 1 194.175 .868 .353
Within Groups 26630.701 119 223.787
Total 26824.876 120
GPA Between Groups .380 1 .380 3.769 .055
Within Groups 12.011 119 .101
Total 12.392 120
T-Test for Groups Female versus Male
Females had a higher mean NABP score and GPA than males. The female mean
GPA was only .0058 points higher. However, the differences between mean values
were not statistically significant. Accept the null hypothesis of no difference between
females and males on mean values of NABP and GPA.
Table 4-40 Group Statistics
Female N Mean Std. Deviation Std. Error
Mean
NABP Score
Female 85 122.05 14.607 1.584 Male 36 119.50 15.801 2.634
GPASM Female 85 3.4841 .31664 .03434 Male 36 3.4783 .33674 .05612

59
Table 4-41 Independent Samples Test
Levene's Test for Equality of
Variances t-test for Equality of Means
F Sig. t df Sig. (2-tailed)
Mean Differe
nce
Std. Error
Difference
95% Confidence Interval of the
Difference
Lower Upper
NABP Score
Equal variances assumed
.321 .572 .856 119 .394 2.55 2.976 -3.347 8.441
Equal variances not assumed
.829 61.558 .410 2.55 3.073 -3.597 8.692
GPASM Equal variances assumed
.470 .494 .090 119 .928 .0058 .06417 -.12127 .13284
Equal variances not assumed
.088 62.472 .930 .0058 .06580 -.12572 .13729
T-Test for groups White versus Not White
Students who were not white had a higher mean NABP score and GPA than
students who were white. However, the differences between mean values were not
statistically significant. Accept the null hypothesis of no differences in mean values for
NABP scores and GPA.
Table 4- 42 Group Statistics
White N Mean Std. Deviation Std. Error
Mean
NABP Score White 90 120.84 14.485 1.527 Non-White 31 122.58 16.413 2.948
GPASM White 90 3.4759 .31671 .03338 Non-White 31 3.5013 .33910 .06090

60
Table 4-43 Independent Samples Test
Levene's Test for
Equality of Variances t-test for Equality of Means
F Sig. T df Sig. (2-tailed)
Mean Differe
nce
Std. Error
Difference
95% Confidence Interval of the
Difference
Lower Upper
NABP Score
Equal variances assumed
.833 .363 -.556 119 .579 -1.74 3.123 -7.919 4.447
Equal variances not assumed
-.523 47.113 .603 -1.74 3.320 -8.414 4.942
GPASM Equal variances assumed
.264 .608 -.378 119 .706 -.0254 .06716 -.15839 .10758
Equal variances not assumed
-.366 49.237 .716 -.0254 .06945 -.16496 .11416
T-Test for Groups Visual versus Not Visual
Students who preferred a Visual learning style had a lower mean NABP score than
students who did not prefer a Visual learning style. However, the difference between
mean values was not statistically significant. Accept the null hypothesis of no
relationship between this preferred learning style and NABP scores.
Students who preferred a Visual learning style had a higher mean GPA than
students who did not prefer a Visual learning style. However, the difference between
mean values was not statistically significant. Accept the null hypothesis of no
relationship between this preferred learning style and GPA.

61
Table 4-44 Group Statistics
Visual or Not-Visual N Mean
Std. Deviation
Std. Error Mean
NABP Score Visual 83 120.95 14.946 1.641 Not Visual 38 122.03 15.136 2.455
GPASM Visual 83 3.4969 .32458 .03563 Not Visual 38 3.4508 .31611 .05128
Table 4-45 Independent Samples Test
Levene's Test for Equality of
Variances
t-test for Equality of Means
95% Confidence Interval of the
Difference
F Sig. t df Sig. (2-tailed)
Mean Differe
nce
Std. Error
Difference Lower Upper
NABP Score
Equal variances assumed
.663 .417 -.366 119 .715 -1.07 2.939 -6.894 4.745
Equal variances not assumed
-.364 71.021 .717 -1.07 2.953 -6.963 4.814
GPASM Equal variances assumed
.117 .733 .731 119 .466 .0461 .06306 -.07879 .17095
Equal variances not assumed
.738 73.602 .463 .0461 .06244 -.07835 .17051
T-Test for Groups Aural versus Not Aural
Students who preferred an Aural learning style had a lower mean NABP score
than students who did not prefer an Aural learning style. However, the difference
between mean values was not statistically significant. Accept null hypothesis of no
statistically significant relationship between groups.
Students who preferred an Aural learning style had a higher mean GPA than
students who did not prefer an Aural learning style. However, the difference between

62
mean values was not statistically significant. Accept null hypothesis of no statistically
significant relationship between groups.
Table 4-46 Group Statistics
Aural or Not-Aural N Mean Std. Deviation
Std. Error Mean
NABP Score Aural 67 121.19 14.767 1.804 Not Aural 54 121.41 15.315 2.084
GPASM Aural 67 3.5224 .31239 .03816 Not Aural 54 3.4328 .32825 .04467
Table 4-47 Independent Samples Test
Levene's Test for
Equality of Variances t-test for Equality of Means
F Sig. T df Sig. (2-tailed)
Mean Difference
Std. Error
Difference
95% Confidence Interval of the
Difference
Lower Upper
NABP Score
Equal variances assumed
.201 .655 -.078 119 .938 -.21 2.746 -5.650 5.223
Equal variances not assumed
-.077 111.785 .938 -.21 2.756 -5.675 5.248
GPASM Equal variances assumed
.154 .696 1.533 119 .128 .0896 .05844 -.02610 .20532
Equal variances not assumed
1.525 111.085 .130 .0896 .05875 -.02681 .20603
T-Test for Groups Read/Write versus Not Read/Write
Students who preferred a Read/Write learning style had a lower mean NABP
score than students who did not prefer a Read/Write learning style. However, the
difference between mean values was not statistically significant. The difference
between mean NABP values was marginally statistically significant at p = .066 level.

63
Students who preferred a Read/Write learning style had a higher mean GPA than
students who did not prefer a Read/Write learning style. However, the difference
between mean values was not statistically significant. Accept the null hypothesis that
there is no statistically significant relationship.
Table 4-48 Group Statistics
Read or Not-Read N Mean Std. Deviation
Std. Error Mean
NABP Score Read/Write 77 119.40 15.892 1.811 Not Read/Write 44 124.59 12.646 1.906
GPASM Read/Write 77 3.5113 .32524 .03706 Not Read/Write 44 3.4318 .31161 .04698
Table 4-49 Independent Samples Test
Levene's Test for
Equality of Variances
t-test for Equality of Means
95% Confidence Interval of the
Difference
F Sig. T Df Sig. (2-tailed)
Mean Difference
Std. Error
Difference Lower Upper
NABP Score
Equal variances assumed
2.701 .103 -1.855 119 .066 -5.19 2.797 -10.727 .350
Equal variances not assumed
-1.973 106.538 .051 -5.19 2.630 -10.401 .025
GPASM Equal variances assumed
.096 .757 1.313 119 .192 .0795 .06055 -.04041 .19937
Equal variances not assumed
1.328 92.842 .187 .0795 .05984 -.03935 .19831
T-Test for Groups Kinesthetic versus Not Kinesthetic
Students who did not prefer a Kinesthetic learning style had a higher mean NABP
score than students who preferred a Kinesthetic learning style. The difference between
mean NABP values was statistically significant at p = .01 level. Therefore, reject the null
hypothesis of no statistically significant relationship.

64
Students who prefer a Kinesthetic learning style had a higher mean GPA than
students who did not prefer a Kinesthetic learning style. However, the difference
between mean values was not statistically significant. Accept the null hypothesis; there
is no difference in mean GPAs between the two learning style groups.
Table 4-50 Group Statistics
Kinesthetic or Not-Kinesthetic N Mean Std. Deviation
Std. Error Mean
NABP Score Kinesthetic 21 113.71 17.097 3.731 Not Kinesthetic 100 122.88 14.042 1.404
GPASM Kinesthetic 21 3.5743 .28947 .06317 Not Kinesthetic 100 3.4631 .32569 .03257
Table 4-51 Independent Samples Test
Levene's Test for Equality of
Variances
t-test for Equality of Means
95% Confidence Interval of the
Difference
F Sig. T df
Sig. (2-
tailed)
Mean Differe
nce
Std. Error
Difference Lower Upper
NABP Score
Equal variances assumed
1.948 .165 -2.615 119 .010 -9.17 3.505 -16.105 -2.226
Equal variances not assumed
-2.299 25.962 .030 -9.17 3.986 -17.360 -.971
GPASM Equal variances assumed
1.996 .160 1.448 119 .150 .1112 .07679 -.04086 .26323
Equal variances not assumed
1.564 31.595 .128 .1112 .07107 -.03365 .25602
T-Test for Groups Multi-Modal versus Not Multi-Modal
Students who preferred a Multi-modal learning style had a lower mean NABP
score than students who did not prefer a Multi-modal learning style. However, the
difference between mean values was not statistically significant. Accept the null

65
hypothesis there is no statistically significant relationship between the NABP scores of
the two groups.
Students who preferred a Multi-modal learning style had a higher mean GPA than
students who did not prefer a Multi-modal learning style. However, the difference
between mean values was not statistically significant. Accept the null hypothesis that
there is no statistically significant relationship in mean GPAs between student Multi-
modal preferences.
Table 4-51 Group Statistics
MultiModal or Not-MultiModal N Mean Std. Deviation
Std. Error Mean
NABP Score Multimodal 64 120.09 15.247 1.906 Not Multimodal 57 122.63 14.630 1.938
GPASM Multimodal 64 3.5353 .32888 .04111 Not Multimodal 57 3.4230 .30463 .04035
Table 4-52 Independent Samples Test
Levene's Test for Equality of
Variances
t-test for Equality of Means
95% Confidence Interval of the
Difference
F Sig. T df
Sig. (2-
tailed)
Mean Differe
nce
Std. Error
Difference Lower Upper
NABP Score
Equal variances assumed
.229 .633 -.931 119 .353 -2.54 2.724 -7.933 2.857
Equal variances not assumed
-.934 118.325 .352 -2.54 2.718 -7.920 2.844
GPASM Equal variances assumed
.106 .745 1.941 119 .055 .1123 .05786 -.00224 .22690
Equal variances not assumed
1.950 118.808 .054 .1123 .05760 -.00173 .22639

66
CHAPTER 5 CONCLUSION
This study has explored the relationship between learning styles, Demographics,
GPA, and NABPLEX. Although, using both, One-way ANOVA and T-Test, analysis may
be considered redundant; the intent of the study is to demonstrate consistency in the
results produced by different methods. This final chapter will include a discussion of the
findings as well as suggestions for future studies. The ultimate goal is to improve
curriculum and the quality of the online components of the hybrid programs.
Discussion of the Results
Owen (2003) reported a positive correlation between age and GPA. These
findings agree with the results of the analysis in this study which also shows a positive,
significant correlation between age and GPA.
According to Tokin (2003), the majority of the online students are females. The
frequencies for the variables of interest in the study show an eighty-five percentage
female matching Tokin’s findings. By looking at the data, it appears that this group of
female students has a higher GPA and NABPLEX score. However, the statistical
analysis of both methods, the One-Way ANOVA and T-Test, showed that the difference
is not statistically significant and therefore there is no relationship between gender, GPA
and NAPLEX scores. In other words, gender does not affect GPA or NAPLEX scores.
As part of the demographics this study also reviewed the possible relationships
between race, GPA and NAPLEX scores. The results of the One-Way ANOVA agree
with the results of the T-Test. In both cases the results show that there are no
statistically significant differences, concluding that there is no relationship between race,
GPA and NAPLEX scores.

67
However, the 2005 NAEP (National Assessment of Educational Progress
http://nationsreportcard.gov/hsts_2005/hs_gpa_3a_1.asp) report conveys a difference
between White, Asian, Hispanic and Black students. While Asian students had a higher
GPA than Whites, Blacks and Hispanic, White students had a higher GPA than Black
and Hispanic. The fact that this study did not differentiate among minorities and
combined all minorities together, could justify the disagreement. (i.e. the Asian students
raised the GPA) A more detailed study dividing the minorities in different ethnic groups
would be necessary to compare the finding to the ones reported in NAEP’s Nation’s
Report Card.
The literature review section of the study described different conceptual models to
categorize learning styles and the justification for the selection of the VARK
questionnaire as the preferred method. During the analysis, two different methods, One-
Way ANOVA and T-Test were used to search for the relationship or lack of relationship
between each learning style category and GPA and NAPLEX scores. After reviewing
the results of both analyses, the results indicate that there are no significant
relationships between learning styles, demographics, GPA and NABPLEX.
Nonetheless, the study also included concerns expressed by professionals, Dr. Svinicki,
Dr. Leite, and Dr. Shi, trying to validate the accuracy of the VARK questionnaire. This
lack of proven validity associated with the selected questionnaire reinforces the caution
expressed by them when interpreting the results. The same argument can be extended
to the interpretation of the result of this study.
However, when designing a hybrid course, as Palloff and Pratt (2005) recommend,
faculty should understand the students and their learning styles to create a learner-

68
centered and learner-focused course which would maximize the online learning
experience. Blackmore (1996) suggested that there are as many ways to teach as
there to learn. An instructor, acknowledging the existence of different learning styles,
could design classes to match the preferred style or mismatch it to help the student
develop an under used learning style Diaz (2001). Additional research is needed to
understand what kinds of learners are likely to succeed in a hybrid environment. Since
distance learning is student centered, understanding the personal characteristics of the
students is an important component to overcoming possible barriers to learning
(Nastanski, M.,Slick, T.2008).
Implications for Higher Education
Although the results of the study did not show a strong relationship between the
preferred learning styles and the students’ performance, there is a benefit of
understanding how students learn best. Pungente, Wasan, and Moffett (2003) found a
relationship between the learning styles and the Problem-Based learning approach in
their study of first-year pharmacy students. The difference in the result of their study
and this one is likely due to the fact that they studied a specific area within the course
whereas this study looked at the course as a whole. Additional research, including a
break down of the course’s components would be able to determine if particular
sections of a hybrid course have a stronger relationship with the preferred learning style
of the students. Those findings could lead to a more customized curriculum in order to
increase students’ learning and possibly change how we view curriculum design in
Higher Education.

69
APPENDIX A THE VARK QUESTIONNAIRE
How Do I Learn Best?
Questionnaire version 7.0
Choose the answer which best explains your preference and circle the letter(s) next to it. Please circle more than one if a single answer does not match your perception. Leave blank any question that does not apply.
1.- You have finished a competition or test and would like some feedback. You would like to have feedback:
a. using examples from what you have done.
b. using a written description of your results.
c. using graphs showing what you had achieved.
d. from somebody who talks it through with you.
2.- You are helping someone who wants to go to your airport, town centre or railway station. You would:
a. a.- go with her.
b. write down the directions.
c. tell her the directions.
d. draw, or give her a map.
3.- You are not sure whether a word should be spelled `dependent' or `dependant'. You would:
a. think about how each word sounds and choose one.
b. write both words on paper and choose one.
c. find it in a dictionary.
d. see the words in your mind and choose by the way they look.

70
4.- You want to learn a new program, skill or game on a computer. You would:
a. use the controls or keyboard.
b. follow the diagrams in the book that came with it.
c. read the written instructions that came with the program.
d. talk with people who know about the program.
5.- You are going to choose food at a restaurant or cafe. You would:
a. listen to the waiter or ask friends to recommend choices.
b. choose from the descriptions in the menu.
c. choose something that you have had there before.
d. look at what others are eating or look at pictures of each dish.
6.- Other than price, what would most influence your decision to buy a new non-fiction book?
a. Quickly reading parts of it.
b. A friend talks about it and recommends it.
c. It has real-life stories, experiences and examples.
d. The way it looks is appealing.
7.- You have a problem with your knee. You would prefer that the doctor:
a. described what was wrong.
b. used a plastic model of a knee to show what was wrong.
c. gave you a web address or something to read about it.
d. showed you a diagram of what was wrong.
8.- You are going to cook something as a special treat for your family. You would:
a. ask friends for suggestions.
b. look through the cookbook for ideas from the pictures.

71
c. cook something you know without the need for instructions.
d. use a cookbook where you know there is a good recipe.
9.- Remember a time when you learned how to do something new. Try to avoid choosing a physical skill, eg. riding a bike. You learned best by:
a. watching a demonstration.
b. written instructions – e.g. a manual or textbook.
c. listening to somebody explaining it and asking questions.
d. diagrams and charts - visual clues.
10.- I like websites that have:
a. things I can click on, shift or try.
b. audio channels where I can hear music, radio programs or interviews.
c. interesting design and visual features.
d. interesting written descriptions, lists and explanations.
11.- Do you prefer a teacher or a presenter who uses:
a. demonstrations, models or practical sessions.
b. handouts, books, or readings.
c. diagrams, charts or graphs.
d. question and answer, talk, group discussion, or guest speakers.
12.- You are using a book, CD or website to learn how to take photos with your new digital camera. You would like to have:
a. many examples of good and poor photos and how to improve them.
b. a chance to ask questions and talk about the camera and its features.
c. clear written instructions with lists and bullet points about what to do.
d. diagrams showing the camera and what each part does.

72
13.- You have to make an important speech at a conference or special occasion. You would:
a. gather many examples and stories to make the talk real and practical.
b. write a few key words and practice saying your speech over and over.
c. write out your speech and learn from reading it over several times.
d. make diagrams or get graphs to help explain things.
14.- You are planning a holiday for a group. You want some feedback from them about the plan. You would:
a. describe some of the highlights.
b. use a map or website to show them the places.
c. phone, text or email them.
d. give them a copy of the printed itinerary.
15.- A group of tourists want to learn about the parks or wildlife reserves in your area. You would:
a. take them to a park or wildlife reserve and walk with them.
b. give them a book or pamphlets about the parks or wildlife reserves.
c. show them internet pictures, photographs or picture books.
d. talk about, or arrange a talk for them about parks or wildlife reserves.
16.- You are about to purchase a digital camera or mobile phone. Other than price, what would most influence your decision?
a. Trying or testing it
b. Reading the details about its features.
c. It is a modern design and looks good.
d. The salesperson telling me about its features.

73
APPENDIX B DATA DICTIONARY
File: Demographics_GPA_Fall Year Entered
Academic Year the Student Entered the College of Pharmacy
Class This data should be ignored or deleted all together. It is not relevant.
Delete for Privacy Reasons
Out of Sequence
This data should be ignored or deleted all together. It is not relevant.
Delete for Privacy Reasons
Last Last name of the student String First First name of the student String Campus
Campus that the student attended String GNV=Gainesville JAX=Jacksonville ORL=Orlando STP=St. Pete
UFID University of Florida Identification Number String SSN This data should be ignored or deleted all together. It is not
relevant. Delete for Privacy Reasons
Gender
Gender of the student String
Race Race of the student String Birthday
Student’s Birthday Date
Age Age at the time the student entered into COP Age in Years
Index Date
9/29/2003 Value to calculate age
AA Did the student have an Associate Arts degree at time of entry into college
Y=Yes Blank=No
Bachelors
Did the student have a BS degree at time of entry into college Y=Yes Blank=No
GPASM
Pre-pharmacy Science and Math Grade Point Average 0.00-4.00
PCAT Pre-pharmacy Pharmacy College Admission Test Composite 0-100

74
File Name: Names_UFID_Fall Last Last name of the student String First First name of the student String UFID University of Florida Identification Number String File Name: PCRA_1PD_Enter_Fall2003
http://www.cop.ufl.edu/ned/formgen/prca.htm
T1 Last Name, First Name R2 I dislike participating in group discussions. 1=SA
2=A 3=Undecided 4=D 5=SD
R3 Generally, I am comfortable while participating in a group discussion.
R4 I am tense and nervous while participating in a group discussion. R5 I like to get involved in group discussions. R6 Engaging in a group discussion with new people makes me
tense and nervous.
R7 I am calm and relaxed while participating in group discussions. R8 Generally, I am nervous when I have to participate at a meeting. R9 Usually I am calm and relaxed when participating at meetings. R10 I am very calm and relaxed when I am called upon to express an
opinion at a meeting.
R11 I am afraid to express myself at meetings. R12 Communicating at meetings usually makes me uncomfortable. R13 I am very relaxed when answering questions at at meeting. R14 While participating in a conversation with a new acquaintance, I
feel very nervous.
R15 I have no fear of speaking up in conversations. R16 Ordinarily, I am very tense and nervous in conversations. R17 Ordinarily, I am very calm and relaxed in conversations. R18 While conversing with a new acquaintance, I feel very relaxed. R19 I am afraid to speak up in conversations. R20 I have no fear of giving a speech. R21 Certain parts of my body feel very tense and rigid while giving a
speech.
R22 I feel relaxed while giving a speech. R23 My thoughts become confused and jumbled when I am giving a
speech.
R24 I face the prospect of giving a speech with confidence. R25 While giving a speech, I get so nervous I forget facts I really
know.
Delete Everything After R25 (Column Z)

75
How Do You Learn Best (VARK)
http://www.cop.ufl.edu/ned/formgen/ried6.htm
T1 Last name, First Name T2 Social Security Number R3 Campus the Student Attended You are about to give directions to a person who is standing with
you. She is staying in a hotel in town and wants to visit your house later. She has a rental car. I would:
C4 draw a map on paper On=selected Blank=not selected
C4A tell her the directions
C4B write down the directions (without a map) C4C collect her from the hotel in my car You are not sure whether a word should be spelled 'dependent'
or 'dependant'. I would:
C5 look it up in the dictionary C5A see the word in my mind and choose by the way it look C5B sound it out in my mind C5C write both versions down on paper and choose one. You have just received a copy of your itinerary for a world trip.
This is of interest to a friend. I would:
C6 phone her immediately C6A send her a copy of the printed itinerary C6B show her on a map of the world C6C share what I plan to do at each place I visit You are going to cook something as a special treat for your
family. I would:
C7 cook something familiar without the need for instructions C7A thumb through the cookbook looking for ideas from the pictures C7B refer to a specific cookbook where there is a good recipe A group of tourists has been assigned to you to find out about
wildlife reserves or parks. I would:
C8 drive them to a wildlife reserve or park C8A show them slides and photographs C8B give them pamphlets or a book on wildlife reserves or parks C8C give them a talk on wildlife reserves or parks. You are about to purchase a new stereo. Other than price, what
would most influence your decision?
C9 the salesperson telling you what you want to know C9A reading the details about it C9B playing with the controls and listening to it C9C it looks really smart and fashionable

76
Recall a time in your life when you learned how to do something like playing a new board game. Try to avoid choosing a very physical skill, e.g., riding a bike. I learned best by:
C10 visual clues -- pictures, diagrams, charts C10A written instructions C10B listening to somebody explaining it C10C doing it or trying it You have an eye problem. I would prefer the doctor to: C11 tell me what is wrong C11A show me a diagram of what is wrong C11B use a model to show me what is wrong You are about to learn to use a new program on a computer: I
would:
C12 sit down at the keyboard and begin to experiment with the program's features
C12A read the manual which comes with the program C12B telephone a friend and ask questions about it. You are staying at a hotel and have a rental car. You would like
to visit friends whose address/location you do not know. I would like them to:
C13 draw me a map on paper C13A tell me the directions C13B write down the directions (without a map) C13C collect me from the hotel in their car Apart from the price, what would most influence your decision to
buy a particular textbook?
C14 I have used a copy before C14A A friend talking about it C14B Quickly reading parts of it C14C The way it looks appealing A new movie has arrived in town. What would most influence
your decision to go (or not to go)?
C15 I heard a radio review about it C15A I read a review about it C15B I saw a preview of it Do you prefer a lecturer or teacher who likes to use? C16 a textbook, handouts, readings C16A flow diagrams, charts, graphs C16B field trips, labs, practical sessions C16C discussion, guest speakers Delete everything after 16C (Column AZ) Prep1
http://www.cop.ufl.edu/ned/formgen/prep1.htm
T1 First Name T2 Last Name

77
T3 UFID R4 Gender R5 Academic Year T6 What Year Do You Expect to Graduate T7 Birth date R8 Communicate pertinent information from the patient's medical record to
other he health care professionals.
1 = poor 4 = average 7 = excellent
R9 Communicate pertinent information from the patient's medical record to the
patient.
R10 Recommend appropriate drug therapy for a specific patient. R11 Evaluation medications and/or laboratory tests. R12 Integrate knowledge in the basic and clinical sciences to design,
implement, and evaluate patient specific pharmacotherapeutic regimens to
prevent or resolve medication-related problems.
R13 Evaluate and determine the validity, acceptability, and legitimacy of the
prescription order from a physician for a specific patient.
R14 Determine the appropriate drug delivery system or drug product for a
specific patient.
R15 Recommend medication doses and dosage schedules for a specific patient
based upon relevant patient factors and drug pharmacodynamic and
pharmacokinetic properties.
R16 Identify and collect all information needed to prevent or resolve a
medication-related problem.
R17 Identify and collect all information needed to respond to an information
request from another health care professional using appropriate resources and
technology.
R18 Respond to an information request from a patient. R19 Evaluate laboratory test results for a specific patient. R20 Calculate and evaluate drug pharmacokinetic properties for a specific
patient.
R21 Evaluate information obtained from the patient's history and physical
assessment.
R22 Integrate and apply the basic and clinical pharmaceutical sciences and
standards for the preparation and dispensing of commercially available
products, compounded individual or bulk products and sterile dosage forms
and enteral nutritional products.
R23 Make reasonable assumptions and/or draw reasonable conclusions when data
is incomplete.
R24 Provide counseling to patients and/or caregivers relative to the proper
use and effects of medications.
R25 Devise methods or approaches to seek optimal patient compliance. R26 Monitor and document the safety and efficacy of a therapeutic plan for a
specific patient.
R27 Document information related to the identification, resolution, or

78
prevention of drug-related problems in individual patients.
R28 Provide pharmaceutical care in a professional, ethical, and compassionate
manner.
R29 Evaluate, select and purchase pharmaceuticals, durable medical equipment
devices and supplies.
R30 Develop and implement a pharmacy inventory control system to distribute
and administer medications and durable medical equipment devices.
R31 Provide emergency care on a limited basis. R32 Promote public awareness of health and disease. R33 Comply with federal, state and local laws and regulations that affect the
practice of pharmacy.
R34 Manage the operation, fiscal resources and human resources of a
community, institutional or other pharmacy practice site to optimally serve
the needs of patients.
R35 Participate in the development and implementation of drug use evaluations
and the formulary service.
R36 Discuss and describe the general process of research in the clinical and
basic pharmaceutical sciences.
R37 Provide a critical and thoughtful review of a publication in the basic or
clinical pharmaceutical sciences.
R38 Systematically gather information needed to resolve a problem or
situation.
R39 Synthesize information and create a solution, hypothesize, draw
conclusions, conjecture alternatives, or decide a course of action for a
problem or situation.
R40 Make decisions regarding complex problems that require the integration of
scientific, social, cultural, and ethical issues with one's ideas and values.
R41 Use data and computers in professional practice. R42 Recognize the impact of values in personal and professional interactions
with other individuals.
R43 Apply ethical theories and principles to personal and professional values
and decisions.
R44 Recognize and explain how social, cultural, historical, political, and/or
scientific issues impact upon the changing health care environment.
R45 Understand one's professional practice in relationship to changing
societal expectations on the role of pharmacists in the health care system.
R46 Adapt and use appropriate interpersonal and intergroup behaviors during
professional interactions with patients, other health care providers and the
public.
R47 Contribute opinions, insights, information, and leadership assertively
and appropriately during the health care team decision-making process.
R48 Assume leadership positions and/or participate in community and
professional matters that involve human health and civic concerns that may or
may not be health-related.
S49 Based on your experience to date, can you think of any areas not covered
in the curriculum that should be taught?

79
S50 If you could change one area of education, what would it be? S51 How would you change it? After this point, do not need the data Residency List 2007 Name Name R16 Residency (1=yes; missing = no) 2008 Graduating Class Names A Last Name B First Name C Middle Name D Campus G=GNV
J=JAX O=ORL S=STP
E UFID Number Do not Need anything else NABP Individual Scores May 2007 Graduates A Last Name B First Name C SSN D Campus G=GNV
J=JAX O=ORL S=STP
E Pass 0=No 1=Yes
F Scaled Score G Area 1 H Area 2 I Area 3

80
LIST OF REFERENCES
Jonnassen, D. (2004) Handbook of Research on Educational Communications and
Technology (pp.355). Mahwah, N.J. : L. Erlbaum Associates, 2004
Howard,C.,Schenk, K., Discenza, R. (2004) Distance Learning and University
Effectiveness: Changing Education Paradigms for Online Learning Hershey, (pp.1)PA :
Idea Group Publishing, 2004
Weller, M., (2003) Delivering on the Net: The why, what & how of online education.
New York : RoutledgeFalmer.
Moore, M, Anderson, W. (2003) Handbook of Distance Education. Mahwah, N.J. : L.
Erlbaum Associates, 2003
Policy on Distance Learning retrieved on January 31, 2008 from
http://www.ribghe.org/distance%20learning.pdf
Digest of Education Statistics (http://nces.ed.gov/programs/digest/d06 / )
VARK Retrieved February 4, 2008 from http://www.vark-learn.com/english/page.asp?p=faq ANOVA Retrieved on July 9, 2009 from http://www.businessdictionary.com/definition/analysis-of-variances-ANOVA.html
Dutton, J., Dutton, M., Perry, J. (2002) How do online students differ from lecture
students? Journal of Asynchronous Learning Networks Retrieve Jan 31, 2008 from
http://www.sloan-c.org/publications/jaln/v6n1/pdf/v6n1_dutton.pdf
Fleming, N.D. & Mills, C. (1992). Not another inventory, rather a catalyst for reflection To improve the academy, (11), 137-149. Christensen, C. M., Aaron, S., & Clark, W. (2001). Disruption in education. Proceedings of the Internet and the University: 2001 Forum. Cambridge, MA: Massachusetts Institute of Technology. Retrieved February 4, 2008 from http://www.educause.edu/forum/ffpiu01w.asp http://www2.cdc.gov/PHTN/lingo.asp
About Learning styles. Retrieved February 4, 2008 from
(http://www.learningstyles.net/index.php?option=com_content&task=view&id=20&Itemid
=70&lang=en )

81
Schlosser, L. A., & Simonson, M. (2002). Distance education: Definition and glossary of
terms. Bloomington, IN: Association for Educational Communications and Technology.
Foster, A., Carnevale, D. (2007) Distance Education Goes Public: Looking to make
money and reach more working students, state universities are pushing into the U. of
Phoenix's territory. The Chronicle of Higher Education. Retrieved Jan 31, 2008 from
http://chronicle.com/weekly/v53/i34/34a04901.htm
Bernard, Robert M., Abrami, Philip C., Lou, Yiping, Borokhovski, Evgueni, Wade, Anne, Wozney, Lori, Wallet, Peter Andrew, Fiset, Manon, Huang, Binru How Does Distance Education Compare With Classroom Instruction? A Meta-Analysis of the Empirical Literature Review of Educational Research 2004 74: 379-439 retrieved Feb 15, 2008 form http://intl-rer.sagepub.com/cgi/reprint/74/3/379 Lin, S.,Crawford, S. (2006) An Online Debate Series for First-Year Pharmacy Students.
American Journal of Pharmaceutical Education Retrieved Feb 4, 2008 from
http://www.pubmedcentral.nih.gov/articlerender.fcgi?artid=1847552
Allen, E., Seaman, J. (2005) Growing by Degrees Online Education in the United
States. Olin College-Sloan-C.
Moore, J. (2005) Elements of Quality Online Education: Engaging Communities:
Wisdom from the Sloan Consortium Olin College-Sloan-C.
Allen, E., Seaman, J. (2006). Making the Grade: Online Education in the United States.
Olin College-Sloan-C
University of Florida College of Pharmacy Distance Education Programs retrieved on
Feb 2, 2008 from http://www.cop.ufl.edu/studaff/disted.htm
Salmon, G. (2004) E-Moderating: The Key to Teaching and Learning Online. New
York, NY Routledge 2004
Felder, R., Spurlin, J (2005) Applications, Reliability and Validity of the Index Learning
Styles. Tempus Publications, 2005 retrieved on Feb 16, 2008 from
http://www4.ncsu.edu/unity/lockers/users/f/felder/public/ILSdir/ILS_Validation(IJEE).pdf
Shuck, Avis A., Phillips, Charles R. (1999) Assessing Pharmacy Students' Learning
Styles and Personality Types: A Ten-Year Analysis. American Journal of
Pharmaceutical Education, Volume 63, Issue 1, 1999, Pages 27-33
Casini, M.; Prattichizzo, D.; Vicino, A. (2003) The automatic control telelab: a user-
friendly interface for distance learning, Education, IEEE Transactions on
On page(s): 252- 257, Volume: 46, Issue: 2, May 2003

82
Howell, S. L., Williams, P. B., & Lindsay, N. K. (2003). Thirty-two trends affecting
distance education: An informed foundation for strategic planning. Online Journal of
Distance Learning Administration, 6(3). Retrieved Feb 17, 2008 from
http://www.westga.edu/~distance/ojdla/fall63/howell63.html
Adamcik, B., Hurley, S., Erramousque (1996) Assessment of Pharmacy Students’ Critical Thinking and Problem-Solving Abilities. American Journal of Pharmaceutical Education, Volume 60, Fall 1996 Basadur, M. and Einkbeiner, C.T., “Measuring preference for ideation in creative problem-solving training,” J. Appl. Beh. Sci., 21,37-49(1985). Moloney, J.F., Oackley, B. (2006) Scaling Online Education: Increasing access to Higher Education. Journal of Asynchronous Learning Networks, 2006 Retrieved Feb 24, 2008 from http://www.sloan-c.org/publications/jaln/v10n3/pdf/v10n3_2moloney.pdf Hank, T.F., Shah, A.J., (2007). Using Learning Styles Instruments to Enhance Student Learning. Decision Science Journal of Innovative Education Volume 5, Number 1 (Jan.2007). Creswell, J.W. (2008) Educational research: Planning, conducting, and evaluating quantitative and qualitative research. Upper Saddle River, NJ: Pearson Education. Rothenberg, L., Hessiling, P. (1990) Applying the APA/AERA/NCME "Standards": Evidence for the Validity and Reliability of Three Statewide Teaching Assessment Instruments. Retrieve March 26, 2008 from http://www.eric.ed.gov/ERICDocs/data/ericdocs2sql/content_storage_01/0000019b/80/20/47/05.pdf Baker, R. K. (2003). A framework for design and evaluation of Internet-based distance learning courses: Phase one: Framework justification, design and evaluation. Online Journal of Distance Learning Administration 6(2). Retrieved March 26, 2008, from http://www.westga.edu/~distance/ojdla/ Coffield, F., Mosoley, D.,Hall, E., Eccleston, K.(2004). Learning styles and pedagogy in post-16 learning: A systematic and critical review. Learning and Skill Research Center London, UK. Cano, F. (2006). An In-Depth Analysis of the Learning and Study Strategies Inventory (LASSI). Educational and Psychological Measurement Volume 66,Number 6. Retrieved on March 27, 2008 from http://epm.sagepub.com/cgi/reprint/66/6/1023 Weinstein, C. E., Husman, J., & Dierking, D. R. (2000). Self-regulation interventions with a focus on learning strategies. In P. R. Pintrich & M. Boekaerts (Eds.), Handbook on self-regulation. New York: Academic Press.

83
Pringle RK, Lee J. The use of Learning and Study Strategies Inventory (LASSI) as a predictor for success or failure on part I of the National Board of Chiropractic Examiners Test. J Manipulative Physiol Ther. 21:164–6. 1998 Mar-Apr. Retrieved on March 30, 2008 from http://www.ncbi.nlm.nih.gov/pubmed/9567235 Lobb, W.B., Wilkin, N.E., McCaffrey, D.J., Wilson, M.C, Bentley, J.P. (2006). The predictive utility of nontraditional test scores for first-year pharmacy student academic performance. American Journal of Pharmaceutical Education Volume 70, Number 6, Retrieved on March 31, 2008 form http://www.pubmedcentral.nih.gov/articlerender.fcgi?artid=1803690 Melancon, J.G. (2002). Reliability, structure, and correlates of learning and study strategies inventory scores. Educational and Psychological Measurement Volume 62, Number 6. Retrieve on March 31, 2008 from http://epm.sagepub.com/cgi/reprint/62/6/1020 Deming, M. P., Valeri-Gold, M., & Idleman, L. S. (1994). The reliability and validity of the Learning and Study Strategies Inventory (LASSI) with college developmental students. Research and Instruction, 33, 309-318. Hein, T.L., Budny, D.D.(1999). Teaching to students’ learning styles: Approaches that work. Frontiers in education conference, 1999. FIE’99 Volume 2. Amason, R. F.(2007) Normative analysis of Internet-mediated distance education policies in selected large community colleges and their related state systems. Unpublished doctoral dissertation, University of Florida, Gainesville. Crocker, L. & Algina, J. (1986). Introduction to Classical and Modern Test Theory. New York: Holt, Rinehart, and Winston.
Irizarry, R. (2002). Self-efficacy & motivation effects on online psychology student retention. USDLA Journal, 16 (12). Retrieved September 12, 2008 , from http://www.usdla.org/html/journal/DEC02_Issue/article07.html .
Kelley, K. A., Brackett, C. C., Coyle, J. and Pruchnicki, M. C. , 2006-07-05 "Learning Styles, Personality Type, and Pedagogy: How Do They Relate?" Paper presented at the annual meeting of the American Association of Colleges of Pharmacy, Sheraton San Diego Hotel & Marina, San Diego, California, USA Retrieved 2008-12-12 from http://www.allacademic.com/meta/p117853_index.html Fleming, N., and Baume, D. (2006) Learning Styles Again: VARKing up the right tree!. Educational Developments, SEDA Ltd, Issue 7.4, Nov. 2006, p4-7. Ross, C.M. and Lukow, J. E.(2004) Are Learning Styles a Good Predictor for Integrating Instructional Technology Into a Curriculum?. Journal of Scholarship of Teaching and

84
Learning, Vol.4. No.1, May 2004. Retrieved January 16, 2009 from http://www.iupui.edu/~josotl/2004vol4no1/RossLukow.pdf Leite, L. W, Svinicki, M, Yuying, S (2008) Running Head: Attempted Validation of the scores of the VARK.
Tonkin, S. E. (2003). Predisposing characteristics of learner success in online education. Ph.D. diss., The College of William and Mary in Virginia. Owen, T. R. (2003). Retention Implications of a Relationship between Age and GPA. College Student Journal June 2003. Retrieved July 7, 2008 from http://findarticles.com/p/articles/mi_m0FCR/is_2_37/ai_103563740/ Nastanski, M., Slick, T. (2008) Learning styles and the online classroom: Implications for business students. Unpublished manuscript Palloff, R., Pratt, K. (2005) The Role and Responsibility of the Learner in the Online Classroom. 19th Annual Conference on Distance Teaching and Learning. Retrieved July 10, 2009 from http://www.uwex.edu/disted/conference/Resource_library/proceedings/03_24.pdf Diaz, D., Bontental, K., (2001) Learner Preferences: Developing a Learner-Centered Environment in the Online or Mediated Classroom. Ed at a Distance Journal Vol15. No 8. Retrieved Nov 10, 2009 from http://www.usdla.org/html/journal/AUG01_Issue/article03.html#1
The Nation’s Report Card (2005) http://nationsreportcard.gov/hsts_2005/hs_gpa_3a_1.asp . Retrieved on July 13, 2009 Blackmore, J. (1996). Pedagogy: Learning styles. Retrieved on Nov.5, 2009 from: http://granite.cyg.net/~jblackmo/diglib/styl-a.html Kelley, K. A., Brackett, C. C., Coyle, J. and Pruchnicki, M. C. ,(2006) "Learning Styles, Personality Type, and Pedagogy: How Do They Relate?" Paper presented at the annual meeting of the American Association of Colleges of Pharmacy, Sheraton San Diego Hotel & Marina, San Diego, California, USA. Retrieved Nov 5, 2009 from http://www.allacademic.com/meta/p117853_index.html Pungente, M., Wasan, K., and Moffett, C., (2003) “Using Learning Styles to Evaluate First-Year Pharmacy Students’ Preferences Toward Different Activities Associated with the Problem-Based Learning Approach”. American Journal of Pharmaceutical Education Vol.66, Summer 2003.

85
BIOGRAPHICAL SKETCH
Jose Bernier is an Information Technology professional with more than 12 years of
experience in the field. He has extensive experience managing IT departments both at
the national and international level.
Bernier holds a bachelor of science degree in computer engineering (1997) from
the University of Central Florida. He has a master of science in management of
information systems (2001) from Florida International University and a specialist in
education degree from the University of Florida awarded in 2006. He also completed
his doctorate in higher education administration from the University of Florida. Other
professional certifications include Microsoft certified systems engineer.