The Relationship between Cooling Water Capacity
27
New York State Department of Environmental Conservation The Relationship between Cooling Water Capacity Utilization, Electric Generating Capacity Utilization, and Impingement and Entrainment at New York State Steam Electric Generating Facilities Technical Document William C. Nieder, Biologist II (Ecology) Steam Electric Unit Bureau of Habitat Division of Fish, Wildlife, and Marine Resources Albany, NY 12233 July 2010
Transcript of The Relationship between Cooling Water Capacity

New York State Department of Environmental Conservation
The Relationship between Cooling Water Capacity Utilization, Electric Generating Capacity Utilization, and Impingement and Entrainment at New York State Steam Electric Generating Facilities Technical Document
William C. Nieder, Biologist II (Ecology) Steam Electric Unit Bureau of Habitat Division of Fish, Wildlife, and Marine Resources Albany, NY 12233
July 2010

Page 1 of 27
Citations This report was prepared by: New York State Department of Environmental Conservation Bureau of Habitat Division of Fish, Wildlife, and Marine Resources 625 Broadway Albany, NY 12233 This report is a New York State Department of Environmental Conservation Technical Document and should be cited in the literature in the following manner: Nieder, W.C. 2010. The Relationship between Cooling Water Capacity Utilization, Electric Generating Capacity Utilization, and Impingement and Entrainment at New York State Steam Electric Generating Facilities. New York State Department of Environmental Conservation Technical Document. Albany, NY. July 2010.
Page 2 of 27
Abstract
Throughout New York State, many industrial facilities operate cooling water intake structures and use large volumes of surface waters for cooling machinery or for condensing steam. The steam electric generating industry uses the largest percentage of this cooling water: up to 17 billion gallons per day. The federal Clean Water Act (CWA) and 6 NYCRR § 704.5 requires that the location, design, construction and capacity of cooling water intake structures reflect the “best technology available” (BTA) to minimize adverse environmental impact (i.e., impingement and entrainment). Understanding the relationship between cooling water use, electric generation and the associated adverse environmental impact is critical to determining how this impact can be minimized by managing flow and generation at a facility.
The purpose of this study was to evaluate the relationship between electric generating capacity utilization, cooling water capacity utilization and adverse environmental impact through the analysis of recent data (e.g., cooling water use, generating capacity utilization, entrainment and impingement) collected from several steam electric generating stations in New York State. Results of these analyses indicate that non-targeted reductions in cooling water capacity utilization may have little effect on reducing the adverse environmental impact caused by the operation of cooling water intake structures in New York State. There is also no predictable relationship between electric generating capacity utilization and cooling water capacity utilization indicating that the cooling water systems at many facilities in New York are operated more often than necessary to condense steam.
The seasonal dimension of both energy demand and fish reproductive and migratory life history may be the driving factors influencing entrainment and impingement at a facility. Most steam electric facilities in New York operate under peaking and load-following conditions but they still have a disproportionately large adverse environmental impact on the resource. This finding contradicts assumptions that peaking facilities tend to operate during the times of the year when biological activity would be low and use a proportionately lower amount of cooling water than baseloaded facilities. The results of this study also demonstrate that it is critical for the relationship between electric generating capacity utilization, cooling water capacity utilization, and the resulting impact to be evaluated carefully at a facility before determining if and how any restrictions should be placed on a facility’s electric generation or cooling water use to meet the requirements of CWA § 316(b) and 6 NYCRR § 704.5. This study also demonstrated that using design flow in the establishment of baseline conditions at an existing facility provides the appropriate benchmark to measure the effectiveness of technology and operational measures in reducing the adverse environmental impact from a cooling water intake structure.

Page 3 of 27
Table of Contents Abstract ......................................................................................................................................................... 2
Introduction .................................................................................................................................................. 5
Methods ........................................................................................................................................................ 9
Results and Discussion ................................................................................................................................ 11
Conclusions ................................................................................................................................................. 20
Acknowledgements ..................................................................................................................................... 22
References .................................................................................................................................................. 23
List of Tables and Figures Table 1: Generating capacity and non-contact cooling water capacity at major industrial facilities in New York State (MW = megawatts; MGD = million gallons per day). The steam electric facilities in “bold & italicized” were included in the analysis in this report. ....................... 10 Table 2: Entrainment and impingement estimates are based on actual cooling water use. Estimates are based on the most recent site-specific data collected (Date). When two dates are indicated, the first date corresponds with entrainment and the second date with impingement. (Note: ND= no data available). ........................................................................................... 11 Figure 1: Reductions in impingement from baseline conditions at 14 steam electric facilities in New York State compared with cooling water reductions. The weak relationship is likely due to the effectiveness of traveling screens and fish return systems at some of these facilities in reducing the impingement of many fish species. Seasonality of fish abundance and electric generating demand also likely influences these results. ............................. 12 Figure 2: Reductions in entrainment from baseline conditions as a result of reducing cooling water use at 15 steam electric facilities in New York State. Though the relationship is predictably positive, only 29% of the variability can be attributed to reductions in cooling water use. Over 70% of the variability is likely due to the strong seasonality of ichthyoplankton density and energy demand. ...................................................................... 13 Figure 3: Mean estimated number of fish eggs and larvae entrained (log transformed) at 17 steam electric facilities in New York State at both design capacity and actual capacity utilization of the cooling water intake structure. Though the average entrainment is less at actual operations, this difference was not found to be significant (p=0.67). .......................................... 13 Figure 4: Relationship between the reduction in cooling water capacity used as a function of reducing electric generation at 18 steam electric facilities in New York. The groupings correspond to generating behavior (A=baseloaded; B=unique water use; C=peaking and load-following facilities). .................................................................................................. 16

Page 4 of 27
Figure 5: Average electric generating capacity and cooling water capacity utilization at peaking and load-following vs. baseloaded steam electric facilities in New York State during 2008. Error bars represent +/- 2 STD. ............................................................................................. 17 Figure 6: Average electric generating capacity and cooling water capacity utilization at 19 steam electric facilities in New York State during 2008. ....................................................................... 17 Figure 7: Percent cooling water capacity used and percent of baseline entrainment at 15 steam electric facilities in New York. ......................................................................................................... 19 Figure 8: Regression between the percent reduction in entrainment from baseline conditions and the percent reductions in electric generating capacity used. Though not significant, the general relationship indicates that steam electric facilities in New York State utilizing the least amount of electric generating capacity have minimally reduced entrainment from baseline conditions. ........................................................................................................ 19

Page 5 of 27
Introduction
The U.S. Geological Survey recently estimated that approximately 200 billion gallons per
day, or 60 percent of the total amount of surface waters withdrawn daily for use in the United
States, is used by the steam electric industry for condenser cooling (Kenny et al. 2009).
Throughout New York State, many industrial facilities use large volumes of surface waters to
provide for the cooling of machinery or for condensing steam, with the steam electric generating
industry by far using the largest percentage: up to 17 billion gallons per day. Nearly half of the
steam electric generating facilities in the United States use a once-through cooling system (Veil
2000) to condense steam generated to drive turbines. A generating facility operating a once-
through cooling water system withdraws water from a waterbody, passes the water through
steam condensers or other structures to absorb waste heat, and returns the water to the water
body at a higher temperature (i.e.,thermal discharge).
Though a non-consumptive use (virtually all of the water used by the steam electric
industry is returned to the water body), the use of the surface waters for cooling has an adverse
environmental impact on aquatic resources. At the cooling water intake side, aquatic organisms
are either entrained or impinged. Entrainment occurs when small organisms such as
ichthyoplankton and zooplankton pass through screens designed to keep larger material out of
the cooling system, travel through the facility and are returned to the waterbody in the heated
effluent. Depending on maximum discharge temperatures, changes in water temperatures,
biocide use, and mechanical effects (abrasion, pressure changes, and shear forces), a large
proportion of these entrained organisms may be returned to the waterbody injured or dead (EPA
2004, EPRI 2000, Cannon et al. 1978). Impingement is a process whereby aquatic organisms
that cannot fit through the screens become trapped on the screens, and depending on the species
of organism, the design of the screens, and whether or not the organisms are quickly removed
from the screens and returned to the waterbody, a large number of these organisms may also die
(EPRI 2005, EPRI 2003a). The other impact from using a once-through cooling system is
caused by the thermal effluent but that is beyond the scope of this paper.
Since 1972, the federal Clean Water Act (CWA) has required that the location, design,
construction and capacity of cooling water intake structures (CWIS) reflect the “best technology

Page 6 of 27
available” (BTA) to minimize adverse environmental impact1 [see CWA § 316(b) and 6 NYCRR
§ 704.5]. This requirement recognizes four major features of a cooling water intake structure
that influence the nature and degree of adverse environmental impact caused by its operation: the
location, design, construction, and capacity. Much attention and research has gone into
determining the influence of the location, design, and construction of the intake, and several
technologies have been developed to reduce impact based on this research and technology
development (EPA 2003). The influence of capacity (both flow and electric generation) on the
overall adverse environmental impact is less well understood and is based on the relatively
untested assumption that there is a direct, proportional relationship between capacity utilization
and adverse impact. In fact, the Electric Power Research Institute (EPRI) did not find a
consistent relationship between the volume of water withdrawn and the number of fish entrained
by power plants in the United States and found the relationship to be highly variable, indicating
that further study on the influence of capacity utilization is warranted (EPRI 2003b).
Inadequate consideration has been given to the relationship between seasonal swings in
ichthyoplankton abundance timed with seasonal electric generation requirements. This
relationship can result in a facility having a large adverse environmental impact even though it
may not operate (e.g., generate electricity) for much of the year. Understanding the relationship
between cooling water use, electric generation and the associated adverse environmental impact
is critical to determining how this impact can be minimized by managing flow and generation at
a facility. The New York State Department of Environmental Conservation (DEC) and Hudson
River based utility owners have long understood this relationship on the Hudson River and have
used this understanding to reduce entrainment at some facilities (EPRI 2003b, Consolidated
Edison 1986 & 1984).
EPRI (2003b) did find a general relationship between the number of organisms entrained
and the volume of water withdrawn for power plants in the northeast indicating that a reduction
in cooling water use will reduce the entrainment of fish to some extent. A similar, though weak,
relationship was found with the impingement of threadfin shad and volume of flow at power
plants in the southeastern United States (Loar et al. 1978). In the CWA § 316(b) Phase II Rule
1 Adverse environmental impact is defined as the number of fish killed or injured by the cooling water intake system. See Final Rule, 66 Fed. Reg. at 65,262-65,292; and Riverkeeper, Inc. v. EPA, 358 F.3d 174 (2d. Cir. 2004).

Page 7 of 27
promulgated in 2004, the EPA stated that entrainment at a site is generally proportional to flow,
and facilities operating only during peak demand periods do so during periods of low biological
activity and use significantly less water than facilities operating at or near full generating
capacity. This statement would indicate that there is a well understood and predictable
relationship between generating capacity utilization, cooling water use, and aquatic impact
reduction. Consequently, the EPA “determined that it was n[ot] necessary .… for these facilities
[e.g., facilities that utilized less than 15 percent of their generating capacity] to reduce
entrainment where the total volume of water withdrawn and the number of organisms that would
be protected from entrainment is likely to be small.” (EPA 2004). This variance was based on
the assumption that by reducing the percent of electric generating capacity utilized at a facility,
there would be a reduction in the volume of cooling water used leading to a minimization of the
impingement and entrainment of aquatic organisms. In order for this generalization to be
verified in New York State, it must be demonstrated that: (1) there is a proportional relationship
between the percent electric generating capacity utilization and percent cooling water capacity
utilization for the steam electric industry; and (2) there is a proportional reduction in entrainment
and impingement corresponding to a percent reduction in generating capacity utilization.
Related to this issue is the consideration of CWIS capacity when estimating calculation
baseline impact. New York State has established a “calculation baseline” to assess the relative
reductions in entrainment and impingement possible at existing industrial facilities (such as
steam electric generating plants) that utilize once through non-contact cooling water systems.
The calculation baseline is defined as:
An estimate of impingement mortality and entrainment that would occur at a facility assuming that: the cooling water system has been designed as a once-through system; the opening of the cooling water intake structure is located at, and the face of the standard 3/8-inch mesh conventional traveling screen is oriented parallel to, the shoreline near the surface of the source waterbody and is operated at the full rated capacity 24 hours a day, 365 days a year. This is the baseline of adverse environmental impact to be used in estimating reductions in impingement mortality and entrainment resulting from implementing “best technology available”.
Page 8 of 27
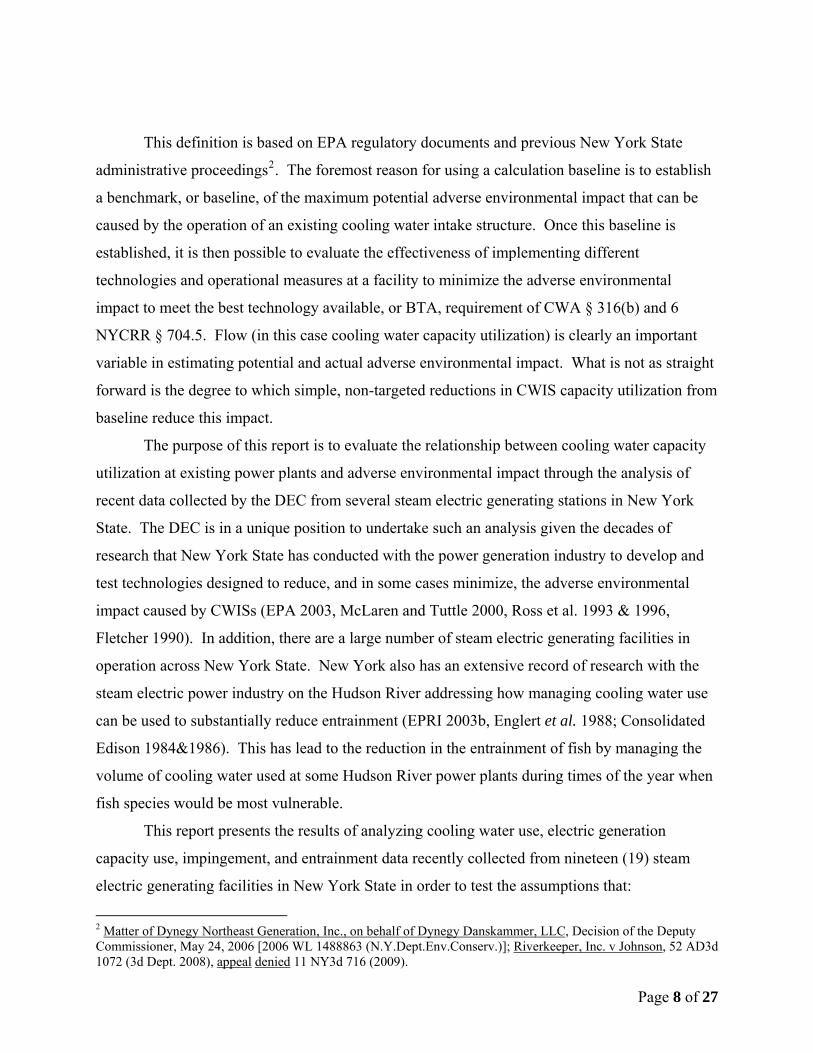
This definition is based on EPA regulatory documents and previous New York State
administrative proceedings2. The foremost reason for using a calculation baseline is to establish
a benchmark, or baseline, of the maximum potential adverse environmental impact that can be
caused by the operation of an existing cooling water intake structure. Once this baseline is
established, it is then possible to evaluate the effectiveness of implementing different
technologies and operational measures at a facility to minimize the adverse environmental
impact to meet the best technology available, or BTA, requirement of CWA § 316(b) and 6
NYCRR § 704.5. Flow (in this case cooling water capacity utilization) is clearly an important
variable in estimating potential and actual adverse environmental impact. What is not as straight
forward is the degree to which simple, non-targeted reductions in CWIS capacity utilization from
baseline reduce this impact.
The purpose of this report is to evaluate the relationship between cooling water capacity
utilization at existing power plants and adverse environmental impact through the analysis of
recent data collected by the DEC from several steam electric generating stations in New York
State. The DEC is in a unique position to undertake such an analysis given the decades of
research that New York State has conducted with the power generation industry to develop and
test technologies designed to reduce, and in some cases minimize, the adverse environmental
impact caused by CWISs (EPA 2003, McLaren and Tuttle 2000, Ross et al. 1993 & 1996,
Fletcher 1990). In addition, there are a large number of steam electric generating facilities in
operation across New York State. New York also has an extensive record of research with the
steam electric power industry on the Hudson River addressing how managing cooling water use
can be used to substantially reduce entrainment (EPRI 2003b, Englert et al. 1988; Consolidated
Edison 1984&1986). This has lead to the reduction in the entrainment of fish by managing the
volume of cooling water used at some Hudson River power plants during times of the year when
fish species would be most vulnerable.
This report presents the results of analyzing cooling water use, electric generation
capacity use, impingement, and entrainment data recently collected from nineteen (19) steam
electric generating facilities in New York State in order to test the assumptions that:
2 Matter of Dynegy Northeast Generation, Inc., on behalf of Dynegy Danskammer, LLC, Decision of the Deputy Commissioner, May 24, 2006 [2006 WL 1488863 (N.Y.Dept.Env.Conserv.)]; Riverkeeper, Inc. v Johnson, 52 AD3d 1072 (3d Dept. 2008), appeal denied 11 NY3d 716 (2009).

Page 9 of 27
1. There is a direct, proportional relationship between generating capacity utilization,
cooling water capacity utilization, and the impingement and entrainment of aquatic
organisms; and
2. Simply reducing cooling water use from full-design flow results in proportional
reductions in adverse environmental impact.
Methods
Nineteen steam electric facilities located across New York State were included in this
study. See Tables 1 and 2 for facility names, specifications and other facts. For each facility, up
to five metrics were calculated or estimated depending on the available data:
1. The cooling water design capacity in million gallons of water per day (MGD).
2. The annual average cooling water use per year (in MGD) was either obtained directly
from the facility owner or from the compliance records maintained by the DEC.
3. The plate rate electric generating capacity (in MWhr per year) was obtained either
directly from the facility owner or from the annual Load and Capacity Data “Gold
Book” produced by the New York Independent Systems Operator (NYISO).
4. The actual annual generating capacity utilization of the facilities was either obtained
directly from the facility owner or from the 2008 NYISO Gold Book.
5. Baseline and actual impingement and entrainment data came from several consultant
reports that were provided to the DEC by the facility owners (see Reference Section for
listing of reports). The year(s) entrainment and impingement data that were collected are
presented in Table 2. Most of these studies were conducted within the last decade.
Comparisons among the facilities using the actual water use in MGD and numbers of fish
impinged and entrained resulted in non-significant, weakly correlated relationships between the
cooling water use and adverse environmental impact (0.005 ≤ R2 ≤ 0.14; p>0.05). Therefore,
all comparisons and analyses were done using the percent reductions from design capacity
operation and not on the actual energy generated (MWhr), cooling water volume used, or
numbers of fish impinged and entrained. This was done primarily to determine the influence of

Page 10 of 27
“capacity utilization” on reducing adverse environmental impact. This also allowed the
determination of impact reductions due to operational practices at facilities across the state.
Given the variability in facility size and efficiency, and the abundance and diversity of the fish
community in the diverse aquatic ecosystems throughout New York, comparing the results using
a percentage scale provided a common currency that could be applied across facilities and water
bodies thereby increasing the power of the analyses.
Table 1: Generating capacity and non-contact cooling water capacity at major industrial facilities in New York State (MW = megawatts; MGD = million gallons per day). The steam electric facilities in “bold & italicized” were included in the analysis in this report.

Page 11 of 27
Table 2: Entrainment and impingement estimates are based on actual cooling water use. Estimates are based on the most recent site-specific data collected (Date). When two dates are indicated, the first date corresponds with entrainment and the second date with impingement. (Note: ND= no data available).
These data were pooled to provide a statewide analysis of the relationship between
cooling water use, electric generation and reductions in impingement mortality and entrainment.
Note that not all nineteen facilities were included in all analyses since data for some facilities
were either lacking or dated. All data transformations (when necessary) and analyses were
performed using Statistica® v 8.0 and Microsoft Excel 2007® and included regression analyses, t-
tests and standard descriptive statistics (means, standard deviation, and standard error).
Results and Discussion
Regression analyses were run comparing the reductions in impingement and entrainment
to the reduction in cooling water capacity utilization from design (full-flow) capacity (Fig. 1 and
2). Figure 1 displays regression results comparing the reductions in impingement with reduction
in cooling water capacity utilization from baseline conditions. The regression is predictably
positive but the relationship is surprisingly weak (R2=0.16) and not significant (p=0.14). The

Page 12 of 27
fact that this relationship is not significant for New York State facilities demonstrates that there
is little direct, proportional relationship between impingement and cooling water capacity use,
and that reductions in cooling water capacity use from design capacity are only responsible for
16 percent of the variability in impingement reduction at best. Therefore, 80 percent or more of
the variability in impingement reduction is due to other factors such as the location, design, and
construction of the cooling water intake structure and the timing of operating the cooling water
intake structures in relation to seasonal fluctuations in the abundance of aquatic biota in the
waterbody. Given that reductions in impingement in New York are more likely related to
variables other than capacity use reductions, and the regression analysis was not significant, no
further analysis of impingement was undertaken in this study.
R² = 0.16p=0.14
0
10
20
30
40
50
60
0 10 20 30 40 50 60 70 80
Per
cent
Impi
ngem
ent R
educ
tion
Percent Cooling Water Reduction from Design Capacity
Percent Reduction in Impingement v. Percent Reduction in Cooling Water Capacity Used
Figure 1: Reductions in impingement from baseline conditions at 14 steam electric facilities in New York State compared with cooling water reductions. The weak relationship is likely due to the effectiveness of traveling screens and fish return systems at some of these facilities in reducing the impingement of many fish species. Seasonality of fish abundance and electric generating demand also likely influence these results.

Page 13 of 27
R² = 0.29p=0.04
0
10
20
30
40
50
60
70
80
0 20 40 60 8
Per
cent
Ent
rain
men
t Red
uctio
n
Percent Cooling Water Reduction from Design Capacity
Percent Reduction in Entrainment v. Percent Reduction in Cooling Water Capacity Used
0
Figure 2: Reductions in entrainment from baseline conditions as a result of reducing cooling water use at 15 steam electric facilities in New York State. Though the relationship is predictably positive, only 29% of the variability can be attributed to reductions in cooling water use. Over 70% of the variability is likely due to the strong seasonality of ichthyoplankton density and energy demand.
Entrainment v. Cooling Water Capacity Utilization
Mean Mean±SE Mean±SD Design Actual
Flow
7.0
7.2
7.4
7.6
7.8
8.0
8.2
8.4
8.6
8.8
9.0
9.2
9.4
9.6
Log (
10) N
umbe
r Ent
rain
ed
Figure 3: Mean estimated number of fish eggs and larvae entrained (log transformed) at 17 steam electric facilities in New York State at both design capacity and actual capacity utilization of the cooling water intake structure. Though the average entrainment is less at actual operations, this difference was not found to be significant (p=0.67).

Page 14 of 27
A regression analysis between the annual mean reduction in cooling water capacity use
from design capacity and reductions in entrainment shows a much stronger relationship than
shown to exist with impingement, indicating that entrainment at a facility with a CWIS is
generally proportional to capacity utilization. However, the results indicate that only about 29
percent of the variability in entrainment reduction is due to reducing capacity use (R2=29;
p=0.04) (Fig. 2). It is not unexpected that this relationship would be stronger than was observed
with impingement since the ichthyoplankton susceptible to entrainment are greatly influenced by
water currents and intake velocities. However, the average difference in the number of
organisms entrained between baseline and actual operating conditions is not significant (p=0.67;
Fig. 3). Similar to the results with impingement displayed in Figure 1, much of the variability in
the reduction in entrainment, over 70 percent, is due to factors other than reduction in cooling
water capacity use. A likely driving factor affecting actual entrainment is the interplay of
cooling water use and the seasonality of the life stages susceptible to entrainment. EPRI (2003b)
found that the timing of water withdrawal relative to the presence of ichthyoplankton was a
confounding factor in trying to determine the level of adverse environmental impact caused by a
CWIS. This, coupled with typically higher energy demands during biologically active times of
the year, results in a much greater adverse environmental impact than would be predicted based
on the annual cooling water capacity utilization alone.
This weak relationship between flow reduction and impact reduction has much to do with
how steam electric facilities are operated in New York State. The majority of steam electric
facilities in New York are either “peaking facilities” or “load-followers”. Peaking facilities are
generally in cold standby for much of the year and are only required to operate during high
demand periods –typically during the late spring and summer months. Load-followers operate
more frequently than peaking facilities, operating at lower loads earlier in the day and gradually
ramping up power levels to match the demand during the day.
Figure 4 displays regression results comparing the reductions in cooling water capacity
use to generating capacity utilizations. The regression results show a significant relationship
between these two variables (R2=0.36; p=0.008) which is expected (the less energy produced; the
less cooling water used). The more interesting result is the apparent arrangement of facilities
into three distinct groups (indicated by “A”, “B”, and “C” in Fig. 4). As it turns out, group “A”

Page 15 of 27
make up the baseload facilities that operate in New York (R.E. Ginna, J.A. Fitzpatrick, Indian
Point, Somerset, and Dunkirk). This grouping is quite tight, indicating a consistent operational
use of cooling water in relation to electric generation (mean water use reduction = 14.8%; STD =
3.1%). Group “C” are the load-following and peaking facilities. The variability in cooling water
use to electric generation is much greater than with the baseloaded plants (mean water use
reduction = 33.9%; STD = 19.2%). Some of the facilities in group “C” use very little of their
electric generating capacity but operate their cooling water system at more than 70 percent of
design capacity annually.
The two facilities in Group “B” (Brooklyn Navy Yard and Danskammer), are unique in
their use of non-contact cooling water. Brooklyn Navy Yard is a co-generation facility that
produces steam for heat for approximately half of the year. During this time of the year, the
facility uses significantly less cooling water than a conventional steam electric facility would
use. The DEC has required a reduction in cooling water use at the Danskammer facility through
the installation and operation of variable speed drive pumps and by requiring fish protective
operational outages. This has resulted in a much more efficient use of cooling water and
minimizes impacts during biologically active times of the year.
Over the course of a year, peaking and load-following facilities in New York operate at
about 20 percent of the designed generating capacity on average (Fig. 5 and 6). The majority of
this capacity is utilized during late spring and summer when many fish species spawn resulting
in the greatest number of fish eggs and larvae being susceptible to entrainment. An additional
complicating factor is that, even though these facilities operate well below 30 percent of the
electric generation capacity, they use almost 55 percent of their cooling water capacity on
average (Fig. 5). Therefore, a significant reduction in electric generation does not necessarily
correspond to a significant reduction in entrainment (Fig. 7). Though peaking and load-
following facilities in New York utilized less cooling water capacity than baseloaded facilities on
average in 2008, this difference was not statistically significant (p=0.22; Fig. 5).

Page 16 of 27
Figure 4: Relationship between the reduction in cooling water capacity used as a function of reducing electric generation at 18 steam electric facilities in New York. The groupings correspond to generating operations (A=baseloaded; B=unique water use; C=peaking and load-following facilities).
C B
A
A regression analysis comparing the percent reduction in entrainment from baseline
conditions to percent reduction in electric generation indicated that there was virtually no
relationship between these two variables (R2=0.04; p=0.48) (Fig. 8). This very weak relationship
was also negative (r = – 0.20), indicating that the facilities utilizing the least amount of their
generating capacity have minimally reduced entrainment from baseline conditions. This is
strongly indicative that many of these peaking and load-following facilities operate cooling water
pumps in the absence of generating electricity and do so during the most biologically active
times of the year. For example, the Port Jefferson Power Station only used 27 percent of its
generating capacity in 2008 but operated the cooling water system at about 75 percent of design
capacity. This resulted in an estimated entrainment of 91 percent of the baseline conditions.
Therefore, a reduction in electric generation capacity utilization of almost 75 percent only
resulted in a reduction in entrainment from baseline conditions by 9.0 percent.

Page 17 of 27
Figure 5: Average electric generating capacity and cooling water capacity utilization at peaking and load-following vs. baseloaded steam electric facilities in New York State during 2008. Error bars represent +/- 2 STD.
Figure 6: Average electric generating capacity and cooling water capacity utilization at 19 steam electric facilities in New York State during 2008.
0.0
10.0
20.0
30.0
40.0
50.0
60.0
70.0
80.0
90.0
100.0
Energy Generation and Cooling Water Use Power Plants 2008
Percent Generating Capacity
Percent Cooling Water Capacity

Page 18 of 27
As noted previously, the time of year that a facility operates has a tremendous effect on
the entrainment impact occurring at the facility (EPRI 2003b). Figure 7 compares the percent
capacity utilization of the cooling water system with the resulting percent reduction in
entrainment from baseline conditions. At several facilities, the reductions in entrainment are
much less than the reductions in water usage. This difference is quite large for peaking facilities
such as the Glenwood Generating Station. Again, this is attributable to the fact that these
facilities operate at near full-capacity during the late spring and early summer months when
ichthyoplankton are most abundant. These facilities also operate their CWIS more often than
required to condense steam (i.e, the CWIS often operates at design capacity when the facilities
are not generating electricity) (Fig. 6). Therefore, simple annualized reductions in electric
generating capacity use or cooling water capacity use will not likely result in a significant
environmental benefit (e.g., entrainment reduction) being realized. Cooling water use and
electric generation reduction must occur when the resource is at risk in order to be an effective
management tool in reducing the adverse environmental impact.
The one facility in New York State that has recently reduced entrainment by actively
managing cooling water use is the Danskammer facility located on the Hudson River. The DEC
has required strict cooling water reductions (i.e., operating variable speed drive pumps and
implementing protective outages during biologically active times of the year) which has resulted
in a 70 percent reduction in entrainment from baseline conditions (Fig. 7). This demonstrates
that cooling water use restrictions can result in reduced aquatic resource impact but these
restrictions must be developed based on adequate site specific study.

Page 19 of 27
Figure 7: Percent cooling water capacity used and percent of baseline entrainment at 15 steam electric facilities in New York.
0102030405060708090100
Percen
t Percent of Cooling Water Capacity Used and Percent of Baseline
Entrainment
% CW Capacity (5‐year average)Actual % Entrainment
Figure 8: Regression between the percent reduction in entrainment from baseline conditions and the percent reductions in electric generating capacity used. Though not significant, the general relationship indicates that steam electric facilities in New York State utilizing the least amount of electric generating capacity have minimally reduced entrainment from baseline conditions.
R² = 0.04p= 0.48
0
10
20
30
40
50
60
70
80
0 10 20 30 40 50 60 70 80 90 100
Percen
t Red
uction
in Entrainmen
t
Percent Electric Generating Capacity Reduction
Percent Reduction in Entrainment v. Percent Reduction in Generating Capacity

Page 20 of 27
Conclusions
Based on the results of this study, non-targeted reductions in cooling water capacity
utilization have little effect on reducing the adverse environmental impact caused by the
operation of cooling water intake structures in New York State. This finding agrees with
conclusions made by EPRI (2003b) that even though there are generally more fish entrained or
impinged with increased cooling water use at power plants, volumetric flow rate alone is a poor
predictor of this adverse environmental impact. The seasonal dimension of both energy demand
and fish reproductive and migratory life history, and cooling water intake system operational
practices, are likely the driving factors influencing entrainment and impingement at a facility.
Most steam electric facilities in New York operate under peaking and load-following conditions
but they still have a disproportionately large adverse impact on the aquatic resource. This finding
contradicts assumptions that peaking facilities tend to operate during the times of the year when
biological activity would be low and use a proportionately lower amount of cooling water than
baseloaded facilities (EPA 2004). Likely explanations for this finding are twofold: (1) these
facilities operate during the biologically active times of the year; and (2) the cooling water
systems at these facilities operate at much higher levels than is required for energy generation
alone. Based on this study, there is not a predictable relationship between the cooling water
capacity use, electric generation capacity utilization, and adverse environmental impact at a
facility in New York State. Cooling water systems were operated much more often than required
to effectively condense steam and remove waste heat at many facilities. Whether for capacity-
reliability or financial reasons, the result is that a much larger adverse environmental impact
occurs than would be predicted from electric generating capacity utilization alone.
The results of this study also demonstrate that using the full-design capacity of cooling
water intake systems in establishing a calculation baseline for entrainment and impingement at
an existing industrial facility provides a consistent and stable benchmark across the State for both
measuring current and predicting future reductions in adverse impact. The claim that the
inclusion of full-design capacity in the baseline calculation exaggerates the level of adverse
environmental impact and allows the steam electric industry to continue to cause adverse
environmental impact is not supported by these results. Indeed, much of the variability in the

Page 21 of 27
reduction in entrainment and impingement observed at steam electric facilities in New York
State is a result of factors other than non-targeted reductions in capacity utilization. Since non-
targeted reductions in flow account for a minor portion of the overall reductions in the observed
impact, use of a calculation baseline that incorporates the full-design capacity of the CWIS
provides an accurate way to determine the potential maximum adverse environmental impact at
existing steam electric facilities in New York State.
Without proper site-specific evaluations, required or assumed reductions in electric
generation capacity utilization may not lead to the minimization in adverse environmental impact
required by CWA § 316(b) and 6 NYCRR § 704.5. As demonstrated with power facilities sited
in New York State, baseload facilities do use a fairly predictable percent capacity of their CWIS
in relation to the amount of electricity being generated and, for the most part, operate the CWIS
year round. However, the majority of the steam electric generating facilities in New York
generate electricity under peaking or load-following conditions where the reductions in cooling
water use and the corresponding adverse environmental impact is far less predictable. The
percent capacity of the cooling water intake systems utilized at these facilities varies
considerably with some facilities using almost 75 percent of their cooling water capacity while
utilizing less than 25 percent of their electric generating capacity. Given that these facilities
primarily operate during times of the year when there is a high abundance of many life stages of
fish, this disproportional use of cooling water capacity can result in a minimal (ten percent or
less) reduction in entrainment from calculation baseline conditions. This finding contradicts
previous assumptions that peaking facilities would only have a minimal impact. Therefore, the
relationship between electric generating capacity utilization, CWIS capacity utilization, and the
resulting impact to aquatic resources through the entrainment and impingement of aquatic
organisms needs to be evaluated carefully at a facility before determining if and how any
restrictions should be placed on a facility’s electric generation or non-contact cooling water use
to meet the requirements of CWA § 316(b) and 6 NYCRR § 704.5.

Page 22 of 27
Acknowledgements All of the biological data (e.g., the facility specific impingement and entrainment estimations)
used in the analyses for this report were collected by the electric power generating industry in
New York State. The quality of the work undertaken by the environmental consulting firms
hired by the power industry provided the level of detail and accuracy required to undertake such
an investigation. These biological studies were required through the DEC’s State Pollutant
Discharge Elimination System (SPDES) permit program and were overseen by New York State
DEC biologists. The dedication of the DEC biologists, working closely with consultant
biologists resulted in a highly accurate assessment of the impingement and entrainment of
aquatic organisms in New York State waters. In addition, several DEC staff provided valuable
insight, advice, and review of this technical document including: Michael Calaban, Christina
Dowd, Colleen Kimble, and Mark Sanza. Technical staff from the U.S. EPA provided valuable
technical review.

Page 23 of 27
References ASA Analysis & Communication, Inc. 2009. AES Somerset Generating Station Comprehensive
Biological Requirements and Technical Review Report. Prepared by ASA Analysis & Communication, Inc. January 2009. Prepared for AES by ASA Analysis & Communication.
ASA Analysis & Communication, Inc. 2009. Danskammer Point Generation Station Preliminary Report on Entrainment and Impingement Monitoring in 2008. June 2009. Prepared for Dynegy Northeast Generation, Inc. by ASA Analysis & Communication.
ASA Analysis & Communication, Inc. 2007. Design and Construction Technology Review for Glenwood Generating Station. Prepared for KeySpan Corporation by ASA Analysis & Communication. February 2007.
ASA Analysis & Communication, Inc. 2007. Design and Construction Technology Review for E.F.Barrett Power Station. Prepared for KeySpan Corporation by ASA Analysis & Communication. April 2007.
ASA Analysis & Communication, Inc. 2006. Far Rockaway Entrainment and Impingement Monitoring. Prepared for KeySpan Generation, LLC by ASA Analysis & Communication. August 2006.
ASA Analysis & Communication, Inc. 2006. Ravenswood Power Station Entrainment and Impingement Monitoring March 2005 – February 2006. Prepared for KeySpan Corporation by ASA Analysis & Communication. August 2006.
ASA Analysis & Communication, Inc. 2005. E.F. Barrett Entrainment and Impingement Monitoring. Prepared for KeySpan Generation, LLC by ASA Analysis & Communication. January 2005.
ASA Analysis & Communication, Inc. 2005. Impingement and Entrainment Monitoring for Port Jefferson Power Station. Prepared for KeySpan Corporation by ASA Analysis & Communication. ASA Analysis & Communication, Inc. 2007. Design and Construction Technology Review for
Port Jefferson Power Station. Prepared for KeySpan Corporation by ASA Analysis & Communication.
ASA Analysis & Communication, Inc. 2009. Northport Power Station Entrainment and Impingement Monitoring April 2007 – April 2008. Prepared for KeySpan Corporation by ASA Analysis & Communication.
Cannon, T.C., S.M. Jinks, L.R. King, and G.J. Lauer. 1978. Survival of entrained icthyoplankton and macroinvertebrates at Hudson River Power Plants. In L.D. Jensen (Editor). Fourth National Workshop on entrainment and Impingement. EA Communications, Melvile, New York. pp 245-255.

Page 24 of 27
Clean Water Act § 316(b)
Consolidated Edison. 2007. Impingement and Entrainment Studies at East River Generating Station. March 2005-February 2006. Prepared by Normandeau Associates, Inc.
Consolidated Edison. 1986. Evaluating the effectiveness of outages; Objective 1: Enumeration and review of statistical estimators for biological parameters. Prepared by Martin Marietta Environmental Systems. Columbia, MD. March 1986. 272 pp.
Consolidated Edison. 1984. Methods for defining and evaluating assessment levels to determine outage effectiveness for entrainment reduction. Prepared by Martin Marietta Environmental Systems. Columbia, MD. March 1984. 34 pp.
EA 2008. Comprehensive Impingement Mortality and Entrainment Characterization Report for R.E. Ginna Nuclear Power Plant. March 2008. Prepared by EA Engineering, Science, and Technology, Inc. for Constellation Energy.
EA 1998. Brooklyn Navy Yard Cogeneration Facility, 1997. Ichthyoplankton Entrainment Monitoring Study. Prepared for Brooklyn Navy Yard Cogeneration Facility, L.P./Palmark. Prepared by EA Engineering, Science and Technology. February 1998.
Englert, T. L., J. Boreman and H. Y. Chen (1988). Plant flow reductions and outages as mitigative measures. Science, Law, and Hudson River power plants: a case study in environmental impact assessment. L. W. Barnthouse, R. J. Klauda, D. S. Vaughan and R. L. Kendall. Bethesda, MD, American Fisheries Society Monograph 4: 274-279.
ENSR Corporation. 2007. CWA 316(b) Impingement Mortality and Entrainment Chracterization Study (IMECS): Astoria Generating Station. July 2007. Prepared by ENCR Corp. for Astoria Generating company, LP.
EPA 2004. Phase II Rule. Federal Register; Vol. 69, No. 13; July 9, 2004.
EPA 2003. Symposium on cooling water intake technologies to protect aquatic organisms. May 6-7, 2003. Arlington, VA. 477 pp.
EPRI 2005. Impingement and entrainment survival studies technical support document. EPRI. Palo Alto, CA: 2005. 1011278.
EPRI 2003a. Evaluating the effects of power plant operations on aquatic communities: Summary of impingement survival studies. EPRI. Palo Alto, CA: 2003. 1007821.
EPRI 2003b. Impacts of volumetric flow rate of water intakes on fish populations and communities. EPRI, Palo Alto, CA: 2003. 1005178.
EPRI 2000. Review of Entrainment Survival Studies: 1970-2000. EPRI. Palo Alto, CA: 2000. 1000757.
Fletcher, R. I. 1990. Flow dynamics and fish recovery experiments: Water intake systems. Transactions of the American Fisheries Society 119(3): 393-415.
Matter of Dynegy Northeast Generation, Inc., on behalf of Dynegy Danskammer, LLC, Decision of the Deputy Commissioner, May 24, 2006 [2006 WL 1488863 (N.Y.Dept.Env.Conserv.)]; Riverkeeper, Inc. v Johnson, 52 AD3d 1072 (3d Dept. 2008), appeal denied 11 NY3d 716 (2009).

Page 25 of 27
Kenny, J.F., Barber, N.L., Hutson, S.S., Linsey, K.S., Lovelace, J.K., and Maupin, M.A., 2009. Estimated use of water in the United States in 2005: U.S. Geological Survey Circular 1344, 52 p.
Loar, J.M., J.S. Griffith and K.D. Kumar. 1978. An analysis of factors influencing the impingement of threadfin shad at power plants in the Southeastern United States. In L.D. Jensen (Editor). Fourth National Workshop on entrainment and Impingement. EA Communications, Melvile, New York. pp 245-255.
McLaren, J. B. and L. R. Tuttle Jr. (2000). Fish survival on fine mesh traveling screens. Environmental Science and Policy 3(S): 369-376.
National Pollutant Discharge Elimination System: Regulations to Establish Requirements for Cooling Water Intake Structures at Phase II Existing Facilities; Final Rule, 69 Fed.Reg. 41,576 (July 9, 2004) (codified at 40 C.F.R. pts. 9, 122-25) [Phase II Rule].
Normandeau and BioSonics. 2008. §316(b) Studies performed during 2006 and 2007 at the James A. FitzPatrick Nuclear Power Plant (SPDES Permit No. NY 0020209) Lycoming, NY.
NRG Dunkirk Power, LLC. 2007. Cooling Water Intake Structure Design and Construction Technology Plan. Prepared by Shaw environmental Services.
NYISO (2003). Load and Capacity Data “Gold Book”. April 2003.
NYISO (2004) Load and Capacity Data “Gold Book”. April 2004.
NYISO (2005) Load and Capacity Data “Gold Book”. April 2005.
NYISO (2006) Load and Capacity Data “Gold Book”. April 2006.
NYISO (2007) Load and Capacity Data “Gold Book”. April 2007.
NYISO (2008) Load and Capacity Data “Gold Book”. April 2008.
Riverkeeper, Inc. v. EPA, 358 F.3d 174 (2d. Cir. 2004).
Riverkeeper, Inc. v Johnson, 52 AD3d 1072 (3d Dept. 2008), appeal denied 11 NY3d 716 (2009).
Ross, Q. E., D. J. Dunning, J. K. Menezes, M. J. Kenna Jr. and G. W. Tiller (1996). Reducing impingement of Alewives with high-frequency sound at a power plant intake on Lake Ontario. North American Journal of Fisheries Management 16: 548-559.
Ross, Q. E., D. J. Dunning, R. Thorne, J. K. Menezes, G. W. Tiller and J. K. Watson (1993). Response of Alewives to high-frequency sound at a power plant intake on Lake Ontario. North American Journal of Fisheries Management 13: 291-303.
Shaw Environmental, Inc. 2007. Cooling Water Intake Structure Design & Construction Technology Review. NRG Huntley Power, LLC. Huntley Generating Station. Prepared for NRG by Shaw Environmental, Inc. October 1, 2007.
Shaw Environmental, Inc. and Normandeau Associates, Inc. 2007. Cooling Water Intake Structure Design & Construction Technology Review. NRG Arthur Kill Power LLC.

Page 26 of 27
Arthur Kill Generating Station. Prepared for NRG by Shaw Environmental, Inc. And Normandeau Associates, Inc. August 31, 2007.
Title 6 of the Official Compilation of Codes, Rules and Regulations of the State of New York (6 NYCRR) Part 704.
Veil, J. A. 2000. Potential impacts of 316(b) regulatory controls on economics, electric
reliability, and the environment. Environmental Science & Policy 3 (2000): S1-S6.