The Reines-Cowan Experiments (Detección Del Neutrino)
12
I n 1951, when Fred Reines first contemplated an experiment to detect the neutrino, this particle was still a poltergeist, a fleeting yet haunting ghost in the world of physical reality. All its properties had been deduced but only theoretically. Its role was to carry away the missing energy and angular momentum in nuclear beta Number 25 1997 Los Alamos Science Los Alamos Science Number 25 1997 Detecting the Poltergeist The Reines-Cowan Experiments decay, the most familiar and widespread manifestation of what is now called the weak force. The neutrino surely had to exist. But some- one had to demonstrate its reality. The relentless quest that led to the detection of the neutrino started with an energy crisis in the very young field of nuclear physics. Savannah Team 1955 The Hanford Team: (on facing page, left to right, back row) F. Newton Hayes, Captain W. A. Walker, T. J. White, Fred Reines, E. C. Anderson, Clyde Cowan, Jr., and Robert Schuch (inset); not all team members are pictured. The Savannah River Team: (clockwise, from lower left foreground) Clyde Cowan, Jr., F. B. Harrison, Austin McGuire, Fred Reines, and Martin Warren; (left to right, front row) Richard Jones, Forrest Rice, and Herald Kruse. 1953-1956 Hanford Team 1953
description
termodinámica
Transcript of The Reines-Cowan Experiments (Detección Del Neutrino)

In 1951, when Fred Reines first contemplated an experiment to detect the neutrino, this particle was still a poltergeist, a fleeting yet
haunting ghost in the world of physical reality. All its properties had been deduced but only theoretically. Its role was to carry away the missingenergy and angular momentum in nuclear beta
Number 25 1997 Los Alamos Science Los Alamos Science Number 25 1997
Detecting the PoltergeistThe Reines-Cowan Experiments
decay, the most familiar and widespread manifestation of what is now called the weakforce. The neutrino surely had to exist. But some-one had to demonstrate its reality. The relentlessquest that led to the detection of the neutrino started with an energy crisis in the very youngfield of nuclear physics.
Savannah Team 1955
The Hanford Team: (on facing page, left to right, back row) F. Newton Hayes, Captain W. A. Walker, T. J. White, Fred Reines,
E. C. Anderson, Clyde Cowan, Jr., and Robert Schuch (inset); not all team members are pictured.
The Savannah River Team: (clockwise, from lower left foreground) Clyde Cowan, Jr., F. B. Harrison, Austin McGuire, Fred Reines,
and Martin Warren; (left to right, front row) Richard Jones, Forrest Rice, and Herald Kruse.
1953-1956
Hanford Team 1953

The Missing Energy and theNeutrino Hypothesis
During the early decades of this entury, when radioactivity was firsteing explored and the structure of thetomic nucleus unraveled, nuclear betaecay was observed to cause the trans-
mutation of one element into another.n that process, a radioactive nucleusmits an electron (or a beta ray) and ncreases its positive charge by one nit to become the nucleus of anotherlement. A familiar example is the betaecay of tritium, the heaviest isotope f hydrogen. When it undergoes betaecay, tritium emits an electron andurns into helium-3.
The process of beta decay was udied intensely. In particular,
cientists measured the energy of themitted electron. They knew that a efinite amount of nuclear energy waseleased in each decay reaction andhat, by the law of energy conservation,he released energy had to be shared by he recoil nucleus and the electron.
The requirements of energy conser-ation, combined with those of momen-um conservation, implied that the lectron should always carry away theame amount of energy (see the boxBeta Decay and the Missing Energy”n the facing page). That expectationeemed to be borne out in some experi-
ments, but in 1914, to the great conster-ation of many, James Chadwickhowed definitively that the electronsmitted in beta decay did not have onenergy or even a discrete set of ener-ies. Instead, they had a continuouspectrum of energies. Whenever thelectron energy was at the maximumbserved, the total energy before andfter the reaction was the same, that is,nergy was conserved. But in all otherases, some of the energy released inhe decay process appeared to be lost.
In late 1930, Wolfgang Pauli ndeavored to save the time-honoredaw of energy conservation by propos-ng what he himself considered a desperate remedy” (see the box “The
Desperate Remedy” on this page)—
4 December 1930Gloriastr.
ZürichPhysical Institute of theFederal Institute of Technology (ETH)ZürichDear radioactive ladies and gentlemen,As the bearer of these lines, to whom I ask you to listen
graciously, will explain more exactly, considering the‘false’ statistics of N-14 and Li-6 nuclei, as well as thecontinuous b-spectrum, I have hit upon a desperate remedy to save the “exchange theorem” * of statistics and the energytheorem. Namely [there is] the possibility that there couldexist in the nuclei electrically neutral particles that Iwish to call neutrons, ** which have spin 1/2 and obey theexclusion principle, and additionally differ from light quan -ta in that they do not travel with the velocity of light:The mass of the neutron must be of the same order of magni -tude as the electron mass and, in any case, not larger than0.01 proton mass. The continuous b-spectrum would then becomeunderstandable by the assumption that in b decay a neutronis emitted together with the electron, in such a way thatthe sum of the energies of neutron and electron is constant.
Now, the next question is what forces act upon the neu -trons. The most likely model for the neutron seems to me tobe, on wave mechanical grounds (more details are known bythe bearer of these lines), that the neutron at rest is amagnetic dipole of a certain moment m. Experiment probablyrequired that the ionizing effect of such a neutron shouldnot be larger than that of a g ray, and thus m should prob -ably not be larger than e.10 -13 cm.
But I don’t feel secure enough to publish anything about this idea, so I fi rst turn confi dently to you, dear radioactives, with a question as to the situation concerningexperimental proof of such a neutron, if it has somethinglike about 10 times the penetrating capacity of a g ray.
I admit that my remedy may appear to have a small apriori probability because neutrons, if they exist, wouldprobably have long ago been seen. However, only those whowager can win, and the seriousness of the situation of thecontinuous b-spectrum can be made clear by the saying of myhonored predecessor in offi ce, Mr. Debye, who told me a shortwhile ago in Brussels, “One does best not to think aboutthat at all, like the new taxes.” Thus one should earnestlydiscuss every way of salvation.—So, dear radioactives, put it to test and set it right.—Unfortunately, I cannot personally appear in Tübingen, since I am indispensable hereon account of a ball taking place in Zürich in the nightfrom 6 to 7 of December.—With many greetings to you, also toMr. Back, your devoted servant,
W. Pauli
* In the 1957 lecture, Pauli explains, “This reads: exclusionprinciple (Fermi statistics) and half-integer spin for an oddnumber of particles; Bose statistics and integer spin for aneven number of particles.”
This letter, with the footnote above, was printed in the September 1978 issue of Physics Today.
** Pauli originally called the new particle the neutron (or the “neutral one”). Later, Fermi renamed it the neutrino (or the “little neutral one”).
Number 25 1997 Los Alamos Science
The Reines-Cowan Experiments
Beta Deca y and the Missing Ener gy
In all types of radioactive decay, a radioactive nucleus does not only emit alpha, beta, or gamma radiation, but it also converts
mass into energy as it goes from one state of definite energy (or equivalent rest mass M1) to a state of lower energy (or smaller
rest mass M2). To satisfy the law of energy conservation, the total energy before and after the reaction must remain constant, so
the mass difference must appear as its energy equivalent (kinetic energy plus rest mass energy) among the reaction products.
Early observations of beta decay suggested that a nucleus
decays from one state to a state with one additional unit of
positive charge by emitting a single electron (a beta ray).
The amount of energy released is typically several million
electron volts (MeV), much greater than the rest mass energy
of the electron (0.51 MeV). Now, if a nucleus at rest decays
into two bodies—the final nucleus and the electron—the law
of momentum conservation implies that the two must separate
with equal and opposite momentum (see top illustration).
Thus, conservation of energy and momentum implied that the
electron from a given beta-decay process would be emitted
with a constant energy.
Moreover, since a nucleus is thousands of times heavier than
an electron, its recoil velocity would be negligible compared with
that of the electron, and the constant electron energy would
carry off just about all the energy released by the decay.
The graph (center) shows the unexpected results obtained
from experiment. The electrons from beta decay were not
emitted with a constant energy. Instead, they were emitted
with a continuous spectrum of energies up to the expected
value. In most instances, some of the energy released in the
decay appeared to be lost. Scientists of the time wondered
whether to abandon the law of energy conservation when
considering nuclear processes.
Three-Body Decay and the Neutrino Hypothesis. Pauli’s solution to the energy crisis was to propose that the
nucleus underwent beta decay and was transformed into three
bodies: the final nucleus, the electron, and a new type of
particle that was electrically neutral, at least as light as the
electron, and very difficult to detect (see bottom illustration).
Thus, the constant energy expected for the electron alone was
really being shared between these two light particles, and the
electron was being emitted with the observed spectrum of
energies without violating the energy conservation law.
Pauli made his hypothesis in 1930, two years before Chadwick
discovered the neutron, and he originally called the new parti-
cle the neutral one (or neutron). Later, when Fermi proposed his famous theory of beta decay (see the box “Fermi’s Theory of
Beta Decay and Neutrino Processes” on the next page), he renamed it the neutrino, which in Italian means the “little neutral one.”
Two-Body Final State
Three-Body Final State
EnergyEndpoint ofspectrum
Expected electronenergy
Num
ber
of e
lect
rons
Electron and neutrino share the available energy.
Tritium (2, 1)
Helium-3 (1, 2)
e–
(N, Z) (N − 1, Z + 1) + e– ,
Electron Antineutrino
(N, Z) (N − 1, Z + 1) + e– + ν .
where N = number of neutrons, andZ = number of protons.
Observed spectrum of energies
Tritium (2, 1)
Helium-3 (1, 2)
Recoil nucleus and electron separate with equal and opposite momentum.
he Reines-Cowan Experiments
Los Alamos Science Number 25 1997
The Desperate Remedy

ously creates an electron and an anti-neutrino (see the box on this page). Theforce can act on a free neutron or on aneutron bound inside a nucleus.
Fermi’s theory is remarkable in thatit accounts for all the observed proper-ties of beta decay. It correctly predictsthe dependence of the radioactive-nucleus lifetime on the energy releasedin the decay. It also predicts the correctshape of the energy spectrum of theemitted electrons. Its success was taken
as convincing evidence that a neutrinois indeed created simultaneously withan electron every time a nucleus disin-tegrates through beta decay.
Almost as soon as the theory wasformulated, Hans Bethe and RudolfPeierls understood that Fermi’s theoryof the weak force suggested a reactionby which a free neutrino would interactwith matter and be stopped. As Betheand Bacher noted (1936),
“[I]t seems practically impossible to
detect neutrinos in the free state, i.e.,after they have been emitted by the radioactive atom. There is only oneprocess which neutrinos can certainlycause. That is the inverse beta process,consisting of the capture of a neutrinoby a nucleus together with the emissionof an electron (or positron).”
Unfortunately, the weak force is soweak that the probability of inverse betadecay was calculated to be close to zero.A target would have to be light-years
new subatomic particle that shares the vailable energy with the electron. Toroduce the observed energy spectrum,his new particle, later named the neu-ino (“little neutral one”), could have a
mass no larger than that of the electron. had to have no electric charge. Andke electrons and protons, the only sub-tomic particles known at that time, itad to be a fermion, a particle havingalf-integer spin (or intrinsic angular
momentum). It would therefore obey
the Pauli exclusion principle accordingto which no two identical neutrinos canbe in the same state at the same time.Once created, the neutrino would speedaway from the site at, or close to, thespeed of light. But Pauli was concernedthat the neutrinos he had postulatedshould have been already detected.
Shortly thereafter, in a brilliant burstof insight, Enrico Fermi formulated a mathematical theory that involved the neutrino and that has endured with
little modification into the present. This theory postulates a force for beta decayand incorporates several brand-newconcepts: Pauli’s neutrino hypothesis,Dirac’s ideas about the creation of par-ticles, and Heisenberg’s idea that theneutron and the proton were related toeach other. In Fermi’s theory of betadecay, this weak force, so called because it was manifestly much weakerthan the electromagnetic force, turns a neutron into a proton and simultane-
In 1934, long before the neutrino was detected in an experiment, Fermi gave the
neutrino a reality by writing down his simple and brilliant model for the beta decay
process. This model has inspired the modern description of all weak-interaction
processes. Fermi based his model on Dirac’s quantum field theory of electromagnet-
ism in which two electron currents, or moving electrons, exert force on each other
through the exchange of photons (particles of light). The upper diagram represents
the interaction between two electrons. The initial state of the system is on the left,
and the final state is on the right. The straight arrows represent currents, or moving
electrons, and the wiggly line between the currents represents the emission of
a photon by one current and its absorption by another. This exchange of a photon
causes the electrons to repel each other. Note that the photon has no mass, a fact
related to the unlimited range of the electromagnetic force.
The fundamental process that takes place in beta decay (see lower diagram) is the
change of a neutron into a proton, an electron, and an antineutrino. The neutron may
be a free particle, or it may be bound inside the nucleus.
In analogy with quantum electrodynamics, Fermi represented beta decay as an
interaction between two currents, each carrying the weak charge. The weak charge
is related to the electric charge. Unlike the electromagnetic force, however, the weak
force has a very short range. In Fermi’s theory, the range of the force is zero, and
the currents interact directly at a single point. The interaction causes a transfer of
electric (weak) charge between the currents so that, for example, the neutron current
gains one unit of charge and transforms into a proton current, while the electron
current loses one unit of charge and transforms into a neutrino current.*
Because Fermi’s theory is a relativistic quantum field theory, a single current-current
interaction describes all weak-interaction processes involving the neutron, proton,
electron, and neutrino or their antiparticles. As a result, we can represent all these
weak-interaction processes with one basic diagram (on facing page, upper left corner).
In analogy with the electric current, each weak current is depicted as a moving particle
(straight arrow) carrying the weak charge. At the point where they interact, the two currents
exchange one unit of electric (weak) charge.
One can adapt the basic diagram to each reaction by deciding which particles (or antiparti-
cles) are to be viewed as the initial state and which as the final state. (Particles are
represented by arrows pointing to the final state, whereas antiparticles point backward, to the
initial state.) Since all the reactions described by the diagram stem from the same
interaction, they have the same overall strength given by GF, Fermi’s constant. However,
kinematic factors involving the amount and distribution of available energy and momentum
in the initial and final states affect the overall reaction rate. Three reactions are illustrated in the lower diagrams.
In the first reaction, neutron beta decay (lower left), the neutron starts out alone, but the interaction of two currents is responsible for the
decay. The neutron (current) turns into a proton, and the charge is picked up by the electron/neutrino (current) that creates a particle (electron)
and an antiparticle (antineutrino). Note that the direction of the arrow for the neutrino points backwards, to the initial state, to indicate that an
antineutrino has appeared in the final state.
In the second reaction, electron capture (lower center), the initial state is a proton (current) and an electron (current). The weak interaction
between the two currents triggers the exchange of one unit of charge so that the proton turns into a neutron while the electron turns into a
neutrino. The reverse process is also possible.
In the third case, inverse beta decay (lower right), the initial state is an antineutrino (current) and a proton (current). The weak interaction
between the two currents triggers the exchange of one unit of charge so that the antineutrino turns into an antielectron (positron) while the
proton turns into a neutron. Again, the arrows pointing backward indicate that an antineutrino in the initial state has transformed into an
antielectron in the final state. The reverse process is also possible.
he Reines-Cowan Experiments
Los Alamos Science Number 25 1997
The Reines-Cowan Experiments
Number 25 1997 Los Alamos Science
Electron Scattering
Electron current
Electron current
Neutron Beta Decay
n
Neutron
Antineutrino
Electron
Proton
Photon
e– e–
e–
e–
p
e–
Initialstate
Finalstate
ν
Fermi’ s Theor y of Beta Deca y and Neutrino Pr ocesses
Initialstate
Finalstate Initial
stateFinalstate
Initialstate
Finalstate
νNeutron Beta Decay Electron Capture Inverse Beta Decay
n
e– + p n + ν ν + p n + e+ n
e+
e–
p
pn
ν
GF
GF GF
e–
pν
p + e– + ν n
Nucleon current(neutron/proton)
Lepton current(electron/neutrino)
Basic Current-Current Interaction
n
ν
GF
e–
p
* In the modern theory, the currents interact through the exchange of the W, a very heavy particle analogous to the photon. The W carries one unit of electric charge and one unit of weak isotopic charge between the weak currents.

interact with a nucleus through the weakforce and will induce the transformationof a proton into a neutron. This inverseof the usual beta-decay process results in a nucleus with one less unit of positive charge. That charge is picked up by the antineutrino, which transformsinto a positron:
nw + N (n, p) → e+ + N (n+1, p–1) ,
where n equals the number of neutronsand p equals the number of protons. If the nucleus happens to be that of hydrogen (a single proton), then the interaction produces a neutron and apositron:
nw + p → n + e+ .
Reines and Cowan chose this latterreaction, the inverse beta decay on protons, to detect the free neutrino. Thenuclear fission bomb would be theirsource of an intense flux of neutrinos(Figure 1). But they also needed to design a very large detector containinga sufficient number of target protonsthat would stop a few neutrinos. AsReines observed (unpublished notes),
“Our crude knowledge of the expectedenergy spectrumof neutrinos from a fis-sion bomb suggested that the inversebeta decay reaction would occur severaltimes in a several-ton detector locatedabout 50 meters from the tower-basedexplosion of a 20-kiloton bomb. (Anyone untutored in the effects of nuclear explosions would be deterredby the challenge of conducting an experiment so close to the bomb, butwe knew otherwise from experienceand pressed on). The detector wedreamed up was a giant liquid scintillation device, which we dubbed‘El Monstro.’ This was a daring extrap-olation of experience with the newlyborn scintillation technique. The biggestdetector until Cowan and I came alongwas only a liter or so in volume.”
Their initial scheme was to use thenewly discovered, liquid, organic scin-tillators as both the target for the neutri-nos (these liquids had a high proportion
of hydrogen) and the medium to detectthe positron from inverse beta decay.
In 1950, several groups discoveredthat transparent organic liquids emitflashes of visible light when a chargedparticle or a gamma ray passes throughthem. These liquids had first been purified and then added to certaincompounds. The light flashes are veryweak but useful because their intensityis proportional to the energy of thecharged particles or gammas. In a liquid scintillation counter, the light iscollected by highly sensitive photo-multiplier tubes located on the bound-ary of the detector. These phototubesconvert light into electrical signals in proportion to the light intensity.
Figure 2 outlines the processes thatwould convert the energy of a positronfrom inverse beta decay into a measurablesignal. The first small liquid-scintillationcounters had already been developed, andone of those initial developers, F. B.(Kiko) Harrison, was at Los Alamos.
Wright Langham, leader of the Health Division’s research group, had recruitedHarrison to help design such counters formeasuring radiation in biological samples.Harrison was one of the designers of theprompt-coincidence technique (see thesection “The First Large Detector” onpage 14) to distinguish spurious noise inthe photomultiplier tubes from the signalsgenerated by light flashes.
Once the idea for a new detector hadbeen shaped, Reines and Cowan devel-oped an audacious design for their experiments (shown in Figure 1). As Cowan (1964) vividly described it,
“We would dig a shaft near ‘groundzero’ about 10 feet in diameter andabout 150 feet deep. We would put atank, 10 feet in diameter and 75 feetlong on end at the bottom of the shaft.We would then suspend our detectorfrom the top of the tank, along with itsrecording apparatus, and back-fill theshaft above the tank.
“As the time for the explosion
The Reines-Cowan Experiments
Number 25 1997 Los Alamos Science
hick before it would have a goodhance of stopping a neutrino. The pos-ibility of detecting the neutrinoeemed nil. But two things changedhat prospect: first, the advent of veryntense sources of neutrinos—fission
bombs and fission reactors—and, sec-ond, the intense drive of a young manrom New Jersey to make his mark inhe world of fundamental physics.
Fred Reines and Los Alamos
Fred Reines had become interestedn mathematics and physics whiletudying at the Stevens Institute of
Technology, and during graduate stud-es at New York University, he wrote Ph.D. thesis elaborating on Bohr’siquid-drop model of nuclear fission. In1944, he joined the Manhattan Projectt Los Alamos and became a member
of the Theoretical Division. During the late forties and early
fifties, after the first atomic bomb hadbeen built at Los Alamos, the Labora-ory’s mission was intensely focused on
building a reliable stockpile of fissionweapons and developing the thermonu-lear bomb. Reines was in charge ofeveral projects related to testing
nuclear weapons in the Pacific. In ret-ospect, Reines explains (unpublished
notes for a talk given at Los Alamos):“Bomb testing was an exercise in
hinking big, in the ‘can do’ spirit. Inhe George Shot, for example, the sig-
nal cables running from the shot towero the instrumentation bunker had to
be shielded from the enormous gamma-ay flux from the explosion; otherwise,hat flux would generate a huge currenturge in those cables that would
destroy all our electronics. The onlyhing available for shielding on thecale we needed was the island itself.
So we dug up one side of the islandnd put it on top of the other.
“That can do spirit permeated ourhinking. Whenever we thought about
new projects, the idea was to set themost interesting (and fundamental) goalwithout initial concern as to feasibility
or practical uses. We could count onthe latest technology being available to us at Los Alamos as a result of theinstrumentation needs of the weaponsprogram, and that fact fed our confi-dence. To his credit, Norris Bradbury,the Director who took over after Oppenheimer, lent enormous support to surrounding the nuclear weapons effort at Los Alamos with a broad scientific and technological base.”
The bomb-test steering and liaisongroup, in which Fred Reines partici-pated, was interested in fundamentalquestions. New physics experimentsthat could be mounted as part of nuclear weapons tests were the topic of numerous free-ranging discussionsin the group. It seemed appropriate thatthe unusually intense flux of thermalradiation, neutrons, and gamma raysproduced by the bomb be used to studynew phenomena.
The scientists in this group wereeven aware of the incredibly intenseflux of antineutrinos produced when thefissioning, or splitting, of atomic nucleiduring the neutron chain reaction givesrise to a host of unstable nuclei. Theweak interactions then become impor-tant in changing the identity of thosenuclei as they follow their decay pathsto lower and lower energy states. Eachfission event gives rise to an average ofsix beta-decay processes, each of whichproduces an antineutrino. Thus, thosebeta decays result in a short but intenseburst of antineutrinos.
In 1951, Reines thought about using that intense burst in an experi-ment designed to detect the neutrino.He had returned from the very success-ful Greenhouse tests in Eniwetok Atoll,in the Pacific, and became captivatedby the “impossible challenge” to detectthe elusive free neutrino using neutri-nos from the bomb. After having been involved for seven years in theweapons program, Reines asked J. Car-son Mark, leader of the Theoretical Division, for some time to think aboutmore fundamental questions.
The bomb was not only an intenseneutrino source but also so short-lived
that the number of background eventsmimicking neutrino-induced eventswould be minimized. That summer,Reines mentioned his plan to EnricoFermi and even described the need forwhat was then considered to be a verylarge scale detector. Reines estimatedthat a sensitive mass of about one tonwould be needed to stop a few neutri-nos. At the time, Reines did not knowhow to build such a large detector, andevidently, neither did Fermi. However,both Fermi and Hans Bethe thoughtthat the bomb was the most promisingneutrino source.
A few months later, Reines was ableto interest one of his Los Alamos col-leagues to participate in his quest. AsReines observed (unpublished notes),“It was my singular good fortune to bejoined by Clyde L. Cowan, Jr., whom Ihad met in connection with OperationGreenhouse and who became my verystimulating and capable collaborator.”
Cowan had studied chemical engi-neering as an undergraduate and, during World War II, was awarded the Bronze Star for his work on radarat the British Branch of the RadiationLaboratory of the Massachusetts Institute of Technology. His Ph.D. thesis at George Washington Universitywas on the absorption of gamma radia-tion. In 1949, he joined Los AlamosScientific Laboratory. Like Reines, he became heavily involved in theweapons testing program in the Pacific.In late 1951, Reines and Cowan began “Project Poltergeist,” the first experiment in neutrino physics.
The Signal of the Poltergeist
What happens when neutrinos entermatter? Most of the time, they passstraight through without scattering, but Fermi’s theory of the weak force predicts that the neutrino can induce an inversion of beta decay (see the box“Fermi’s Theory of Beta Decay andNeutrino Processes” on page 8). In par-ticular, the antineutrino (the antiparticleof the neutrino) will occasionally
he Reines-Cowan Experiments
0 Los Alamos Science Number 25 1997
Fireball
Vacuumpump
Feathers andfoam rubber
Vacuumline
Vacuumtank
Suspendeddetector
Back fill
Buried signal linefor triggering release
Nuclear explosive
40 m
30 m
Figure 1. Detecting Neutrinos from a Nuclear Explosion Antineutrinos from the fi reball of a nuclear device would impinge on a liquid scintilla -
tion detector suspended in the hole dug below ground at a distance of about
40 meters from the 30-meter-high tower. In the original scheme of Reines and Cowan,
the antineutrinos would induce inverse beta decay, and the detector would record
the positrons produced in that process. This fi gure was redrawn courtesy of Smithsonian
Institution.

surface radioactivity had died away sufficiently) and dig down to the tank,recover the detector, and learn the truthabout neutrinos!”
This extraordinary plan was actuallygranted approval by Laboratory Director Norris Bradbury. Although the experiment would only be sensitive toneutrino cross sections of 10–40 squarecentimeters, 4 orders of magnitude larger than the theoretical value, Bradbury was impressed that the planwas sensitive to a cross section 3 ordersof magnitude smaller than the existingupper limit.1 As Reines explains in retrospect (unpublished notes for a talkgiven at Los Alamos),
“Life was much simpler in thosedays—no lengthy proposals or complexreview committees. It may have beenthat the success of Operation Green-house, coupled with the blessing givenour idea by Fermi and Bethe, eased thepath somewhat!”
As soon as Bradbury approved theplan, work started on building and testing El Monstro. This giant liquid-scintillation device was a bipyramidaltank about one cubic meter in volume.Four phototubes were mounted on eachof the opposing apexes, and the tankwas filled with very pure toluene activated with terphenyl so that itwould scintillate. Tests with radioactivesources of electrons and gamma raysproved that it was possible to “see” into a detector of almost any size.
Reines and Cowan also began toconsider problems associated with scaling up the detector. At the sametime, work was proceeding on drillingthe hole that would house the experi-ment at the Nevada Test Site and on designing the great vacuum tank
and its release mechanism.But one late evening in the fall of
1952, immediately after Reines andCowan had presented their plans at aPhysics Division seminar, a new ideawas born that would dramaticallychange the course of the experiment. J. M. B. Kellogg, leader of thePhysics Division, had urged Reinesand Cowan to review once more thepossibility of using the neutrinos froma fission reactor rather than thosefrom a nuclear explosion.
The neutrino flux from an explosionwould be thousands of times larger thanthat from the most powerful reactor.The available shielding, however,would make the background noise fromneutrons and gamma rays about the
same in both cases. Clearly, the nuclearexplosion was the best available approach—unless the background couldsomehow be further reduced.
Suddenly, Reines and Cowan real-ized how to do it. The original plan hadbeen to detect the positron emitted ininverse beta decay (see Figure 2), aprocess in which the weak interactioncauses the antineutrino to turn into apositron and the proton to turn into aneutron. Being an antielectron, thepositron would quickly collide with anelectron, and the two would annihilateeach other as they turned into pure energy in the form of two gamma raystraveling in opposite directions. Eachgamma ray would have an energyequivalent to the rest mass of the
The Reines-Cowan Experiments
Number 25 1997 Los Alamos Science
pproached, we would start vacuumumps and evacuate the tank as highlys possible. Then, when the countdowneached ‘zero,’ we would break the uspension with a small explosive, llowing the detector to fall freely in the
vacuum. For about 2 seconds, the fallingdetector would be seeing the antineutri-nos and recording the pulses from themwhile the earth shock [from the blast]passed harmlessly by, rattling the tankmightily but not disturbing our falling
detector. When all was relatively quiet,the detector would reach the bottom ofthe tank, landing on a thick pile of foamrubber and feathers.
“We would return to the site of the shaft in a few days (when the
he Reines-Cowan Experiments
2 Los Alamos Science Number 25 1997
Oscilloscope
e+
e–
uv
Bluelight
Current
PMT
PMT
PMT
PMT
PMT
PMT
PMT
PMT
(2)Ionizationcascade
(3)Visible light
Terphenyl
Liquid scintillator
Neutron
Antineutrino
Proton
(1)Inverse
beta decay
γ
γ
Pulse heightanalyzer
1H. R. Crane (1948) deduced the upper limit of10–37 square centimeters on the cross sections forneutrino-induced ionization and inverse betadecay. This upper limit was based on null resultsfrom various small-scale experiments attemptingto measure the results of neutrino absorption andfrom a theoretical limit deduced from the maxi-mum amount of solar neutrino heating that couldtake place in the earth’s interior and still agreewith geophysical observations of the energyflowing out of the earth.
Figure 3. The Double Signature of Inverse Beta DecayThe new idea for detecting the neutrino was to detect both products of inverse beta
decay, a reaction in which an incident antineutrino (red dashed line) interacts with a
proton through the weak force. The antineutrino turns into a positron ( e1), and the
proton turns into a neutron ( n). In the fi gure above, this reaction is shown to take
place in a liquid scintillator. The short, solid red arrow indicates that, shortly after it
has been created, the positron encounters an electron, and the particle and antiparticle
annihilate each other. Because energy has to be conserved, two gamma rays are emit -
ted that travel in opposite directions and will cause the liquid scintillator to produce a
flash of visible light. In the meantime, the neutron wanders about following a random
path (longer, solid red arrow) until it is captured by a cadmium nucleus. The resulting
nucleus releases about 9 MeV of energy in gamma rays that will again cause the liquid
to produce a tiny fl ash of visible light. This sequence of two fl ashes of light separated
by a few microseconds is the double signature of inverse beta decay and confi rms the
presence of a neutrino.
Incidentantineutrino
Positronannihilation
Inverse beta
decay
Gamma rays
Gamma rays
e+
n
Neutron capture
Liquid scintillator and cadmium
eines and Cowan planned to build a
ounter filled with liquid scintillator and
ned with photomultiplier tubes (PMTs),
he “eyes” that would detect the
ositron from inverse beta decay, which
s the signal of a neutrino-induced
vent. The figure illustrates how the liq -
id scintillator converts a fraction of the
nergy of the positron into a tiny flash
f light. The light is shown traveling
hrough the highly transparent liquid
cintillator to the PMTs, where the
hotons are converted into an electronic
ulse that signals the presence of the
ositron. Inverse beta decay (1) begins
hen an antineutrino (red dashed line)
nteracts with one of the billions and
illions of protons (hydrogen nuclei) in
he molecules of the liquid. The weak
harge-changing interaction between the
antineutrino and the proton causes the
proton to turn into a neutron and the
antineutrino to turn into a positron ( e1).
The neutron wanders about undetected.
The positron, however, soon collides
with an electron ( e2), and the particle-
antiparticle pair annihilates into two
gamma rays ( g) that travel in opposite
directions. Each gamma ray loses about
half its energy each time it scatters
from an electron (Compton scattering).
The resulting energetic electrons
scatter from other electrons and radiate
photons to create an ionization cascade
(2) that quickly produces large numbers
of ultraviolet (uv) photons.
The scintillator is a highly transparent
liquid (toluene) purposely doped with
terphenyl. When it becomes excited by
absorbing the uv photons, it scintillates
by emitting visible photons as it returns
to the ground (lowest-energy) state (3).
Because the liquid scintillator is trans -
parent to visible light, about 20 percent
of the visible photons are collected by
the PMTs lining the walls of the
scintillation counter. The rest are
absorbed during the many reflections
from the counter walls. A visible
photon releases an electron from the
cathode of a phototube. That electron
then initiates the release of further
electrons from each dynode of the PMT,
a process resulting in a measurable
electrical pulse. The pulses from all the
tubes are combined, counted,
processed, and displayed on an
oscilloscope screen.
igure 2. Liquid Scintillation Counter for Detecting the Positron from Inverse Beta Decay

4
lectron, namely, 0.51 million electronolt (MeV). The two gamma rays
would accelerate electrons throughCompton scattering and initiate a cas-ade of electrons that would eventuallyause the liquid to scintillate. The tiny
flash of visible light, efficiently onverted into an electronic pulse,
would be the signal of the positron.The new idea was to detect not only
he positron but also the neutron (seeFigure 3). Once produced, the neutronounces around and slows down as itollides with protons. It can be capturedy a proton to produce deuterium, oreavy hydrogen. But if a nucleus suchs cadmium is present, the neutron has a
much greater chance of being captured.Adding a cadmium salt to the organiccintillator dramatically increases theross section for absorbing (low-energy)eutrons. The capture process releasesbout 9 MeV of energy in gamma rays.
The average time between the flash f light from the positron-electron nnihilation and that from the neutron apture is a few microseconds.
Electronic circuits could be designed toetect this “delayed-coincidence” signa-ure, two flashes of light (each within awell-defined energy range) separated by microseconds, and provide a powerfulmeans to discriminate the signature of nverse beta decay from backgroundoise. Thus, using the much smaller fluxf reactor neutrinos became feasible.
As Cowan (1964) remembers,“Instead of detecting a burst of
eutrinos in a second or two comingrom the fury of a nuclear explosion,
we would now be able to watch atiently near a reactor and catch onevery few hours or so. And there are
many hours available for watching in month—or a year.”
The First Large Detector
The group spent that winter uilding the detectors, developing arious liquid-scintillator compositions,nd testing the response of the etectors to gamma rays. Each detector
was about 28 inches in diameter and30 inches high (see photo on thispage), and 90 photomultiplier tubespenetrated its curved walls.
The phototubes were connected intwo interleaved arrays, each of whichwould produce an electrical pulse in response to a light signal in the detector.The two pulses would then be sent to aprompt-coincidence circuit, whichwould accept them as a bona fide signal
only if they arrived simultaneously.That prompt-coincidence requirementhelped eliminate counting the spurious dark current that arose spontaneously and at random in the phototubes themselves.
The team worked in an isolated, unheated building. Cowan (1964) reports how “some of our group sweptthe snow away from outside the build-ing and set about casting many largeblocks of paraffin wax and borax foruse as neutron shielding when wewould go to a reactor. Others beganmixing gallons of liquid scintillator inbatches with varying composition.”
They had to use electrical heaters to
keep the toluene scintillator warm; otherwise, it would turn from transpar-ent to cloudy. Soon, they discoveredthat one of the brands of mineral oilcarried by a local druggist, whenmixed with suitable chemicals, couldserve as another liquid scintillator.Having a hydrogen density differentfrom that of toluene, the mineral oilwould yield a different measured ratefor inverse beta decay and thus providea consistency check on the experi-ment—of course, if the experimentalerror could be made small enough tomake the difference visible.
The threesome who carried the primary responsibility for developingand testing the detector were F. NewtonHayes, Robert Schuch, and Ernest C.Anderson from Wright Langham’s biomedical/health physics researchgroup. Using various radioactivegamma-ray sources, they discovered thattheir large-volume liquid scintillation detectors were extremely efficient at detecting gamma rays, enough to revolutionize the counting of smallamounts of radioactivity in bulk samples. The group realized they couldtest the radioactive content of the materials used to construct the detectorand eliminate those that would add unduly to the background.
As Cowan (1964) reports, “We builta cylindrical well into one of the detectors and proceeded to put quantitiesof steel, liquids, wax, and other materialsinto it for testing. We found that brassand aluminum were quite radioactivecompared to iron and steel, and that thepotassium in the glass envelopes of ourphotomultiplier tubes would contribute tothe detector backgrounds.
“During this time, one of our group,Robert Schuch, proposed making the wellin the detector a bit larger so that wemight be able to put a human being intothe detector. This was done, and a number of people, including our secretary, were trussed up and loweredinto the 18-inch hole. We found quite a detectable counting rate from everyone.It was due to the radioactive potassium-40naturally present in the body.”
The Hanford Neutrino DetectorThe background photo is a top view of
the neutrino detector used in the Hanford
experiments. It shows the interior of the
10-cubic-foot vat for the liquid scintillator
and the 90 photomultiplier tubes, each
with a 2-inch-diameter face that had a
thin, photosensitive surface. The inset
is a side view of the detector. Having a
300-liter capacity, “Herr Auge” (German
for Mr. Eye, as this detector was named)
was the largest detector at the time.
In 1956, Ernest C. Anderson, Robert Schuch, James Perrings, and Wright
Langham developed the whole-body counter known as HUMCO I. Its
design was a direct spinoff from the development of the first large liquid-
scintillation detector used in Reines and Cowan’s neutrino experiments at
Hanford. HUMCO I measured low levels of naturally occurring radioactivity
in humans. Later, it was used in a worldwide effort to determine the degree
to which radioactive fallout from nuclear tests and other nuclear and
natural sources was absorbed by the human body. The detector consisted
of a cylindrical container filled with 140 gallons of liquid scintillator and
surrounded by 108 photomultiplier tubes. The person being measured was
placed in a slide and drawn into the detector. Gamma rays emitted by
the naturally occurring radioisotope potassium-40 or the fallout isotope
cesium-137, for example, would largely penetrate the detector’s inner wall,
excite the scintillator, and be detected. HUMCO II, which superseded
HUMCO I in 1962, was nearly 10 times more sensitive, and its measure-
ments were that much safer and quicker.
The top photo shows Anderson sitting at the controls of HUMCO II.
To his right is the slide that would carry Schuch inside the detector for
radioactive measurement.
In 1958, the human counter was demonstrated at the Atoms for Peace
Conference held in Geneva. Built especially for this conference, the vertical
counter was open on one side to allow a person to step in for measurement
of internal radioactivity. The middle picture shows a conference participant
getting ready to enter the detector under Newton Hayes’ supervision.
The lower picture and diagram show the first human-radioactivity measure-
ments carried out in the detector that served as the basis for HUMCO.
The original purpose of that detector had been different: to determine the
degree to which the natural gamma-ray activity of the materials used to
shield the Hanford neutrino detector would add “noise” to the experiments.
Schuch suggested that a larger insert into the detector would allow a small
person to be placed inside and then be measured for gamma-ray activity.
Langham, shown crouched inside the detector, was the only member
of the team slim enough to fit in the narrow space.
The Whole-Bod y Counter
The Reines-Cowan Experiments The Reines-Cowan Experiments
Los Alamos Science Number 25 1997 Number 25 1997 Los Alamos Science

(d)
Work was exciting, exhausting, all-consuming. But there was
always time for fun. In the menu composed by Hayes and
Robert Schuch (c), silica gel, the chemical “jello,” is offered
as a tongue-in-cheek dessert together with green men cock -
tail, a reminder of the green-colored solution left from rinsing
the whole system before the experiment could start. The
chemicals listed on the menu are some of the actual ingredi -
ents used in preparing the liquid scintil -
lators that would fi ll the detector. The
barrels (d) were fi lled with scintillator
solution after the chemicals had carefully
been weighed with the scale pictured in
(e). Hayes is fi lling empty barrels (f) with
that solution. The barrels would then be
hauled onto the storage truck. Schuch is
connecting pipes to the storage truck (g)
in preparation for transferring the liquid
scintillator into the mixing trailer. The two
rows of valves and pipes were inside the
mixing trailer (h). Through these pipes
and the supply lines (i), the scintillator
solution would fl ow into the detector.
These photos are from Robert Schuch’s private
collection.
Amid the jumble of boxes and barrels,
Los Alamos researchers were feverishly
preparing for the Hanford experiment.
(a) F. Newton Hayes (left) and Clyde
Cowan, Jr., discuss the search for the
neutrino, while two workers (b) are
shielding the face of the reactor to
minimize the occurrence of background
events. The top of Herr Auge, the
neutrino detector, is shown surrounded
by an incomplete shield made of boron-
paraffi n boxes and huge amounts of lead.
6 Number 25 1997 Los Alamos Science Los Alamos Science Number 25 1997
(i)
(b)
(g)
(f)
(e)
(h)(c)
The Hanford Experiment 1953
The Reines-Cowan Experiments The Reines-Cowan Experiments

The Reines-Cowan Experiments
Number 25 1997 Los Alamos Science
he Reines-Cowan Experiments
8 Los Alamos Science Number 25 1997
having 110 photomultiplier tubes tocollect scintillation light and produceelectronic signals.
In this sandwich configuration, aneutrino-induced event in, say, tank Awould create two pairs of protonprompt-coincidence pulses from detec-tors I and II flanking tank A. The firstpair of pulses would be from positronannihilation and the second from neutron capture. The two pairs wouldbe separated by about 3 to 10 microsec-onds. Finally, no signal would emanatefrom detector III because the gammarays from positron annihilation andneutron capture in tank A are too lowin energy to reach detector III.
Thus, the spatial origin of the eventcould be deduced with certainty, andthe signals would be distinguished fromfalse delayed-coincidence signals induced by stray neutrons, gamma rays,and other stray particles from cosmic-ray showers or from the reactor. Thesespurious signals would most likely trigger detectors I, II, and III in a random combination. The all-importantelectronics were designed primarily byKiko Harrison and Austin McGuire.
The box entitled “Delayed-Coincidence Signals from Inverse BetaDecay” (page 22) illustrates delayed-coincidence signals from the detector’stop triad (composed of target tank Aand scintillation detectors I and II).Once the delayed-coincidence signalshave been recorded, the neutrino-induced event is complete. The signalsfrom the positron and neutron circuits,which have been stored on delay lines,are presented to the oscilloscopes.
Figure 5 shows a few samples of oscilloscope pictures—some are accept-able signals of inverse beta decay whileothers are not.
Austin McGuire was in charge ofthe design and construction of the “tank farm” that would house andtransport the thousands of gallons ofliquid scintillator needed for the experi-ment. Three steel tanks were placed ona flat trailer bed. The interior surfacesof the tanks were coated with epoxy topreserve the purity of the liquids.
Today, the need for purity and cleanli-ness is becoming legendary as researchers build an enormous tank forthe next generation of solar-neutrinoexperiments (see the article “ExorcisingGhosts” on page 136), but even in the 1950s, possible background conta-mination was an overriding concern.
Since the scintillator had to be kept at a temperature not lower than 60 degrees Fahrenheit, the outside walls of the tanks were wrapped with several layers of fiberglass insulatingmaterial, and long strips of electricalheating elements were embedded in the exterior insulation.
During the previous winter, whilethe equipment was being designed andbuilt, John Wheeler encouraged andsupported the team, and he helped
pave the way for the next neutrinomeasurement to be done at the new,very powerful fission reactor at theSavannah River Plant in South Carolina. By November 1955, the Los Alamos group was ready and onceagain packed up for the long trip tothe Savannah River Plant.
The only suitable place for the experiments was a small, open area inthe basement of the reactor building,barely large enough to house the detec-tor. There, 11 meters of concrete wouldseparate the detector from the reactorcore and serve as a shield from reactor-produced neutrons, and 12 meters of overburden would help eliminate the troublesome background neutrons, charged particles, and gamma rays produced by cosmic rays.
Schuch’s idea gave birth to the Los Alamos total-immersion, or“whole-body,” counter (see box “TheWhole-Body Counter” on page 15),which was similar in design to the detector for Project Poltergeist but wasbuilt especially to count the radioactivecontents of people. Since counting with this new device took only a fewminutes, it was a great advance overhe standard practice of using multiple
Geiger counters or sodium iodide (NaI)crystal spectrometers in an undergroundaboratory. The Los Alamos whole-
body counter was used during the1950s to determine the degree to whichadioactive fallout from nuclear tests
and other nuclear and natural sourceswas taken up by the human body.
The Hanford Experiment
In the very early spring of 1953, theProject Poltergeist team packed up Herr Auge, the 300-liter neutrino detec-or, as well as numerous electronics
and barrels of liquid scintillator, and setout for the new plutonium-producingeactor at the Hanford Engineering
Works in Hanford, Washington. It washe country’s latest and largest fissioneactor and would therefore producehe largest flux of antineutrinos.
Various aspects of the setup at Hanfordare shown in the photo collage.
The equipment for the liquid scintil-ator occupied two trucks parked outside the reactor building. One wasused to house barrels of liquid; in a sec-ond smaller truck, liquid scintillatorswere mixed according to various recipesbefore they would be pumped into thedetector. Herr Auge was placed insidehe reactor building, very near the faceof the reactor wall, and was surroundedby the homemade boron-paraffin shield-ng intermixed with nearly all the leadshielding available at Hanford. Thisshield was to stop reactor neutrons andgamma rays from entering the detectorand producing unwanted background. Inall, 4 to 6 feet of paraffin alternated with4 to 8inchesof lead.
The electronic gear for detecting thetelltale delayed-coincidence signal frominverse beta decay was inside the reac-tor building. Its essential elements weretwo independent electronic gates: oneto accept pulses characteristic of thepositron signal and the other to acceptpulses characteristic of the neutron-capture signal. The two circuits wereconnected by a time-delay analyzer.
If a pulse appeared in the output ofthe neutron circuit within 9 microsec-onds of a pulse in the output of thepositron circuit, the count was regis-tered in the channel that recorded delayed coincidences. Allowing for detector efficiencies and electronic gate settings and taking into accountthe neutrino flux from the reactor, the expected rate for delayed coincidencesfrom neutrino-induced events was 0.1 to 0.3 count per minute.
For several months, the teamstacked and restacked the shielding andused various recipes for the liquid scintillator (see Hanford Menu in “The Hanford Experiment” collage).Then they would set the electronics and listen for the characteristic doubleclicks that would accompany detectionof the inverse beta decay. Despite theexhausting work, the results were notdefinitive. The delayed-coincidencebackground, present whether or not thereactor was on, was about 5 counts perminute, many times higher than the expected signal rate.
The scientists guessed that the back-ground was due to cosmic rays enteringthe detector, but the addition of varioustypes of shielding left the backgroundrate unchanged. Subsequent work underground suggested that the Hanford background of delayed-coincidence pulses was indeed due tocosmic rays. Reines and Cowan (1953)reported a small increase in the numberof delayed coincidences when the reactor was on versus when it was off. Furthermore, the increase was consistent with the number expectedfrom the estimated flux of reactor neutrinos. This was tantalizing but insufficient evidence that neutrino
events were being detected. The Hanford experience was poignantlysummarized by Cowan (1964).
“The lesson of the work was clear:It is easy to shield out the noise menmake, but impossible to shut out thecosmos. Neutrons and gamma raysfrom the reactor, which we had fearedmost, were stopped in our thick wallsof paraffin, borax and lead, but the cosmic ray mesons penetrated gleefully,generating backgrounds in our equip-ment as they passed or stopped in it.We did record neutrino-like signals butthe cosmic rays with their neutron sec-ondaries generated in our shields were10 times more abundant than were the neutrino signals. We felt we had theneutrino by the coattails, but our evidence would not stand up in court.”
The Savannah RiverExperiment
After the Hanford experience, theLaboratory encouraged Reines andCowan to set up a formal group withthe sole purpose of tracking neutrinos.Other than the scientists who had already been working on neutrinos,Kiko Harrison, Austin McGuire, andHerald Kruse (a graduate student at thetime) were included in this group.
They spent the following year redesigning the experiment from top tobottom: detector, electronics, scintilla-tor liquids, the whole works. The detec-tor was entirely reconfigured to betterdifferentiate between events induced bycosmic rays and those initiated in thedetector by reactor neutrinos. Figure 4shows the new design.
Two large, flat plastic tanks (calledthe “target tanks” and labeled A and B)were filled with water. The protons inthe water provided the target for inverse beta decay; cadmium chloridedissolved in the water provided the cadmium nuclei that would capture the neutrons. The target tanks weresandwiched between three large scintil-lation detectors labeled I, II, and III(total capacity 4,200 liters), each
Figure 4. The Savannah River Neutrino Detector—A New DesignThe neutrino detector is illustrated here inside its lead shield. Each of two large, fl at
plastic tanks (pictured in light blue and labeled A and B) was fi lled with 200 liters of
water. The protons in the water provided the target for inverse beta decay; cadmium
chloride dissolved in the water provided the cadmium nuclei that would capture the
neutrons. The target tanks were sandwiched between three scintillation detectors
(I, II, and III). Each detector contained 1,400 liters of liquid scintillator that was viewed
by 110 photomultiplier tubes. Without its shield, the assembled detector weighed
about 10 tons.
A
B
he Reines-Cowan Experiments
0 Los Alamos Science Number 25 1997
After years of intense work, the members
of the Los Alamos team were ready for
the Savannah River experiment that
would fulfi ll their much expected goal—
the defi nitive detection of the neutrino.
Pictured in (a) is the tank farm, which
was composed of three 4,500-liter steel
tanks placed on a fl at-bed trailer. The
liquid scintillator was stored and shipped
in those tanks. The outside walls of the
tanks were wrapped with fi berglass insu -
lation, and long electrical heating strips
were embedded in the insulation to
prevent the temperature inside the tanks
from falling below 60 degrees Fahrenheit.
Had the temperature fallen below this
limit, the liquid scintillator would have
turned from transparent to cloudy and
would have become unusable in the
experiment. (b) Fred Reines (left) and
Clyde Cowan, Jr., discuss their last-
minute plans for the Savannah River
experiment. No detail is left uncovered.
Resting in a special forklift built to handle
the detector sections, one of the two tar -
get tanks fi lled with water and cadmium
chloride is shown (c) awaiting its
assembly in the detector shield. A com -
pleted detector tank (d) is ready to be
inserted into the shield. This tank was
made of steel plate, but its bottom was a
The Savannah River Experiment 1955
Number 25 1997 Los Alamos Science
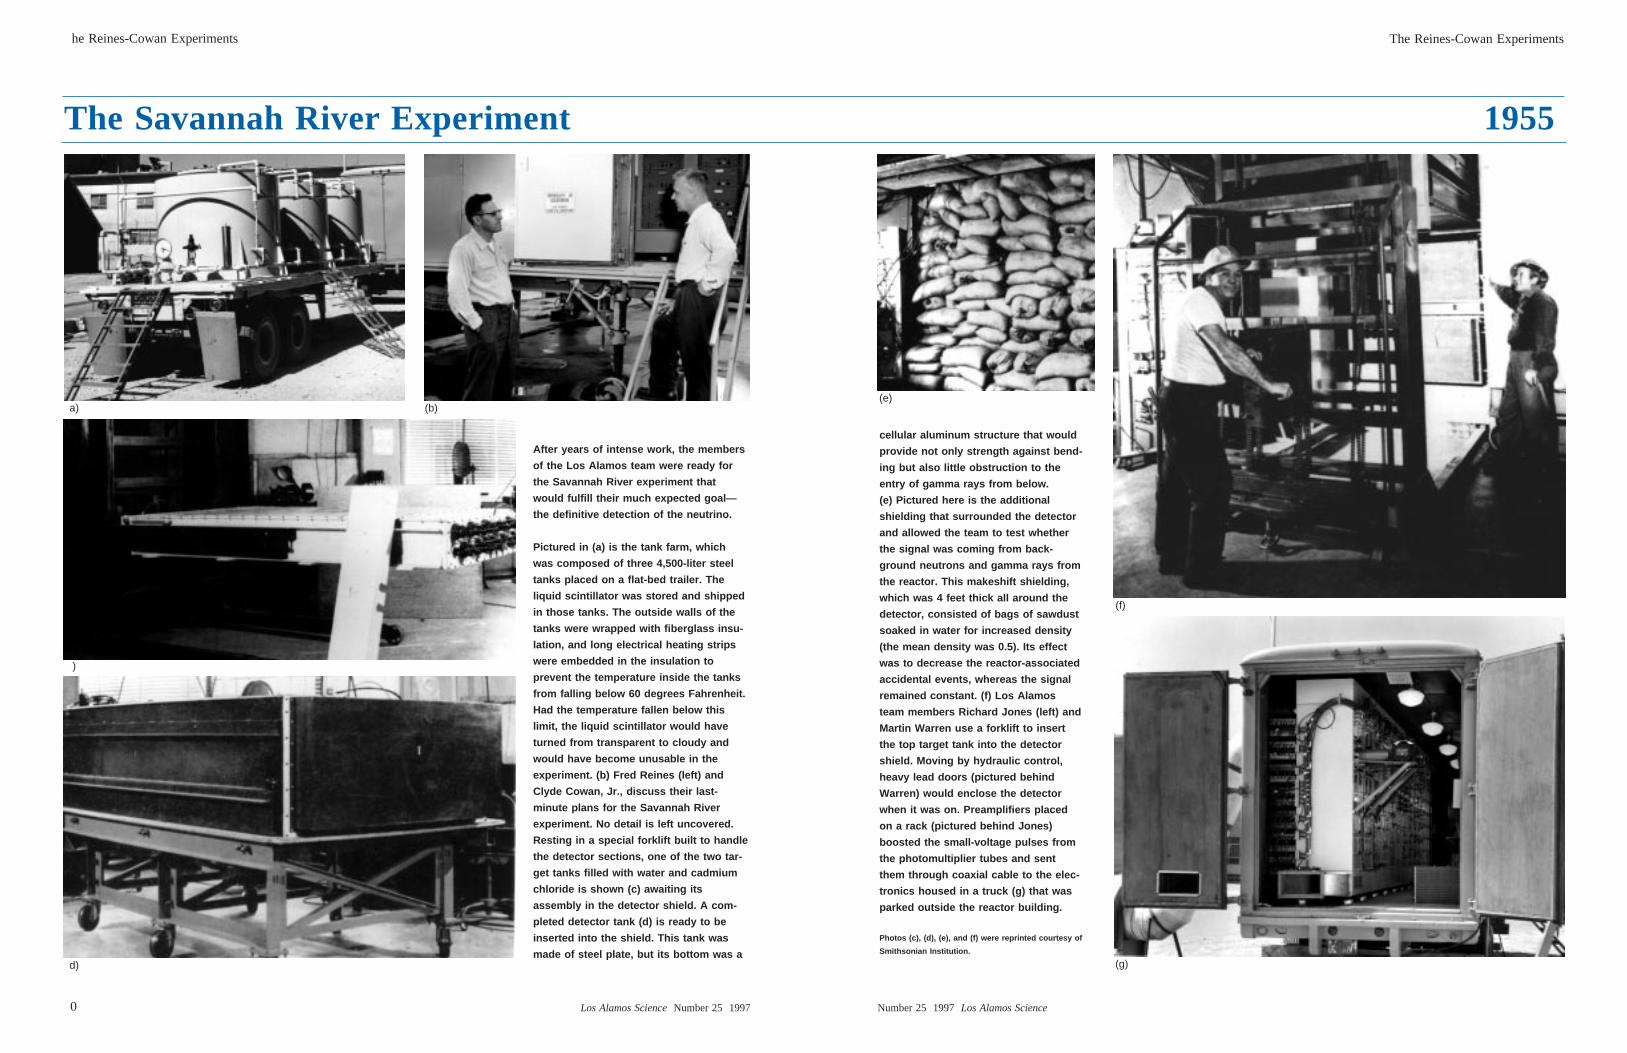
cellular aluminum structure that would
provide not only strength against bend -
ing but also little obstruction to the
entry of gamma rays from below.
(e) Pictured here is the additional
shielding that surrounded the detector
and allowed the team to test whether
the signal was coming from back -
ground neutrons and gamma rays from
the reactor. This makeshift shielding,
which was 4 feet thick all around the
detector, consisted of bags of sawdust
soaked in water for increased density
(the mean density was 0.5). Its effect
was to decrease the reactor-associated
accidental events, whereas the signal
remained constant. (f) Los Alamos
team members Richard Jones (left) and
Martin Warren use a forklift to insert
the top target tank into the detector
shield. Moving by hydraulic control,
heavy lead doors (pictured behind
Warren) would enclose the detector
when it was on. Preamplifi ers placed
on a rack (pictured behind Jones)
boosted the small-voltage pulses from
the photomultiplier tubes and sent
them through coaxial cable to the elec -
tronics housed in a truck (g) that was
parked outside the reactor building.
Photos (c), (d), (e), and (f) were reprinted courtesy of
Smithsonian Institution.
a) (b)
)
d)
(e)
(f)
(g)
The Reines-Cowan Experiments

They tested their measured signal exten-sively to ensure that it was indeed dueto the products of neutrino-induced inverse beta decay, in particular that• the first and second prompt-
coincidence pulses were generated by positron annihilation and neutroncapture, respectively, rather than other processes,
• the signal was proportional to the number of target protons, and
• the signal was not due to neutrons and gamma rays from the reactor.
For example, to check the positronsignal, the Los Alamos researchers compared the pair of prompt-coincidence pulses making up thepositron signal with those produced
during a test run by a positron source (copper-64) dissolved in the water. Tocheck the neutron capture signal, theydoubled the amount of cadmium in thewater to see if the average time delaybetween the positron-annihilation andneutron-capture signals decreased, asexpected if the second signal was trulydue to neutron capture.
To test that the signal was propor-tional to the number of target protons,they reduced the number of protons tohalf the original value by filling the tankwith an equal mixture of heavy water(D2O) and ordinary water. They thenlooked for a decrease in the signal corre-sponding to the decrease in the crosssection for inverse beta decay on
deuterium versus the cross section forinverse beta decay on hydrogen.
Finally, to test whether the signal wascoming from background neutrons andgamma rays from the reactor, they surrounded the detector with additionalmakeshift shielding. Bags of sawdust donated by a local sawmill and soaked inwater for increased density were a cheapand flexible solution to the problem ofcreating an additional shield. Their effectwas to decrease the reactor-associated accidental events, whereas the signalstayed constant. This and all other testsconfirmed that the signal was indeed dueto reactor antineutrinos being captured byprotons in the water tanks of the detectorand inducing inverse beta decays.
The Reines-Cowan Experiments
Number 25 1997 Los Alamos Science
he Reines-Cowan Experiments
2 Los Alamos Science Number 25 1997
he very large detector—over 2 metersigh and weighing about 10 tons—hado be installed in those cramped under-round quarters.
There was just enough room left foreveral preamplifiers (needed to boosthe small signals from the photomulti-liers) to be set on a rack near the etector, but the electronics had to beoused outside, in a trailer. The tankarm containing the precious liquidcintillator was also parked outside.he Los Alamos group used a wholeetwork of stainless-steel pipes andalves, along with special pumps, o mix the solutions and pump hem from the holding tanks in thearking lot into the detector down
in the basement.The team members stayed in Savan-
nah River for over five months. Theytook data for about 900 hours when thereactor was on and for about 250 hourswhen it was off. Their immediate goalwas to demonstrate a neutrino-like signal that was much larger when thereactor was on than off, indicating thatit was caused by the flux of antineutri-nos coming from the reactor.
In fact, the rate of delayed coinci-dences of the type described above was5 times greater when the reactor was onthan off and corresponded to about onereactor-associated event per hour. Therewas also the question of whether thedelayed coincidences were accidental,
that is, caused by an accidental correla-tion between gamma rays and neutronsfrom the reactor. The neutron-capturedelay time was unlikely to be morethan 10 microseconds, whereas datawere taken for up to 30 microseconds.
Thus, the accidental backgroundrate could be estimated as the rate ofdelayed coincidences that occurred withneutron-capture delay times between 11 and 30 microseconds. Using this estimate, the team derived the rate ofsignal to accidental background eventsto have been 4 to 1.
Although the delayed-coincidencesignal is a telltale signature of inversebeta decay, the Los Alamos team members took nothing for granted.
Target tank A
Target tank B
Top
tria
d
(a) T = 0 Positron annihilation produces electron signal.
SignalDetector I
Detector II
Detector III
Energydiscriminator
0.75–30-µstimer
Positron Positronprompt-
coincidencecircuit
Neutronprompt-
coincidencecircuit
Top-triadevent
counter
Neutron
Bot
tom
tria
d
Positron
Neutron
Positron
Neutron
Positron
Positronprompt-
coincidencecircuit
Neutronprompt-
coincidencecircuit
Bottom-triad event
counter
This flow diagram traces the generation of a set of
delayed-coincidence signals in the top triad of the
detector (target tank A and scintillation detectors I
and II). An antineutrino (red dashed line) from the
reactor has interacted with a proton in tank A through
inverse beta decay, creating a positron and a neutron.
As a result, two processes occur in tank A: positron
annihilation, shown in diagram (a), and neutron
capture, shown in diagram (b). In the case illustrated
here, the delay between the two processes is
3 microseconds.
Target tank A
Target tank B
Detector I
Detector II
Detector III
Signal
Energydiscriminator
3 µs
(b) T = 3 µs Neutron capture produces neutron signal.
Top
tria
d
To
reco
rdin
g os
cillo
scop
es
Positron
Neutron
Bot
tom
tria
d
Positron
Neutron
Positron
Neutron
Bottom-triad event
counter
Positronprompt-
coincidencecircuit
Positronprompt-
coincidencecircuit
Neutronprompt-
coincidencecircuit
Neutronprompt-
coincidencecircuit
Top-triadevent
counter
Neutron
Delayed-Coincidence Signals fr om Inverse Beta Deca y
In diagram (a), the encounter between a positron and an electron in tank A
results in two gamma rays, which go into scintillation detectors I and II, give
up their energy, and produce a flash of visible light proportional to that
energy. The photomultiplier tubes in each detector convert the light into an
electronic signal, which is sent first to the positron signal discriminator and
then to the positron prompt-coincidence circuit. The discriminator will accept
the signals from detectors I and II if they are within the right energy range
(between 0.2 and 0.6 MeV). The prompt-coincidence circuit will accept them
if they arrive less than 0.2 microsecond apart. In this case, both conditions
are fulfilled. The timer starts to tick and closes the switch to the neutron
prompt-coincidence circuit for 30 microseconds, allowing signals from
neutron capture to be recorded during that period.
Diagram (b) pictures the slowdown of the neutron that had been
generated simultaneously with the positron and its final capture by
a cadmium nucleus in tank A. The excited cadmium nucleus drops
to a lower energy state by emitting gamma rays, which once again
create flashes of visible light in detectors I and II. The photomultiplier
tubes detect that light and are shown to have produced two electronic
signals whose energy is within the acceptable range, that is, the
energy is greater than 0.2 MeV in each detector, with a total energy
from 3 to 11 MeV (as determined by the discriminator). The signals
are less than 0.2 microsecond apart in reaching the neutron
prompt-coincidence circuit. Thus, they are accepted as a true signal
of neutron capture. At this point, the timer has advanced to
3 microseconds, indicating the delay between the two processes.
The delayed-coincidence signals caused by the neutrino-induced
inverse beta decay is now complete. A scaler is automatically
activated, the recording oscilloscopes are triggered to sweep
across the cathode-ray screens, and the signals from the positron
and neutron circuits, which have been stored on delay lines, are
presented to the oscilloscopes.

The Reines-Cowan Experiments
Number 25 1997 Los Alamos Science
he Reines-Cowan Experiments
4 Los Alamos Science Number 25 1997
target area that a proton presents to aneutrino. The larger the area, the morelikely it is that the process will occur.)
The measured rate, or the number ofevents per second, depends on (1) therate at which neutrinos are entering the target area (the neutrino flux was approximately 1,013 neutrinos persquare centimeter per second), (2) thenumber of target protons in the watertank (approximately 1,028 target protons), (3) the cross section for the reaction, and (4) the efficiency of the detectors in picking up positron andneutron signals from the reaction.
According to Fermi’s theory, thecross section for inverse beta decayvaries with energy. Given the energyspectrum of the reactor-produced antineutrinos (the average energy was 3 MeV), the theoretically predictedcross section for inverse beta decay onprotons is 6.3× 10–44, with an uncer-tainty of about 25 percent arising fromthe uncertainty of the energy spectrumfor the reactor neutrinos. The violationof parity conservation (namely, thesymmetry between left-handedness andright-handedness) by the weak forcehad not yet been discovered, and so thistheoretical value was based on the parity-conserving formulation ofFermi’s theory of beta decay in whichthe neutrino, like the electron, has fourindependent degrees of freedom.
In July 1956, a brief article in Scienceby Reines, Cowan, Harrison,McGuire, and Kruse announced that theSavannah River experiment had confirmed the tentative findings of theHanford experiment. The authors alsostated that their results were in agreement within 5 percent of the theoretically predicted value for the inverse-beta-decay cross section. Suchresults were fortuitous given the uncertainties in the neutrino flux and in the detector efficiency.
A more detailed paper on this experi-ment published in Physical Review in1960 reported a cross section twice aslarge as that reported in 1956. Accord-ing to Reines (1979), the increase in thevalue occurred because “our initial
analysis grossly overestimated the detection efficiency with the result thatthe measured cross section was at firstthought to be in good agreement with[the pre–parity violation] prediction.”
The theoretical cross section hadalso doubled between 1956 and 1960because of the discovery in 1957 of parity nonconservation in the weak interactions and the formulation of the two-component theory of the neutrino (see the box “Parity Noncon-servation and the Massless Two-Component Neutrino” on page 32). So, the measured cross section reportedin the literature remained in agreementwith the theoretical prediction.
In addition, after the 1956 experi-ment, Reines and Cowan did anothermeasurement with a new setup and, in a1959 Physical Reviewpaper, reportedresults for the cross section that were in agreement with the two-componentneutrino, parity-nonconserving theory.
Over the years, there has been someskepticism about the differing publishedvalues. These feelings may have beenresponsible for the forty years that hadpassed before the discovery of the neu-trino was recognized with the NobelPrize. Nevertheless, the award is a clear recognition that the SavannahRiver experiment was an extraordinaryaccomplishment. Reines wished thatCowan had been alive to share the prestigious award with him. The elusiveproduct of the weak force that can penetrate the earth and travel to theends of the universe was finally observed stopping in its tracks. Theneutrino became a tangible reality, and the experiment itself set a precedent for using the neutrino as an experimental tool.
Indeed, since the Reines-Cowan experiments, neutrino detection has pro-duced some dramatic results. One wasthe 1963 experiment of Lederman,Schwartz, and Steinberger proving that asecond (muon) neutrino was paired withthe muon in the way the known (elec-tron) neutrino was paired with the electron. That result not only earned thediscoverers the Nobel Prize, but also
established the first hint of the secondfamily of elementary particles (all threefamilies are introduced in the primer, “The Oscillating Neutrino,” on page 28).
Another was the detection of a burst of neutrinos from supernova1987A (SN1987A)—twenty hits within12 seconds in two enormous detectorslocated on opposite sides of the planet,both buried deep underground whereone expects to see only one neutrinoevent per day. It was the unmistakable signature of an exploding star, and it provided extraordinary confirmation of the exotic notion that neutrinos, the most standoffish members of the pantheon of elementary particles, coulddrive the largest explosion ever witnessed by human beings.
And at present, neutrino data are accumulating from even more-modernneutrino detectors, some buried deepunderground, some poised at accelera-tors, some awaiting completion, all dedicated to seeing whether the neutri-nos, long purported to be massless particles, not only carry mass but alsooscillate from one identity to another as they fly freely through space.
The world of physics owes much to Fred Reines for these developments.His single-minded dedication to theneutrino set an example, not only in the 1950s but throughout his career.And his courage to “think big” continued well after his tenure at Los Alamos. Reines was one of the critical cospokespersons for the construction of the huge IMB detector,a water-filled, 8,000-ton Cerenkov detector located in the Morton salt mine near Cleveland, Ohio. It was there that half of the events fromSN1987A were detected and many of the data on the oscillation of atmospheric neutrinos were gathered.
Through this volume, Los AlamosNational Laboratory takes pride in the accomplishments of Fred Reines, Clyde Cowan, Jr., and the teams ofLaboratory workers who performed tothe best of their ability in demonstratingthe existence of the neutrino. And Fred Reines, in his gracious way,
Announcement of Results
On June 14, 1956, after all the ests had been completed, Reines and
Cowan sent a telegram to Pauli atürich University:
“We are happy to inform you thatwe have definitely detected neutrinosrom fission fragments by observing nverse beta decay of protons.
Observed cross section agrees well
with expected six times ten to minusforty-four square centimeters.”
In his 1979 article in Science aboutthe early days of experimental neutrinophysics, Reines describes Pauli’s reac-tion to the news:
“The message was forwarded to him[Pauli] at CERN, where he interruptedthe meeting he was attending to readthe telegram to the conferees and thenmade some impromptu remarks regard-
ing the discovery. We learned later thatPauli and some friends consumed acase of champagne in celebration.”
Although the intent of the SavannahRiver experiment was to get a positivesignal of neutrino detection, the experi-ment also yielded a measurement of therate, or more exactly the cross section,for inverse beta decay. (The cross sec-tion for the neutrino to be captured by aproton can be thought of as the effective
Figure 5. Oscilloscope Traces fromthe Savannah River ExperimentsIn these oscilloscope pictures, traces
from detectors I, II, and III are labeled I, II,
and III, respectively. The label under each
frame indicates whether the signals were
recorded by the scope for positron anni -
hilation or the scope for neutron capture.
Acceptable delayed-coincidence signals
are shown in (a) and (b), while rejected
signals are pictured in (c) through (f).
(a) The delayed-coincidence signal in
these two frames has occurred in the top
triad of the detector because the pulses
appeared in detectors I and II. Positron
scope : The pulse energies in detectors I
and II were 0.30 MeV and 0.35 MeV,
respectively. The pulses reached the
positron circuit in prompt coincidence
(less than 0.2 microsecond apart) and
were accepted as a signal of positron
annihilation. Neutron scope : The pulse
energies in detectors I and II were
5.8 MeV and 3.3 MeV, respectively. These
pulses arrived in prompt coincidence
and were accepted as a signal of neutron
capture. The delay between the positron
and neutron signals was 2.5 microsec -
onds. (b) The delayed-coincidence signal
in these two frames has occurred in the
bottom triad because the pulses appeared
in detectors II and III. Positron scope :
The pulse energies in detectors II and III
were 0.25 MeV and 0.30 MeV, respectively.
eutron scope : The pulse energies in detectors II and III were 2.0 MeV and 1.7 MeV, respectively. The delay between the positron and
eutron signals was 13.5 microseconds. (c) The pulses from the neutron circuit were the result of electrical noise. (d) These th ree
ulses from the neutron circuit were caused by a cosmic-ray event. (e) These three pulses from the positron circuit were caused by
cosmic-ray event. (f) These pulses may have been caused by a cosmic-ray event. They were rejected as a signal of neutron captu re
ecause of the extra pulse from detector II. Frames like this one occurred more often than would be expected from chance
oincidences. They were, however, not often enough to affect the results considerably. These data appeared in Reines, Cowan, Harrison, et al. 1960.
Neutron scope
(c) Neutron scope (d) Neutron scope
(e) Positron scope (f) Neutron scope
(a) Positron scope
(b) Positron scope Neutron scope
I
II
III
I
II
III
I
II
III
I
II
III

The Reines-Cowan Experiments
Number 25 1997 Los Alamos Science
as openly thanked the Laboratory:“Looking back, we had much to
e thankful for. We had indeed been n the right place at the right time. he unlikely trail from bombs to etection of the free neutrino could, n my view, only have happened at os Alamos.” (Reines 1982)■
Fur ther Reading
ethe, H. A., and R. F. Bacher. 1936. Disintegra-tion and Nuclear Forces.Review of ModernPhysics8 (82): 184.
owan, C. L. 1964. Anatomy of an Experiment: An Account of the Discovery of the Neutrino. Smithsonian Institution Annual Report: 409.
owan, C. L., Jr., F. Reines, F. B. Harrison, E. C. Anderson, and F. N. Hayes. 1953. Large Liquid Scintillation Detectors. Physical Review90 (3): 493.
owan, C. L., Jr., F. Reines, F. B. Harrison, H. W. Kruse, and A. D.McGuire. 1956. Detec-tion of the Free Neutrino: A Confirmation. Science124 (3212): 103.
rane, H. R. 1948. The Energy and Momentum Relations in the Beta-Decay, and the Search forthe Neutrino. 1948. Reviews of Modern Physics20 (1): 278.
eines, F. 1979. The Early Days of Experimental Neutrino Physics. Science203 (4375): 11.
———. 1982. Neutrinos to 1960—Personal Recollections. Journal de Physique 43(supplement to 12): C8-237.
eines, F., and C. L. Cowan, Jr., 1953. Detection of the Free Neutrino. Physical Review Letters92: 330.
———. 1959. Free Antineutrino Absorption Cross Section. I. Measurement of the Free Antineutrino Absorption Cross Section by Protons. Physical Review113 (1): 273.
eines, F., C. L. Cowan, Jr., F. B. Harrison, A. D. McGuire, and H. W Kruse. 1960. Detection of the Free Antineutrino. Physical Review117 (1): 159.
eynolds, G. T., F. B. Harrison, and G. Salvini. 1950. Liquid Scintillation Counters. Physical Review78 (4): 488.
utton, C. 1992. Spaceship Neutrino. New York: Cambridge University Press.
he Reines-Cowan Experiments
6 Los Alamos Science Number 25 1997
Frederick Reines is best known for his discovery of the nearly massless elementary
particle, the neutrino. For this work, he was awarded the Nobel Prize in physics in
1995. Collaborating with Clyde Cowan, Jr., Reines determined conclusively the
existence of the neutrino during experiments conducted at the Savannah River Plant
in 1956. Subsequently, Reines devoted his career to investigating the properties and
interactions of the neutrino as it relates not only to elementary particle physics but
also to astrophysics.
This lifelong research produced a number of fundamental “firsts” credited to Reines.
One of the most recent achievements, the codiscovery of neutrinos emitted from
supernova 1987A (SN1987A), demonstrated the theorized role of the neutrino in stellar
collapse. Reines captured the difficulty of this work vividly: “It’s like listening for a
gnat’s whisper in a hurricane.”
Significant other firsts include detecting neutrinos produced in the atmosphere, studying
muons induced by neutrino interactions underground, observing the scattering of elec-
tron antineutrinos with electrons, detecting weak neutral-current interactions of electron
antineutrinos with deuterons, and searching for neutrino oscillations (the possibility of
neutrino transformation from one type to another). In addition, Reines and his cowork-
ers have pursued for nearly forty years a program of experiments to test some of the
fundamental conservation laws of nature, including conservation of lepton number
(which would be violated in the decay of an electron or neutrino or in the change of
lepton type) and conservation of baryon number, which would be manifested in the
decay of the proton, as predicted by the Grand Unified Theories of elementary particles.
Reines was born in Paterson, New Jersey, on March 16, 1918. He earned his M.E. in
mechanical engineering in 1939 and his M.A. in science in 1941 from Stevens Institute
of Technology in Hoboken, New Jersey. He received his Ph.D. in theoretical physics from New York University in 1944. That same year,
he joined the Los Alamos Scientific Laboratory as a staff member, later to become group leader in the Theoretical Division, and was
tasked to study the blast effects of nuclear weapons. In 1959, Reines became head of the Physics Department at Case Institute of
Technology. At the same time, her served as consultant to Los Alamos
and the Institute for Defense Analysis, as well as trustee of the Argonne
National Laboratory. In 1966, however, Reines accepted a dual appoint-
ment as the first dean of physical sciences and physics professor at the
University of California, Irvine. Four years later, he was appointed
professor of radiological sciences at Irvine’s Medical School. When
Reines retired in 1988, he was Distinguished Emeritus Professor of
Physics at Irvine.
For his outstanding work in elementary particle physics, Reines has
received numerous honors and major awards. In 1957, he became fellow
of the American Physical Society; in 1958, Guggenheim fellow; in 1959
Alfred P. Sloan fellow; in 1979, fellow of the American Association for the
Advancement of Science; and in 1980, member of the National Academy
of Sciences. In 1981, Reines received the J. Robert Oppenheimer Memorial
Prize. He was presented the National Medal of Science by President
Ronald Reagan in 1983, the Brunno Rossi Prize in 1989, the Michelson-
Morley Award in 1990, the W. K. H. Panofsky Prize and the Franklyn Medal
in 1992. He is a member of the American Academy of Arts and Sciences.
During a 1985 interview with The New York Times, Reines labored when he was asked to describe the significance of his discovery of the
neutrino: “I don’t say that the neutrino is going to be a practical thing, but it has been a time-honored pattern that science leads, and
then technology comes along, and then, put together, these things make an enormous difference in how we live.” And now, more than
forty years after the discovery of the neutrino, Reines’ scientific peers believe that this discovery made Reines a giant in his field.
Clyde L. Cowan, Jr., was born in Detroit, Michigan, on December 6, 1919. He
earned his B.S. in chemical engineering at the Missouri School of Mines and
Metallurgy (later to become part of the University of Missouri) in 1940 and his M.S.
and Ph.D. in physics from Washington University in St. Louis, Missouri, in 1947
and 1949, respectively.
During the Second World War, Cowan joined the U.S. Army Chemical Warfare
Service as a 2nd lieutenant and shortly thereafter left for England with the 51st Troop
Carrier Wing. While he was stationed in England, Cowan was involved in making
changes to the newly developed radar. For this significant work, he was later awarded
the Bronze Star.
Soon after the war, Cowan returned to the United States where he was accepted as the
first physics graduate student to Washington University. His thesis was an in-depth study
of the absorption of gamma radiation. Soon after graduate school, Cowan realized that
Los Alamos was the logical place for him to work, and in 1949 he joined the Laboratory
as a staff member. Only two years later, Cowan became group leader of the Nuclear
Weapons Test Division at Los Alamos.
In 1951, Cowan began a historic collaboration with Fred Reines. Its outcome was
the successful detection of the neutrino during an experiment conducted at the
Savannah River Plant in 1956. After this discovery, neutrino physics became seminal
to worldwide studies of the weak force. In 1957, Cowan was awarded a Guggenheim fellowship to study the physics of the neutrino and its
interactions with atomic nuclei.
Cowan’s creativity has been a mark of his scientific career from the early and fruitful years in Los Alamos to the successful teaching years at
the Catholic University of America, where he was a physics professor from 1958 until his untimely death in 1974. Upon his suggestion, the
bubble chamber became a tool for studying neutrino interactions. Cowan
was one of the first physicists who used large scintillation counters for parti-
cle detection, an important technique in elementary particle physics. His
collaboration with Reines led to the development of the whole-body counter,
which measured low levels of naturally occurring radiation in humans.
Having witnessed about thirty nuclear explosions while he was in the
Nuclear Weapons Test Division at Los Alamos, Cowan was among the first
to have studied the electromagnetic signal produced by a nuclear explosion.
Throughout his career, Cowan served as a consultant to the United States
Naval Academy, the U.S. Atomic Energy Commission, the Naval
Ordnance, and the Smithsonian Institution, where he helped create the
permanent Hall of Nuclear Energy. Cowan was a fellow of the American
Physical Society and the American Association for the Advancement of
Science. He was a member of numerous scientific and civic organizations.
Having dedicated his life to scientific investigation, Cowan has been a
source of inspiration to generations of young, aspiring scientists.