The Redesign of Processes Development in Food Production
32
Chapter 20 The Redesign of Processes’ Development in Food Production Organizations Using Quality Engineering Methods and Tools Slavko Arsovski, Miladin Stefanović, Danijela Tadić and Ivan Savović Additional information is available at the end of the chapter http://dx.doi.org/10.5772/53154 1. Introduction A number of trends and challenges such as increased competition, new technologies and regulations, quality and new consumer trends have been forcing the food industry to change [1, 2, 3]. In response to these new challenges, food companies are improving compet‐ itiveness by restructuring, redesigning existing processes, and intensifying the fight for mar‐ ket share through product differentiation and/or the development of new food products [1]. In order to improve, companies in the food industry must adopt: Restructure of their organi‐ zations and redesign their processes; Automation of production and other processes to de‐ crease dependence on human resources and transfer activities to self-service facilities for customers and partners; Optimization of logistical infrastructure and systems; Energy sav‐ ing measures through new technology and materials, new production methods and good- practice implementation; Political and regulatory developments (food safety and other regulations); Technological changes (biotechnology, ICT and RFID, robotics, sensors, e-busi‐ ness); Understand globalization, market developments and customer trends. In this chapter process development is analyzed because of its impact on food quality, safety and sustainability [4, 5, 6]. A redesign of process development could be accomplished through many different approaches, techniques and tools [7, 8, 9, 10]. In this chapter Busi‐ ness Process Management (BPM) is used with accompanied quality engineering methods and tools. A number of important questions will be addressed concerning the redesign of process development in food production organizations using quality engineering tools and methods. © 2013 Arsovski et al.; licensee InTech. This is an open access article distributed under the terms of the Creative Commons Attribution License (http://creativecommons.org/licenses/by/3.0), which permits unrestricted use, distribution, and reproduction in any medium, provided the original work is properly cited.
Transcript of The Redesign of Processes Development in Food Production
Chapter 20
The Redesign of Processes’ Development in FoodProduction Organizations Using Quality EngineeringMethods and Tools
Slavko Arsovski, Miladin Stefanović,Danijela Tadić and Ivan Savović
Additional information is available at the end of the chapter
http://dx.doi.org/10.5772/53154
1. Introduction
A number of trends and challenges such as increased competition, new technologies andregulations, quality and new consumer trends have been forcing the food industry tochange [1, 2, 3]. In response to these new challenges, food companies are improving compet‐itiveness by restructuring, redesigning existing processes, and intensifying the fight for mar‐ket share through product differentiation and/or the development of new food products [1].In order to improve, companies in the food industry must adopt: Restructure of their organi‐zations and redesign their processes; Automation of production and other processes to de‐crease dependence on human resources and transfer activities to self-service facilities forcustomers and partners; Optimization of logistical infrastructure and systems; Energy sav‐ing measures through new technology and materials, new production methods and good-practice implementation; Political and regulatory developments (food safety and otherregulations); Technological changes (biotechnology, ICT and RFID, robotics, sensors, e-busi‐ness); Understand globalization, market developments and customer trends.
In this chapter process development is analyzed because of its impact on food quality, safetyand sustainability [4, 5, 6]. A redesign of process development could be accomplishedthrough many different approaches, techniques and tools [7, 8, 9, 10]. In this chapter Busi‐ness Process Management (BPM) is used with accompanied quality engineering methodsand tools. A number of important questions will be addressed concerning the redesign ofprocess development in food production organizations using quality engineering tools andmethods.
© 2013 Arsovski et al.; licensee InTech. This is an open access article distributed under the terms of theCreative Commons Attribution License (http://creativecommons.org/licenses/by/3.0), which permitsunrestricted use, distribution, and reproduction in any medium, provided the original work is properly cited.

The first question that will be raised is the quality of processes in the food industry. Theanalysis will start from a typical process map for companies in the food processing industryin Serbia. After that the production process, as one of the most important processes in foodprocessing will be decomposed. For each sub process appropriate metrics will be defined asthe road of evaluation for the quality of the sub processes and quality of the goal of the proc‐ess itself. Redesign of process development will be analyzed by comparing different ap‐proaches and by consideration of process redesign as the process. Different qualityengineering methods and tools in the food industry will be compared according to the fre‐quency of their implementation in the Serbian food industry as well as a correlation betweenthe application of different quality engineering methods and tools, and profit in the compa‐nies. As an extension of the general ranking idea presented on the ranking and definition ofgoals in the production process, a fuzzy approach for evaluation of the importance of enti‐ties in supply chains in the food industry is presented. The general idea is to present an ap‐plication of a mathematical tool in a situation that is very common in the food industrywhere conditions have been constantly changing so the observed values could not be sto‐chastically described and where there is not a sufficient amount of data for statistical analy‐sis. In other words, the application of fuzzy sets on evaluation of the importance of entitiesin the supply chain will be presented. A strategic map as a strategic part of the BSC (Bal‐anced Score Card) framework is presented as one of the quality engineering methods. Thepresented strategic map started from the Kaplan – Norton model but it was adjusted in or‐der to meet the needs of food processing companies in Serbia. Relations between entities(from all four perspectives) are defined as the result of research among Serbian companies.In the final part of the chapter the process framework for food processing companies is pre‐sented. The questionnaire used for the research is presented as well as gathered data from53 Serbian companies. The gathered data was the input in modeling and evaluations pre‐sented in previously discussed issues.
The main idea of the chapter is to provide an overview of the redesign of process develop‐ment, starting from analysis (decomposition of processes), redesign, implementation ofmodern quality engineering tools and methods (frequency of usage and impact of differenttools and methods and implantation of some of them) as well as theoretical and mathemati‐cal tools on ranking of quality goals (theory of fuzzy sets) and finally providing a processframework and, at the same time, the keeping a connection and solid ground in data gath‐ered from the food industry.
2. Quality of processes in the food industry
The food industry contains a number of completely different processes which require a widerange of measuring instruments. On the one hand, the quality of processes has market goalsin brand development, demand management and new product introduction, while embrac‐ing food security and quality requirements. On the other hand, quality of processes in thefood industry depends on many factors such as customer demands, key performance indica‐tors, the process map, technology level, management level etc. In order to provide quality
Food Industry440

analysis, and redesign and improvement of the process the first step is an analysis of theprocess map of a typical organization in the food industry. A typical process map for an or‐ganization in the food industry is presented in figure 1.
KP0
Strategic management
KP1
Purchasing
KP2
Production
KP3
Delivery
KP4
Sales and marketing
SP4
Finance
SP5
Human Resources
Management
SP3
Maintenance
SP2
Quality management
SP1
Development and design
Key processes
Supporting processes
Figure 1. Typical process map for organizations in the food industry
Besides strategic management, each component process is functioning at a tactical and oper‐ative level and has quality metrics. In this chapter the major focus will be placed on the pro‐duction process (KP2), all other decompositions could be performed using the same pattern,with appropriate quality metrics. In further analysis the production process could be de‐composed into the sub processes presented in figure 2.
The production process (according to figure 2) consists of four sub processes: Logistic proc‐ess, Process realization, Process planning and scheduling and Production process control.
In further analysis the logistic sub process (KP 2.1) could be decomposed into the followingsub processes: Definitive logistic strategy; Plan inbound material flow; Operate outboundwarehousing; Operate transportation and Manage reverse logistics.
The Redesign of Processes’ Development in Food Production Organizations Using Quality Engineering Methods...http://dx.doi.org/10.5772/53154
441

KP2.2
Process realization
0
KP2
Production
KP2.1
Logistic process
KP2.3
Process planing and scheduling
KP2.4
Production process control
Figure 2. Decomposition of production process
The next important step is the definition of quality metrics. According to the definition ametric is a verifiable measure stated in either quantitative or qualitative terms. Quality met‐ric data may be used to: spot trends in performance, compare alternatives and predict per‐formance. Organizations need to collect information for a particular quality metric in orderto evaluate and improve their processes. For further analysis of the logistic process the fol‐lowing quality metrics are presented in Table 1.
The second sub process of KP2, Production process realization (KP 2.2) is decomposed intosub processes: Preparing workers for obligatory measures; Preparing working places; Reali‐zation of working activities and Work reporting. The accompanied quality metrics are pre‐sented in table 2.
Production process planning and scheduling (KP 2.3) is decomposed into the following subprocesses: Manage demand for products; Create material requirement plan (MRP) andSchedule production. The accompanied quality metrics are presented in table 3.
Food Industry442

Logistic strategy
realization %
Realization of
inbound plan of
material flow
Costs of
warehousing /plan
*100
Realization of plan
of outbound
transportation
Score
95-100 >100 <50 >100 10
85-95 90-100 50-60 90-100 9
75-85 80-90 60-70 80-90 8
65-75 70-80 70-80 70-80 7
55-65 60-70 80-90 60-70 6
45-55 50-60 90-100 50-60 5
35-45 40-50 100-110 40-50 4
25-35 30-40 110-120 30-40 3
<25 <30 >120 <30 2
0.25 0.25 0.25 0.25 weight
Table 1. Quality metrics of “Logistic process” KP 2.1
Level of
preparing
workers
Flexibility of
working plans
Level of plan
fulfillment
*100%
Quantitative
Waste %
Value of waste % Score
10 10 >100 <0.5 <0.5 10
9 9 90-100 0.5-1.0 0.5-1.0 9
8 8 80-90 1.0-2.0 1.0-2.0 8
7 7 70-80 2.0-3.0 2.0-3.0 7
6 6 60-70 3.0-4.0 3.0-4.0 6
5 5 50-60 4.0-5.0 4.0-5.0 5
4 4 40-50 5.0-6.0 5.0-6.0 4
3 3 30-40 6.0-7.0 6.0-7.0 3
2 2 20-30 7.0-8.0 7.0-8.0 2
1 1 <20 >8.0 >8.0 1
0.2 0.1 0.2 0.25 0.25 weight
Table 2. Quality metrics of “Production process realization” KP 2.2
The Redesign of Processes’ Development in Food Production Organizations Using Quality Engineering Methods...http://dx.doi.org/10.5772/53154
443

Accuracy of demand
%
Accuracy of MRP
%
Work in progress/
production
%
On time delivery
(OTD)
%
Score
85-95 85-95 5-10 90-95 9
75-85 75-85 10-15 85-90 8
65-75 65-75 15-20 80-85 7
55-65 55-65 20-25 75-80 6
45-55 45-55 25-30 70-75 5
35-45 35-45 30-35 65-70 4
25-35 25-35 35-40 60-65 3
15-25 15-25 40-45 55-60 2
<15 <15 >45 <55 1
0.15 0.25 0.3 0.3 weight
Table 3. Quality metrics of “Production process planning and scheduling” KP 2.3
Effectiveness of
control of inputs %
Effectiveness of
process control %
Effectiveness of
control of outputs %
Level of control
of measurement devices %
Score
>95 >95 >95 10 10
85-95 85-95 90-95 9 9
75-85 75-85 85-90 8 8
65-75 65-75 80-85 7 7
55-65 55-65 75-80 6 6
45-55 45-55 70-75 5 5
35-45 35-45 65-70 4 4
25-35 25-35 60-65 3 3
15-25 15-25 55-60 2 2
<15 <15 <55 1 1
0.25 0.25 0.3 0.2 weight
Table 4. Quality metrics of “Production process control” KP 2.4
Food Industry444

Production process control (KP 2.4) could be decomposed into the following sub process‐es: Control of inputs; Process control, Control of outputs, Non conformance product con‐trol and Control of measurement devices. The accompanied quality metrics are presentedin table 4.
Quality systems focus on the quality of what the organization in the food industry produces,the factors which will cause the organization to achieve its goals, the factors which mightprevent it satisfying customers and the factors which might prevent it from being produc‐tive, innovative and profitable. To control, assure and improve quality there is a need to fo‐cus on certain goals, in the case of goals of the production process (KP2) of a typicalcompany in the food industry we can define goals as the constituent of the previous subprocess goals (figure 3).
Quality goal of production process
Quality gool of logistic production process
Quality gool of production process realisation
Quality gool of production planing and scheduling
Quality gool of production process control
0.2
0.3 0.25
0.25
Figure 3. Quality goals of Production process KP2
By decomposition of the production process, analysis of sub processes and definition ofmetrics for each sub process it is possible to control, assure and improve the quality of aprocess in companies from the food industry sector. Definition of scores and weights inthe metrics of each sub process is performed according to the authors’ experience andavailable literature. In order to clearly demonstrate the idea all values are presented asdeterministic ones. Of course some of them could be expressed by linguistic expressionsrather than precious numbers but that issue will be elaborated in further text. The keyprocesses in the food industry were analyzed and compared, and the results of research
The Redesign of Processes’ Development in Food Production Organizations Using Quality Engineering Methods...http://dx.doi.org/10.5772/53154
445

are presented in figure 4., depicting the existence of the gap between the quality of devel‐opment and design process, and other processes. The analysis was performed on selectedcompanies from Serbia.
Figure 4. Quality of development and design process compared to quality of key processes
The gap between quality of the development and design process and other processes indi‐cates that the quality of the development and design process is lower than the quality of theother processes so the focus in process redesign and improvement should be on the redesignof process development and design.
3. Redesign of process development
3.1. Redesign of process development: Different approaches
The redesign of process development is connected to different methodologies of processchange. In the redesign of process development and in the process of business process rede‐sign itself there are a number of methodologies which cover the different amount ofchanges, results, used tools and probability of success. According to [11], and presented intable 5 a comparison of possible methodologies indicating whether they are applicable in thefood industry.
According to table 5 it is clear that Continuous Process Improvement (CPI) as a never end‐ing effort to discover, and eliminate the main causes of problems, is most likely to succeed incompanies from the food industry.
Process improvement and BPR & lean are less likely to succeed but they cover a larger num‐ber of changes in the companies. Beside a redesign of process development can be viewed asa process. According to [11], the redesign of process development is divided into 5 phases (4different entities) (Fig.5) with 10 steps.
Food Industry446

No. Change
methodology
Amount
of change
Score
of change
Used tools
Prob
abili
ty
of s
ucce
ss
App
licab
le in
food
indu
stry
1 BPR & lean -reduction more
than 50% of time,
costs and quality
-cross func. teams
or
functional teams
-process maps
-design principles
-benchmarking
-best practices
-lean tools
-less than
40%
yes
2 Process
improvement
-reduction more
than 20% of time,
costs and quality
-cross teams or
functional teams
-process maps
-design principles
-LE
-six sigma
-lean tools
-more than
70%
yes
3 Continuous
process
improvement
-small reduction
more than 20% of
time, costs and
quality
-one person or
one sub process
-more than
90%
yes
Table 5. Comparison of change methodologies (adapted from [11])
There are five phases in this model:
• Analysis Phase — Identify areas of opportunity and target specific problems.
• Design Phase — Generate solutions and identify the required resources to implement thechosen solution with approval of senior management.
• Development Phase — Formulate a detailed procedure for implementing the approvedsolution with staff and customers.
• Implementation Phase — Execution of the solution and implementation of the redesign.
• Evaluation Phase — Build metrics, measurement tools, monitor implementation, andevaluate measurements for continuous improvement.
Process redesign as a process could be presented in the 10 steps, according to figure 5. Thefirst five steps are common for most companies and the other steps could be defined accord‐ing to the specific problem and in some cases using different quality methods and tools.
The first step covers:
• Meeting with senior management for the purpose of discussing barriers to process,
• Improvement, problem of eventual job losses and crafting of the kick-off-speech,
• Meeting with affected process managers and employees.
The Redesign of Processes’ Development in Food Production Organizations Using Quality Engineering Methods...http://dx.doi.org/10.5772/53154
447

The second step is very important for success of the complete process. It is realized accord‐ing to the team engineering approach [12, 13] with specified roles of team members: projectmanager, project principal, process improvement team, facilitator, and expert in ICT.
2
Creating the team
1
Introduction to process redesign
8
Charing the redesign with
staff and customer
3
Creating the as-is process map
7.2
Review by senior management
5
Benchmarking and best practices analysis
4
Customer interview
0
6
Creating the ideal (desired)
process
10
Installing the metrics and continuous
improvement
9
Implementing the redesign
7.1
Presenting the redesigned
process to senior management
Customer
Senior management
team
process
Figure 5. Process redesign as process
Food Industry448

Senior management has the important task of directing team work in the first meetings andby the definition of statements and roles which will define the procedures for the teamwork.
The third step is performed by team work, starting from analysis of the existing state ofprocesses, best practice and creating the as-is state of processes.
The fourth step covers the interviews with customers, according to: Customer request andneeds; Ranking the criteria; Needed performance according to each criteria and Competitorposition according to ranking and criteria.
The use of benchmarks and the development of new forms of benchmarking for best prac‐tice is well established in the food industry, although less so in other areas of the food chain.Benchmarking and best practice analysis is performed in step five through analysis of foodindustry competitions, using information from: industry trade associations (trade chambersetc.), industry studies, consultants‘ reviews, distributors, former employees, competitorsthemselves, published documents, indirect information sources from competitors, govern‐ment sources, customers, supplies, and reverse – engineering products.
Other steps are performed according to appropriate redesign methodology adapted for eachspecific organization from the food industry. In addition, different quality engineering toolsand methods could be employed in the following steps. It is important to emphasize thatICT could be used as a support during process redesign on the one hand, and on the otherhand ICT and Business Process Management cover various aspects such as process controland supply chain management.
3.2. Quality engineering methods and tools in the food industry
Quality engineering methods and tools have an important role in the food industry becausecustomers and markets demand proven high quality products and protection against lowquality and unsafe products. On the other hand, the food industry needs to attain the quali‐ty that meets international standards for quality products. As it was mentioned the food in‐dustry needs to cope with the challenge of modern technological production methods, knowthem and assimilate them in quality assurance areas using new innovative hi-tech sensoryand measurement instruments, supervise the production process, so that the designatedquality level is always met. In order to perform all of these tasks and in order to meet all ofthe existing challenges the food industry has a number of engineering methods and toolsavailable.
We analyzed companies from Serbia (listed in the following text) and compared results withworld practice. The following quality engineering methods and tools used by the food in‐dustry have been analyzed according to their frequency and success rate: (1) Ichicawa’s sev‐en basic tools for quality (flow chart, check sheet, histograms, scatter plots, control chart,cause-effect diagram, Pareto analysis); (2) The seven new tools for improvement (affinity di‐agram, interrelationship diagram, tree diagram, prioritization grid, matrix diagram, processdecision program chart, activity network diagram) ; (3) Cost of Quality (CoQ) ; (4) Projectmanagement; (5) Simultaneous engineering; (6) Statistical process control; (7) Reliability and
The Redesign of Processes’ Development in Food Production Organizations Using Quality Engineering Methods...http://dx.doi.org/10.5772/53154
449

risk engineering; (8) World class manufacturing (WCM) ; (9) Six-sigma; (10) Lean six-sigma;(11) Taguchi method; (12) Zero defect (ZD) ; (13) Design of experiments; (14) Quality Func‐tion Deployment (QFD) ; (15) FMEA; (16) FMECA; (17) Just in Time (JiT) ; (18) BusinessProcess Reengineering; (19) Balance Score Cards (BSC) ; and (20) other.
The results of the usage and frequency of the specific quality engineering methods and toolslisted above, in the case of the Serbian food industry, is presented in Figure 6.
Figure 6. Distribution of quality methods‘ & tools‘ application
According to the results of the research, presented in figure 6, the dominant method or toolin food companies in Serbia position have Ichicawa’s seven basic tools for quality (flowchart, check sheet, histograms, scatter plots, control chart, cause-effect diagram, Pareto anal‐ysis). It is also obvious that Serbian companies in general do not employ (at sufficient level)more advanced, new methods needed for higher quality process improvement.
Project management and FMEA are also popular in Serbian food processing companies. Thesecond question is an analysis of profit compared with the quality tools and methods. Ac‐cording to research there is a high positive correlation between an increase of profit and ap‐plication of quality tools and methods and it is presented in figure 7.
According to figure 7 the level of profit (per employee) increases with implementation ofdifferent quality methods and tools. The largest increase in profit can be seen in the applica‐tion of: Cost of Quality (CoQ), Statistical process control, Business Process Reengineering.The increase in the profit with the application of seven new tools is larger than with the ap‐plication of the basic seven tools for quality. It is interesting that the basic seven tools for
Food Industry450

quality are the most commonly used but their contribution to profit increase is the lowestcompared with other frequently used quality methods and tools. Another result is that theseven new tools do not contribute more significantly to the increase of profit due to the low‐er level of knowledge of employees connected with the new approaches.
level of application of quality tools and methods
Level of profit/ employs
200.000
100.000
0
-100.000
-200.000
without tools 7 new tools
43 6 14 15 16 18
Figure 7. Impact of level of application of quality tools and methods on profit/employee
Finally, although rather “old” QFD proved itself as a very useful and efficient tool. General‐ly, with an increase of the level of application of quality tools and methods profit/employeesincreases in the analyzed organizations.
3.3. Fuzzy approach for evaluation of the importance of entities in supply chains in thefood industry
The process of logistics and the food supply chain is very important for all companies fromthe food industry. In food supply chains, definition of weight / importance of different enti‐ties (processes, sub processes and goals) in the presence of uncertainties is one of the impor‐tant goals for the management team. A similar problem has been met and emphasized in thedefinition of quality metrics and evaluation of scores and weights in section 2. The solution
The Redesign of Processes’ Development in Food Production Organizations Using Quality Engineering Methods...http://dx.doi.org/10.5772/53154
451
to this problem must be placed on the whole of the supply chain because of its critical effecton efficiency.
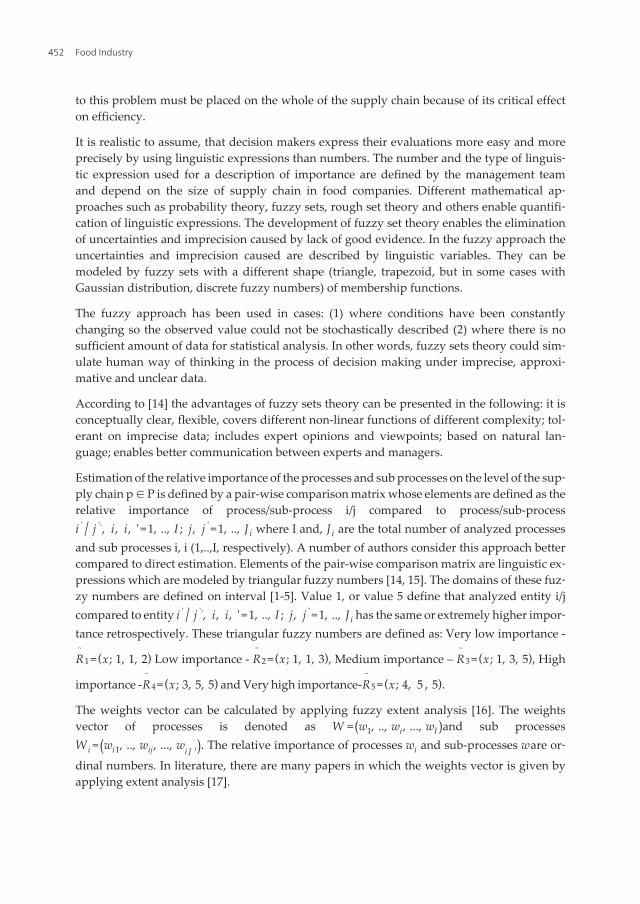
It is realistic to assume, that decision makers express their evaluations more easy and moreprecisely by using linguistic expressions than numbers. The number and the type of linguis‐tic expression used for a description of importance are defined by the management teamand depend on the size of supply chain in food companies. Different mathematical ap‐proaches such as probability theory, fuzzy sets, rough set theory and others enable quantifi‐cation of linguistic expressions. The development of fuzzy set theory enables the eliminationof uncertainties and imprecision caused by lack of good evidence. In the fuzzy approach theuncertainties and imprecision caused are described by linguistic variables. They can bemodeled by fuzzy sets with a different shape (triangle, trapezoid, but in some cases withGaussian distribution, discrete fuzzy numbers) of membership functions.
The fuzzy approach has been used in cases: (1) where conditions have been constantlychanging so the observed value could not be stochastically described (2) where there is nosufficient amount of data for statistical analysis. In other words, fuzzy sets theory could sim‐ulate human way of thinking in the process of decision making under imprecise, approxi‐mative and unclear data.
According to [14] the advantages of fuzzy sets theory can be presented in the following: it isconceptually clear, flexible, covers different non-linear functions of different complexity; tol‐erant on imprecise data; includes expert opinions and viewpoints; based on natural lan‐guage; enables better communication between experts and managers.
Estimation of the relative importance of the processes and sub processes on the level of the sup‐ply chain p ∈ P is defined by a pair-wise comparison matrix whose elements are defined as therelative importance of process/sub-process i/j compared to process/sub-processi ' / j '', i, i, ' =1, .., I ; j, j ' =1, .., J i where I and, J i are the total number of analyzed processesand sub processes i, i (1,..,I, respectively). A number of authors consider this approach bettercompared to direct estimation. Elements of the pair-wise comparison matrix are linguistic ex‐pressions which are modeled by triangular fuzzy numbers [14, 15]. The domains of these fuz‐zy numbers are defined on interval [1-5]. Value 1, or value 5 define that analyzed entity i/jcompared to entity i ' / j '', i, i, ' =1, .., I ; j, j ' =1, .., J i has the same or extremely higher impor‐tance retrospectively. These triangular fuzzy numbers are defined as: Very low importance -
R~
1 =(x; 1, 1, 2) Low importance - R~
2 =(x; 1, 1, 3), Medium importance – R~
3 =(x; 1, 3, 5), High
importance -R~
4 =(x; 3, 5, 5) and Very high importance-R~
5 =(x; 4, 5 , 5).
The weights vector can be calculated by applying fuzzy extent analysis [16]. The weightsvector of processes is denoted as W =(w1, .., wi, ..., wI )and sub processesW i =(wi1, .., wij, ..., wi J i). The relative importance of processes wi and sub-processes ware or‐dinal numbers. In literature, there are many papers in which the weights vector is given byapplying extent analysis [17].
Food Industry452

The importance of the goals which are defined on the level of each sub process are definedby direct estimation made by a management team. According to literature, it can be con‐cluded that this approach of estimation of importance of an entity is justified when the num‐ber of entities is less than five.
The importance of each goal k, k=1,,.,K ij on the level of sub process j, j=1,.., J i could be descri‐bed using five linguistic expressions which are modeled by triangular fuzzy numbers
v~ijk =(y; lijk , mijk , uijk ). The total number of goals on the level of each sub process is denoted
as K ij. The value of domains is defined on a standard measurement scale [18]. These triangu‐lar fuzzy numbers are defined in the following way: very low value-(y; 1, 1, 3), low value-(y; 1, 3, 5), medium value-(y; 3, 5, 7), high value-(y; 5, 7, 9) and very high value-(y; 8, 9, 9). Since the goals could be beneficial or costly it is necessary to perform
normalization of fuzzy values v~ijk , i =1, .., I ; j =1, .., J i; k =1, .., K ij. In this case the proce‐
dure of linear normalization is used [16]. Normalized values of goals weights are marked as
r~ijk , i =1, .., I ; j =1, .., J i, k =1, .., K ij. In further analysis only one goal with a critical effect
on the management of sub-process j, j=1,.., J i is considered.
For the management team carrying out the analysis, the following tasks are important: (1) todetermine the rank of the process in a company (2) to determine the rank of a sub process onthe process level in a company, (3) to determine the rank of sub processes with respect to theimportance of goals and the importance of the considered sub process (4) to determine therank of processes with respect to the importance of the goals, the relative importance of sub-processes of process i, i=1,..Im and the relative importance of process i, i=1,.,I, and (5) calcu‐late the degree of belief that the sub process, or process which is on second place in the rankcould be on first place; answers to these questions are given by comparing triangular fuzzy
numbers c~ij, d
~
i , i =1, .., I ; j =1, .., J i, respectively.
The algorithm for analysis of the relative importance of processes, sub-processes and goalsin a company p ∈ P is formally given as follows.
Step 1. Input fuzzy matrix W~
= [w~i i '], i, i ' =1, .., I ; i ≠ i '; p =1, ..., P
Step 2. Calculate weight vectorW =(w1, .., wi, ..., wI ); rank the processes by placing on firstplace the process with highest wi.
Step 3. Calculate weight vectorW i =(wi1, .., wij, ..., wi J i); rank sub processes on the level ofeach process i, i=1,..,I by placing on the first place the sub process with the highest value wij.
Step 4. Transform all linguistic expressions which are modeled by triangular fuzzy numbers
v~ijk into r
~ijk =(z; L ijk , M ijk , U ijk )by applying linear normalization procedure [16].
Step 5. Calculate the weighted normalized aggregated relative importance of sub-process j:
The Redesign of Processes’ Development in Food Production Organizations Using Quality Engineering Methods...http://dx.doi.org/10.5772/53154
453

c~ij =
1K ij⋅∑k=1
Kijwij ⋅ r
~ijk i =1, .., I ; j =1, .., J i, k =1, .., K ij,
Step 6. Calculate the weighted normalized aggregated relative importance of process i:
c~i =
1J i⋅∑j=1
J iwi ⋅ c
~ij, i =1, .., I ; j =1, .., J i
Step 7. Rank sub-processes and processes according to decreasing order, c~ij and d
~
i, respec‐tively and define level of belief that sub-process j, j=1,...,J i, or process i, i=1,..,I could have thehighest importance with respect to the importance of all goals and the importance of subprocess j, j=1,...,J i, or process i, i=1,..,I [19].
The developed procedure is illustrated with an example with real-life data from the authors’research.
The pair-wise comparison matrix of relative importance of processes is:
~ ~3 2
~ ~3 3~ ~
2 3
1,1,1 1 /
1,1,1
1 / 1 / 1,1,1
R R
R R
R R
é ùê úê úê úê úê úê úë û
(1)
The weight vector of processes is:
W =(0.015 0.072 0.114 0.114 0.171 0.171 0.171 0.171)
The most important processes in considered food company are: Project execution (i=5), Proc‐ess execution (i=6), Quality assurance (i=7) and Support processes (i=8).
The pairwise comparison matrix of relative importance of subprocesses under process i=1 is:
~1
~ ~ ~ ~ ~ ~ ~1 3 3 4 4 4 4
~ ~ ~ ~ ~ ~2 2 3 3 3 3
~ ~ ~ ~ ~ ~3 2 3 3 3 3
~ ~ ~ ~ ~ ~3 2 3 3 3 3
~ ~ ~ ~4 3 3 3
~ ~ ~ ~4 3 3 3
1,1,1 1 / 1 / 1 / 1 / 1 / 1 / 1 /
1,1,1 1 / 1 / 1 / 1 / 1 / 1 /
1,1,1 1,1,1 1 / 1 / 1 / 1 /
1,1,1 1,1,1 1 / 1 / 1 / 1 /
1,1,1 1,1,1 1,1,1 1,1,1
1,1,1 1
R
R R R R R R R
R R R R R R
R R R R R R
R R R R R R
R R R R
R R R R~ ~ ~ ~
4 3 3 3~ ~ ~ ~
4 3 3 3
,1,1 1,1,1 1,1,1
1,1,1 1,1,1 1,1,1 1,1,1
1,1,1 1,1,1 1,1,1 1,1,1
R R R R
R R R R
é ùê úê úê úê úê úê úê úê úê úê úê úê úê úê úê úê úê úë û
(2)
Food Industry454

The weight vector of sub-processes on level process i=1 is:
W1 =(0.295 0.497 0.208)
Sub process under process is “Strategic choice” (j=2).
The pairwise comparison matrix of relative importance of subprocesses under process i=2 is:
~ ~ ~ ~2 2 3 2
~ ~ ~ ~2 2 2 3
~ ~ ~ ~2 2 2 3
~ ~ ~ ~ ~ ~3 2 2 2 3 4
~ ~ ~ ~2 2 2 3
~ ~ ~ ~ ~2 2 3 2 2
~ ~ ~ ~ ~1 3 3 4
1,1,1 1 / 1 / 1 / 1 / 1,1,1 1,1,1
1,1,1 1,1,1 1 / 1,1,1
1,1,1 1,1,1 1,1,1
1,1,1
1,1,1 1,1,1 1 / 1,1,1
1,1,1 1 / 1 / 1 / 1 / 1,1,1
1 / 1 / 1 / 1 / 1 /
R R R R
R R R R
R R R R
R R R R R R
R R R R
R R R R R
R R R R R~
3 21 / 1,1,1R
é ùê úê úê úê úê úê úê úê úê úê úê úê úê úê úê úë û
(3)
The weight vector of sub-processes on level process i=2 is:
W2 =(0.095 0.165 0.178 0.229 0.165 0.107 0.061)
Sub process under process is “Level of leadership transformation” (j=4).
The pairwise comparison matrix of relative importance of subprocesses under process i=3 is:
~ ~ ~2 3 3
~ ~ ~2 2 2
~ ~3 2
~ ~3 2
1,1,1
1 / 1,1,1
1 / 1 / 1,1,1 1,1,1
1 / 1 / 1,1,1 1,1,1
R R R
R R R
R R
R R
é ùê úê úê úê úê úê úê úê úë û
(4)
The weight vector of sub-processes on level process i=3 is:
W3 =(0.39 0.275 0.168 0.168)
Subprocess under process is “Roles and responsibilities” (j=1).
The Redesign of Processes’ Development in Food Production Organizations Using Quality Engineering Methods...http://dx.doi.org/10.5772/53154
455

The pairwise comparison matrix of relative importance of subprocesses under process i=4 is:
~ ~ ~ ~2 2 2 3
~ ~ ~ ~2 2 2 2
~ ~ ~ ~2 2 2 3
~ ~ ~ ~ ~2 2 2 2 2
~ ~ ~ ~2 2 2 3
~ ~ ~ ~2 2 2 2
~ ~ ~3 2
1,1,1 1 / 1,1,1 1 / 1,1,1 1 / 1 /
1,1,1 1,1,1 1,1,1 1 /
1,1,1 1 / 1,1,1 1 / 1,1,1 1 / 1 /
1 / 1,1,1 1 / 1,1,1 1 /
1,1,1 1 / 1,1,1 1,1,1 1 / 1 /
1,1,1 1,1,1 1,1,1 1 /
R R R R
R R R R
R R R R
R R R R R
R R R R
R R R R
R R R~ ~ ~
3 2 3 2 1,1,1R R R
é ùê úê úê úê úê úê úê úê úê úê úê úê úê úê úê úë û
(5)
The weight vector of sub-processes on level process i=4 is:
W4 =(0.1 0.155 0.1 0.144 0.123 0.155 0.222)
Sub-process under process i=4 is “Process significance”. (j=7).
Processes i=5 and i=6 could be decomposed on four sub processes each. The relative impor‐tance of sub processes under process i=5 and i=6 are equal. Such thatw5 j =w6 j =0.25, j =1, 2, 3, 4.
The pairwise comparison matrix of relative importance of subprocesses under process i=7 is:
~ ~ ~ ~3 4 4 3
~ ~ ~3 3 3
~ ~ ~4 3 2
~ ~ ~4 3 2
~ ~ ~3 2 2
1,1,1 1 / 1 / 1 / 1 /
1,1,1 1 / 1 / 1,1,1
1,1,1 1,1,1
1,1,1 1,1,1
1,1,1 1 / 1 / 1,1,1
R R R R
R R R
R R R
R R R
R R R
é ùê úê úê úê úê úê úê úê úê úê úë û
(6)
The weight vector of sub-processes on level process i=7 is:
W7 =(0.027 0.186 0.29 0.29 0.205)
Sub process under process i=7 is “Level of accomplishment of quality goals”.(j=3).
Process i=8 could be decomposed on eight sub processes. According to the fuzzy rating ofthe management team, all sub processes have equal of the relative importance, so thatw8 j =0.143, j =1, ..., 8.
Estimation of the importance of goals with critical effect management of the sub processesare given in Table 6. By applying the Algorithm (Step 5 to Step 7) rank of sub processes withrespect to the relative importance of the defined goals and the relative importance of the sub
Food Industry456

processes and the rank of the processes with respect to the relative importance of the subprocesses and the relative importance of processes is determined. The calculated ranks arepresented in Table 7 and Table 8.
According to the calculated values of importance of the sub processes with respect to theirrelative importance and the relative importance of the goals of each sub process (see Table 2)the following analysis can be made: The sub process which has the highest importance: (1)Strategic alignment (i=1) is Strategic choice (j=2), (2) Process development (i=4) is Process sig‐nificance (j=7) and (3) Quality assurance of goals (j=3) and documentation of the process(j=4). Based on the calculated degree of belief it is clear that the other sub processes, i=1, i=4and i=7 have very low importance compared to the first ranked sub process.
ijk, i=1,..,I; j=1,...,J i
k=1,.., K ij
v~
ijk r~
ijkijk, i=1,..,I; j=1,...,J i
k=1,.., K ij
v~
ijk r~
ijk
111 low value (0.11,0.11,0.33) 511 high value (0.56,0.78,1)
122 medium value (0.33,0.56,0.78) 522 high value (0.56,0.78,1)
133 very low value (0.11,0.11,0.33) 533 high value (0.56,0.78,1)
222 medium value (0.33,0.56,0.78) 544 high value (0.56,0.78,1)
233 high value (0.56,0.78,1) 611 high value (0.56,0.78,1)
244 medium value (0.33,0.56,0.78) 622 very high value (0.89,1,1)
255 medium value (0.33,0.56,0.78) 633 very high value (0.89,1,1)
266 high value (0.56,0.78,1) 644 very high value (0.89,1,1)
277 medium value (0.33,0.56,0.78) 711 high value (0.56,0.78,1)
311 medium value (0.33,0.56,0.78) 722 very high value (0.89,1,1)
322 medium value (0.33,0.56,0.78) 733 very high value (0.89,1,1)
333 high value (0.56,0.78,1) 744 very high value (0.89,1,1)
344 very high value (0.89,1,1) 755 very high value (0.11,0.11,0.12)
411 high value (0.56,0.78,1) 811 high value (0.56,0.78,1)
422 high value (0.56,0.78,1) 822 high value (0.56,0.78,1)
433 very high value (0.89,1,1) 833 high value (0.56,0.78,1)
444 high value (0.56,0.78,1) 844 high value (0.56,0.78,1)
455 high value (0.56,0.78,1) 855 high value (0.56,0.78,1)
466 high value (0.56,0.78,1) 866 medium value (0.33,0.56,0.78)
477 very high value (0.89,1,1) 877 very high value (0.89,1,1)
Table 6. Importance of goals on the level of each sub process with the critical effect on management of those subprocesses
The Redesign of Processes’ Development in Food Production Organizations Using Quality Engineering Methods...http://dx.doi.org/10.5772/53154
457

ij, i=1,..,I;
j=1,.J i
c~
ij Rank Degree of
belief
ij, i=1,..,I;
j=1,..J i
c~
ij Rank Degree of belief
11 (0.032,0.097,0.165) 2 0.005 51 (0.14,0.195,0.25) 1
12 (0.164,0.278,0.388) 1 52 (0.14,0.195,0.25) 1
13 (0.023,0.023,0.068) 3 53 (0.14,0.195,0.25) 1
21 (0.031,0.053,0.074) 5 54 (0.14,0.195,0.25) 1
22 (0.092,0.129,0.165) 1 61 (0.14,0.195,0.25) 2 0.34
23 (0.059,0.1,0.139) 3 62 (0.222,0.25,0.25) 1
24 (0.076,0.128,0.179) 2 0.99 63 (0.222,0.25,0.25) 1
25 (0.092,0.129,0.165) 1 64 (0.222,0.25,0.25) 1
26 (0.035,0.05,0.083) 4 71 (0.015,0.021,0.027) 4
27 (0.02,0.034,0.048) 6 72 (0.165,0.185,0.185) 2 0.00
31 (0.129,0.218,0.304) 1 73 (0.258,0.29,0.29) 1
32 (0.091,0.154,0.214) 3 74 (0.258,0.29,0.29) 1
33 (0.094,0.131,0.168) 4 75 (0.023,0.023,0.026) 3
34 (0.15,0.168,0.168) 2 0.44 81 (0.08,0.112,0.143) 2 0.34
41 (0.056,0.078,0.1) 6 82 (0.08,0.112,0.143) 2 0.34
42 (0.087,0.121,0.155) 2 83 (0.08,0.112,0.143) 2 0.34
43 (0.089,0.1,0.1) 4 84 (0.08,0.112,0.143) 2 0.34
44 (0.081,0.112,0.144) 3 85 (0.08,0.112,0.143) 2 0.34
45 (0.069,0.096,0.123) 5 86 (0.055,0.08,0.112) 3
46 (0.087,0.121,0.155) 2 0.00 87 (0.127,0.143,0.143) 1
47 (0.196,0.22,0.23) 1
Table 7. Rank of sub-process with respect to the importance and goals of the sub process
Under the following processes, the sub processes which have the most importance are: (1)Process governance (i=3)- Rules and responsibilities (j=1), (2) Process execution (i=6)- Plan‐ned and achieved goals (j=2), Resource utilization (j=3), and Human resources (j=4), and (3)Support processes (i=8)- ICT support (j=7). Based on the degree of beliefs, the managementteam can conclude that the sub processes which are placed on second place in the rank un‐der treated processes have less importance compared to the sub processes which are placedon first place. However, in making operational decisions, the importance of the sub process‐es which are on second place should be considered. The most important sub-process underProcess leadership (i=2) is Level of leadership transformation (j=5). Since the degree of belieffor the sub process Level of trust and communication in an organization (j=4) is 0.99, it isclear that these two sub-processes have equal relative importance.
Food Industry458

Process execution is the most important process in the analyzed food processing companiesaccording to analysis of the importance of all sub processes, the importance of the definedgoals of the sub process and the importance of the process. The degree of belief that theprocess which is denoted as Project execution has the highest importance of 0.8. Accordingto the calculated result, the mentioned process has high importance for the specific foodcompany, so the management team must have this in mind in making strategic decisions.
i
i=1,..,Id~
iRank Degree of belief that process has the highest
importance
1 (0.001,0.0.002,0.003) 4
2 (0.004,0.006,0.009) 7
3 (0.013,0.019,0.024) 5
4 (0.011,0.014,0.016) 6
5 (0.024,0.033,0.043) 2 0.8
6 (0.1015,0.04,0.043) 1
7 (0.025,0.028,0.028) 3
8 (0.014,0.019,0.024) 5
Table 8. Rank of process with respect to its importance and importance of goals of the sub-process of each process
The presented model is used for the development of a very usable software solution that en‐ables calculation of the importance of each goal, process and sub process [20, 21].
3.4. Strategy map
A strategy map describes how an organization can create sustained value for its sharehold‐ers, customers and communities.
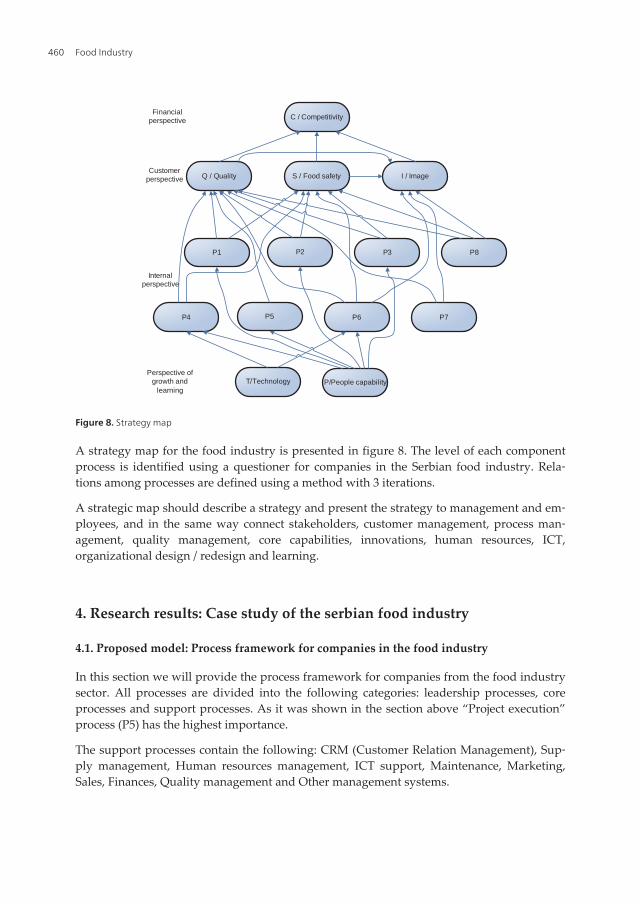
The strategy map is developed based on the Kaplan and Norton model. A Strategy map de‐scribes how the organization creates value by connecting strategy objectives in an explicitcause and effect relationship in the four BSC objectives (financial, customer, processes,learning and growth). Strategy map is a strategic part of the BSC (Balanced Score Card)framework to describe strategies for value creation.
• Financial perspective is recognized in competitiveness.
• Customer perspective is identified: (1) quality, (2) safety, and (3) image.
• Internal perspective’s eight processes: (P1) strategy alignment, (P2) process leadership,(P3) process governance, (P4) process development, (P5) project execution, (P6) processexecution, (P7) quality assurance process, and (P8) supporting processes.
• Perspective or growth and learning : (1) technology and (2) people capability.
The Redesign of Processes’ Development in Food Production Organizations Using Quality Engineering Methods...http://dx.doi.org/10.5772/53154
459
C / Competitivity
Q / Quality S / Food safety I / Image
P2P1 P3 P8
P5P4 P6 P7
T/Technology P/People capability
Financial perspective
Customer perspective
Internal perspective
Perspective of growth and
learning
Figure 8. Strategy map
A strategy map for the food industry is presented in figure 8. The level of each componentprocess is identified using a questioner for companies in the Serbian food industry. Rela‐tions among processes are defined using a method with 3 iterations.
A strategic map should describe a strategy and present the strategy to management and em‐ployees, and in the same way connect stakeholders, customer management, process man‐agement, quality management, core capabilities, innovations, human resources, ICT,organizational design / redesign and learning.
4. Research results: Case study of the serbian food industry
4.1. Proposed model: Process framework for companies in the food industry
In this section we will provide the process framework for companies from the food industrysector. All processes are divided into the following categories: leadership processes, coreprocesses and support processes. As it was shown in the section above “Project execution”process (P5) has the highest importance.
The support processes contain the following: CRM (Customer Relation Management), Sup‐ply management, Human resources management, ICT support, Maintenance, Marketing,Sales, Finances, Quality management and Other management systems.
Food Industry460

Proc
ess
PiEstimationof processimportance
Estimation of importance of sub process in theframe of specific process
Estimation of importance of sub process goals
PP1 PP2 PP3 PP4 PP5 PP6 PP7 PP1 PP2 PP3 PP4 PP5 PP6 PP7
P1 5 7 8 6 5 6 4
P2 6 6 7 7 8 7 6 5 5 6 7 6 6 7 6
P3 7 8 7 6 6 6 6 7 8
P4 7 6 7 6 7 6 7 8 7 7 8 7 7 7 8
P5 8 7 7 7 7 7 7 7 7
P6 8 7 6 7 6 7 8 8 8
P7 8 7 8 9 9 8 7 8 9 9 8
P8 8 5 6 6 6 5 5 6 7 7 7 7 7 6 8
Table 9. Cross reference of processes, their importance and importance of their sub processes and goals
Strategy alignment
Process leadership
P1
P2
Process Development
P4
Quality assurance
processP7
Project execution
P5
Process execution
P6
CRM SupplyManagement
Human Resouces
ManagementMaintenanceICT support
Marketing Sales FinanceOther
management systems
Quality management
cust
omer
Process leadership
Needs & requests
P8 – support processes
Process performance
New projects
Core processes
people capability tehnology project results
Process governance
P3
Figure 9. Process framework for companies in the food industry
Each process presented in figure 9 has its own importance as a whole. It is clear that eachprocess could be decomposed on the accompanied sub processes.
The Redesign of Processes’ Development in Food Production Organizations Using Quality Engineering Methods...http://dx.doi.org/10.5772/53154
461
Questionnaire
Questionnaire M Questionnaire M
1 Questionnaire for strategy alignment 6 Questionnaire for process execution
1 Estimation of strategic alignment of
processes;
1 Level of achieving of process goals
2 Estimation of strategic choices; 2 Gap between planned and achieved
goals
3 Estimation of process architecture. 3 Level of resource utilization (for process
needs):
2 Questionnaire for Process Leadership 4 Human;
1 Level of transformational leadership; 5 Equipment;
2 Level of transactional leadership; 6 ICT;
3 Level of trust in leadership; 7 Knowledge.
4 Level of trust and communication in
organization;
6.1 Questionnaire for process performance
5 Level of business process awareness; Evaluation of increase of process
awareness;
6 Level of process innovation; Evaluation of definition and
establishment of rewards;
7 Level of promotion of manager success. Evaluation of understanding or
responsibilities for the process;
3 Questionnaire for Process governance Evaluation of process metrics;
1 Estimation of roles selection and
responsibilities;
Evaluation of performance monitor;
2 Estimation of roles selection; Evaluation of management of the
process;
3 Estimation of evaluation and control of
management including estimation of
the risk of process;
Evaluation of continuous
improvement;
4 Evaluation of implementation of
contemporary methods and tools in
business processes.
Evaluation of communications.
4 Questionnaire for Process development 7 Questionnaire for Quality assurance of
processes
1 Evaluation of concept of desired
process;
1 Level of effectiveness of processes – On
time Delivery of products
Food Industry462
Questionnaire
Questionnaire M Questionnaire M
2 Evaluation of relevance of process
goals and indicators;
2 Level of quality of inputs in process
3 Evaluation of achievement of the
process goals;
3 Level of quality of working procedures
4 Evaluation of documentation of
processes;
4 Level of achieving the quality goals
5 Evaluation of processes investigation; 5 Level of process coast/planned process
costs
6 Evaluation of analysis of processes; 8 Evaluation of support processes
7 Evaluation of process significance; 1 Evaluation of marketing process;
8 Evaluation of process flexibility; 2 Evaluation of sale;.
9 Evaluation of Process agility; 3 Evaluation of customer relations
management (CRM);
10 Level of inclusion and complexity of
process demands .
4 Evaluation of supply chain
management (SCM);
5 Questionnaire for Project execution 5 Evaluation of finances;
1 Evaluation of ,,right” projects; 6 Evaluation of human resources
management;
2 Evaluation of establishment of project
organization;
7 Evaluation of ICT support;
3 Evaluation of portfolio management
and control;
8 Evaluation of implementation of
quality management;
4 Evaluation of project management
frameworks.
9 Evaluation of maintenance;
Evaluation – Technology 10 Evaluation of other management
systems
Evaluation of technology level of
production
9 Evaluation of entities in customers
perspective
Evaluation of level of quality
approach (WCM, Lean, 6 sigma, IMS)
1 Evaluation of product quality
Evaluation of implementation of
system and process approach
(reengineering, time, electivity)
2 Evaluation of quality of organization
Evaluation of business decision
making, business intelligence
3 Evaluation of product safety
The Redesign of Processes’ Development in Food Production Organizations Using Quality Engineering Methods...http://dx.doi.org/10.5772/53154
463

Questionnaire
Questionnaire M Questionnaire M
Evaluation of human resources 4 Evaluation of the brand, image of
organization
Evaluation of internal capability. 10 Evaluation of entities in financial perspective
Evaluation of Center of Business
Innovation (CBI)
1 Level of competitiveness compared to
EU market
Evaluation of CBI engagement model.
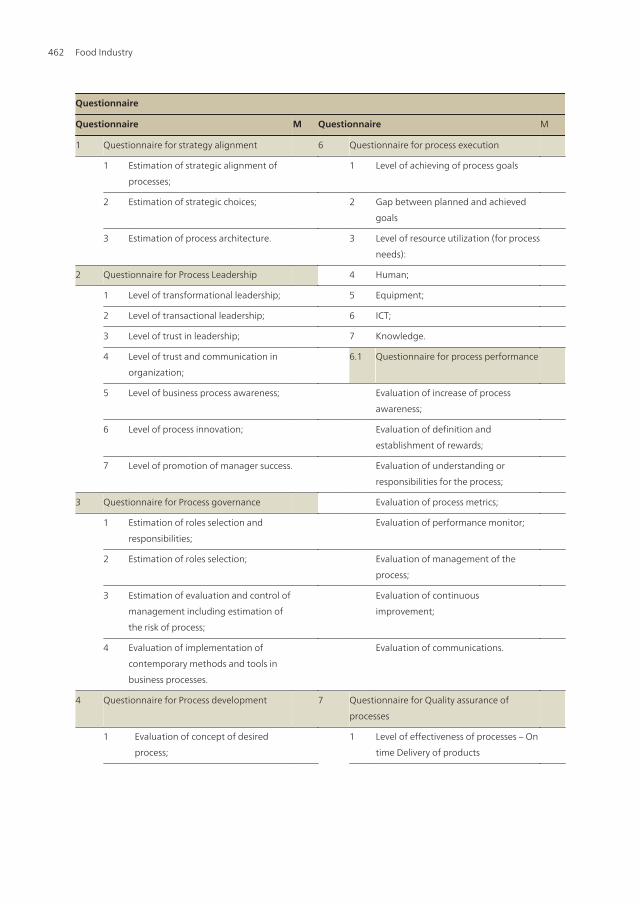
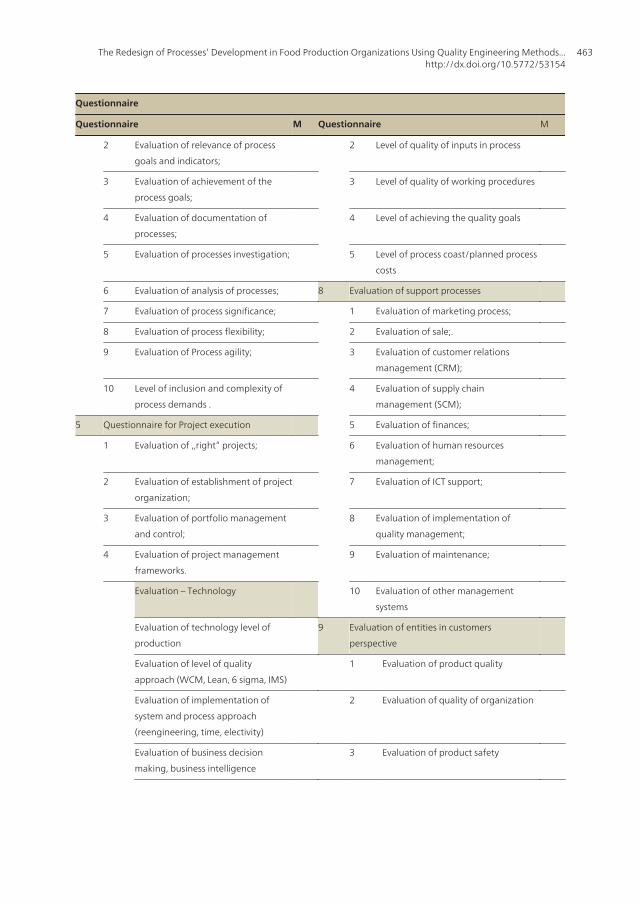
Table 10. Questionnaire for Serbian companies
Total number of 53 companies were analyzed and results are presented in table 10.
Each sub process has importance in the frame of the specific process as well as the impor‐tance of its goal. The overall data gathered as the result of research in Serbian companies inthe food industry is presented in table 9. The presented data could be combined with lin‐guistically expressed opinion and used for ranking and simulation of quality goals accord‐ing to the approach presented using fuzzy sets. Data were gathered using the questionnairepresented as table 10.
No. Company Stand. 1 2 3 4 5 5.1 5.2 6 6.1 7 8 9 10
Company 01 22000 8 6 7 7 5 8 8 1 7 9 8 6 9
Company 02 22000 5 8 5 4 7 6 4 1 6 7 7 6 5
Company 03 22000 7 6 7 5 8 6 4 1 7 5 9 7 2
Company 04 22000 7 6 7 4 5 6 5 1 6 6 7 5 6
Company 05 22000 6 8 5 5 7 8 7 1 7 6 9 8 6
Company 06 CAC 4 7 2 2 5 5 1 1 5 2 6 4 3
Company 07 CAC 5 7 4 4 6 8 4 1 6 5 8 8 3
Company 08 CAC 7 8 6 4 6 8 5 1 8 7 9 7 5
Company 09 CAC 3 6 2 2 6 4 1 1 3 2 4 4 2
Company 10 CAC 5 6 5 3 5 4 4 1 4 4 6 4 5
Company 11 CAC 6 7 6 5 5 6 6 1 5 7 7 5 8
Company 12 CAC 4 7 4 3 5 6 2 1 5 5 5 5 4
Company 13 CAC 4 5 4 2 5 6 5 1 5 4 6 6 4
Company 14 CAC 4 5 3 3 7 5 4 1 6 6 6 6 2
Company 15 CAC 5 6 5 3 6 8 1 1 5 5 6 7 4
Company 16 CAC 4 4 3 3 4 4 3 1 5 4 4 3 4
Food Industry464
No. Company Stand. 1 2 3 4 5 5.1 5.2 6 6.1 7 8 9 10
Company 17 CAC 4 3 2 2 4 3 1 1 4 1 3 3 3
Company 18 5 4 5 4 5 8 6 0 7 6 7 8 5
Company 19 5 3 5 3 5 8 6 1 7 6 7 8 2
Company 20 5 3 5 3 5 8 6 1 8 5 8 8 4
Company 21 4 2 4 3 4 9 7 0 6 5 6 7 7
Company 22 6 5 5 4 4 8 6 0 5 7 6 5 9
Company 23 4 3 4 2 6 7 5 0 5 4 5 5 3
Company 24 4 6 4 2 6 4 4 0 4 2 6 5 2
Company 25 4 4 4 2 6 4 4 0 5 2 7 7 2
Company 26 5 5 5 4 4 6 5 0 5 4 6 6 4
Company 27 5 5 5 4 6 7 5 0 6 6 5 5 6
Company 28 4 5 4 2 5 7 4 0 4 5 5 5 4
Company 29 4 2 4 3 5 5 4 0 5 4 6 7 5
Company 30 6 2 7 7 5 3 7 0 5 8 7 5 3
Company 31 4 5 4 3 4 5 5 0 4 4 5 5 3
Company 32 4 5 4 3 4 4 4 0 5 4 4 4 3
Company 33 5 5 4 3 4 5 4 0 4 5 6 6 4
Company 34 5 5 4 3 5 4 5 0 5 4 6 6 3
Company 35 4 5 4 3 4 4 4 0 5 4 5 5 3
Company 36 5 4 5 3 5 6 5 0 6 6 7 5 3
Company 37 4 4 3 2 4 4 5 0 6 5 6 5 3
Company 38 4 4 4 2 4 5 4 0 4 4 7 8 2
Company 39 5 5 5 2 5 3 4 0 4 4 5 6 4
Company 40 4 4 3 2 5 3 4 0 3 5 4 5 3
Company 41 4 4 2 1 6 5 4 0 5 4 5 5 3
Company 42 3 5 4 2 4 4 4 0 4 3 6 5 3
Company 43 4 4 4 2 4 5 4 0 6 4 6 5 4
Company 44 5 4 6 6 5 6 6 0 6 6 6 5 4
Company 45 2 6 1 1 2 2 1 0 2 1 4 6 2
Company 46 5 5 5 2 4 5 6 0 4 2 4 6 4
Company 47 3 5 3 2 3 6 2 0 3 2 5 6 3
Company 48 4 5 2 2 3 5 4 0 4 1 4 7 2
Company 49 8 4 6 7 4 4 3 0 3 6 7 6 8
The Redesign of Processes’ Development in Food Production Organizations Using Quality Engineering Methods...http://dx.doi.org/10.5772/53154
465
No. Company Stand. 1 2 3 4 5 5.1 5.2 6 6.1 7 8 9 10
Company 50 6 5 6 6 5 6 7 1 6 5 7 8 5
Company 51 5 7 7 7 7 7 7 1 7 6 7 7 4
Company 52 4 6 7 7 6 6 5 1 7 6 8 7 4
Company 53 6 4 6 6 5 7 3 0 5 5 8 8 7
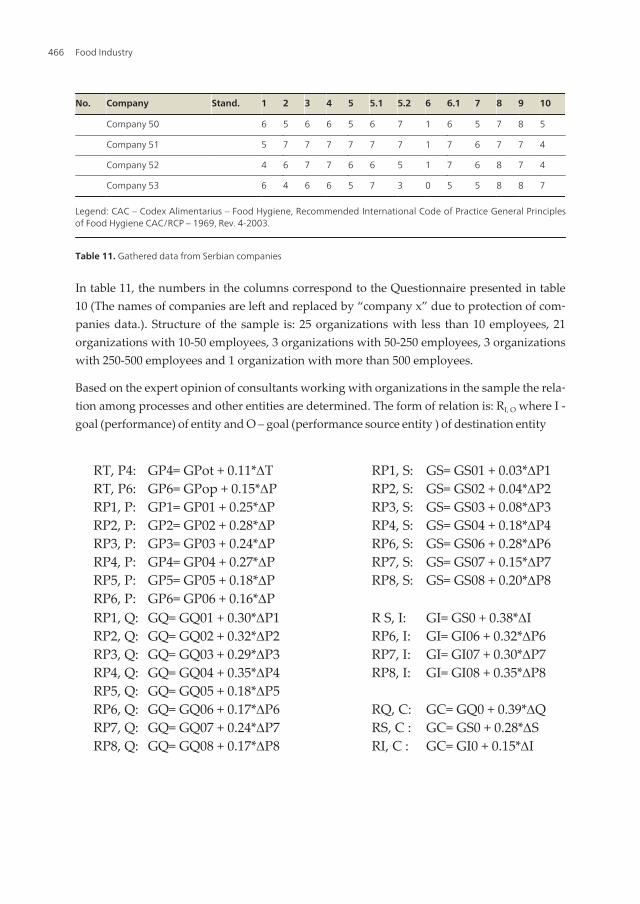
Legend: CAC – Codex Alimentarius – Food Hygiene, Recommended International Code of Practice General Principlesof Food Hygiene CAC/RCP – 1969, Rev. 4-2003.
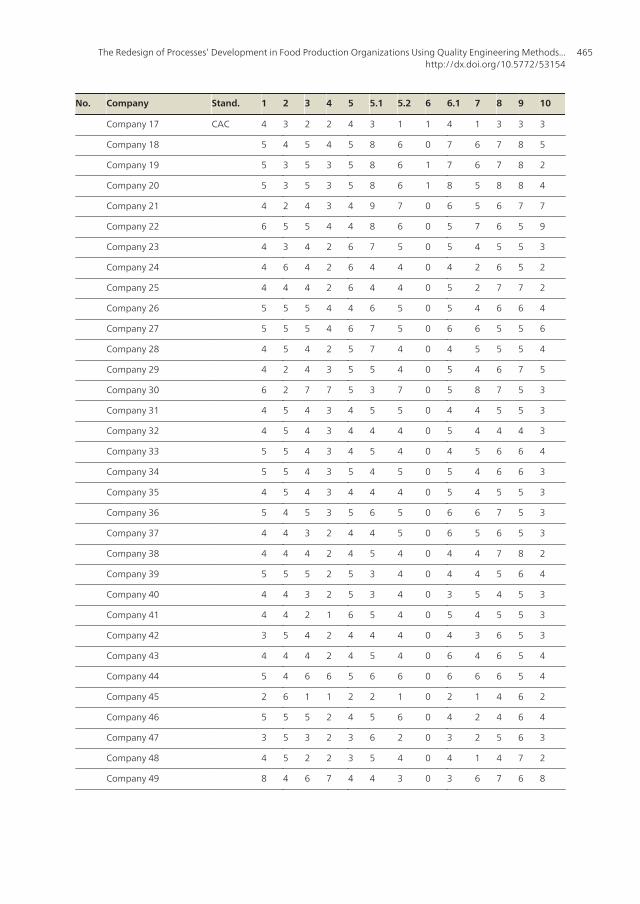
Table 11. Gathered data from Serbian companies
In table 11, the numbers in the columns correspond to the Questionnaire presented in table10 (The names of companies are left and replaced by “company x” due to protection of com‐panies data.). Structure of the sample is: 25 organizations with less than 10 employees, 21organizations with 10-50 employees, 3 organizations with 50-250 employees, 3 organizationswith 250-500 employees and 1 organization with more than 500 employees.
Based on the expert opinion of consultants working with organizations in the sample the rela‐tion among processes and other entities are determined. The form of relation is: RI, O where I -goal (performance) of entity and O – goal (performance source entity ) of destination entity
RT, P4: GP4= GPot + 0.11*T RT, P6: GP6= GPop + 0.15*P RP1, P: GP1= GP01 + 0.25*P RP2, P: GP2= GP02 + 0.28*P RP3, P: GP3= GP03 + 0.24*P RP4, P: GP4= GP04 + 0.27*P RP5, P: GP5= GP05 + 0.18*P RP6, P: GP6= GP06 + 0.16*P
RP1, S: GS= GS01 + 0.03*P1 RP2, S: GS= GS02 + 0.04*P2 RP3, S: GS= GS03 + 0.08*P3 RP4, S: GS= GS04 + 0.18*P4 RP6, S: GS= GS06 + 0.28*P6 RP7, S: GS= GS07 + 0.15*P7 RP8, S: GS= GS08 + 0.20*P8
RP1, Q: GQ= GQ01 + 0.30*P1 RP2, Q: GQ= GQ02 + 0.32*P2 RP3, Q: GQ= GQ03 + 0.29*P3 RP4, Q: GQ= GQ04 + 0.35*P4 RP5, Q: GQ= GQ05 + 0.18*P5 RP6, Q: GQ= GQ06 + 0.17*P6 RP7, Q: GQ= GQ07 + 0.24*P7 RP8, Q: GQ= GQ08 + 0.17*P8
R S, I: GI= GS0 + 0.38*I RP6, I: GI= GI06 + 0.32*P6 RP7, I: GI= GI07 + 0.30*P7 RP8, I: GI= GI08 + 0.35*P8 RQ, C: GC= GQ0 + 0.39*Q RS, C : GC= GS0 + 0.28*S RI, C : GC= GI0 + 0.15*I
Food Industry466

Starting values of constants are determined by investigation of the organization in the sam‐ple. Presented relations describe the importance of relations presented in the strategy map.
5. Conclusion
The food industry is a sector that is involved in rapid, multidimensional changes. At thesame time this is an industrial sector that is emerging and increasing its importance in rela‐tion to different trends and challenges: growth of population, increased need for healthyfood, food safety regulations, and different customers’ demands.
It is completely clear that the food industry must respond in many different directions in or‐der to avoid challenges, reduce threats and explore its strengths using available opportuni‐ties. Some of the changes in the food industry will go in the direction of automation of theproduction process and technological changes, employing the full potential of biotechnolo‐gy, information and communication technology, RFID, robotics, sensors and even e-busi‐ness. Other changes will be directed in the optimization of logistic infrastructure and energysavings. But companies in the food industry will also need to understand globalizationtrends, market developments and chanciness and swings in customers’ needs. All thesechanges will increase the success of the food industry on the global markets. Although all ofthese changes could have only limited, partial results that will not fulfill the complete poten‐tial of the suggested changes if companies do not restructure their organizations and rede‐sign their processes. Changing and adopting the changes of organization as well asrestructure and redesign of processes are a pre-condition for all other changes. On the otherhand, companies usually do not pay much attention to organizational challenges and proc‐ess redesign, compared with other directions of changes such as the implementation of newand emerging technologies.
In this chapter we addressed different questions and issues in the redesign of process devel‐opment in food production organizations using quality engineering tools and methods. Thefirst step is analysis of existing processes, its decomposition and introduction of quality met‐rics for evaluation of the quality of processes and quality of goals. A typical process map fora company in the food processing industry in Serbia is presented and the production proc‐ess is decomposed on sub processes. All indicators for quality metrics were proposed as nu‐meric values in order to clearly demonstrate the concept.
After decomposition another step is redesign of process development. Different changingmethodologies are compared according to the amount of change, score of change, usedtools, probability of success and their applicability in food industry. The concept of continu‐ous process improvement is presented and redesign of the process has 5 phases with 10steps. Different quality engineering methods and tools used in the food industry were com‐pared according to the frequency of their usage and correlation to increase of profit in Serbi‐an companies. The general conclusion was that companies are using older, establishedmethods and tools even if they do not have that large impact on profit increase compared tothe modern tools and methods. A total number of 20 different quality engineering methods
The Redesign of Processes’ Development in Food Production Organizations Using Quality Engineering Methods...http://dx.doi.org/10.5772/53154
467

and tools were analyzed among 53 Serbian companies from the food industry sector. Withmany different problems, starting from the ranking of importance of quality goals, rankingof importance of processes or entities, up to ranking the methods or tools, there is a need foran approach that will solve these issues. All these problems could be solved by usage of thefuzzy approach. As an extension of the general ranking idea presented on the ranking anddefinition of goals in the production process, the fuzzy approach for evaluation of the im‐portance of entities in supply chains in the food industry is presented. A strategic map as astrategic part of the BSC (Balanced Score Card) framework is presented as the role model forfood processing companies. The special contributions of this map are the relations betweenentities (from all four perspectives) that are defined as the result of the research in Serbiancompanies. In addition, the framework of processes for the companies from the food indus‐try was presented. Finally, the general contribution of all the presented issues, decomposi‐tion, redesign, evaluation of quality tools and methods, fuzzy ranking and the strategic map,is based on results of research in 53 Serbian companies. The questionnaire for Serbian com‐panies is presented as well as the results of research. A very important contribution present‐ed is the fact that all decompositions, redesigns, modeling, simulations and calculationswere performed using real life data acquired from Serbian companies.
A possible and very useful extension of this research would be a comparison of data withdata from the EU but according to the literature the variation would not be significant.
Acknowledgements
The research presented in this paper was supported by The Ministry of Science and Techno‐logical Development of The Republic of Serbia, Grant III-44010, Title: Intelligent Systems forSoftware Product Development and Business Support based on Models.
Author details
Slavko Arsovski, Miladin Stefanović*, Danijela Tadić and Ivan Savović
*Address all correspondence to: [email protected]
Center for Quality, Faculty of Engineering, University of Kragujevac, Serbia
References
[1] Trends and drivers of change in the food and beverage industry in Europe: Mappingreport, www.eurofound.eu.int
Food Industry468

[2] Nikhil Daxini, Use BPM to Assist in New Product Development, TRIZ Journal, http://www.triz-journal.com/content/c081201a.asp
[3] Aikens, H., Quality Inspired Management: The Key to Sustainability, Prentice Hall,2011.
[4] Hur, M., The influence of total quality management practices on the transformationof how organizations works, Total Management and Business Intelligence, Vol. 20,Numbers 7-8, p. 847 – 863, ISSN: 1478 – 3363, 2009.
[5] Foster, T., Managing Quality: Integrating the supply chain, Prentice Hall, ISBN:978-0-13-507819-8, 2010.
[6] Summers, D., Quality Management: Creating and Sustaining Organizational Effec‐tiveness, Pearson International Edition, 2009.
[7] Foster, T., Managing Quality: An Integrative Approach, Pearson & Prentice Hall,2004, ISBN: 0-13-123018-3
[8] Juran, J., Managerial Breakthrough, Mc Grow Hill, New York, 1995.
[9] Rao et all., Total Quality Management: A Cross Functional Perspective, John Willey& Sons, New York, 1996.
[10] Goetch, D., Davis, S., Introduction to Total Quality, Prentice Hall, Upper Saddle Riv‐er, New Jersey, 1997.
[11] Jeston, J., Nelis, J., Business Process Management, Elsevier, Amsterdam, 2008.
[12] Born, G., Process Management to Quality Improvement, John Willey & Sons, NewYork, 1996.
[13] Davenport T.H., Process Innovation Reengineering Work Through Information Tech‐nology, Boston, MA, 1993.
[14] Zimmermann, H.J., Fuzzy set Theory and its applications. Kluwer Nijhoff Publising:Boston, 1996.
[15] Klir, G.J., Folger, T.A., Fuzzy Sets, Uncertainty and Information, Pretence-Hall, Eng‐lewood, Cliffs, NJ., 1988.
[16] Chang, D.Y., Applications of the extent analysis method on fuzzy AHP, EuropeanJournal of Operational Research, 95, 649-655, 1996.
[17] Tadić, D., Milanović, D., Misita, M., Tadić, B., New integrated approach to the prob‐lem of ranking and supplier selection under uncertainties, Proceedings of the Institu‐tion of Mechanical Engineers. Part B: Journal of Engineering manufacture, doi:10.1243/09544054JEM2105.
[18] Saaty, T.L., How to make a decision: The Analytic Hierarchy Process, European Jour‐nal of Operational Research, 48, 9-26, 1990.
The Redesign of Processes’ Development in Food Production Organizations Using Quality Engineering Methods...http://dx.doi.org/10.5772/53154
469

[19] Shih, H.S., Shyur, H.J., Lee, E.S., 2007. An extension of TOPSIS for group decisionmaking. Mathematical and Computer Modelling 45 (7/8), 801-813.
[20] Marić, A, Arsovski, S., Mastilović, J.: Contribution to the improvement of productsquality in baking industry, International Journal for Quality research, Vol.3, No. 3,pp. 209-216, 2009
[21] D. Tadić, M. Stefanović, D. Milanović, Fuzzy Approach in Evaluation of Operationsin Food Production, International Journal for Quality Research, Vol1, no 2, pp 97 -104, 2007.
Food Industry470