The recent divergence of regional per capita incomes: Some ...
18
WP073091 The Recent Divergence of Regional Per Capita Incomes: Some Evidence from Australia by Philip Maxwell Curtin University of Technology, Perth, Western Australia and Visiting International Scholar, Oemson University, Oemson, South Carolina and James C. Hite Alumni Professor, Agricultural Economics and Rural Sociology and Senior Fellow, Strom Thurmond Institute, Clemson University, Clemson, South Carolina July 1991
Transcript of The recent divergence of regional per capita incomes: Some ...

WP073091
The Recent Divergence of Regional Per Capita Incomes: Some
Evidence from Australia
by
Philip Maxwell
Curtin University of Technology, Perth, Western Australia and
Visiting International Scholar, Oemson University, Oemson, South Carolina
and
James C. Hite
Alumni Professor, Agricultural Economics and Rural Sociology and Senior Fellow, Strom Thurmond Institute, Clemson University,
Clemson, South Carolina
July 1991

Hc_eo10 0 7-5 J,(39
!'19'1
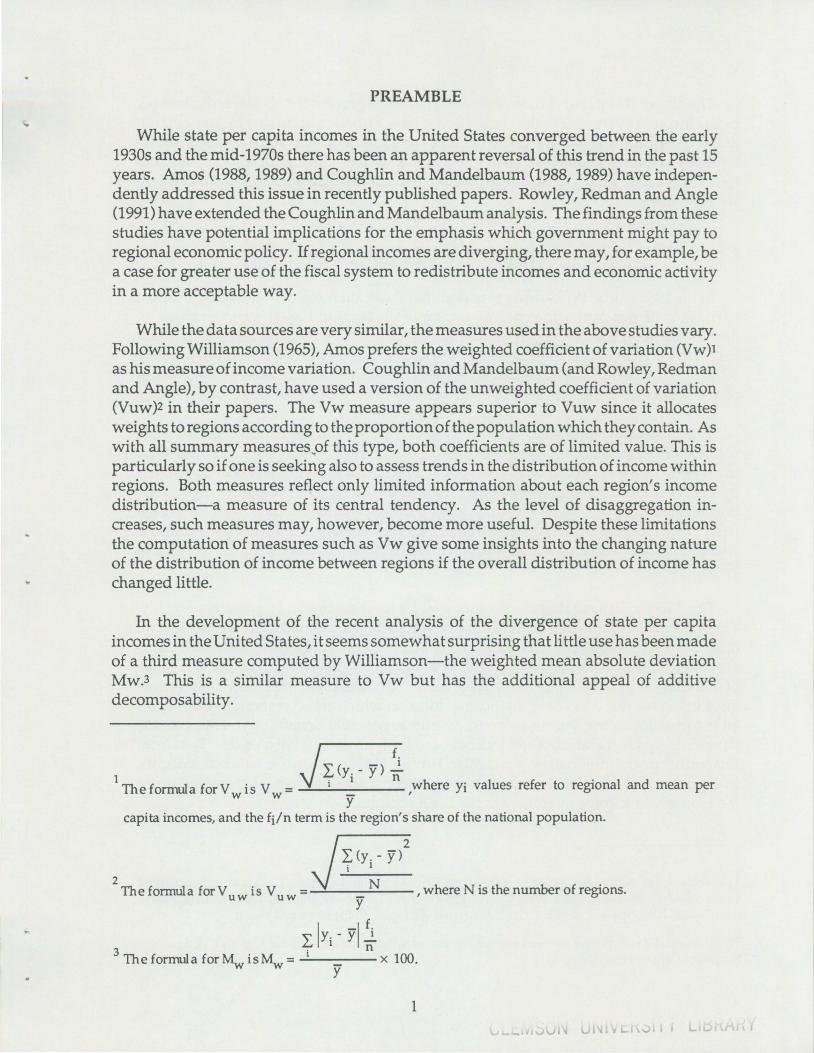
PREAMBLE
... While state per capita incomes in the United States converged between the early
1930s and the mid-1970s there has been an apparent reversal of this trend in the past 15 years. Amos (1988, 1989) and Coughlin and Mandelbaum (1988, 1989) have independently addressed this issue in recently published papers. Rowley, Redman and Angle (1991) have extended the Coughlin and Mandelbaum analysis. The findings from these studies have potential implications for the emphasis which government might pay to regional economic policy. If regional incomes are diverging, there may, for example, be a case for greater use of the fiscal system to redistribute incomes and economic activity in a more acceptable way.
While the data sources are very similar, the measures used in the above studies vary. Following Williamson (1965), Amos prefers the weighted coefficient of variation (Vw)1 as his measure of income variation. Coughlin and Mandelbaum (and Rowley, Redman and Angle), by contrast, have used a version of the unweighted coefficient of variation (Vuw)2 in their papers. The Vw measure appears superior to Vuw since it allocates weights to regions according to the proportion of the population which they contain. As with all summary measures...of this type, both coefficients are of limited value. This is particular! y so if one is seeking also to assess trends in the distribution of income within regions. Both measures reflect only limited information about each region1 s income distribution-a measure of its central tendency. As the level of disaggregation increases, such measures may, however, become more useful. Despite these limitations the computation of measures such as Vw give some insights into the changing nature of the distribution of income between regions if the overall distribution of income has changed little.
In the development of the recent analysis of the divergence of state per capita incomes in the United States, it seems somewhat surprising that little use has been made of a third measure computed by Williamson-the weighted mean absolute deviation Mw.3 This is a similar measure to Vw but has the additional appeal of additive decomposability.
f. I,(y. - y) .2..
1 i
1 n where Yi values refer to regional and mean perThe formula forV w is Vw = y I
capita incomes, and the fi/n term is the region's share of the national population.
2I <y. - y>
i I
2 NThe formula for Vu w is Vu w =-------,where N is the number of regions.
y
I -1 f.I Yi - y .2.. 3 . n
The formula for M_v is M_v = 1 x 100. y
1 .... _u v'vl Ul I L..1 ...,, I I L. .J I r

The aim of this paper is to investigate whether the recent trends towards state per capita income divergence in the United States have also been occurring in Australia. In developing our analysis we use both the Vw and Mw measures described above, applying them particularly to data at statistical division level, but also at state and territory level as well. We devote the second section to a discussion of the data which we have used.
THE AUSTRALIAN DATA
In his 1965 study, Williamson reported that Australian regions showed the lowest variability of per capita incomes of a sample of 24 countries at various stages of development.4 This was in part a reflection of his selection of states and territories as his regional grouping. His estimates of Vw and Mw for Australia covering the 1949/ 50 to 1959 I60 period were .058 and 4.77 respectively. These compared with estimates of Vw and Mw for the U.S. regionss between 1950 and 1961 of .182 and 16.56.
The Australian states are notably homogeneous. Within them, however, sub-state regions differ in their economic sp-uctures, their climates and their general accessibility to services. A widely accepted framework of these sub-state regions was implemented by the Australian Bureau of Statistics (ABS) in the early 1970s when it adopted the present statistical division framework for reporting of statistical data. As can be seen from Table 1, the 6 states are divided into 55 statistical divisions. Ifone also includes the Australian Capital Territory and the Northern Territory as regions, there are a total of 57 regions.
The ABS publishes national accounting tables for the states and territories annually. These contain estimates of Gross Domestic Product, Household Income and several other key macroeconomic aggregates. By contrast, income data for statistical divisions are collected only at the national census. The Australian government conducts a census of population and housing every five years. On the 1976, 1881 and 1986 census questionnaires there has been an income question which asked respondents to report all incomes including wages, salaries, overtime, personal benefit payments, interest payments, tips and gratuities and business and farm income (less expenses). Data from this source are definitionally equivalent to Household Income in the national accounts. In assessing per capita income movements at regional level, it is logical, therefore, to use the Household Income aggregate as the main indicator.
4The countries in Williamson's sample were Australia, New Zealand, Canada, United Kingdom, United States, Sweden, Finland, France, West Germany, Netherlands, Norway, Ireland, Chile, Austria, Puerto Rico, Brazil, Italy, Spain, Colombia, Greece, Yugoslavia, Japan, Philippines and India.
5Williamson did not use the states as regions but rather selected nine multistate regions based on Bureau of Census groupings.
2

Table 1 A Framework of Australian Regions
State or Territory Number of Regions
New South Wales 12 Victoria 12 Queensland 11 South Australia 7 Western Australia 9 Tasmania 4 Australian Capital Territory 1 Northern Territory 1
Total 57
THE DIVERGENCE OF PER CAPITA INCOMES
Even though the Australian states seem remarkable for the homogeneity in the structure of their respective economies, a useful first step in analyzing Australian regional income data is the computation of estimates of Vw and Mw for the Australian states and territories from the National Accounts over an extended time period. These are reported in Figures 1 and 2 respectively between 1966-67 and 1988-89. The values of Vw reached a minimum in the early 1970s, stayed relatively constant for about five
Vw 0.25
0.20
0. 15
0.10
0 .05
0.00
!
"-. v~! us States
: ...\._ ! I-. ! i \ ·; ,,,J!
'-"""'" -~
-..;i\ A/ _.,,."'
/ --j ;,.,,r t ~ n;::,n~ t , PC:
) and Te ri torie~ l
1950 1955 1960 1965 1970 1975 1980 1985 1990
Figure 1. Estimates of Vw for U.S. States and Australian States and Territories.
3

Mw 10
9
8
7
6
5
4
3
2
0
.
.
.... ,-- ... s•a
~
'
IC. J-st ca
... I "
. .. l~iv si >n:
\ 1
I"'--,
' ~ ~
... ~ • .
\ ;'
' ,
i\ ,~\ - ""◄-·
~ •
/ -'" ~-~' I
/ t:: ,tlr ,a es TC r ::>le il8i,
::ir irl T
~ '-
1965 1970 1975 1980 1985 1990
Figure 2. Estimates of Mw for Australian Regions. "
years, and then began to rise again. Although the timing is a little earlier, and rises did not occur in each year from 1975-76 onwards, this picture appears similar to that for the states of the U.S. For comparative purposes the movement of Vw (taken directly from Amos (1989) is plotted in Figure 1 for the United States as well. The graph in Figure 2 shows that estimates of M w for the Australian states fell below four in 197 4, rose above it again in 1978, and have since gradually moved upwards.
Parallel estimates of Vw and M w for Australia's 57 sub-state regions, as computed from the 1976, 1981 and 1986 census income question are as follows:
Census Date Vw Mw 1976 .108 8.92 1981 .091 7.41 1986 .116 9.61
These estimates do not seem totally consistent with the national accounting data estimates of Vw and Mw reported in Figures 1 and 2. They fell between 1976 and 1981 before rising again in 1986. It is, however, conceivable that Vw might have fallen to a minimum level of, say .08, in 1977 and then started to rise once more through .091 in 1981 to .116 in 1986 and to even higher levels since that time. In a similar fashion the value of M w would have fallen from 8.92 in 1976 to around 7 in 1977 or 1978 and then moved up again. Such a movement for Mw is plotted in Figure 2. This would be consistent with the observed movements of Mw from the Australian national accounts. It also would parallel the experience of the U.S. states. Because of a lack of data points, this analysis is speculative but it may be plausible.
4

... Further insight into the variability of mean incomes can be gained by employing a
variant of the classification of income movement suggested by Coughlin and Mandelbaum in 1988. They identified the U.S. states in terms of whether their mean per capita incomes, in relation to an unweighted national mean, were downwardly diverging (DD), upwardly converging (UC), downwardly converging (DC), or upwardly diverging (UD). States where no significant change (NSC) had occurred in per capita incomes were also included in their taxonomy. Inclusion of this category requires an arbitrary judgment about what constitutes a significant change. While there is some question about the validity of such measurements about an unweighted mean, this approach is promising in its potential for enhancing understanding of some of the processes which drive relative changes. We have, therefore, applied it to the 57 Australian sub-state regions between 1976 and 1986, using the national household per capita income as our reference mean.
The relevant results appear in Table 2. Here we define the no significant change category as applying to those regions where there was less than a two percent movement in household per capita income relative to the national mean between 1976 and 1986 or less than one percent movement between 1976 and 1981 or between 1981 and 1986.
A summary of the movements of regional per capita incomes relative to the national mean appears in Table 3. Between 1976 and 1981 the mean incomes of the majority of regions (37 out of57) were converging towards the national mean. By contrast, between 1981 and 1986 mean incomes in more than half of the regions (35 out of 57) were diverging from the national mean. Over the whole period these two movements tended to cancel one another out with almost equal numbers of no significant change (18 regions). This is consistent with the values reported above for the Vw and M w summary measures in 1976, 1981 and 1986.
Another insight into the process of relative change among the Australian regions can be obtained by measuring the contributions of each of the regional groups in the Coughlin-Mandelbaum classification to the estimated values of Mw. These are reported in Table 4. The importance of converging regions to the value of Mw increases as its value declines. DivergentregionshavemuchmoreweightasMwisrising. In 1981 more than half of the value of Mw was contributed by income convergent regions. Income divergent regions from 1981 to 1986 contributed more than 80 percent of the total value of Mw for 1986.
Some explanation of trends towards convergence or divergence of per capita incomes may be uncovered by an assessment of the economic structure of regions. A useful starting point is to appeal to a readily accepted typology of regions. One attempt to do this has been made by Carter (1983). He has suggested a classification of seven types of regions in non-metropolitan Australia. These include: restructuring agricultural regions, remote resource development regions, urban-based resource development regions, restructuring basic manufacturing regions, environmentally sensitive
5

Table 2 Relative Changes in Household per Capita
Income-Australian Regions 1976-1986
% of National Mean Relative to National Mean 1976 1981 1986 1976-81 1981-86 1976-86
New South Wales Syndey 1.097 1.105 1.117 NSC UD UD Hunter 0.919 0.965 0.956 UC NSC UC lliawarra 0.949 0.965 0.921 UC DD DD Richmond-Tweed 0.801 0.807 0.771 NSC DD DD Mid-North Coast 0.801 0.789 0.783 DD NSC NSC Northern 0.89 0.877 0.818 DD DD DD North Western 0.801 0.877 0.794 UC DD NSC Central West 0.86 0.895 0.841 UC DD NSC South Eastern 0.89 0.912 0.944 UC UC UC Murrumbidgee 0.89 "' 0.93 0.829 UC DD DD Murray 0.83 0.93 0.852 UC DD UC Far Western 0.919 0.965 0.898 UC DD DD
Victoria Melbourne 1.068 1.035 1.071 DC UD NSC Barwon 0.89 0.895 0.921 NSC UC UC South Western 0.771 0.86 0.864 UC NSC UC Wirnmera 0.83 0.93 0.829 UC DD NSC Northern Mallee 0.83 0.877 0.806 UC DD DD Central Highlands 0.83 0.825 0.829 NSC NSC NSC Loddon-Campaspe 0.86 0.86 0.864 NSC NSC NSC Goulburn 0.801 0.877 0.841 UC DD UC North Eastern 0.86 0.877 0.898 UC UC UC East Central 0.771 0.825 0.829 UC NSC UC Central Gippsland 0.83 0.965 0.818 UC UC UC East Gippsland 0.86 0.895 0.91 UC UC UC
Queensland Brisbane 1.008 0.982 0.99 DD NSC NSC Moreton 0.86 0.895 0.875 UC DD NSC Wide Bay-Burnett 0.86 0.842 0.806 DD DD DD Darling Downs 0.801 0.86 0.818 UC DD NSC South West 0.771 0.86 0.875 UC UC UC Fitzroy 0.89 0.965 0.944 UC DD UC
6

Table 2 (cont.) .. Relative Changes in Household per Capita
Income-Australian Regions 1976-1986
% of National Mean Relative to National Mean 1976 1981 1986 1976-81 1981-86 1976-86
Central West Mackay Northern Far North North Western
0.86 1.068 1.008 0.89 0.949
0.912 1.018 1.018 0.877 0.982
0.864 0.99 0.99 0.852 1.013
UC DD DD DD UC
DD DD DD DD UC
NSC DC DC DD UC
South Australia Adelaide Outer Adelaide Yorke & Lower North Murray Lands South East Eyre Northern
1.038 0.86 0.89 0.83.. 0.86 0.919 0.919
0.982 0.877 0.895 0.86 0.93 0.912 0.93
1.025 0.875 0.794 0.806 0.898 0.771 0.921
DC DC
NSC UC UC
NSC UC
UD NSC DD DD DD DD
NSC
NSC NSC DD DD UC DD
NSC
. Western Australia Perth South West Lower Great Southern Upper Great Southern Midlands South East Central Pilbara Kimberley
1.008 0.83 0.89 1.097 1.127 0.89 0.979 1.275 0.86
1.018 0.912 1 1.053 0.965 1 0.947 1.386 0.93
1.036 0.852 0.829 0.841 0.829 1.036 0.875 1.324 0.956
UD UC UC DC DD UC DD UD UC
UD DD DD DD DD UD DD DC UC
UD UC DD DD DD UC DD UD UC
Tasmania Hobart Southern Northern Mersey Lyell
1.038 0.741 0.89 0.86
0.982 0.807 0.895 0.877
1.002 0.818 0.898 0.875
DC UC NSC UC
UC UC
NSC NSC
DC UC
NSC NSC
A.C.T. 1.335 1.228 1.359 DC UD NSC
Northern Territory 1.084 1.149 1.071 UD DC NSC
7

Table 3 Summary of Changes in Household Income Per Capita
Australian Regions 1976-1986
Relative Movement 1976-81 1981-86 1976-86
No significant change (NSC) 8 11 18 Upwardly diverging (UD) 3 6 4 Downwardly converging (DC) 5 2 2 Upwardly converging (UC) 32 9 17 Downwardly diverging (DD) 9 29 16
Total Regions 57 57 57
regions, warm-climate coastal regions and undeveloped regions. In Carter's words, "These regional typologies may be neither complete not mutually exclusive." They do, however, provide a starting po1nt for further empirical analysis.
In attempting to adapt the Carter framework to the sub-state regional framework which is incorporated in the ABS statistical divisions, the problem of overlapping regions became clear. We used the following series of simple but intuitively appealing rules of thumb at the 1986 Census for non-metropolitan statistical divisions:
Table 4 The Contribution of Income Convergent and Income Divergent Regions to Estimated Values of Mw-Australia 1981 and 1986
Mw-1981 Mw-1986
Per capita movement of 1976-81 1981-86 1976-86 income in regions Actual Percent Actual Percent Actual Percent
of total of total of total
No significant change (NSC) 2.47 33.4 1.08 11.3 3.69 38.4 Upwardly diverging (UD) 0.44 5.9 4.79 49.9 2.93 30.5 Downwardly converging (DC) 0.92 12.5 0.17 1.7 0.01 0.1 Upwardly converging (UC) 2.96 39.9 0.32 3.3 1.33 13.9 Downwardly diverging (DD) 0.62 8.32 3.24 33.8 1.65 17.2
Total Regions 7.41 100.0 9.61 100.0 9.61 100.0
8

•
"'
- predominantly agricultural regions are those with 20 percentor more of their employment in agriculture, forestry or fishing;
- predominantly manufacturing regions are those with 15 percent or more of their employment in that sector;
- regions with over 10 percent of their employment in both agriculture and manufacturing are "mixed" regions and the significance of these activities should be somehow noted;
- resource development regions have at least 10 percent of their employment in mining or in provision of electricity, gas and water; and
- warm climate coastal regions are those statistical divisions on the coast in non-remote areas at least part or all of which are less than 32 degrees south of the equator.
With these rules it was not possible to classify any statistical divisions in Carter's typology predominantly as UQdeveloped or environmentally sensitive, though parts of several statistical divisions clearly fall into these categories. Our classification of Statistical Divisions appears, in Table Al and Figure 3. Over two thirds of Australian sub-state regions have significant agricultural activity taking place within their boundaries. More than one third have substantial manufacturing bases.
In Figure 3 we classify regions as one of ten possible types. In large part our categories parallel the Carter typology though we include five groups of "mixed"
fa Agricultural
1111 Agricultural/manufacturing
m Manufacturing
~ Capital city
Remote resource□121 Warm climate coastal §11 Agricultural/warm coastal
[ill Agric/manuf/warm coastal
0 Agriculture/remote resource
[ill Other
Figure 3. A Regional Classification of Australian Statistical Divisions.
3
2
5
9

regions as separate categories. These are regions with a significant mix of the following activities
- agricultural and manufacturing activity (seven regions); - agricultural and warm climate coastal (three regions;) - agriculture, manufacturing and warm climate coastal (three regions); - agriculture and remote resource development (three regions); and - other (six regions).
The "other regions" group includes agriculture, manufacturing and remote resource development (one region); agriculture and remote resource development (one); agriculture and urban resource development (one); agriculture, urban resource development, and warm climate coastal (one); agriculture, remote resource development and warm climate coastal (one); and agriculture, manufacturing and final services (one).
The relative movements of per capita incomes in each of the main regional types between 1976 and 1986 are reported in Table 5. The changing population shares of different regional types also appear in this table. Before discussing incomes, it is useful to reflect onpopulation trends. Between 197 6 and 1986 Australia's population rose from 14 million to 16 million people. The populations of each of the regional groupings increased. Even though the proportional shares of capital city and predominantly agricultural regions fell, their populations still increased over the period. Within
Table 5 Movement of Per Capita Incomes by Type of Region-
Australia 1976 -1986
Population share (percent)
Income as % of national mean
Region Type No. 1976 1986 1976 1986 Change 1976-86
Agricultural 18 9.1 8.5 87.6 82.8 DD Agricultural/ manufacturing 7 4.6 4.7 87.2 87.3 NSC Manufacturing 5 7.9 7.8 91.2 92.5 UC Capital city 7 64.0 62.8 106.8 107.5 UD Remote Resource 3 0.8 0.7 106.3 111.3 UD Warm climate coastal 2 2.7 3.9 83.6 84.3 NSC Agricultural/warm coastal 3 1.8 2.1 87.2 79.3 DD Agric/manuf/warrn coastal 3 2.6 2.8 92.6 91.2 DD Agriculture/remote resource 3 1.4 1.5 107.3 104.9 DC Other 6 5.2 5.2 83.2 78.8 DD
•
10
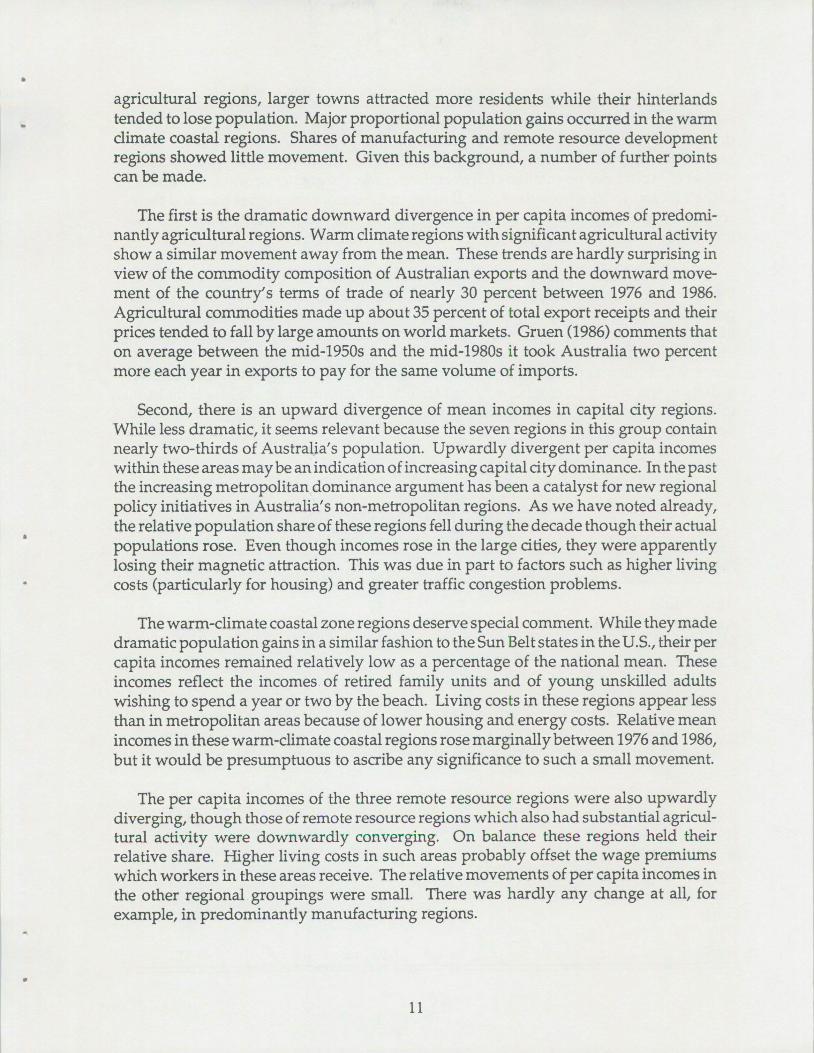
• agricultural regions, larger towns attracted more residents while their hinterlands tended to lose population. Major proportional population gains occurred in the warm climate coastal regions. Shares of manufacturing and remote resource development regions showed little movement. Given this background, a number of further points can be made.
The first is the dramatic downward divergence in per capita incomes of predominantly agricultural regions. Warm climate regions with significant agricultural activity show a similar movement away from the mean. These trends are hardly surprising in view of the commodity composition of Australian exports and the downward movement of the country's terms of trade of nearly 30 percent between 1976 and 1986. Agricultural commodities made up about 35 percent of total export receipts and their prices tended to fall by large amounts on world markets. Gruen (1986) comments that on average between the mid-1950s and the mid-1980s it took Australia two percent more each year in exports to pay for the same volume of imports.
Second, there is an upward divergence of mean incomes in capital city regions. While less dramatic, it seems relevant because the seven regions in this group contain nearly two-thirds of AustraHa's population. Upwardly divergent per capita incomes within these areas may be an indication of increasing capital city dominance. In the past the increasing metropolitan dominance argument has been a catalyst for new regional policy initiatives in Australia's non-metropolitan regions. As we have noted already, the relative population share of these regions fell during the decade though their actual
• populations rose. Even though incomes rose in the large cities, they were apparently losing their magnetic attraction. This was due in part to factors such as higher living costs (particularly for housing) and greater traffic congestion problems.
The warm-climate coastal zone regions deserve special comment. While they made dramatic population gains in a similar fashion to the Sun Belt states in the U.S., their per capita incomes remained relatively low as a percentage of the national mean. These incomes reflect the incomes of retired family units and of young unskilled adults wishing to spend a year or two by the beach. Living costs in these regions appear less than in metropolitan areas because of lower housing and energy costs. Relative mean incomes in these warm-climate coastal regions rose marginally between 1976 and 1986, but it would be presumptuous to ascribe any significance to such a small movement.
The per capita incomes of the three remote resource regions were also upwardly diverging, though those of remote resource regions which also had substantial agricultural activity were downwardly converging. On balance these regions held their relative share. Higher living costs in such areas probably offset the wage premiums which workers in these areas receive. The relative movements of per capita incomes in the other regional groupings were small. There was hardly any change at all, for example, in predominantly manufacturing regions .
•
11
•
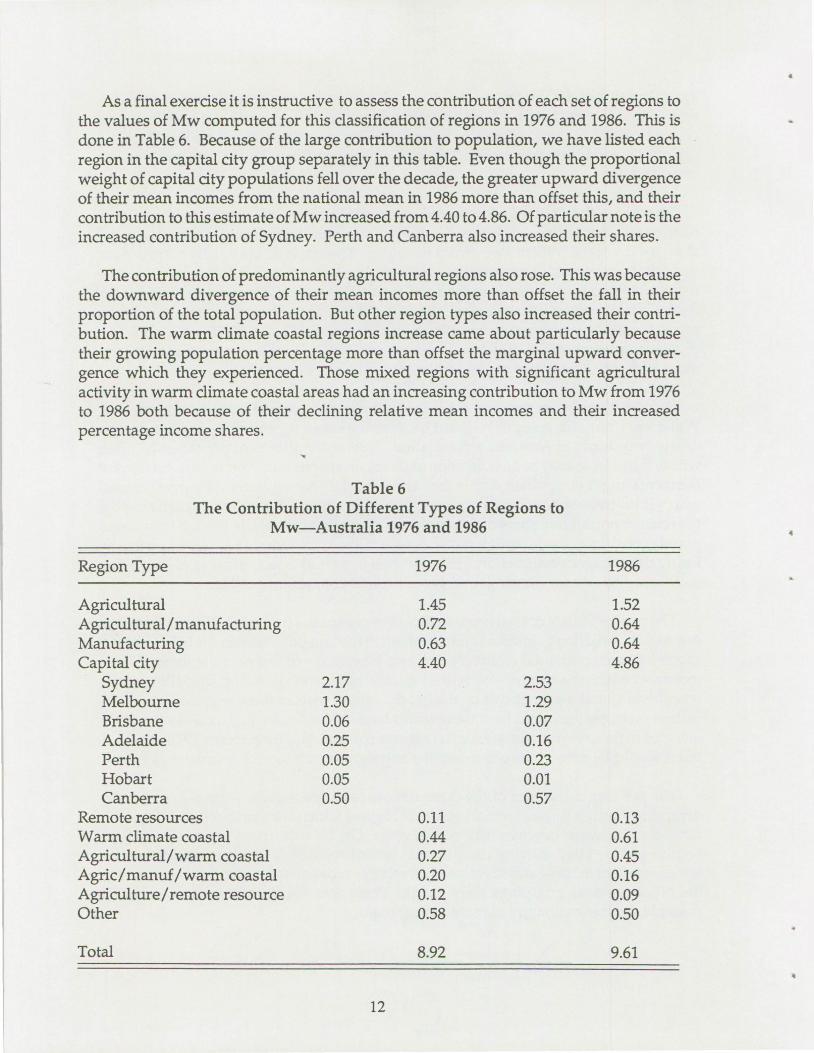
As a final exercise it is instructive to assess the contribution of each set of regions to the values of Mw computed for this classification of regions in 1976 and 1986. This is done in Table 6. Because of the large contribution to population, we have listed each region in the capital city group separately in this table. Even though the proportional weight of capital city populations fell over the decade, the greater upward divergence of their mean incomes from the national mean in 1986 more than offset this, and their contribution to this estimate of M w increased from 4.40 to 4.86. Of particular note is the increased contribution of Sydney. Perth and Canberra also increased their shares.
The contribution of predominantly agricultural regions also rose. This was because the downward divergence of their mean incomes more than offset the fall in their proportion of the total population. But other region types also increased their contribution. The warm climate coastal regions increase came about particularly because their growing population percentage more than offset the marginal upward convergence which they experienced. Those mixed regions with significant agricultural activity in warm climate coastal areas had an increasing contribution to Mw from 1976 to 1986 both because of their declining relative mean incomes and their increased percentage income shares.
Table 6 The Contribution of Different Types of Regions to
Mw-Australia 1976 and 1986
Region Type 1976 1986
Agricultural Agricultural/manufacturing Manufacturing Capital city
Sydney Melbourne Brisbane Adelaide Perth Hobart Canberra
Remote resources Warm climate coastal Agricultural/warm coastal Agric/manuf/warm coastal Agriculture/remote resource Other
Total
2.17 1.30 0.06 0.25 0.05 0.05 0.50
1.45 0.72 0.63 4.40
0.11 0.44 0.27 0.20 0.12 0.58
8.92
2.53 1.29 0.07 0.16 0.23 0.01 0.57
1.52 0.64 0.64 4.86
0.13 0.61 0.45 0.16 0.09 0.50
9.61
12

• A SUMMARY AND CONCLUSION
As in the United States there appears to have been an increase in the divergence of regional per capita incomes in Australia since the late 1970s. The two sources of income data that we have used indicate similar apparent movements in measures such as the weighted coefficient of variation (Vw) and the weighted absolute mean deviation (Mw) for Australian states and territories, and Australian statistical divisions, to those for the states of the U.S. over the past 15 years.
Using the classification of income movements around the national mean suggested by Coughlin and Mandelbaum provides initial insight into the recent experience of Australian regions. Between 1976 and 1986 the statistical divisions can be divided into three almost equal numerical groups-those experiencing income convergence, those experiencing income divergence, and those where no significant change in mean incomes took place. By then applying elements of a recently suggested regional typology to Australia's statistical divisions we have found that agricultural regions, capital city regions, and warm climate coastal regions are responsible for much of the increase in income divergence which has taken place.
In the context of the U.S. debate, Amos (1989) has postulated that greater divergence in state per capita mean personal incomes may be due to a longwave process, the trough of which occurred in the early 1980s. In the upswing of this cycle which may now have been taking place for almost a decade, he postulates that income inequality at sub• national regional level will increase. Indeed he cites an earlier paper by one of the current authors [Maxwell and Peter (1988)] to support his argument in a more international context. In the Amos scenario one might expect large urban areas to be responsible for much of the increase in the inequality of per capita incomes since technical innovations have their initial impact in big cities. Our findings identify considerable increase in the major Australian cities. It is particularly notable that Sydney which contains more than 20 percent of Australia's total population, increased its contribution to the value of Mw by 0.36 between 1976 and 1986. By contrast, the increased contributions to Mw of predominantly agricultural regions and warm climate coastal regions seem related to factors which impinge little on any long wave cycle. Political influences have led in part for reduced food prices on world markets while aging populations are responsible for growth of warm climate coastal regions.
An approach such as the one we have adopted may have promise in further empirical analysis of the determinants of the increasing divergence of regional per capita incomes in the United States. A more comprehensive picture should be gained by conducting such an exercise for a cross-section of countries .
•
13

• REFERENCES
Amos, Orley. ''Unbalanced Regional Growth and Regional Income Inequality in the Latter Stages of Development." Regional Science and Urban Economics. 18:549-566. 1988.
Amos, Orley. "An Inquiry into the Causes of Increasing Regional Income Inequality in the United States." The Review of Regional Studies. 19 (2):1-13. 1989.
Carter, Robert. "Policy for Non-metropolitan Regions: The Case for a Re-assessment." The Australian Quarterly. 55 (3):319-334.
Coughlin, Cletus C. and Thomas B. Mandelbaum. ''Why HaveState Per Capita Incomes Diverged Recently?" Federal Reserve Bank of St. Louis Review. 70 (5):SeptemberOctober, 24-36. 1988.
Coughlin, Cletus C. and Thomas B. Mandelbaum. "Have Federal Spending and Taxation Contributed to the Divergence of State Per Capita Incomes in the 1980's." Federal Reserve Bank of St. Louis Review. 71(4):July-August, 29-42. 1989.
Gruen, Fred. "How Bad is Australia's Economic Performance and Why?" The Edward Shann Memorial Lecture, Perth. 1985.
Maxwell, Philip and Matthew Peter. "Income Inequality in Small Regions: A Study of Australian Statistical Divisions." The Review ofRegional Studies. 18 (1):Winter, 19-27. 1988.
•
Rowley, Thomas D, John M. Redman, and John Angle. "The Rapid Rise in State Per Capita Income Inequality in the 1980' s: Sources and Prospects." USDA Economic Research Service, Staff Report AGES 9104, January, pp 21. 1991.
Williamson, Jeffrey. "Regional Inequality and the Process of National Development: A Description of the Patterns." Economic Development and Cultural Change. 13:3-84. 1965.
14

I
• Table Al
Applying the Carter Regional Typology to Australian Statistical Divisions
•
Sydney Hunter Illawarra Richmond-Tweed Mid-North Coast Northern North Western Central West South Eastern Murrumbidgee Murray Far Western
Melbourne Barwon South Western Wimmera Northern Mallee Central Highlands Loddon-Campaspe Goulburn North Eastern East Central Central Gippsland East Gippsland
Brisbane Moreton Wide Bay-Burnett Darling Downs South West Fitzroy Central West Mackay Northern Far North North Western
Agric
X
X X X X X X
X X X
X X X X X X
X X X X X X X X
. RRD
X
"
'
X
X
URD
X
X
X
X
Man.
X X X
X
X X
X X X X X
X
X
X
ES
X X
X
X X
wee
X X
X X
X
X X X
UND
X
X
Predominant Type
Capital City Manufacturing Manufacturing
Agricultural/WCC wee
Agricultural Agricultural Agricultural
Other Agricultural
Agric. /Manuf. RRD
Capital City Manufacturing
Agricultural Agricultural Agricultural
Manufacturing Agric./Manuf. Agric./Manuf. Agric./Manuf. Agric./Manuf.
Other Agricultural
Capital City wee Other
Agricultural Agricultural
Agric./Manuf./WC C Agricultural
Other Other
Agricultural/WCC RRD
• 15

• Table Al (cont.)
Applying the Carter Regional Typology to Australian Statistical Divisions
RRD Man. ESAgric. URD wee UND Predominant Type
Adelaide Outer Adelaide Yorke & Lower North Murray Lands South East Eyre Northern
Perth South West Lower Great Southern Upper Great Southern Midlands South East Central Pilbara Kimberley
Hobart Southern Northern Mersey Lyell
A.C.T.
Northern Territory
Regions in Grouping
X X X X X X X X X X
X X
XX X X X X
X "X X X X X X
x , X X X X X
X X X X X X X X X X
X X X
40 4 21 118 10 10
Capital City Agric./Manuf.
Agricultural Agricultural Agricultural Agricultural
Manufacturing
Capital City Agric./Manuf./WCC
Agricultural Agricultural Agricultural
Agricultural/RDD Agricultural/WCC
RRD Agricultural/RDD
Capital City Agricultural
Agric./Manuf. Other
Capital City
Agricultural/RRD
16
4