The Reality Gap - Nottinghamshire County Council … · The Reality Gap UK residual waste treatment...
32
The Reality Gap UK residual waste treatment capacity – making sense of the arguments September 2015 Report authors: Jeff Rhodes & Mike Thair Delivering more
-
Upload
vuongthuan -
Category
Documents
-
view
214 -
download
0
Transcript of The Reality Gap - Nottinghamshire County Council … · The Reality Gap UK residual waste treatment...

The Reality GapUK residual waste treatment capacity – making sense of the arguments
September 2015
Report authors:
Jeff Rhodes & Mike Thair
Delivering more

A word from our CEO
Biffa is continuing to go from strength to strength, successfully
adapting to new markets and extending our range of services and UK
network coverage. We don’t make a song and dance about things, we
just get on with the job in hand, continuing to build on over 100 years
of valuable experience.
I’m therefore delighted to present this report, which I feel very much
reflects that practical and knowledgeable approach, applied to the
subject of residual waste management capacity in the UK. In it, we
look ahead to how we see the future playing out, not just in terms of
a mathematical modelling exercise but also the influence of market
dynamics on that, reflecting the realities of supply and demand.
I’m particularly proud that we have the skills and knowledge to be
able to undertake this work in-house, allowing us to combine that with
our commercial knowledge and produce a report which we hope you
will find both interesting and insightful.
Ian Wakelin
CEO Biffa
About The Authors:
Jeff Rhodes BSc (Hons) BTP MRTPI
Head of Environment and External Affairs, Biffa
Jeff’s responsibilities cover planning, environmental permitting,
environmental compliance and external affairs. He has worked in
waste planning and waste management for nearly 30 years and
been with Biffa since 2002. He is also Chair of the Planning Working
Group at ESA and a long serving member of the West Midlands RTAB
(Resource Technical Advisory Body) on waste planning.
Mike Thair BSc (Hons) MBA MCIWM
Group Business Development Director
Mike’s responsibilities include corporate strategic planning, major
infrastructure and Group initiatives. He has worked in the waste sector
for 17 years in a variety of roles including operational, commercial and
development.
Acknowledgments:
We would also like to acknowledge the valuable support from Ross
Hilliard (freelance consultant) in relation to research and Adrian Judge
(Tolvik Consulting) in relation to peer review.
Biffa: Reality Gap Report2

Biffa: Reality Gap Report 3
Contents
Executive Summary and Key Findings . . . . . . . . . . . . 4
1. Introduction . . . . . . . . . . . . . . . . . . . . . . . . . . . . . . . . 6
2. How did the debate start? . . . . . . . . . . . . . . . . . . . . . 7
3. General Issues . . . . . . . . . . . . . . . . . . . . . . . . . . . . . . 8
RDF production: an example of market
forces at work . . . . . . . . . . . . . . . . . . . . . . . . . . . . . . . . . . . . . .9
The European apple and the UK pear. . . . . . . . . . . . . . . . . . . . .9
No threat to recycling . . . . . . . . . . . . . . . . . . . . . . . . . . . . . . . .10
4. UK Capacity studies . . . . . . . . . . . . . . . . . . . . . . . . 14
The relevance (or not?) of UK-wide statistics . . . . . . . . . . . . . .14
Hypothesis v Reality? . . . . . . . . . . . . . . . . . . . . . . . . . . . . . . . .14
. . . . . . . . 16
Waste Arisings forecast (prior to recycling) . . . . . . . . . . . . . . . .16
Reductions from recycling . . . . . . . . . . . . . . . . . . . . . . . . . . . . .17
Modelled residual waste volumes range . . . . . . . . . . . . . . . . . .17
The role of RDF export . . . . . . . . . . . . . . . . . . . . . . . . . . . . . . .18
Future UK residual waste treatment capacity
and its make up . . . . . . . . . . . . . . . . . . . . . . . . . . . . . . . . . . .18
EfW (incineration) . . . . . . . . . . . . . . . . . . . . . . . . . . . . . . . . . . .18
Advanced Thermal Treatment (ATT) . . . . . . . . . . . . . . . . . . . . .19
Mechanical & Biological Treatment (MBT) . . . . . . . . . . . . . . . .19
Others: Autoclave and SRF/Cement Kilns . . . . . . . . . . . . . . . .20
Total predicted treatment capacity. . . . . . . . . . . . . . . . . . . . . . .20
Capacity Gap: The Reality Gap. . . . . . . . . . . . . . . . . . . . . . . . .21
capacity gap analysis comparisons. . . . . . . . . . . . 23
. . . . . . . 24
UK Coverage. . . . . . . . . . . . . . . . . . . . . . . . . . . . . . . . . 25
APPENDIX . . . . . . . . . . . . . . . . . . . . . . . . . . . . . . . . . . . 26

Executive Summary
Even amongst the most sceptical
analysts there is no disputing the
existence of a substantial residual
waste treatment infrastructure
capacity gap in the UK, presently
in the region of 15Mtpa. With the
exception of one analyst, there is also
a broad consensus that it will persist
to at least 2025. Given the wide range
of variables which can be selected
to use in predictive modelling on the
subject it is not surprising that there
are differences in the conclusions of
reports published so far, although
there is also plenty of common
ground.
There appears to be a consensus now that the
prospect, in reality, of EfW overcapacity in the
UK is a myth. Cautious private sector funders are
simply not going to keep pouring hundreds of
millions of pounds into building more large scale
EfW plants without the market to support them. The
UK is not starting from the same place as some
other European countries and the impact that
overcapacity elsewhere in Europe has had is to
make UK project funders even more wary. Securing
funding for UK EfW projects now, even with a
substantial market, is challenging, unless you can
secure the scale of feedstock volumes that Biffa
controls.
Up to now, report conclusions have tended to be
presented as straight maths: predict arisings using
your chosen parameters, predict infrastructure
development as a separate exercise, draw two
extrapolated lines on a graph and where they cross
is where the gap disappears. But will it? Really?
Perhaps in the hypothetical world but developers
and investors know that it’s not quite that simple.
As with any market, supply and demand rule the
roost. The lower the waste arisings (market), the
lower the appetite for investment in major new
infrastructure. Conversely, the bigger the market
the greater the interest. Waste availability and
infrastructure development are interdependent
within any given scenario but this has not really
been acknowledged in other reports. Where
does this lead? Eventually to a UK residual waste
treatment market too small and patchy to attract
further investment in major new capital expenditure
projects. Leaving a “residual” gap of residual
waste treatment capacity – or rather a natural
working balance - which will be a feature of waste
management in the UK as it always has been, but
on a smaller scale, with different opportunities.
In this report we highlight these issues of reality
in relation to the residual waste (post recycling)
market; the way we think the treatment capacity gap
will change, the end result and how we deal with the
remaining balance - the “Reality Gap”, as we think
of it.
Biffa: Reality Gap Report4
Executive Summary & Key Findings

Biffa: Reality Gap Report 5
Key Findings
• There is a substantial UK residual waste treatment
capacity gap today in the order of 15Mtpa and
this is likely to persist, reducing potentially to
4.4MTpa or up to 5.9Mtpa by 2025.
• Future waste infrastructure delivery in the UK is
entirely dependent on private sector funding.
Supply and demand will call the shots. Predictive
mathematical modelling which ignores market
dynamics and funding requirements is unlikely
to generate realistic future scenarios, as are
misleading comparisons with Europe.
• UK-wide analyses mask the geographical
variations within the UK, which is what the
markets relate to. Consequently, some areas
with insufficient capacity coverage will see
that situation continuing beyond 2025, where
waste volumes are too small to support major
investment. The capacity gap will therefore
reduce, but will not disappear completely,
once it reaches market equilibrium. However,
the remaining balance can be managed by
combinations of current solutions and potential
smaller scale plants, if suitable scale-related,
affordable and reliable technology can be
developed.
• Operational capacity is the only capacity which
can actually be used. A planning consent on
paper is simply a potential means to an end,
not an end in itself. Conversion of consented
capacity into operational capacity is, ultimately,
all that matters. For individual projects, specific
market assessments will always be necessary,
regardless of the overall UK averaged picture.
• Residual waste treatment capacity development
goes hand in hand with recycling, both playing
their respective roles. It is not an “either/or”
choice. Statistics show this is the case in both
Europe and the UK. MRF closures in the UK are
not caused by EfW plants being built. The UK
needs to address recycling in its own right.
• Current waste management options which help
to address the UK residual waste treatment
capacity shortfall will continue to be essential,
including RDF export. Utilisation of existing landfill
capacity is also going to remain important in the
short term and the long term, as a general waste
management back-up whilst additional treatment
capacity is developed and for wastes which can
only be landfilled.
2.00
4.00
6.00
8.00
10.00
12.00
14.00
16.00
0.00
2015 2016 2017 2018 2019 2020 2021 2022 2023 2024 2025
Reality B Circular Economy
Reality A Target
Recycling
5.88
4.36
8.30
8.25
Mill
ion
Tonn
es
Capacity Gap Scenarios

Biffa: Reality Gap Report6
published, some by consultants, some by waste
management companies, analysing UK EfW
capacity and the capacity gap. With the exception
of reports by Eunomia, who predicted the UK
capacity gap disappearing as early as 2017 in
their original reports, followed by a theoretical
over capacity after that, all other studies have
predicted bigger and longer term capacity gaps,
and hence a continued need for substantial UK
infrastructure investment.
Analyses have tended to be presented as a straight
mathematical gap analysis, setting predicted future
arisings against predicted future capacity and seeing
where the extrapolated lines cross. Whilst this sort of
exercise may be useful for comparing the findings
of one report against another, it masks important
market dynamics relating to the geographical spread
of infrastructure and the reaction of investors to a
shrinking market (the market being the capacity gap
in any particular geographical target area). Biffa
has undertaken its own detailed analysis in terms
of what we consider to be realistic future waste
arising scenarios, the impact on that on “conversion”
of currently consented UK projects into relevant
operational capacity on the ground, the supply and
demand interplay between those factors and the
resulting balance.
1. Introduction

Biffa: Reality Gap Report 7
The debate around EfW as a technology has
raged for many years and, in recent years, has
become intrinsically linked with debates over
UK residual waste treatment capacity, due to
its dominant role in that market by virtue of
scale. Often the arguments are underpinned by
entrenched principles, particularly from objectors
historical models of public funding and long term
MSW contracts appear to have subsided a little,
with the growing realisation that the market has
changed, with future investment in the UK being
market driven and primarily reliant on commercial
fuel supply contracts.
The last few years have seen new dimensions to the
debate, sparked by a combination of high profile
EfW planning appeal cases with the usual dose of
politics; a new market in RDF exports since 2010
and, the same year, DEFRA public spending cuts
resulting in withdrawal of PFI credits on seven major
municipal waste contract procurements involving
new EfW facilities. PFI credits on other EfW projects
have been withdrawn in subsequent years. The
debate has also widened, looking at waste treatment
capacity as a whole, not just EfW’s role and the scale
and longevity of the capacity shortfall - or - if you
are an investor looking at it from the other end of the
telescope – the scale of the residual waste market in
the UK.
In Dec 2011 consultants Eunomia started publishing
six monthly Residual Waste Infrastructure Review
reports, which claimed that the UK was heading
for residual waste treatment overcapacity by 2017
(pushed back to 2018/19 in more recent reports).
Since then the ball has kept rolling and has received
regular, intermittent press coverage. Other analysts
have published reports which predict a much greater
and persistent UK treatment capacity gap. However,
there appears to be one area of shared, general
agreement in acknowledging that hypothetical
overcapacity resulting from straight mathematical
modelling is unlikely to materialise in practice, due to
market correction coming into play. This latter point
is essential in keeping the debate grounded in reality
and is therefore a key component in Biffa’s analysis.
2. How did the debate start?

Biffa: Reality Gap Report8
3. General Issues
Making use of combustible residual waste
economically and practicably recycled
is consistent with latest UK Government
July 2015), which includes developing more
low-carbon, secure sources of energy supply.
Western Europe has long recognised the
waste management and an energy generation
perspective. However, the UK has been dogged
by political arguments about it and risks
show that in both Europe and the UK, growth
in recycling has happened alongside growth
in EfW so the idea that the latter blocks the
residual waste treatment perform two different
functions for different components of the waste
stream, different markets and different gate
fees. Biffa is a major operator in both recycling
and in residual waste treatment and disposal,
so knows this full well. There is still a lot more
which can and should be done to improve
recycling, such as creating greater demand/pull
for secondary raw materials (commodities) and
products made from recycled components, also
food waste collection and separate collection of
bulk recyclables. Those aspirations are already
acknowledged in our residual waste market
scenarios.
Unfortunately, the theoretical overcapacity warning
headlines have been used by some anti-incinerator
campaigners to try and block live planning
applications, particularly relating to MSW contracts,
on the general basis that the UK capacity problem is
now “solved” and there is no need for more facilities.
However, such a simplistic and UK-wide approach
ignores crucial factors such as the relationship
between planning consents and conversion into
real, operational capacity; commercial catchment
areas and geographical coverage; the practice of
speculative consent gathering and the difficulties
in securing funding in a shrinking market. These
factors are what shape what DOES get built, in
reality, rather than what MIGHT get built, in theory.
Whilst Defra may, on the one hand, be able to stop
at UK wide data for the purposes of demonstrating
UK compliance with EU landfill diversion and
recycling targets for Municipal Waste, on the other
hand they should still be concerned about delivery
of a sufficient geographical spread of residual waste
management capacity on the ground. That is what
is needed to be able to manage UK residual waste
arisings and, as part of that, help generate our own
secure, low carbon energy, where that is feasible.
Where it is not feasible to do that there remains an
important role for using existing remaining landfill
capacity and/or continuing with taking advantage
of European opportunities through RDF export.
We need to recognise these challenges and
opportunities quickly and, where relevant, link
them more clearly to energy policy and the current
Government productivity agenda.

Biffa: Reality Gap Report 9
RDF production: an example of
market forces at work
Whilst capacity delivery in the UK has struggled
in recent years, necessity has proved to be the
mother of invention and UK innovation has come to
the fore, tapping into the alternative fuel resource
which residual waste presents. A successful Refuse
Derived Fuel (RDF) production business has been
established and has grown steadily since 2010, with
the UK currently exporting around 2.5MT/year of
RDF to Europe. Biffa now exports around 500,000
tonnes/year of RDF from our RDF production plants
to European waste-fuelled CHP plants.
RDF exports have enabled UK waste producers
to divert their residual waste from landfill and into
energy recovery at European plants, at competitive
prices, until the UK catches up and develops more
domestic waste-fuelled power generation capacity
of its own, including opportunities for CHP where
they may exist. RDF export also makes use of
current surplus European EfW capacity in countries
which have found themselves in that position as
a result of how they have historically funded and
developed their infrastructure capacity differently to
the UK.
The European apple and the UK pear
The current EfW over-capacity situation in parts
of Europe which have created the UK RDF export
opportunity is held up in some quarters as a “Ghost
of Christmas Future” character, supposedly showing
what will happen in the UK if EfW development here
is not shackled by government intervention, such
as refusing planning consent for future facilities.
However, the history of EfW development in those
European countries bears no similarity to the factors
which drive future EfW development in the UK.
In Western Europe the current EfW over capacity
situation in some countries is primarily due to the
widespread development of publicly owned and
funded facilities at a time when waste arisings were
expected to continue growing and municipalities
each funded and built their own facilities. Landfill
bans in some cases also accelerated the growth in
EfW plants and greater use was also made of CHP
in many cases as part of major urban development
or redevelopment projects, using the waste heat.
By contrast, the UK has relied on landfill capacity
availability for longer, has developed less EfW
capacity overall and has seen more local authorities
developing shared capacity. The UK now relies
entirely on the private sector for future infrastructure
delivery. Also, in the UK there have been very
few new communities or major urban projects
developed with CHP incorporated, due to fewer
opportunities and less public sector house-building.
Securing project funding for major new EfW projects
in the UK is now recognised by all as the primary
challenge and controlling factor, more so than the
planning system, with perhaps the odd political
exception.
Unlike in Europe, the market is therefore providing
the current brake in the UK, through post-recession
nerves and a continuing risk-aversion to funding
plants not underpinned by traditional models of
guaranteed long term local authority contracts. This
is proving problematic even when the availability of
feedstock generally, from commercial sources as
well as municipal is not in question in many parts of
the country. Such investment attitudes are perhaps
slowly changing in response to the change in the
market but this is where the Green Investment
Bank (GIB) potentially has a key role in helping to
overcome such blockages as investment models
in new UK facilities begin to be re-thought. The
existence of consented capacity on paper and on a
UK-wide basis is therefore a very different thing from
the delivery of a necessary geographical spread of
operational capacity on the ground. In short, anyone
comparing the current EfW over capacity situation in
some Western European countries with the UK, and
worrying about the same thing happening here, is
making the mistake of comparing apples with pears.

Biffa: Reality Gap Report10
No threat to recycling
Some campaigners have also argued that EfW
overcapacity would suppress the UK’s future
recycling ability, preventing a potential 70%
recycling target being achieved. However, evidence
from Europe and the UK indicates that growth in
EfW and growth in recycling tend to go hand in
hand (Figs 1 and 2). This may well be a reflection
of the fact that EU countries who are serious about
tackling landfill diversion have tackled both aspects
of the sustainable waste management chain.
Germany and the Netherlands, to whom Biffa
currently supplies most of its exported RDF, both
have higher MSW recycling rates than the UK,
alongside high incineration and low landfill - or in
the case of Germany, no untreated MSW to landfill at
all following its ban in 2005. The German experience
may suggest that their substantial public investment
in EfW following their landfill ban has contributed
to their current overcapacity. A general landfill ban
in the UK would therefore not be the way to go,
plus it could leave legacy issues relating to part
completed quarry restoration projects. It would also
ignore the vital role landfill plays for non-recyclable,
non-combustible and specialised wastes in the
long term, as well as its short to medium term role
helping to plug the UK residual waste treatment
capacity gap, especially in geographical areas with
residual waste arisings too low to attract investment
in new and possibly more expensive treatment
infrastructure.
It is widely acknowledged that the challenges
facing the UK recycling industry at present and
going forward are nothing to do with the availability
or otherwise of UK EfW capacity, which naturally
competes with landfill in terms of gate fees, at the
high end of the gate fees range, compared to MRFs
at the low end (Fig. 3).
(source: EU Eurostat 2014)
100%
90%
80%
70%
60%
50%
40%
30%
20%
10%
0%DE AT BE NL SE SI LU UK DK IE EE FR IT FI ES BG PT HU PL CZ CY LT EL LV HR SK MT RO EU28
Material recycling Composting and digestion Total incineration (including energy recovery) Deposit onto or into land
3. General Issues (continued)

Biffa: Reality Gap Report 11
(Defra 2015 Waste & Resources Digest)
Landfill
Other
Cost of LA waste management including landfill tax
Incineration with EfW
Recycled/composted
Cost of LA waste management excluding landfill tax
30
25
20
15
10
5
0
3.5
3
2.5
2
1.5
1
0.5
02000/01 2001/02 2002/03 2003/04 2004/05 2005/06 2006/07 2007/08 2008/09 2009/10 2010/11 2011/12 2012/13 2013/14
Mill
ion
Tonn
es
Cos
t of L
A w
aste
man
agem
ent
£(bi
llion
) Net
cur
rent
exp
endi
ture
(Defra Waste & Resources Digest, 2015)

Risks to recycling and the reasons for some recent
MRF closures relate to risks around commodity
prices, some Local Authority contracts incorporating
fixed prices for recyclates and weak “pull” factors,
i.e. markets for products made from secondary
raw materials (SRM). In terms of municipal waste
recycling services, cuts to local authority budgets
may also have an impact through, for example, cuts
in services and reduced expenditure on recycling
education and communication. As if to reinforce this,
Q2 2014/15 Local Authority waste statistics figures
for England show recycling only up by around 1%
to 45% (from 43.9) but arisings up by 4%. There
is more that could be done to improve recycling
prospects by addressing these issues and also
more focus on separate collection of food waste.
As a major recycling business Biffa fully supports
measures to increase recycling. But for the
recycling sector to survive and flourish it must be
environmentally AND economically sustainable.
There has been a lot of focus on environmental
sustainability so far but not enough attention paid to
economic sustainability. Self evidentally, recycling
is not an end of pipe solution. It needs customers
at the back end of the pipe as well as the front end
and at the right prices for the equation to work.
If recycling is not economically viable it either
won’t happen, or if it does, it won’t survive, never
mind how environmentally desirable it may be.
Unfortunately that has been demonstrated vividly
in the UK though closure of a number of recycling
plants on commercial grounds. The UK needs to
learn from that and tackle recycling in its own right,
addressing pull factors as well as push factors, as
recognised in Circular Economy debates.
Clearly recyclables need collecting separately
from residual waste but trying to pull every ounce
of remaining scrap plastic from a load of residual
waste, using energy in the process and ending
up with a low grade material with very limited, if
any, market value is neither environmentally nor
economically sustainable. Instead, the material’s
inherent economic and environmental value as
an alternative, secure, low carbon fuel source for
waste fuelled power stations can be recognised
and utilised – making the important link between UK
energy security and waste management objectives.
If other, better markets for low grade plastics
materialise in future and if UK plc makes more
progress on alternative domestic energy capacity
development, then the pendulum may swing in
favour of it being worth additional processing
to extract scrap plastics from residual waste.
Meantime, Biffa’s RDF fuel supply business provides
a flexible and tonnage adaptable solution, which
complements recycling, benefits waste producers
by keeping costs down and recovers most readily
accessible value from that material, in the form of
energy. For the remaining material, or where energy
recovery solutions are not viable, let us not forget
that we still have a stock of usable and tonnage
adaptable landfill capacity in the locker.
Anti-EfW campaigners’ arguments have also, in
the past, featured complaints about public subsidy
of EfW plants and long term MSW contracts.
However, neither of these is relevant in relation to
new merchant EfW capacity development in the
UK, which will depend entirely on the private sector
and commercial fuel supply agreements for its
provision. Private funders are far more risk averse
than their public sector counterparts. Anyone
trying to boost recycling by fighting future UK EfW
development is therefore barking up the wrong tree
and channelling their efforts in the wrong direction,
which is unfortunate. If the traditional disconnect
between UK waste policy and UK energy policy can
be overcome we may even come to regard modern
EfW plants as simply another variety of power
station, which happens to use locally produced
waste as a fuel instead of coal or gas, thereby also
reducing reliance on imported coal and gas and
helping with UK energy security.
Biffa: Reality Gap Report12
3. General Issues (continued)

Biffa: Reality Gap Report 13

Biffa: Reality Gap Report14
4. UK Capacity studies
The relevance (or not?) of UK-wide
statistics
A UK wide assessment is relevant to central
EU Directive compliance position, but it is
not especially helpful in relation to actual
infrastructure delivery. This is because EfW
plants (and other waste management facilities)
serve smaller market areas within the UK.
Government administrative regions, as some
limited interest, since the economic catchment
such administrative boundaries any more than
other businesses do. In some cases they bear
little relation at all to them, for example, waste
from the north west of England being sent for
energy recovery to the north east of England
(Teesside). Individual facility catchment areas
are impacted more by geography, transport
routes and travel times, demographics and local
market competition.
Consequently, investors will still want specific
market and financial appraisals for individual
projects, notwithstanding national level “overview”’
reports. It is those project-specific studies which will
determine what facilities get built. However, national
level overview reports can have an impact on
perceptions and market confidence, which is why
it is important that the wrong messages do not get
sent out and the right ones do.
Hypothesis v Reality?
Following publication of Eunomia’s reports industry
and other consultants followed with reports of their
own. CIWM engaged Ricardo AEA who noted the
need for an appropriate geographical spread,
rather than a simple UK-wide assessment. They
predicted a UK capacity gap ranging from 5 to
15M tpa in 2020. Sita and Veolia have published
similar reports, Sita predicting a gap of 11.7MT in
2020, Veolia 11.3MT. Viridor has also highlighted
unhelpful planning restrictions, particularly politically
motivated catchment area restrictions on UK EfW
plant planning consents. This latter example of over-
regulation is also not confined to some EfW planning
consents. Some Local Authorities have a dogmatic
love of catchment area restriction planning
conditions for all forms of waste facilities, even the
sort of recycling facilities they are supposed to be
encouraging investment in. This misguided, anti-
competitive and harmful practice leads to sub-
optimal usage of facilities and under-utilisation of
capacity.
The Green Investment Bank (GIB) has also
published a report (including analysis by Tolvik
consulting) flying the flag for the major investment
opportunity in the UK, due to the current and
predicted capacity shortfall going forward, which
they calculate at 4 - 7.7MT in 2020.
Tolvik themselves consider future UK capacity
shortfall issues as part of their January 2015 report
into the RDF market, anticipating RDF export to flat
line at around 2.5Mtpa and, even allowing for that,
still leaving a predicted capacity shortfall in the
UK of around 6MT at 2020 onwards (their central
scenario). If the RDF export volumes were to be
deployed in the UK instead, an equivalent additional
EfW capacity would be needed in the UK, making
the UK gap correspondingly bigger.
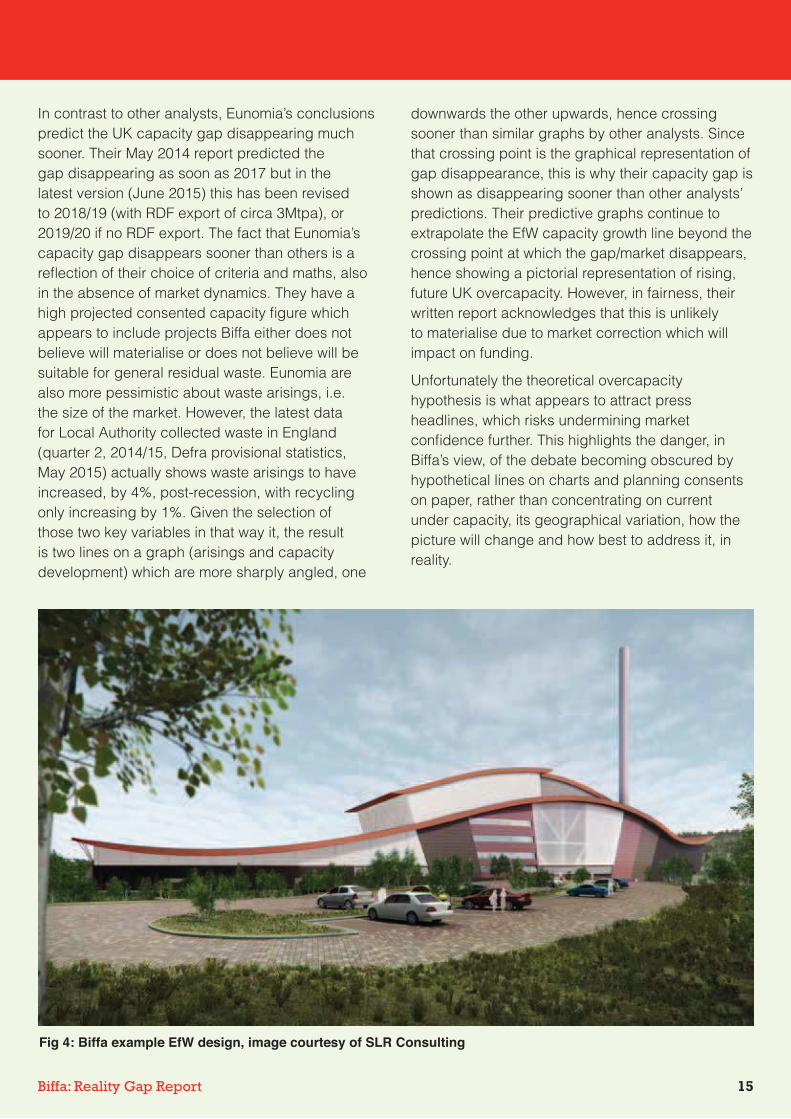
Biffa: Reality Gap Report 15
In contrast to other analysts, Eunomia’s conclusions
predict the UK capacity gap disappearing much
sooner. Their May 2014 report predicted the
gap disappearing as soon as 2017 but in the
latest version (June 2015) this has been revised
to 2018/19 (with RDF export of circa 3Mtpa), or
2019/20 if no RDF export. The fact that Eunomia’s
capacity gap disappears sooner than others is a
reflection of their choice of criteria and maths, also
in the absence of market dynamics. They have a
high projected consented capacity figure which
appears to include projects Biffa either does not
believe will materialise or does not believe will be
suitable for general residual waste. Eunomia are
also more pessimistic about waste arisings, i.e.
the size of the market. However, the latest data
for Local Authority collected waste in England
(quarter 2, 2014/15, Defra provisional statistics,
May 2015) actually shows waste arisings to have
increased, by 4%, post-recession, with recycling
only increasing by 1%. Given the selection of
those two key variables in that way it, the result
is two lines on a graph (arisings and capacity
development) which are more sharply angled, one
downwards the other upwards, hence crossing
sooner than similar graphs by other analysts. Since
that crossing point is the graphical representation of
gap disappearance, this is why their capacity gap is
shown as disappearing sooner than other analysts’
predictions. Their predictive graphs continue to
extrapolate the EfW capacity growth line beyond the
crossing point at which the gap/market disappears,
hence showing a pictorial representation of rising,
future UK overcapacity. However, in fairness, their
written report acknowledges that this is unlikely
to materialise due to market correction which will
impact on funding.
Unfortunately the theoretical overcapacity
hypothesis is what appears to attract press
headlines, which risks undermining market
confidence further. This highlights the danger, in
Biffa’s view, of the debate becoming obscured by
hypothetical lines on charts and planning consents
on paper, rather than concentrating on current
under capacity, its geographical variation, how the
picture will change and how best to address it, in
reality.

Biffa: Reality Gap Report16
5. Biffa’s own research: the “Reality Gap”
Biffa believes that the debate has become
obscured by an over reliance on theoretical,
mathematical modelling. Whilst it is important
to undertake that, a reality check needs adding,
both generally and in relation to project
investors to a shrinking capacity gap, both
generally and from an individual project
perspective, will have a fundamental impact on
the conversion rate of approved capacity on
paper into operational capacity on the ground,
after the theoretical modelling has been done.
Other reports generally only present a direct
comparison between arisings and future
capacity, extrapolated on a graph until two lines
cross and the gap between them disappears.
terms of comparing different analyses, but it is
not how the scenario is likely to play out on the
ground.
As well as reviewing other published reports,
Biffa has undertaken its own detailed analysis,
underpinned by our own comprehensive database
of UK residual waste treatment projects. We have
considered a wide range of scenarios relating to
residual municipal and I&C waste arisings, cross
checked against published Defra data and, from
that, selected the scenarios we consider most
realistic and matched them against the future
capacity scenarios as influenced by our analysis
of the prospect of market support for individual
projects and the sector in general – the supply
and demand factors. From that a realistic future
operational capacity can be devised, stripping out
factors which can skew such forecasts, such as
an over reliance on planning consents, inclusion of
facilities or capacity which is unlikely to be suitable
and over optimism about delivery and funding for
some ATT technology proposals.
Waste Arisings forecast (prior to
recycling)
Data on residual MSW is annually reported and
is generally good. As we move out of recession
recent data for MSW arisings is starting to show an
increase again (UK 2013/14 arisings up by 2.3%
at 25.6MT – Defra Digest of Waste & Resource
Statistics, January 2015, with provisional figures
for Sept 2013 to Sept 2014 for England showing a
4% increase). Going forward, household growth is
considered to have proportionately more impact on
waste arisings than population growth and, when
considered in the context of the current Government
programme to increase house-building significantly,
with focus on brownfield development, household
growth is likely to have an increasing influence. In
contrast, national data on I&C waste is less accurate
relying on the 2009 survey and the Defra 2015
Waste Digest (2012 data) although again, moving
forward out of recession, Defra predicts waste
growth.
After consideration of a large number of scenarios,
a small, 0.5% growth/year for MSW arisings is
considered appropriate for modelling, bearing
in mind population and household growth. For
I&C waste, 44% of that is generally accepted
by Defra as being “MSW like”. Again, various
growth scenarios were considered, with two being
considered appropriate for modelling: 1.4% pa
growth (in line with Defra forecasts) and 1.4% pa
until 2020 with 0.5% thereafter.

Biffa: Reality Gap Report 17
Reductions from recycling
Published UK MSW recycling rates stood at 44.1%
in 2012 and 44.2% in 2013. The current EU target
is 50% by 2020, with the prospect of a new Circular
Economy target of 70% by 2030. I&C waste
recycling rates based on 2009 Defra data of 52%
are projected by Defra to increase to 62% by 2020.
3 scenarios for MSW and I&C waste are considered
for modelling, as follows:
• Low: Existing rates 44% (2014) flat through to
2025
• Target: 50% recycling in 2020 and then flat to
2025
• High: 50% in 2020 increasing to 60% in 2025 to
achieve 70% by 2030
• Low: Existing rates (52% in 2009) plateau with no
additional improvements through to 2025
• Target: In line with DEFRA prediction of 62% by
2020 and then flat to 2025
• High: As above but continued increases between
2020 and 2025 at a rate of 1.6%pa
Modelled residual waste volumes
range
Modelling the above growth scenarios against the
above recycling scenarios generates a range of
potential arisings available for further treatment in
2025 between 19.6Mtpa and 27.06Mtpa.

Biffa: Reality Gap Report18
5. Biffa’s own research: the “Reality Gap” (continued)
The role of RDF export
RDF export will continue to play a vital role and
provide UK waste producers with a cost effective,
non-landfill option, taking advantage of the spare
capacity available in Europe. We share the view of
Tolvik and most others that this is likely to continue
at present rates of around 2.5MT per annum and
that has therefore been incorporated as a constant.
There are two ways of factoring the RDF export
contribution in: it can be regarded as a contribution
to UK capacity (as we have done) or it can be
deducted from UK arisings. However, either way,
should that domestically produced RDF volume be
deployed within the UK, instead of being exported it
would therefore require an additional 2.5Mtpa of UK
EfW capacity provision.
Future UK residual waste treatment
capacity and its make up
Biffa has compiled an extensive and detailed
business intelligence database of all known UK
residual waste management facility projects, upon
which the following findings are based.
EfW (incineration)
By EfW we refer to direct incineration technology.
This by far provides the greatest capacity of all
relevant treatment technologies. Consequently, it,
also results in the biggest contributory factor to the
range in predicted capacity in the other studies,
particularly the Eunomia studies. Others, including
our own, are more cautious in their expectations. As
already noted, for large scale EfW projects funders
typically look for safety margins of available suitable
feedstock in multiples of plant capacity.
For EfW we consider three future capacity
• Low: nothing above that in operation or under
construction is delivered
• Medium Biffa’s assessment of additional projects
which will be delivered
• High: All known projects are delivered. Whilst we
know that this will never be a realistic scenario
it helps to understand where other studies may
have generated their numbers.

Biffa: Reality Gap Report 19
Advanced Thermal Treatment (ATT)
For the purposes of our analysis, ATT describes
technologies such as gasification or pyrolysis
solutions for the treatment of residual MSW and I&C
waste streams. This excludes purpose-designed
biomass power stations, which we consider are
unlikely to be suitable.
• Low: – nothing above that in operation or now in
construction is delivered
• Medium: – Biffa’s opinion on projects that will
be delivered. This is a pessimistic assumption
based on high project failure rates to date, further
weakened by the impact of CfDs on revenue
and the recent news that the October 2015 CfD
auction is to be postponed due to a Government
review of Renewable subsidies - we expect
more clarity on this in the Autumn 2015 Spending
Review.
• High: all known projects are delivered. Whilst we
know that this will never be a realistic scenario
it helps to understand where other studies have
generated their numbers.
Mechanical & Biological Treatment
(MBT)
For the purposes of the assessment, MBT describes
processes that sort residual waste streams and
create RDF and other outputs that can be further
treated through thermal or anaerobic digestion
processes. To calculate the ‘treatment capacity’
it has been assumed that only 40% of the plant
capacity actually treats waste. 60% then returns to
the market requiring further treatment i.e. RDF
• Low: - nothing above that in operation or
construction now is delivered
• Medium: - Biffa’s opinion on projects that will be
delivered
• High: all known projects are delivered. Whilst we
know that this will never be a realistic scenario
it helps to understand where other studies have
generated their numbers.

Biffa: Reality Gap Report20
Others: Autoclave and SRF/
Cement Kilns
Autoclave is a popular solution for sterilising
infectious clinical wastes, however as a general
waste treatment technology it has experienced
significant technical and financial issues in recent
years and is not anticipated as playing a major
future role. Of 2.9M tpa of proposed schemes Biffa
only considers one scheme (Shanks Wakefield PFI)
being in operation through the review period.
As regards SRF/Cement Kilns, high grade RDF
is often pelletised for specific kiln fuel feed
requirements.
Historic demand fluctuations have caused
nervousness regarding reliability of the end
destination. Where alternative fuels are utilised it is
often a blend of many materials such as shredded
tyres/dried sludge, etc. SRF may account for as little
as 25% of the total inputs. Again, this provides a
relatively small contribution to UK capacity.
Total predicted treatment capacity
Combining the three scenarios for each form of
treatment gives the range on the graph below (Fig
10). However, as noted, the theoretical maximum is
purely a mathematically derived figure, based on
all known projects being delivered, and is included
simply to illustrate the very large numbers which
can be presented if an appropriate reality check is
not applied.
5. Biffa’s own research: the “Reality Gap” (continued)

Biffa: Reality Gap Report 21
Capacity Gap: The Reality Gap
As with any statistical exercise, selective maths
can produce a huge range of results, in this case
ranging from 34Mtpa of hypothetical overcapacity
in 2025 if all consented projects carried on to full
development and money were no object, to an
under capacity of 9.5Mtpa if nothing got developed.
Clearly these two hypothetical extremes are of
no use for serious strategy planning, other than
to serve as a warning against using unrealistic
scenarios.
With the demands of project funders already
referred to it is inconceivable that projects that
result in over capacity will ever achieve delivery.
Similarly, significant under capacity is unlikely
due to the number of consented projects and the
eagerness of many developers to realise their
projects if they can secure feedstock and funding.
The likely capacity which will get developed is
therefore a clear result of supply and demand.
The more waste in the market requiring treatment
the greater the level of capacity that can be
sustained, with the reverse also being true.
To narrow the range and generate a realistic
capacity gap it is therefore essential to accurately
predict the volumes of waste that will exist in the
market alongside how the market is likely to react.
For the purposes of this review 2 scenarios are
selected as those which are most likely to occur:
• Growth Volume A + Target recycling:
- Annual waste growth of 0.5% pa MSW and
1.4% pa I&C
- ‘Target’ recycling (50% recycling achieved for
MSW and 62% for I&C) by 2020 and stable
through to 2025
• Growth Volume B + Circular Economy:
- Annual waste growth of 0.5% pa MSW and
1.4% pa for I&C up to 2020 and then 0.5%
thereafter
- High recycling (50% MSW in 2020 rising to
60% by 2025 and 62% I&C rising to 68% by
2025).
The use of High Volume A and High Volume B
creates a range of residual waste in the market of
between 27.06 (A) and 21.92 (B) Mtpa as shown in
Fig 11 below:

Biffa: Reality Gap Report22
Given the underpinning assumptions of both target
recycling and the circular economy impact this
is deemed to be a reliable and safe baseline for
calculating the gap in capacity for both 2020 and
2025.
Combining the volume (feedstock market) ranges
with the predicted realistic capacity provision in
response to those market scenarios leads to two
potential capacity gap outcomes modelled up to
2025, which we refer to as “Reality A” and “Reality
B”. Reality A is the scenario of higher waste arisings
(current Target recycling) and correspondingly
higher new capacity investment, Reality B is
the scenario of lower waste arisings (Circular
Economy), with correspondingly lower new capacity
investment, as depicted in Fig 12 below.
Fig 13 Capacity Gap
5. Biffa’s own research: the “Reality Gap” (continued)

-12
-7
-2
3
8
GIB Tolvik Low Tolvik Central Tolvik High Viridor
Sita Eunomia Biffa - Reality A Biffa - Reality B
2020 2025
Biffa: Reality Gap Report 23
As can be seen from the comparison below, Biffa’s
analysis compares favourably with others, with the
exception of the Eunomia reports.
Fig 14 - Benchmarking
6. Benchmarking: capacity gap analysis comparisons
Biffa: Reality Gap Report24
Contrary to hypothetical predictions of
overcapacity, in reality Biffa believes that the
calculated capacity shortfall on a UK-wide
basis will never entirely disappear. We agree
with others that the treatment capacity gap will
continue to reduce, in one of two probable ways
in our view, but the geographical patchiness and
to secure project funding for major projects
(typically multiples of proposed plant capacity
coverage in terms of fuel supply availability)
will mean that a permanent treatment capacity
gap - or balance - will always remain. Indeed,
it would be a remarkable coincidence if future
infrastructure development matched the gap.
Funders who are already nervous, even with the
current UK capacity shortfall (market opportunity),
will become increasingly nervous as the gap
(market) reduces, until the point where the
remaining market is too small and scattered to
provide an attractive investment. This will be
experienced at a local level where the market in
certain areas of the UK will not be attractive enough
for investors, leaving geographical shortfalls – “cold
spots” - and hence, when combined, a persistent
UK treatment capacity shortfall. We believe this
simply represents an inevitable equilibrium in the
UK market – a working balance.
Rather than continuing to regard this remaining
balance as a “gap”, it should be recognised as
the natural settling point for the UK residual waste
treatment market. Although the reduced scale
and patchy coverage of the treatment capacity
shortfall will not provide the necessary climate for
much, if any, new major EfW project development
beyond that which is already in hand, the waste
arisings can still be managed by use of other
means, depending on location. This may include,
inter alia, the use of existing accessible landfill
assets, further RDF export (depending on access
to European markets) and, possibly, smaller scale
advanced thermal plants designed to achieve
greater efficiencies and less reliance on CFDs than
some of the ATT proposals to date which have failed
to secure funding. Existing landfill assets can help
manage a share of the balance whilst new treatment
infrastructure comes forward, also stepping in
during annual EfW plant downtimes. In addition to
the remaining balance of residual waste treatment
capacity shortfall will be the remaining portion of
non-recycle, non-combustible and specialist waste
streams which will continue to require disposal
by landfill as the most appropriate environmental
option for such materials. These waste management
options are tonnage adaptable components of the
suite of management methods the UK is going to
continue to need, in the short, medium and long
term.
Biffa is a key provider of these services and is
strongly placed due to controlling major tonnages
of residual I&C waste feedstock. In that sense we
are clearly differentiated from speculative EfW
developers with no control over feedstock. Having
a good understanding of feedstock and fuel
supply logistics is important to be able to place
that material into the most appropriate part of the
available outlet portfolio, providing cost effective
and reliable solutions for UK waste producers.
Going forward there may also be opportunities for
more refined forms of fuel products such as SRF or
fuel pellets.
What this also shows is that, like Biffa, the UK is
actually well placed going forward. By not putting all
its eggs into one basket, the UK has a good range
of options available to it, a healthy development
pipeline for new infrastructure and the ability to
respond flexibly as we make further progress
towards a Circular Economy. But we need to keep
all options open and available.
In a similar way to how “full employment” in the
UK is generally accepted as including a working
balance of unemployment, it is perhaps also time
we should apply a similar level of realism to the
notion of “full waste management capacity” in the
UK residual waste market, acknowledging that it will
necessarily include a working balance of treatment
capacity shortfall, together with a legitimate landfill
role for waste requiring landfill – the vital base which
supports the waste hierarchy and without which it
would collapse. That is not a failure scenario, it is a
getting the balance right scenario.
7. After 2025: The remaining balance - The Reality Gap

Biffa: Reality Gap Report 25
Biffa UK coverage
94,000
CustomersNationwide
Our service success rate
99%Cu
sto
me
rs
Over
6,000StaffC
om
pa
ny Our revenue
per annum
£900m
Weekly collections
2.6million
624.000tonnesdiverted from landfill last year
Pro
ce
ss
All operatingdivisions awarded
5 starsin H&SManagement
Sa
fety
Reporting of near misses and hazards up
60
I&C Collection Depots
Municipal Depots
Treatment/Recycling Centres
Operating Landfill Gas Sites

Biffa: Reality Gap Report26
Refuse Derived Fuel (RDF)
Various grades of RDF (and SRF - Solid Recovered
Fuel) can be produced. The majority of RDF,
which is currently exported from the UK, is
generally referred to as “coarse” grade RDF. It is
predominantly residual MSW and I&C waste which
has been subject to segregation/sorting and a
mechanical process (eg shredding) before being
baled and wrapped.
ATT (Advanced Thermal Treatment) facilities
normally require a more refined grade of RDF
(higher specification) which increases the cost of
production of the RDF required.
(produced for use in e.g. cement kilns) is a
further refinement (usually associated with a higher
CV, lower moisture content, Chlorine limit and
smaller shred size) and is again more expensive to
produce. There is some SRF produced in the UK
which is exported either direct to cement kilns or to
blending sites in Europe.
Destination countries
The key countries that RDF is exported to are those
predominantly in close proximity to the eastern
seaboard of the UK. This allows the loading of RDF
onto ships at eastern UK seaboard ports and a
short sea journey to the importing country. The RDF
can either (i) be loaded onto curtain sided trailers;
(ii) into ISO shipping containers or (iii) temporarily
stored in bales before being transported in bulk
by specialist bulk transport ships carrying 2-3000
tonne loads.
Destination countries include:
• Holland;
• Northern Germany; and
• Scandanavian countries including Sweden and
Denmark
Spare capacity at European EfW facilities
There is current spare capacity at many EfW
facilities in mainland Europe through inter alia (i)
less waste arisings due to the recession, and (ii) the
success of waste minimisation/recycling. In addition
many of the European EfW facilities were planned,
sized and funded by municipalities when it was still
assumed that waste tonnages would continue to
grow at a rate of 2-4% per year.
UK portfolio of EfW facilities still being built
The current portfolio of UK EfW facilities has been
financed primarily on the back of long term local
authority PFI/PPP residual MSW projects. New UK
capacity has therefore largely been built to service
residual MSW rather than residual I&C waste. The
UK portfolio of facilities is still being constructed
and capacity will continue to become operational
through to 2020/2025. Whilst capacity can therefore
be estimated it is clear that at the current time, and
for some time yet, there is insufficient capacity to
process the amount of residual waste in the UK that
could potentially be thermally treated.
It should be noted that the majority of UK facilities
were designed to process a proportion of residual
I&C waste but most likely at an assumed gate fee
higher than that currently being charged for RDF
exports.
RDF is being exported to predominantly moving
hearth grate technology EfW facilities. These
facilities are able to accept a wide composition of
waste input which is attractive to the exporter as
waste is an inhomogeneous material.
Many of the EfW operators in mainland Europe
are prepared to enter into short term contracts.
They do not have to worry about the usual UK
Project Funding requirements (for new facilities)
which normally require long term 15+ year contract
terms. This suits RDF which is created using UK
residual I&C waste as it “mirrors” the contractual
arrangements (short term) which the waste
management company/RDF producer has with its
waste producer customers.
status
In the majority of cases waste can only be moved
out of the UK if it is being transported for Recycling
or Recovery purposes. All of the European EfW
facilities that accept RDF from the UK have
Recovery (R1) status. This designation is set out
within the Waste Framework Directive and is used to
demonstrate the energy efficiency of the facility.
In mainland Europe the majority of EfW facilities
APPENDIX - Technical notes and definitions

Biffa: Reality Gap Report 27
are CHP (Combined Heat and Power) facilities.
This allows them to not only generate electricity
but also export heat in the form of steam or hot
water which can be used by industry or in district
heating networks. This means that they are often
significantly more energy efficient than UK EfW
facilities, which are only generating electricity, as
they have not been able to connect to a viable heat
off take.
Environmental Performance
A number of the Dutch EfW facilities have shown
(through the use of WRATE type environmental
assessment modelling) that their improved
environmental performance, through the use of CHP,
significantly exceeds any environmental disbenefit
associated with the RDF transport.
Technology
Energy from Waste (EfW) – incineration
EfW facilities have a number of advantages over
other forms of waste processing - including:
Proven technology
EfW in the form of direct combustion, moving hearth
grate technology is a tried and tested technology
and has continued to be refined and improved.
This allows EfW facilities to be more easily Project
Financed provided waste supply requirements have
been met.
Modern EfW facilities are capable of achieving
c.27.5% efficiency through electricity generation
only. Technology supply companies continue to
work on increasing this efficiency to c.30%. As such
they are often able to achieve R1 (Recovery) status
on an electricity only operating mode.
Availability
EfW facilities can achieve 8000 hours per year
or greater. Some EfW technology providers will
guarantee in excess of 8000 hours.
Capex and Opex certainty
EfW technology supply companies are able to
provide certainty about Capex and Opex costs.
Environmental performance
EfW facilities are able to meet all modern
environmental emission limits. They can also
be retrofitted with additional equipment if these
emission limits change in the future.
Ability to process a wide range of waste
materials
EfW facilities can process a wide range of input
waste materials. They are also able to adapt
to changing waste input composition. Waste
composition continues to change in the UK as
recycling and recovery rates continue to increase
and consumer habits change. They can be
retrofitted with different equipment, such as water
cooled grates, to cope with higher CV waste
composition.
CHP enabled
All modern EfW facilities have the capability to
be CHP enabled. In the UK finding suitable heat
off takers is difficult and therefore the majority
of EfW facilities tend to operate in an electricity
only generating mode. However, there is growing
interest within local authorities in developing ESCOs
(Energy Supply Companies) and some of the UK
EfW facilities are now being connected into district
heating schemes.
Advanced Thermal Treatment (ATT)
There has been significant interest in the UK in ATT
technology over the last 10 years.
This has been largely driven by:
(i) the availability of government subsidies in the
form of ROCs and CFDs; and (ii) the ability to
obtain planning permission for ATT facilities
often more easily than for EfW incineration
projects. However, ATT development to date
(from planning into operational mode) has had
limited success in the UK. The key reasons for
this include:
In many cases developers have been unable
to demonstrate that the technology proposed
is suitably robust and is able to process
inhomogeneous waste both from residual MSW and
I&C waste streams. Many ATT facilities elsewhere
are operating only on biomass which is significantly
more homogeneous than residual waste.

Biffa: Reality Gap Report28
APPENDIX (continued)
Gate Fees
Developers have often been unable to offer a
competitive gate fee particularly after taking into
account the fuel preparation costs to prepare a
suitable RDF for processing in the ATT facility. Fuel
preparation costs can often add c.£15-25 per tonne
onto the “headline” gate fee.
The export of RDF has also had a negative impact
on the ATT market development. There were
many developers who based their initial financial
modelling for ATT projects on their ability to beat
landfill costs by £5 or £10 per tonne, which is no
longer a competitive position.
Funding
Many developers have failed to raise project finance
by not being able to satisfy key Project Funding
requirements such as:
• evidence that the technology is able to operate
using the proposed waste input;
• evidence that the technology has been operating
successfully for at least 8000 hours in any one
year;
• provision of a suitable technology EPC (Engineer
Procure Construct) wrap;
• evidence that the developer has secured long
term waste input contracts; and
• evidence that the developer has secured ROCs/
CFDs
It should be noted that the change from the ROCs
to the CFD regime has introduced additional
uncertainty into the ATT market place.
Fuel Supply Agreements (FSAs)
Developers have often been unable to source
suitable waste tonnages for suitable contract
periods. Many ATT developers have targeted
residual I&C waste for their fuel. I&C waste is
normally contracted for short periods with waste
producers and therefore there is a mis-match
between the length of contract between the waste
producer and the waste company and the length of
the contract that the developer requires in order to
raise project finance.
The specification of the fuel required to be
processed in an ATT facility is often onerous. The
fuel specification for an ATT facility will often include
the following parameters:
• max. shred size;
• max. moisture content;
• min. CV (and sometimes a CV range);
• max. ash content;
• max. metals content; and
• high biomass content
In many cases developers have also sought
to include penalties for not meeting the fuel
specification within their draft Fuel Supply
Agreement. This can make fuel suppliers nervous
as the FSA is no longer a simple “Supply or Pay”
arrangement with limited liability.
There have been a number of instances where the
input fuel requirement has also included a biomass
content in excess of 60%. The biomass trend in the
UK is for decreasing biomass content within residual
waste streams as increasingly more organic waste
is being extracted for processing in composting and
AD facilities.
There has been little debate to date about the
efficiency of the various ATT technologies operating
in an electricity only mode. There is no reason to
think that the exploitation of heat/steam in the UK
will continue to be anything other than difficult. It
remains to be seen whether some ATT technology
providers will be able to achieve R1 status in an
electricity only operating mode.

Biffa: Reality Gap Report 29
Mechanical Biological Treatment (MBT)
Ten years ago many commentators thought that
MBT was an alternative to EfW as a “final” solution.
However, there is now a general acceptance
that MBT is a pre-treatment process and, in
order to meet, inter alia, the requirements of the
Landfill Directive for residual MSW, the RDF/SRF
outputs from many MBT processes have to be
thermally treated. Up to 60% of the waste that
MBT facilities can process may still require further
treatment. There has also been confusion about
the effectiveness of MBT technology in meeting
the biodegradeability reduction requirements of
the Landfill Directive for Municipal Waste. It is
now recognised that many MBT facilities do not
significantly reduce the biodegradeability of the
incoming waste.
Biffa believes that there will be few, if any, additional
MBT facilities constructed in the UK after current
facilities still in build have been finished.
Autoclave
Autoclave technology was seen as a means of
separating potentially valuable recyclate from mixed
residual waste streams thus avoiding the need
to undertake sorting/segregation in dirty MRFs. It
was also seen as a technology to avoid having to
construct EfW facilities and could therefore obtain
planning permission much easier.
Batch processing
Autoclave technology operates on the basis of a
“chamber” being loaded which is then subjected to
heat, pressure and agitation. Processes that depend
on batch feeding (such as autoclave technology)
have relatively high waste handling costs both at the
input and output ends of the process. They therefore
tend to require high value waste inputs and are thus
not financially compatible with the lower value waste
inputs predominantly associated with both residual
MSW and residual I&C waste streams.
The energy requirements for autoclaves can also
be high and are not compensated by the value of
the recyclate output recovered even though these
are usually very clean. In addition, there is now
less recyclate currently remaining in residual waste
streams due to improved segregation through better
collection regimes and differential waste collection
charging schemes. Therefore the total value of any
recyclate recovered will decrease.
Other outputs
The other main output from autoclaves is a floc
like substance. Although there was talk about this
material being used as an insulation material this
was never successfully exploited. The other forms
of disposal therefore required result in the overall
autoclave process being more expensive than
originally modelled.
Cement industry
Energy costs
It is estimated that c.40% of the cost of producing
a bag of cement is energy. All of the major
cement companies in the UK have therefore been
investigating the use of alternative fuels in order to
substitute for more expensive virgin fossil fuels such
as coal.
Cement production/supply
Cement is now a world wide resource and is
controlled by a small number of large cement
companies. This means that cement can be
imported into the UK from other parts of the world
if it is cheaper to do so. It also means that plants
in the UK can be closed/mothballed for periods of
time. This has a direct relationship on the size of the
market for alternative fuels (and cement grade SRF)
for the UK cement kilns.
Cement companies in the UK
There are currently 10-11 cement production plants
in the UK which process alternative fuels.
The main cement companies in the UK are:
• Cemex
• Heidelberg (Hanson in the UK)
• Lafarge
• Tarmac
• Hope
Cement production plants are usually located close
to their principle raw ingredient ie limestone and are
thus located in particular parts of the country. This
can also have an impact on the transportation costs

Biffa: Reality Gap Report30
APPENDIX (continued)
associated with moving cement grade SRF to them
for processing.
Alternative Fuels
The alternative fuels that the UK cement kilns
currently process - include:
• tyres/tyre crumb;
• sewage sludge pellets;
• wood chips;
• MBM (Meat and Bone Meal);
• liquid waste fuels; and
• cement grade SRF
SRF for use in cement kilns has to meet specific
characteristics - including:
• Moisture content - usually less than 20%;
• CV - usually greater than 17MJ/Kg;
• Chlorine - usually less than 0.8%; and
• Shred size - usually no greater than 30mm
This means that the production of SRF, to this
specification, can be relatively expensive. This
production expense has to be weighed against the
resultant lower gate fee to be paid for the supply
of cement grade SRF compared with that charged
for “coarse grade” RDF or higher specification RDF
for ATT facilities. A number of companies have
established exclusive arrangements with particular
cement companies in the UK.