The Real Cost of Slow Time vs Downtime
56
The Real Cost of Slow Time vs Downtime Tammy Everts @tameverts CMG Performance and Capacity 2014
-
Upload
radware -
Category
Technology
-
view
10.504 -
download
0
Transcript of The Real Cost of Slow Time vs Downtime

The Real Cost of Slow Time vs Downtime
Tammy Everts
@tameverts
CMG Performance and Capacity 2014

Slide 2

Who’s had an outage-related
emergency?
Slide 3

Who’s had a performance-
related emergency?
Slide 4

Slide 5

Slide 6
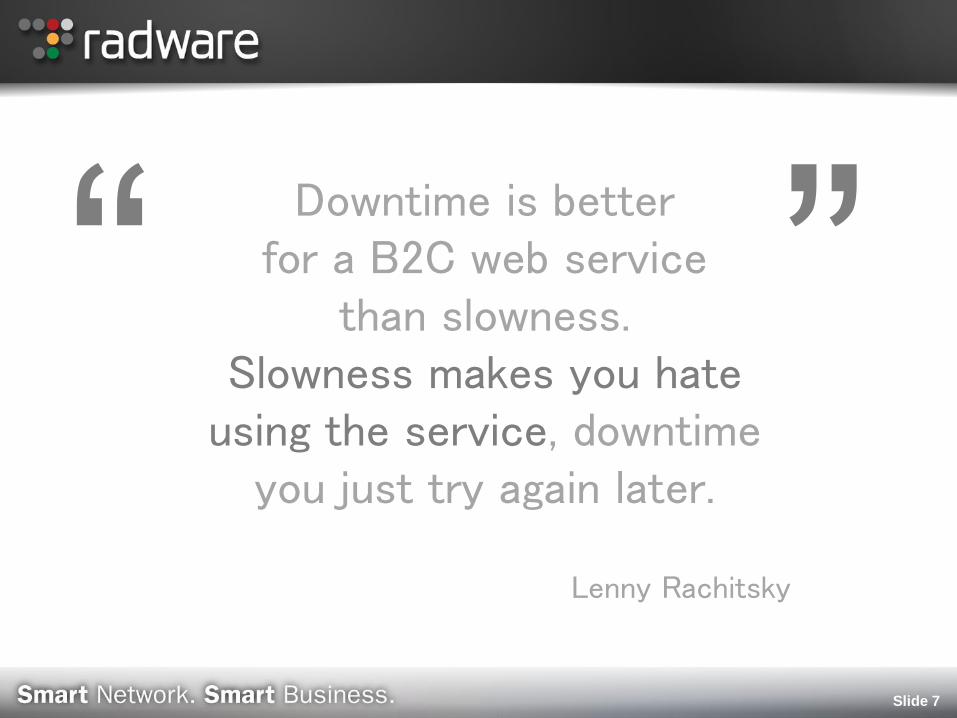
Downtime is better for a B2C web service
than slowness. Slowness makes you hate
using the service, downtime you just try again later.
Lenny Rachitsky
Slide 7
“ ”

Let’s look at some
real-world examples.

Performance affects many business KPIs every day
Revenue
Conversions/downloads
User satisfaction
User retention
Time on site
Page views
Bounce rate
Organic search traffic
Brand perception
Slide 9

Slide 10

Slide 11
Real User Monitoring at Walmart
How to Measure Revenue in Milliseconds

Slide 12

Slide 13
Shopzilla’s Site Redo: You Get What You Measure

Slide 14
Case study: The impact of HTML delay on mobile business metrics

Slide 15
YSlow 2.0, Stoyan Stefanov

Slide 16
Firefox and Page Load Speed – Parts 1 & 2

Slide 17
20% more organic traffic
14% more page views
Increased sales
For Smartfurniture.com,
faster pages =
Slide 18
Current state of the union
for web performance

Slide 20
Slide 21
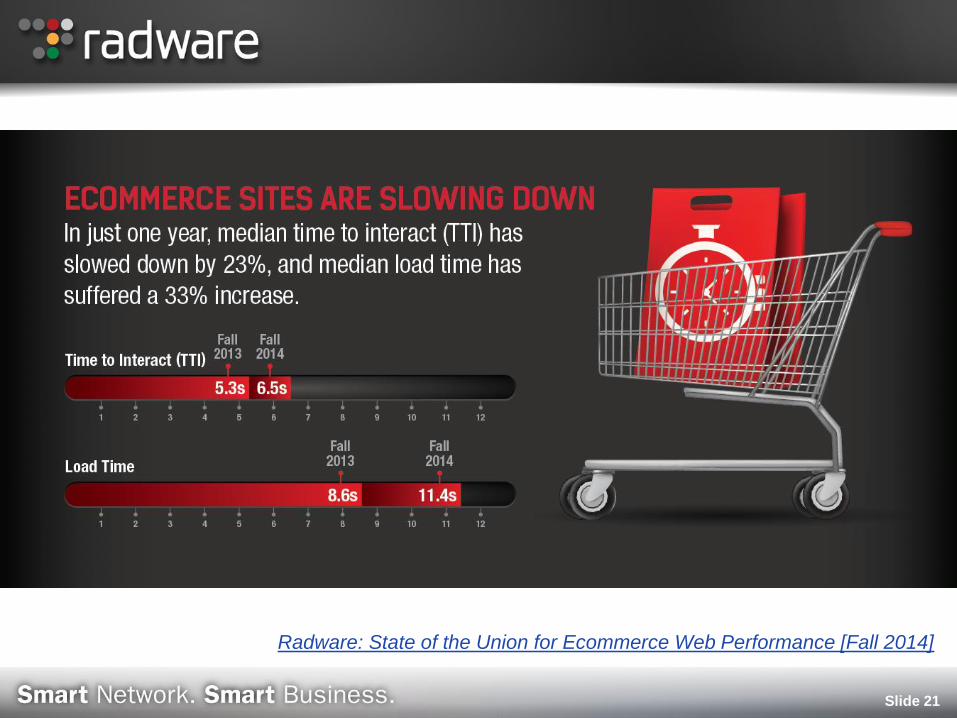
Radware: State of the Union for Ecommerce Web Performance [Fall 2014]

Slide 22
Time to interact (TTI)
The moment primary content
and call-to-action are rendered
in the browser

Slide 23
Optimal load time 8-second delay
Jakob Nielsen: Website Response Times

Slide 24
Radware: State of the Union for Ecommerce Web Performance [Fall 2014]
Downtime vs slow time

Average revenue loss per hour of downtime
Average revenue loss due to one hour of
performance slowdown (slower than 4.4s)
Slide 26
TRAC Research/AlertSite: Online Performance Is Business Performance
$21,000
$4,100
However…

…website slowdowns occur
10 times more frequently
than outages.
Slide 27
TRAC Research/AlertSite: Online Performance Is Business Performance

2X the impact
Slide 28

Whether it’s a public website or an internal web-based application, most of us believe that a successful DoS/DDoS attack results in a service outage.
However, our Security Industry Survey (conducted with 198 respondents within a wide variety of global companies, most of which were not Radware customers) uncovered that the biggest impact of DoS/DDoS attacks in 2013 was service level degradation, which in most cases is felt as service slowness.
Slide 29
Radware 2013 Global Application and Network Security Report
“ ”

Agenda
Slide 30

Permanent abandonment rate
Slide 31
Akamai: The Impact of Web Performance on E-Retail Success
Outage Slow performance
9% 28%

Slide 32

Customer lifetime value (CLV)
Total dollars flowing from a customer over the
entire relationship with that customer
CLV is one of the biggest predictors
of retail success
Slide 33

Slide 34
New visitors Return visitors
Time on site (minutes) 2:31 5:31
Page views/visit 3.88 5.55
Purchase intent Return visitor is 9X more likely to make a
purchase than a first-time visitor.

How to measure the short-term
and long-term impact of slow time

Slide 36

Slide 37
Lenny Rachitsky: The Upside of Downtime

Minutes of downtime
x Average revenue per minute
= Downtime losses
Slide 38

Slide 39

Average cost of downtime
$5,600 per minute
$300K+ per hour
Slide 40
Gartner: The Cost of Downtime (July 2014)

Slide 41

Challenges of measuring impact of slow performance
Need actionable performance data
Need visibility into performance of third-party scripts
Need visibility into quality of experience (QoE) for users
(availability PLUS speed)
Need to be able to measure the business impact of
performance issues
Slide 42

Slide 43

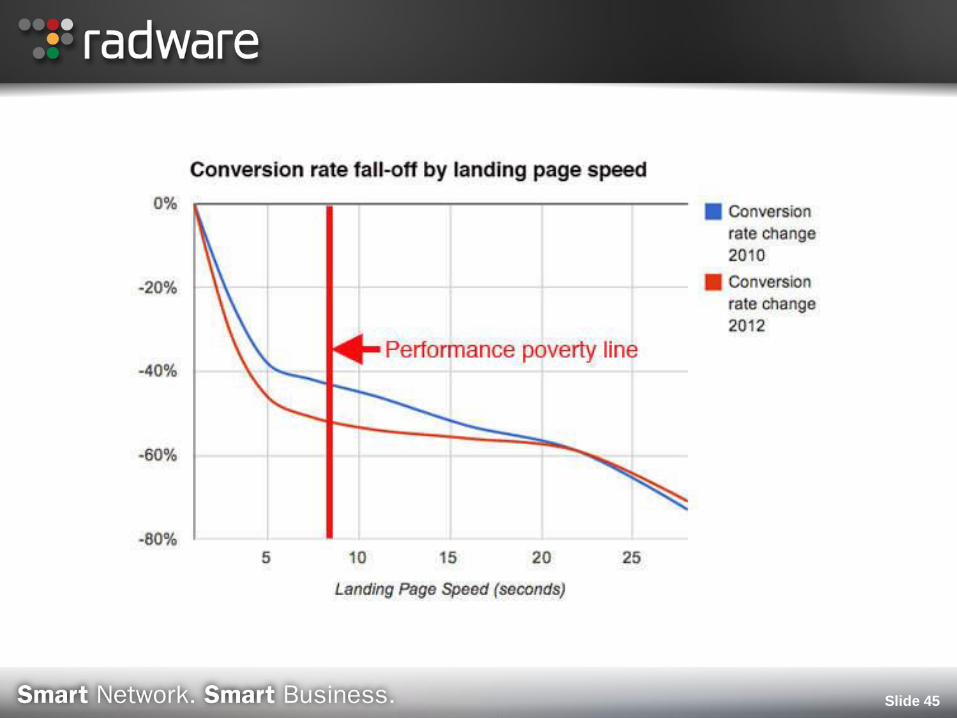
How to calculate short-term losses due to sub-optimal
performance
Step 1: Identify your cut-off
performance threshold
4.4 seconds = average delay in response time
when business performance starts to decline (TRAC)
Slide 44
Slide 45

Step 2: Measure TTI / AFT / Speed Index
for pages in flows for typical use cases
Slide 46

Slide 47
Step 3: Calculate difference between
threshold and actual measurement
5.6
-4.4
2.2 seconds

Slide 48
Step 4: Pick a KPI
1-second delay =
2.1% decrease in cart size
3.5 - 7% decrease in conversions
9 - 11% decrease in page views
8% increase in bounce rate
16% decrease in customer satisfaction

Slide 49
Step 5: Calculate losses
3.5% decrease in conversion rate
x 2.2s slowdown______________
7.7% decrease in conversion rate

How to calculate long-term losses due to slow performance
1. Identify percentage of converting traffic that experiences speeds slower than 8-second poverty line threshold.
2. Identify current CLV for those customers’ (individual or aggregated).
3. Using the stat that 28% of those customers will permanently abandon pages that are unacceptably slow, identify the lost CLV.
For example…
Slide 50

CLV loss sample scenario
If median total value of customers over the past 3 years is $1000,
then predicted future value for the next three years is $1000.
(CLV is $2000.)
Current converting user base of 10,000.
10% of those customers (1000) experience TTI of 8+ seconds.
28% of those customers (280) will not return.
CLV loss = $280,000
Slide 51

Slide 52
Takeaway

Slide 54

Slide 55

Tammy Everts
@tameverts
webperformancetoday.com
Slide 56
Questions?