THE REACTION OF DIAZONIUM SULFATES WITH ...arizona.openrepository.com/arizona/bitstream/10150/...THE...
50
The reaction of diazonium sulfates with alcohols Item Type text; Thesis-Reproduction (electronic) Authors Langley, Martha Ella, 1933- Publisher The University of Arizona. Rights Copyright © is held by the author. Digital access to this material is made possible by the University Libraries, University of Arizona. Further transmission, reproduction or presentation (such as public display or performance) of protected items is prohibited except with permission of the author. Download date 03/07/2018 02:54:51 Link to Item http://hdl.handle.net/10150/319333
Transcript of THE REACTION OF DIAZONIUM SULFATES WITH ...arizona.openrepository.com/arizona/bitstream/10150/...THE...

The reaction of diazonium sulfates with alcohols
Item Type text; Thesis-Reproduction (electronic)
Authors Langley, Martha Ella, 1933-
Publisher The University of Arizona.
Rights Copyright © is held by the author. Digital access to this materialis made possible by the University Libraries, University of Arizona.Further transmission, reproduction or presentation (such aspublic display or performance) of protected items is prohibitedexcept with permission of the author.
Download date 03/07/2018 02:54:51
Link to Item http://hdl.handle.net/10150/319333

THE REACTION OF DIAZONIUM SULFATES WITH ALCOHOLS
■ by 'BBrtha E0 Langley
A Thesis Submitted, to the Faculty of theDEPARTMEWT OF CHEMISTRY'
In Partial Fulfillment of the Requirements For the Degree of
' - MASTER OF SCIENCEIn the Graduate CollegeUNIVERSITY OF ARIZONA
195Y


STATEMENT BY AUTHOR
This thesis has been submitted in partial fulfillment of requirements for an advanced degree at the University of Arizona and is deposited in the University Library to be made available to borrowers under rules of the Library.
Brief quotations from this thesis are allowable without special permission, provided that accurate acknowledgment of source is made. Requests for permission for extended quotation from or reproduction of this manuscript in whole or in part may be granted by the head of the major department or the Dean of the Graduate College when in their judgment the proposed use of the material is in the interests of scholarship. In all other instances, however, permission must be obtained from the author.
Si gned:
below:
APPROVAL BY THESIS DIRECTOR
This thesis has been approved on the date shown
_ //.A. E. Kel f Date

ACKNOWLEDGMENT
The author wishes to express her deepest gratitude to her research director* Dre Alee E> Kelley* for the guidance* interest and encouragement so freely givene

■V
OF CONTENTS' . . ' ; ' : :■ " • ■ „ ■ . , ■ . : Page
LIST OF. TAELES .» ® .•« . « » ■ ©•. * « «..• o © o & © * ,vi-LIST OF FIGURES .: © ./©X© © ;©"0© „ viiTHE REACTION OF DIAZONIUM SULPATES. WITH ALCOHOLS , © , © » © © © © © © . » ' © © 1INTRODUCTION ©- -© © , © .© , © ... »\© , © © © © © . .. .1
The -Homolytic Cleavage 0 » • „ „ «, © © „ © ©; © 1The Heterolytlc. Reaction .v© © © © © ©. © © »' 4
]R,ESTJI/i5' © 6 © -L © , ' © .© 1 " © . _ ©.' © 0 © © © O © O © © O © 0EXPERIMENTAL © © ' © . ' „ © , , © © © © © © . . © © © © 26
A Materials ■ 0 ? . © ;.©;' ©-' ©; ©i;©' . 26Apparatus and. Techniques © ©. © © ; © © © © © © ' 27
. Reaction nf p-Toluenediazonium Hydrogen . SuiTate.:':ih' 'ihe Presence W ; ;- " ' Moles pf Sulfuric‘ Acid per Mole of - O '6 .Diazonium Salt© Exp©. 15 © © © © © © © © © 33
. Calculation of .Results © vv© ;© : .©2 :© ;.©, > © 6 . ©,: © ■ © 34CONCLUSIONS © © •© © :©:;;©, © ,©t©: . © ;© '"'©: © © © ©. © © - 40BIBLIOGRAPHY .©: ©' , "© © .© . © 6©,. © ; ©6 ,6:© '©' © .©t©!'; 42

LIST OF TABLESTable v ' w ;. I* Decomposition of Benzened.iazonium Salts
in Anhydrous Methanol 0 »• <, ' c . „ o , 02, •; First Order Rate Constant and. Products
■ ■:'* ■ in the Decomposition of Diazonium Salts■ / ;. in.Ethanol) from Guggenheim Rate Plot,« ,3« First Order Rate Gonsthnts1 and Products
' ■ in the Decomposition of p-Toluenedlazon- ; ium Hydrogen Sulfate in Ethanol at 40°,; from Guggenheim Rate Plot „ , 0; . . „ ■ ,. «
4o 'Expt> 15o p-Toluenedia.zonium ■ Hydrogen ■ \Sulfate and Sulfuric 4cld ;(0o2lS i|) in ' : Ethanol at 40°9 Data and•Calculations v Recordedo 0; * 0 © © © © © © © © © © © ■ © ©
Page
5
7
: ID
35

vil
LIST OF FIGURES
Figure . 'x; .::V; : ''i :: : ., ■■■' PaSe10 Exp to 2 0 p - To Inene d. ± a z o nl urn Hydrogen '
• Sulfate in Ethanol at 40°,;Guggenheim3ia, t O - F lot o O O O O O O- O d o O O C d.' -O o 11
2a p-Toluenediazonium Hydrogen Sulfate in Ethanol with- Sulfuric Acid., Guggenheim
Rate Plot : O O o' O o C.' .0 0.0 o O o / og -ot o' ' . 13:"3o Dependence of the Observed Rate. Constant
on the Concentration' of Sulfuric Acid; for p-Toluenedidzonium Hydrogen Sulfate in Ethanol at 40° ? 0,' -o ■» «, .1 o » « « = » » ' ■
' 4 „ : Expt „118 o p-Toluenedia2ohlum::Hydrogen ; '-'Sulfate in:Ethanol with Sodium Acetate .
- at 40°, Guggenheim Rate Plot „ „ e 0 o » 205o Expt. .10. p-Toluenediazonium Hydrogen
. , . , Sulfate in Ethanol ;With Sulfuric Acid: -t (0.0144 M) at 40°, Experimental and ,;. -. \ . .
■' ' ; Calculated Rates :: » ■ l ' 'o '1': ■>: 0: ' 226.o Expt. 12 o p - Toluenediaz onium Hydrogen
Sulfate in Ethanol with Sulfuric Acid (OoST.S M)-at 40°, Experimental and-
- ' •. Calculated Rates, , o o o o o. -o -o . , 0 .= » - 23, ' 7.0. Expt o -3 o p-Toluenediazonium Hydrogen . •: -: ' Sulfate in Ethanol with Sulfuric Acid.. (0.0022 M) at 40°y Experimental and \
Calculated Rates . o' o 0- '« « « .o o o o . o 24:,8:o ' Diagram ef; Apparatua} o oo^ 0 „ o » o .o . o « o ' 289o Expt o- 15 o ■ p-ToluenediazonlUm ' Hydrogen •:. ',
Sulfate in Ethanol with Sulfuric Acid.(0o2l6 M) at 40°, Guggenheim Rate
• •Plot (Sample Experiment) o o o = » o » » 38
THE REACTION OF DIAZONIUM SULFATES WITH ALCOHOLS
INTRODUCTIONFor many years little was known about the, thermal
decomposition of diazonium salts in alcohols. As a result of the growing interest in both chemical kinetics and mechanisms of. organic reactions5 several laboratories began study of diazonium salts decompositions in hopes of arriving at a reasonable mechanisme It is now recognized that the reaction San follow either of two main paths. One involves a heterolytic cleavage of probable Sg2 type producing an aryl ether0 ' ■
- ArNo X" 4* ROH — —$> ArOR 4- N0 + HX •V ■ .. ■' . - 'In the other, the salt is believed to be converted to a
covalent compound which undergoes a homolytic cleavagee This leads to the formation of a hydrocarbon.
: . ArN2 X~+ ROE — ^Ar-N=NOR + HX — $> ArH 4- N2 + RHO The Homolytic Cleavage: Strong evidence was.uncovered byKornblum, Cooper arid Taylor (1) in support of the hoitolytic cleavage. Hypophosphorous acid and various other substances were found to increase the rate of the reaction markedly (2), and a large amount of reduction to the hydrocarbon occurred.
# In a private communication Eornblum states that thediazoether has now been shown to be the covalent intermediate formed0

2
They also observed that certain substances which were known to act as free radical inhibitors did tend to slow the reduction reaction.
Huisgen and Nakaten (3) reported a J2 per cent yield of hydrocarbon and a thousand-fold increase in the rate constant when the decomposition mixture contained added potassium acetate. Unfortunately these results are at most only indicative of a trend in the reaction since there were so many doubtful experimental procedures used in obtaining these data.
DeTar undertook the study of basic and buffered systems in an effort to determine the nature of the free radical reaction. As a result of this work, he reported the free radical reaction to be approximately one and one- half order (4)
and the following mechanism was proposed for the reaction of benzene diazonium chloride in methanol with acetate ion present (5).
k1 [ ArN2+] + k1//2[ftrN2+] ^
C6H5N2 + CH3^ CgH^Ng + AcO~C,H_N=NOCH„ —
C^Hr-N=NOCH.
C<rHcN=NOAc(1)(la)(a)(2a)(3)
CgHcN=NOAc --> c6H5" + N2 + AcO*CH j O* + C H jO H ^C H g O H + •CHgOH

3
C gJfc + CHgOH
.CH gO H + CgH gN g+
C g l ^ + CHgOH
CHgOH + N2 + CgHg
(4)(5)(6)(7)
+ N2 + H+ ( 8 )
The reaction was followed by manometric measurementof the nitrogen produced. The products were determined spectrophotometrically. Using benzene diazonium chloride and allowing the reaction to run under acid conditions, the expected large yield of the ether resulted (5). There was also reported an indication that excess hydrochloric acid caused a slight decrease in the reaction rate and in the proportion of the hydrogen replacement to give hydrocarbons .
In a series of experiments run with varying amountsof added sodium acetate the yield of benzene was greatly increased. Variation in the sodium acetate concentration did not seem to affect the reaction rate appreciably (6).
With a buffer system of sodium acetate and acetic acid and the benzenediazonium fluoborate salt, benzene again predominated in the products. The reaction rate was influenced by the buffer ratio (acetate to acetic acid). Actually this buffer ratio is an indirect measure of the methoxide concentration, and an increase in rate with an

increase in the buffer ratio is an observation consistent' with the proposed, mechanism. Some, of DeTar1 s data is summarized in Table lc : : :'
DeTar aiso reported that oxygen present in the re- . action vessel had an ihhlbiting effect on hydrocarbon production from the free radical reaction, and lead to the formatioh of many oxygen-contalnihg colored by-products (6),. With oxygen being absorbed from the atmosphere there would result an apparent. incompietarevQlTition of nitrogeni This,, of course, would change the. measured value for the rate constanto V -vj"1 "
The Heterolytic’Reactiong At the; same;time DeTar was working on the, free radical reaction in basic solution, Kelley.Was following the ionic reactidn path by examining the deoompositidn of various diazpnium salts in absolute anhydrous ethanol (flo' . ''; t - ■- , ,. '
Under' ail reactioh conditionSii the benzenediazonium chloride"used gaye first order nineties, and phenetoie was the. main reaction product Most of these reactions were run near 25°s the- rate fdllpwad by ineasurenient of the volume of nitrogen produced, and the products determined from the reaction mixture spectrdphotdmetrlGaily,
- In order to test the effect of changing the cation, p-toluenediazdnium chldride was decomposed 0 The rate of

Table 1» Decomposition of Benaenediasonium Salts in Anhydrous tethanol (its 5)
Reactants Initial. ProductsEhcpteNo©
Temp©Cone©
Salt(H)
NaQAc HOAcLogNaQAcm r
PresentOp
% Np YieldRate mm/sec x 100
% Yield Ether Biphenyl
lo 25 Cl” .0988 -- — _ — _ yes 100% 95 ©5&,3mmoleslittle
5o M " ©100 ©22 _11 1*0 = 60 2©5 60 12
112© 2U©9 *0196 CO ©118 «=»©08 88 1*0 ©U 9©9U
117© 61 « ©0196 ©188 ©057 +•52 81 38©6 20 ©6
236© 15 n ©0186 ©19 ©as ~©37 No 98 ©7 6 8? U©5

6
this reaction at 25° was so lowthat runs on this salt were made at 40° to obtain cdhVehieht rate-measuring speed,This salt still gave first order kinetics, and an ether, p-methylphenetole, as the main\product.
■■ ■'.-■''v.When instead of the chloride, the p-toluenediazonium hydrogen sulfate was ■ used, ■.the result^ from thosepreviously ohtainedo ■ The reaction failed to give a first order rate plot, and instead of the p-methylphenetole appearing as the main product, toluene'wa-s produced in. better than 60$ yield. At higher initial sulfuric acid concentra- tfonf even as low as an equimolar amount, the reaction .. approaches first order kinetics, the amount of reduction to toiuena is greatly reduced, and the rate of the reaction is decreased. Selected examples, of these results are given as Table 2, 'iv-'i:;'''.:.;:-'- -
Since one ;moleVof free acid: is produced for every mole of diazonium salt decomposed, there is a very great^ change in the free acid concentration during the early part of the reaction. The reaction of p-toluenediazonium hydrogen sulfate is apparently pseudo-first order and is greatly influenced by: the changing acid concentration„ At higher acid concentrations^ the acid accumulating during the reaction becomes of much less significance, and the reaction comes much closer to appearing as simple first'order,
■ From the data obtained from his experiments using ,

Table 2e First Order Bate Constants and Products in the Decomposition of Diazonim Salts in Ethanol (7)
From Guggenheim ELoteEhcpte Temp Diazonim. Salt Initial M Cone a Total gas k x 10" % YieldNoe, M Cone® Mded Collected min" H0 C»a Ether
_________ _______________2_______ Substo % Theozy__________________
U5 2 5 o l5 b e n z e n e d ia z on ium d ” O e l lO lo S 2 U .8 2 ^ 5 79
$9 Uo©o p « to lu e n e d ia z o n iu m • C l“
■0»1— ■ 91o9 2U»1 . 9 .U 72
67 Mi p - t o l u e n e d i a z o n i m HS0^“
OoOlS — - 8 8 e 5 lU6«=5Ub 6Uo9 30
6 6 11 it a 8018 h 2s o ^ 8 5 .5 kOo6 3 9 .8 5 1
6iiC n M 0 6012 o022 H2SOj4 86© 7 3 5 .8 == —
68 n n 0 o 0 l8 .0.18 h 2s o ^ 9Uc2 17oJ4 6 o9 80
a- Ho Co »' %drocarbonb« Expts0 6? did not give a straight line for a first order rate ploto Instantaneous
rate constants decreased in value in the range shomoC“ The temperature went out of control by 1° at the beginning of the reaction© Calculations
were based on the remaining 70% of the original quantities after equilibrium was reestablishedo

8
four different initial concentrations of acid, Kelley estimated a rate dependence on sulfuric acid and proposed a tentative rate equation
for the reaction of p-toluenediazonium hydrogen sulfate with ethanol at 40°, when the concentration of acid is large compared to the diazonium salt (7). It is necessary that these values for the rate constant and the dependence of the reaction on sulfuric acid be verified by having data for experiments run at a greater number of different acid concentrations, especially at higher concentrations where the reaction is mainly ionic.
dtmin-1

• :' RESULTS ; ; ' ^In collecting data" to determine the dependence of ;
the rate of decomposition of p-toluenediazonium hydrogen sulfate in absolute ethanol* it was desirable to have data from experiments for which the initial acid concentration varied from the lowest possible* giving nearly first order kinetics* up to as high a concentration as can be safely used without having side reactions involving dehydration of ethanol by the acid» Other conditions were' set to duplicate work by Kelley (7)0 All reactions were run at 4o in absolute ethanol* and the rate of the reaction was followed by measuring .the volume- of nitrogen evolved 0
Six experiments were run at less than one equivalent of acid per equivalent of diazonium salt a The results of these experiments as recorded in Table 3 showed rates which were erratic and not readily reproducible seemed.to be a general trend towards a decrease in rate constant as the acid concentration increased„ The reactions still did not show first order kinetics (Pig0 1)„ ■
After the reactions were completed* the solution to be analyzed for products was deeply colored* and toluene was found present in yields up to 63 per cent0
‘The rates decreased when the ratio of initial acid concentration to diazonium salt concentration became equal

10
Table 3o First Order Rate Constants and Products in the Decomposition of p~Toluenediazonium HSOj,” in Ethanol at k0°
From Guggenheim. Rate Plots,
Espt0 Initial M Cone Total GasHo® M Cone® Added Collected
________________ Subst®___ % TheorylcAk x 1C
min” Observed
of YieldTols pHPo
0®018 78*3 U3 - 2k 30o8 19.3
2
3
5
6
7
8
9
10
8;
Hi
If!
o0022
.005
®0086 H
0OI8 98
0O36 "
7606
76.6
82*3
82*2
8U.6
85.2
o072 » ' 88*2
,lhb n 91.2
37.5-22.2 33.3 60
33.3-28 32.5 23.5
35 - 20 28.6 60.2
26.5
25.6
22.9
21.9 60.3
22.8 68.8
17 .8C 27®2
20.3-11.1 liul7c 76.7
18.7 9.2C 91.1
15 ,216 91.8 16.8 2.9 102.7
11 ,288 ” 92.8 >71-114.6 8C 70.2
12 ,576 11 91 15»U 6.7° 55.6
18 .OI4.8HaOAc 68.7 785 77.8 0
a- Tol. ® Tolueneb- pMP. » p«-Me t tiylphe net oleC" A small amount of benzene present in the absolute ethanol prevented an
accurate determination of the toluene produced®

11
1.30L Kxpt* 2 p-Toluenediazonium Hydrogen Sulfate in Ethanol at 1*0* \ Guggenheim Rate Plot, A t - 160 rain*
1.20
1.10
1.00
0.90So 750 2 125100
Time in Minutes Fig. 1

IQ
to or greater than one«, The Guggenheim, first order rate plot (8jj while sometimes showing some deviation during the latter half of the reaction, always showed good first order kinetics during'the first portion of the reaction» feigure'S show^:the difference in slopes of the Guggenheim ' rate; plots for e^eriments run with three different initial.
; ; , t The color of- the reaction mixture "became lighterwith, increasing acid, and when the ratio of the concentration of sulfuric acid to dlazonium salt reached 8 to 1 the spiution was nearly colorless. This is indication that the colored side products were formed Only through the free radical reaction which was being increasingly eliminated,
Assuming, as Kelley did (7), that instead.of an ordinary first order rate law
;V 4- Ar-Ng
applying, the dependence on the acid concentration a raised to some power n will give the rate law a slightly different forms- . ..,
. ; : § ,.k(=b;:-:h a0I>: :;v;: ^ . ■ ■ .
where an is the concentration of sulfuric acid, and G_ is the initial■concentration of the diasonium salt. Therefore the observed rate constant k" and the true rate constant k.are .related: .... ; . .

13
p-Toluenediaaonium Hydrogen Sulfate in Ethanol with II2SO). at I4D0
Guggenheim Rate Plot (8),
1.26
1.18-
1>
C*
1.02 A- HaSO^ (0,018 M)B- H2S0li (O.luii M)C- H2S0 (0.576 M) * Log (v* - v) + 0.016
11010lime in Minutes
Fi£. 2

14
k1 = ka0nand
log k1 = log k + n log aQThe least square value of the slope of the line in
the Guggenheim rate plot was calculated to give the value of k1 for each experiment. The logarithms of these values were plotted against the logarithm of the sulfuric acid concentration for each. Figure 3 shows the resulting line. The slope and intercept for this line were calculated by the least square method (9). The slope of the line (n)was -0.148. The value of the intercept, where the logarithm of the sulfuric acid concentration is zero, leads toan estimated true rate constant k for the ionic reaction of
-4 -132.13 x 10 min . If the form of the rate equation developed by Kelley is correct, the new values of the constants may be substituted and
-d[ArN2+ HSO4-] 32.13 x IQ [ArN„+ HS0h“1 _i cTE = jligSO 1 0.l4« mln
At this point an attempt was made to obtain an equation based on an assumed mechanism, which would describe the complete scope of the reaction, involving rate determining steps for both ionic and free radical reactions.Any such equation should, upon the proper treatment, give values which closely approximate experimental results.
Adopting part of the mechanism set forth in earlier works (5) and assuming two parallel first order reactions

Log
k*Dependence of the Observed Rate Constant on the Concentration of HaSOl for
v x ^ n i/-% 4 ry r* i4 i v m T -f-* rr4 Q i i T 4 m TV 4" V \< 1 • i 4 e 1
- 2 .8
-2.7
— 0*6 -1.6-1.2Log glgSOH
F ig . 3

to be occurring simultaneously as the rate controlling step,
Ar-Ng + EtOH — k-j— ^ArOEt + H + Ng (l)Ar-N=NOEt— k2 ->Ar* + N2 + "OEt (2)
The formation of the aryl ether by an S^2 type displacement of a nitrogen molecule from the diazonium ion by the oxygen atom in the ethanol is believed to be the rate controlling step in the ionic reaction (5*7)• An equilibrium between ionic and covalent molecules controls the formation of the compound which enters into a free radical-forming, and ultimately hydrocarbon-forming, step (equations 2, 4).
Ar-Ng + EtOH Ar-N=N-OEt + H+ (3)The free radical formed in equation (2) attacks an alcohol molecule, abstracting a hydrogen atom.
Ar- + CH^CHgOH >ArH + CH^CHOH (4)An electron transfer follows:
CHgCHOH + X > CH^CHOH + X- (5)
It is assumed the X reacting with the radical is not Ar-Ng or Ar-^N-OCHgCH^, which would lead to a chain reaction catalyzing the release of nitrogen. And finally
CH*CHOH ----> CH^CHO + H+ (6)
If Cj_ is the concentration of the diazonium cation in equation (l).

17
where Is the rate constant for ether production.The expression for the equilibrium constant KE for
equation (3) isKE = [Ar-N=N-0Et3 [h+]
[ArN2jIf CE is the concentration of diazoether and kg the
rate constant for the production of the free radical, then from equation (2),
t ? = k2CELetting Cip represent the total concentration of
diazonium salt,Cip *= C'p 4- Cg
Substituting (Grp - C^) for Cg in the equilibrium expression and solving for Cp in terms of CT, an experimentally determined quantity:
C. = CT ie a
where a is the hydrogen ion concentration.Since the rate of disappearance of the diazonium
salt is the sum of the rates of each of the simultaneous reactions,
—dCmcTE" = klCi + k2CE
Substituting for Ci and CE
a / = C t [ ^ + i $ ]

18
After integration. In
CT + 1 ] (8)where is the initial concentration of diazonium salt, Crpthe concentration of salt at time t; is the rate con-—* —2stant for the free radical formation reaction, the rate constant for ether production, a the sulfuric acid concentration and ]£E the equilibrium constant.
In this equation it is assumed the acid concentration remains constant throughout the course of the reaction, and it therefore should be more precisely applicable to reactions with high initial acid concentration.
Changing the form of the equation (7) slightly to allow for a changing acid concentration,
dx = (c0-x) [k (aQ + x) + k2KE ]^ I--ke-+“ --+— -J (9)where dx/dt is the rate of nitrogen evolution, x the molarconcentration of diazonium salt reacted, measured by themoles of nitrogen produced, and is the molar concentration of initial acid.
Integrating this equation and simplifying as much as possible,
T = V In W _ ^1_ lnZ (10)where V = b + 2k, (Kg + a )
2k1

19
W = b - 2 k - >TDY = b - 2k^x + 'fD"Z = c + bx = k-jX
cand where b = k^C^ ”(a0ki + k^Kg)
c = Cgfaoki + k2KE )
'TC - 1 [coki + (aoki + % ) ] •
All other terms have the previously stated meaning.Before the equation could be tested, values were
necessary for Kg and kg, constants which were still undetermined.
To obtain a value for kg, the rate constant for the free radical reaction. Experiment 18 was run with a solution containing sodium acetate to lower the hydrogen ion concentration. The estimated value of the rate constantobtained from the Guggenheim rate plot (Fig. 4) for this
—2 ireaction was 18.1 x 10 min" and was accepted as the value of kg. This is an approximation for the rate constant and may be correct only in order of magnitude.
A value for Kg was obtained by choosing a point from Experiment 8 which fits the least square line especially well, and was therefore considered appropriate. The values for time in seconds and moles of nitrogen produced were substituted into the equation (8) along with the previously

2 0
Expt. 18 p-Toluenediazonium I^drogen Sulfate in Ethanol with MaOAc (0.0i|8 H) at h O 0
Guggenheim Hate Plot, At * LU min.
loll
1.2
1.0
>i
Time in MinutesFig. h

21
deter^ne^. yal-ue 32<> 13 x ,10 min for k-. The equation . - wag then solved f or :• \ ;
3 ’ This value l„5x lO^^^which wasobtained for % was then sub stituted Into equation (lO) and the value oheoked byusing, the same x value and solving; for, time. . The calculated
. . . time fell within- 100'seeonds of the experimental time: for■ • the particuiar: x chosen = Therefore these values' for kg and
Kg were deemed reasonable enough to Use in testing- of ; g experimental data„ ■ g’ A total of ten experiments, ■ chosen over a range of ' . g
sulfuric acid cohcehtratidn of frem zero to 32 equivalents per equivalent' of diazonium salts were each tested separate-
, ly against equation (10) The molar: cdncentration•of sulfuric acid gave the value of a^, values of x were chosen
. as 2,-45 8 , 1 0 and 12 X 10”. moles . per liter 0 . Values for &in seconds were calculated for each value of x, and these
';. points were matched against:a plot from experimental data of• g time in seconds vs6 moles per liter oftnitrogen evolyed0 g
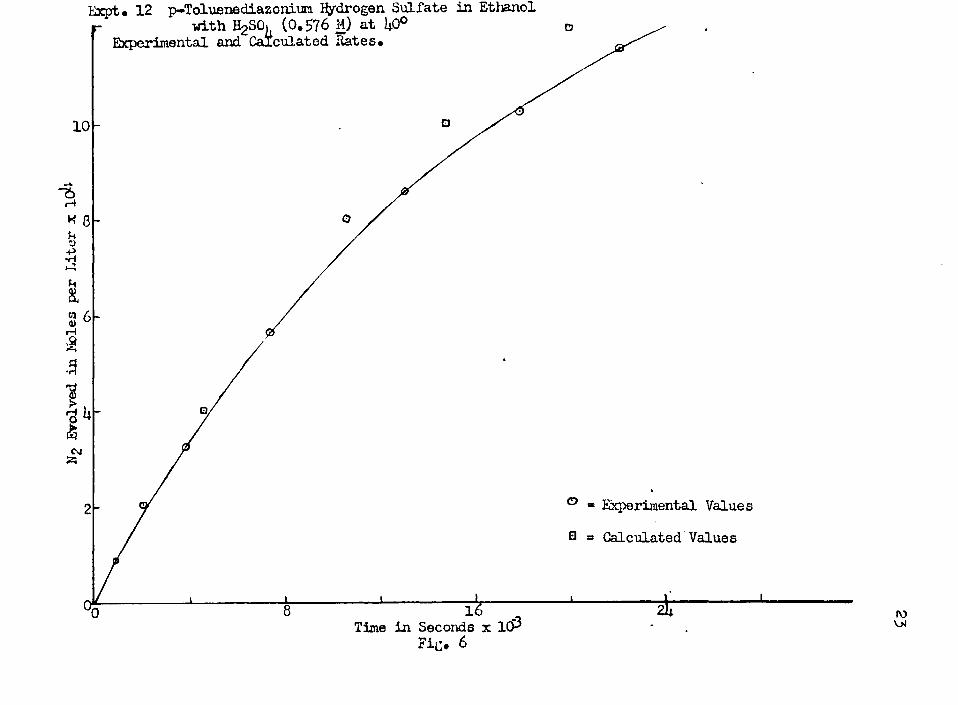
Figures 5* by and 7 Show some qf these results <, For .most of the rG&ations tested, the two sets of points:coin-
g - elded throughout the whole of the reaction. An exampleof . this is shown in Figo where the curves for.Experiment 10 .g. are drawn, Especially good agreement was obtained for those
p: ,'runs which lay . olosest to the log [KgSO^J vsQ log k 5 plot p ' line 0 A few reaotiqns .Showed deviation In the last half of

Expt# 10 p-Toluenediazonium Hydrogen Sulfate in Ethanol with H2SOK (O.OlUli H) at U0°.
Experimental and Calculated Bates*
Experimental Values
Calculated Values
Time in seconds x 10*3 Fig. 5
Expt • 12 p-Toluenediazonium Hydrogen Sulfate in Ethanol r with HpSOt (0.576 H) at U0°
Rates*Experimental and
10
CsJ
Experimental Values
Q « Calculated Values
Time in Seconds x 1C? Fig. 6

Expt • 3 p-Toluenediazonium l^rdrogen Sulfate in Ethanol with (0*0022 M) at i|0$
Experimental and Calculated Rates#
■%xu0)56u0)Ha
IC M
Experimental Values
Calculated Values
Time in Seconds x 10^ Fig* 7

25
the reaction, hut the greatest difference„ that in Experi- ment 12- (Pigo 6) amounted, to approximately 1 x 10 moles per liter, less than a 6 per cent deviation0 f;
For those reactions' where the sulfuric acid, concentration was less than one equivalent per equivalent o f , diazonium salt * the calculated, values generally showed a shorter reaction time than was actually observed experimentally (Fig o 7)« 'The explanation for this discrepancy iles in the fact that the ionization of bisulfate ion in absolute ethanol was taken, totbdf z'Of q, , This is not strictly . valido However5 in the absence of experimental data in. the iiterafure on fhe ionization of sulfuric acid. and. bisulfate
"ion in absolute ethanol, the simplest course was td take• the sulfuric.acid as completely ionized to the extent of one, and. only one, proton0 Although the ionization constant of ,bisulfate would probably be very small, and. in fact be negligible when a^ is large, the sensitivity of the reaction
.. to: acid, is so great that at. low acid cohcentfatlons the experimental results will show the effect of bisulfate ionization as more than the theoretical amount of acid presento With increase in Ag, the values match more and more closely as expected ^ ^ ' ^ ' : . y

26
: Z :.V;::-r r EXPERIMENTAL ' / :: '; V ' •: " • : ': , Materials t The absolute ethanol used, in the reactions .was eopnerclal absolute ethanol which had. been purified with magnesium (10) 0 The purified, ethanol was both : d.istiiled; ■ anh S'tored' under nitrogenV,. ff;— v't
. '■ p”$oluid.ine was an Eastman chemical which was ,.. purified, by reerysta 1 lizing a minirnum of three times from low boiling petroleum ether0 If a trace of color was still fphesent in the product after the third recrysfallization.5,■the proeess was continued, until- a- cieah white product: was obtained. The purified:p was dried and storedunder nitrogen in a yaouum desiccator»' - .1;: ' Visoam^i- nitrite, was; prepared just before use :by the
method of. Chretien and Long! (11) using aluminum sulfate 0 After separation^ the isoamyl nitrite m s washed: with a sodium; b 1 carbonatei-sodium chloride solution and dried overnight with magnesium sulfate, r- ■ : ,- p-SoluenediazdnMm-j; hydrogen sulfate was prepared. vby ;the method of Knoevenagel (12)„ The first portion of the ' crystals separating after 30 minutes;was filtered,off and washed with ethanol until all color was gone. , The
■ crystals were rinsed.' with ethers and. the ether-wet product was placed in ground-glass.stoppered test tubes,packed in . dry ice and connected to a vacuum pump overnight. The salt

• was then stored under nitrogen in dry ice0 ;• Apparatus and. Technlquas g . The apparatus used was ' "
; the same as that described by .Kelley (7) and is illustrated in Figure 80 Water from the cohstaht •temperature bath was '.elrgulated through the jacketed gas burets to keep the . ‘ temperature of.the gas measured the same as that of the reaction flasko The gas;burets;were filled with absolute; ethanol since the solvent for the,reaction was absolute ethanol, and this simplified the necessary vapor pressure correction. ':: ,. 1 : y;■ , , ';.v■. : ■'..;. ■ .
All the experiments were carried out in ah atmos- phere of air, since it Was reported by Kelley (7 ) and also by DeTar (5 ) that the presence of •oxygen does hot affect
: the rate of the reaction in acid , solution<,•v. Essentially the same process was. carried out for
each kinetic run. The apparatus was assembled; and allowed to come to temperature -in bhe ..water bath. A weighed sample of diazonium salt was funnelled into the flask,: and 100 ml of alcohol or alcohol-sulfuric acid solution already brought to the temperature of the bath was pipetted into the reac-
; tion vessel0 Generally a small portion;of this 1 0 0 ml Was useb to rinse any diazonium salt remaining in; the weighing bottle or funnel down into the vessel, i; : 2,:.'i : -
- The pipet was allowed to drain, then the reaction mixture was stirred for phe. minute by means of a magnetic

PressureTubing
Atmosphere
100 ml, buret f i l l e d w ith
ethanol
From LWater \--- ^ j
Bath ---- ToL eveling
Bulb
200,5 ml volume
Teflon. Covered Stirring Bar
Fig, 80 Diagram of Apparatus

29
. . "fchis tinie tiie sys'fcein. was open to the atmos-" phere 0. At the end of one minutej, the system was closed off. : and ndtpogen collection -starred,0 The time at. the instant.
of closing off the system Is taken as zero time for the . v . ; . klnetlc data0 It is probable that a: small amount of. nltro-
V gen was lost during the one minute of stirring# but the rate; •' : of dlssolutldn Is so low.with the salt used# the error was: 1 •ass'iimed: to be- I n S l g n l f l e a n t ‘ . . ■ v;'
Readings were generally taken every five minutes for approximately'the first 100 minutes of reaction time#
, ■ and. then at 10 and 20 minute;,intervalsThe five minute. . |.' readings were resumed after about 180 minutes for approxi
mately another one hundred minutes0 ,Generally the reaction was followed closely to about
•1. . ' slxty--five. per cent completion^ After this, time# readings• were made at various intervals until there appeared to be
• 1 no more nitrogen evolved#'..usually about thirty-six. hoursc ' ,The barometer was read often enough (about hour intervals )-
- ' : to register small pressure: variation's =‘ ■; ; ‘'t.; '1'V;..:/ . The method of calculating results will be discussed
in a later section0 "., The toluene was separated from the reaction mixture
— t./tQ.'s• the toluene-ethanol azeotrope0 : By means of fractionaldistillation of the solution through.a Todd column four .
• fractions were removed'o Each fraction, was diluted with 95

. per cent ethanol and. the amount of toluene present determined by Its ultraviolet spectrum as read from a Beckmann
, DU model spectrophotometer, • ;' ■ ' 1 / ' - I ' l ' .• > 1 : :: :, ' ' v , ■ ■ : : ; :It was" desirable to separate: the ether , from the . y.
deeply colored side products remaining ih the pot^ before any attempt was. made to determine the amount of ether present^ The pot residue remainlh^.,after fractionation y , was then distilled rapidly through a micro condenser system to eliminate as much'loss of ether as possible„ The ether came over at:I87 , leaving the colored products behind in
>: the pot, ’ The ether, fractions were..serially diluted and the ultraviolet spectra obtained. y ■
Theyoptical density of each fraction, after dilution to a known volume^ ' was ;Compared .with density-concentration . curves for both toluene and p-methyIphenetoie obtained from solutions ofyknowh concentrationo The percentage yield calculated for each was based on the total concentra-
r tlon of diazohlw .salty^ y :' - . ■ ■ ' VThe. accuracy of the method of separation was tested.
on a known mixture of toluene and p-methyIphenetole„ A 75 microliter portion of - toluene and . 2.0 ml of p -me thy Iphene.- ■: tole were combined with a small amount of p-.p1 -azoanisole
. (to- color the solution) in enough purified; absolute ethanol to make a total volume of 100 ml. Upon fractional distillation, nine.fractions were collected, leaving'five mil/pf y

31
SGititlon in the pot» This residue was distilled through the inicro oohderiser and both the distillate and, the conden- ^
; ser and pot washings were diluted, and the ether determined0 tv v No ether appeared, in any of the first nine fractions, ff.,:' and all the toluene appeared In 'the first f our fractions 0 :;’:i \ ' . Fraction '" '' if: ’ Total ■ ' ': , ^ toluene ; :f tg. 1 ' .7,4 ir 83.2
Distiilate - Pot Total■: 62 o 2 ' 29=3 ;91 = 1 '
v vf The quantities involved in this separation were equi- ;valent to those e±pebted from kinetic experiments at high acid/'coneentration> and correspond to yields, of four' per cent toluene and 75 per cent p~methylphenetole0 Therefores / toluene should be'detected to wlthln±0=? per cent of the f true yield, and. the p»m6thylphenetole to withinil2*8 per. ceht:v At lower acid;concentrations^ 'less p-methylphehetole will be produced, so the error in the. .determination of, p^metWiphenetoie may be .greater ' V , ■ if .
' f ' - ' During the course of the/kinetic runs, it becameevident from the very pdor material balance, obtained in many of the experiments that the method of p-methylphene- toie' separation should be' modified. The sulfuric acid accumulating in the last of the pot residue /became so concen-
;■ trated-as to cause probabie sulfonation and charring at •
Fraction% p-methyl-f / phehetole:

32
v temperatures of 200 0 Then, too, the volume of the liquid in the pot was too 'small -to assure consistent recovery of p-methylphenetole„ Therefore^ sodium carbonate was added to neutralize the acid before tbe final distillation0 'Sodium sulfate was filtered off> but the small amount remaining dissolved in the 95;per cent ethanol precipitated • when the alcohol was distilled off/ and this trapped part of the ether0 Several milliliters of ethylene glycol, which was found not to interfere with the spectrum of . p-methylphenetole, were added, in an attempt to increase the volume of high boiling, liquid and thereby decrease the • loss of p-methylphehetole »• The;recoyery of ether seemed to be improved: greatly by ..this process, although there appeared to be a small, amount of gummy substance formed which promoted foaming. It is possible this was some condensation product of cethylene glycol,.
. The complete data and calculations for,a sample experiment.follow« ;The letters refer to parts of the . apparatus shown in Figure .8 (p 0 28)0 The only experiment where the procedure differed slightly was Experiment 18, which was :ruh in a buffered solution and was found to have too rapid a reaction to follow by the previously outlined procedured In this case the experiment was started in the usual manner, but With U sample of sodium acetate contained in the side arm ofthe reaction, vessel,. After the first

: .A-.. , ; : : 33 .
/-, five, minutesof react/lon time, the sodium aoetate wasemptied into the reacting mixture and the readings continued as usual, but at much'' shorter time intervals „
The Reaction of p-Toluenediazonium Hydrogen Sulfate In the Presence of,Twelve % of Sulfuric Acid per Mole of Diazonlum Salt--'Expto 15= There was added lo500 ml of concentrated sulfuric, acid to purified absolute ethanol,in. a 100 ml volumetric flask, and the total volume adjusted to the "to deliver" line with absolute ethanol0 This was
. .shaken and then drained into an erlenmeyer flask> and 25 ml; of absolute purified ethanol was added to. bring the total volume to 125 ml and the-acid concentration to 0o2l6 molar=,
■ The flask was corked^ shaken, and clamped in a water bath held at 40o00 -f o050°o A reaction vessel of 20005 til volume was also placed in the water bath and the whole system
: . allowed to stand for at least one hour„ ; During, this timethe storage tube of diazonium salt, was allowed to come to
, : , roomvtemperaturee., -v .. : : ': ' A 0 c 3892 g C = 0018 .mole) sample of p-tofuehediazonium
v; hydfdgen'sulfate was placed in the reaction vessel (A) „A 100 ml portion of the ethanol-sulfuric acid mixture was
■ pipetted onto the salt, with.a small amount of the aliquotbeing used to rinse the diazonium salt out of the weighing ' ■ bottle. The pipet was allowed to drain for about one minute. The mixture, was stirred, for one minute, and then the three-way

34
stopcock (C) was turned so the reaction vessel was open to the gas buret and closed to the atmosphere. The data collected during the reaction is found in Table 4.
In Experiment 18, sodium acetate was placed in the side arm (b) before the vessel was immersed in the water bath, and when it came time to add. it to the mixture, the side arm was rotated l80°, tapped gently, and the salt was emptied into the solution.
Calculation of Results: The same method of calculation was applied here that Kelley describes in detail (7).In correcting the observed volume to standard conditions, since the gas pressure inside the reaction vessel changed as well as that inside the gas buret, the appropriate corrections must be made. In this particular experiment the total volume of the vessel was 200.5 ml. Since 100 ml of ethanol was added, there remained 100.5 ml of gas space inside the reaction vessel.
The new volume at standard conditions is calculated from the expression:
V_= f(V„ + 100.5 ) AP-VP x 2731 - TlOO.S x AP-VP x 2731 s L x "75U"~ T j I ~jUo~ TJ
VP Is the vapor pressure of absolute ethanol at 40 ; T Is the temperature of the bath ln°A; AP is the atmospheric pressure; Vs is the volume at standard conditions, and Vx is the observed volume.
For readings taken while the initial pressure remains

35
Table h. Expt. 1$. (0 .018 M) andHgSO (0 .216 M) in Ethanol a t UO.OO0
0.1892 g . o f CH^C^Ng"*" HSO ”, 2.1168 g . H2SO)4 in 100 m l. o f ethanol
I n i t ia l gas volume o f the apparatus ■ 100.5 m l. For Guggenheim ra te p lo t A t • 190 rain.
Time APi F i Vol. o f N2> m l. % Ng o f Guggenheim Rate P lo t Data V ol. o f No Loe o frain. ram. Vx vs Theory V 1 (v* - v) (v 1 - v)
0 687.8 0.631*1 0 .0 0.00 0 .0 18.98 18.98 1.27835 1 .2 0 .7 6 1 .9 19.37 18.61 1.2698
10 2. 1* 1.52 3 .7 19 .75 18.23 1.260815 3.U 2 .1 6 5-3 20.13 17 .97 1.258820 688.6 0.6350 1*.6 3.01 7.1* 20.38 17.37 1.239825 5 .5 3 .58 8.8 20.76 17.18 1.235030 6 .5 lt.22 10 . 1* 21.02 16.60 1.225335 7.1* It. 79 1 1 .9 21.27 16 . 1*8 1.2170LO 8. 1* 5.1*2 13.1* 21.59 16.17 1.2087h5 9.3 5.99 11*. 8 21.76 15 .79 1.198850 10.2 6.56 16.2 22.16 15.60 1.193155 11.1 7.11* 17 .7 22 . 1*8 15.31* 1.185860 12.1 7-77 19.2 22.75 11*. 98 1.175565 1 2 .9 8.28 20.5 23.01 11*. 73 1.168270 13.8 6.85 21 .9 23.21 U*.36 1.157275 U*.6 9 .3 6 23.2 23.51 18 .15 1.150860 15.1* 9.87 21*.l* 23.89 11* .02 1.186785 16 .3 10 . 1*1* 25.8 21* .02 13 .58 1.132990 17.2 11.01 27.3 21*. 21 13.20 1.120695 1 7 .9 11.1*5 28.3 21*. 1*7 13.02 • 1.1861
100 688.0 0.631*3 18.6 11.82 29.3 2U.66 12.88 1.1086110 20.2 12.83 31.8 25.10 12 .27 1.0888120 21.6 13.72 3l*.0 25.51* 11 .82 1.0726130 2311 11*.67 3 6 .3 26.05 11.38 1.0561IhO 21*. 1* 15.1*9 38. 1* 26.37 10.88 1.0366150 25.6 16.26 1*0.3 26.75 10.89 1.0208160 2 6 .6 16.89 1*1 .8 27.13 10 .28 1.0103180 688. 1* 0 . 631*8 28.6 18.22 1*5.1 27.66 9 .8 8 0.9750190 29.6 18.98 1*7 .0195 30.1* 19.37 1*8 .0200 31.0 19 .75 1*8.9205 31.6 20.13 1*9.9210 32.0 20.38 50 .5215 32.6 20.76 51.1*220 3 3 .0 21.02 52 .1225 33.1* 21.27 52.7230 •33.9 21.59 5 3 .5235 3U.2 21.78 51* .02h0 3l*.8 22.16 51*. 92h5 35 .3 22. 1*8 55.8250 3 5 .8 22.75 56 . 1*255 36.2 23.01 5 7 .0

Table hs> continuedTime A$i Vole of Ngf mlo £ H2 ofmine mm* Fi & Theory
260 36=5 23=20 57=52?0 37=6 23=89 59=2275 37 = 8 24=02 59=5280 38=1 24=21 60=0285- 38=5 24=47 60=6290 38=8 24=66 61=1300 39=5 25=10 62=2310 40=2 25=54 63=3320 41.0 26=05 64=6330 41.5 26=37 65=43U0 42=1 26=75 66=3350 42=7 27=13 67=2370 687=6 0=6338 43=7 27=66 68,61U69 692 ol 0=6390 56=7 36=72 91=02125 69U=9 0*6422 56=14 37=03 91 = 8
Guggenheim Rate Plot Data Vole of Ng Log of V s (v* - v) (v8 - v)

m
constant, a 8ii#:lif:ied equation may be used; •; \ / Vs r % x Fo " ' ' : / v: A ;; (11)
where Py is the correction factor , --v ■ . , v..'. ;
: ' 760 313 ■where APQ is the initial,;atmospheric' pressure When the , pressure changes' a new correction factor is needed„ so that
Vs =((% + AQQ.5) Fi] -Vo ): ' (13)where , • ' - ':■ ■: (14)V0 gives the volume' olv:gascontained in the reaction vessel, corrected to standard■ conditions „ Fn. is the new correction
- , . ■1 ■ ; ' ; ■ ;' '■ 1, ,, v/'. M . ... . , - ■ ■ : ; ; ■
factor involving- the new atmospheric pressure, AP.t „. •, : ‘ Pt = Afa - 135.3, x 2ti ) ' ' ; , -J,■ ;; ./VM , ,, '313; ' , (
Some combihatipn of equations ,(11) through (15 ) - was applied to each volume reading obtained« Table 4 cpntains the results of these calculations„ as'well as the values for the,Guggenheim ;first; order: rate plot (8 ) „ 1 ; ! The rate constant is obtained from the slope of theline resulting from the Guggenheim rate plot„ Such a plot is shown in Figure 9. The actual value of the slope was calculated by the method of least squares (9)» and the rate constant is given by the negative slope: . ' ; -
• ■ ..In these plots, the slope was always negative, so

Log
(v1
- v)
38
Expt # 15 p-Toluenediazonlxm Hydrogen S u lfa te in Ethanol w ith H2S% (0 ,216 M) a t U0°.
Guggenheim Rate"^Plot, A t * 190 min.
1.22
0.98800 160
Time in Minutes F ig . 9

that a positive rate constant always resulted„

40
CONCLUSIONSThe findings which Kelley reported (7) concerning
the kinetics of the decomposition of p-toluenediazonium hydrogen sulfate in ethanol have been investigated in a manner which makes it possible to state quantitatively how the acid concentration affects the kinetics of the particular reaction. This effect has not been observed for reactions of other types of diazonium salts, but since the reactions of so few different diazonium salts have been followed kinetically in alcohols, the effect of acid on the rate and products may be more general than has hitherto been supposed. Assuming the same reaction sequence occurs regardless of the type of salt used, the position of the equilibrium in the step
Ar-N$ + EtOH v Ar-N=N-QET + H+ would govern the kinetics and products found experimentally. Further investigation, particularly of other diazonium cations with the two anions chloride and hydrogen sulfate, is necessary before any conclusions can be drawn concerning this point.
Under ordinary conditions any rate constant measured is a combination of the individual constants for the rate controlling steps in each of the parallel reactions. As a result of these experiments it has been possible to estimate rate constants for each of these steps for p-toluenediazonium
41
hydrogen sulfate in absolute ethanol.It is interesting to note that this is the first
time a theoretical rate equation has been developed for the reaction of diazonium salts which makes use of so few basic assumptions and which fits experimental data so well. Since part of the deviation between experimental and theoretical results obtained from the derived equation is thought to be caused by the neglect of any further ionization of bisulfate, it would, be of interest to measure the actual ionization constant for the bisulfate ion in absolute ethanol and incorporate the proper correction in the derived equations. This should eliminate much of the deviation occuring
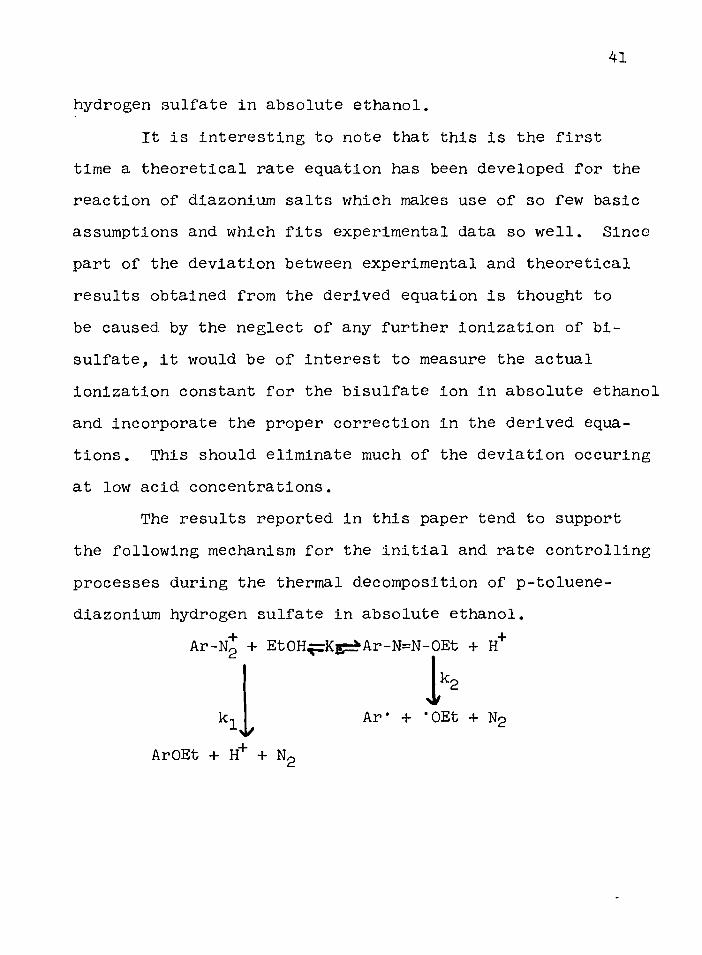
at low acid concentrations.The results reported in this paper tend to support
the following mechanism for the initial and rate controlling processes during the thermal decomposition of p-toluene- diazonium hydrogen sulfate in absolute ethanol.
Ar-Ng + EtOH^=Kff^Ar-N=N-OEt + H+
klArOEt + H+ + N2
A r e + * OEt + Ng

42
V - ;v' : ■ ;■ , ' : . .1. ' N. Kornblum, G„ Cooper and J 0 Taylor; J* Am, Chem, Soc«
■ • j 2; 3030(1950). ; ■ -2. No Kornblurn, A. Kelley, and G. • Cooper; J„ Am. Chem.- : . Soc., 7i, 3074 ;,(1952).'V V > ■ ;■ 3. R. Hulsgen and H.; Ifekabent > Ann., 573, l8l (1951).4. DeLos E. DeTar and M. N. Turetzky; J. Am. Chem. SocV,.
I & 3928 (1956). ; , , ; •5. DeLos P. DeTar a.nd M. N....Turefcaky;. J. Am. Chem. Soc.,
" • 77, 1745 (i955)o V';.';;-- :v; ;:V ''6. DeLos. Fo DeTar and M„ N. Turetzky; J. Am. Chem. Soc., .
;-.^v 3 , 3 9 2 5 X1956);.:,;, / , •7. Alec E. Kelley, PhD Thesla^Rurdue; . ;8 . "-S-iiriA'«■■■'■ Cu.ggenheim; Rhl 1. Mag., 2, 538 (1926). :9.' T. R. Grumpier and J„ H. Yoe: , 1'Chemical Compubatldnb
and Errors'1, John Ml ley and .Sons, Inc., New York,v ' ; - ' ' 7 ' - 210. -L. F. Fieser: "Experiments In' Organic Chemistry";
3rd ed., D. C. Heath and Co., Boston, Mass., 1955,p. 286. - V:;: \ : ■
11. A. Chretien and Y. Long!; Compt. rend., 220, 746 ,■ (1945)1 also see N. Kornbdim, B:.' Taub, and H. Ungnade
3 d. Am. Chem..'Sdch^ 3211. (1954). ...*12. E. Knoevenage1° Ber., 28, 2049 (l895)r also see ref. 1,
' P. 3019. . . ; 7