The Rapidly Evolving Science of Coastal Blue Carbon · 2012-06-22 · The Rapidly Evolving Science...
21
The Rapidly Evolving Science of Coastal Blue Carbon: What’s Known and What Do We Want to Know Stephen Crooks Ph.D. ESA PWA Blue Carbon, Green Opportunities Society of Wetlands Scientists / INTECOL June 6 th 2012, Orlando, Florida
Transcript of The Rapidly Evolving Science of Coastal Blue Carbon · 2012-06-22 · The Rapidly Evolving Science...

The Rapidly Evolving Science of Coastal
Blue Carbon:
What’s Known and What Do We Want to
Know
Stephen Crooks Ph.D.
ESA PWA
Blue Carbon, Green Opportunities
Society of Wetlands Scientists / INTECOL
June 6th 2012, Orlando, Florida

Ecosystems in focus for climate change mitigation
2
Mangroves Tidal Marshes Seagrass
Peatland Forest

Blue Carbon: Emissions, Economics and Policy
http://estuaries.org/climate-change.html
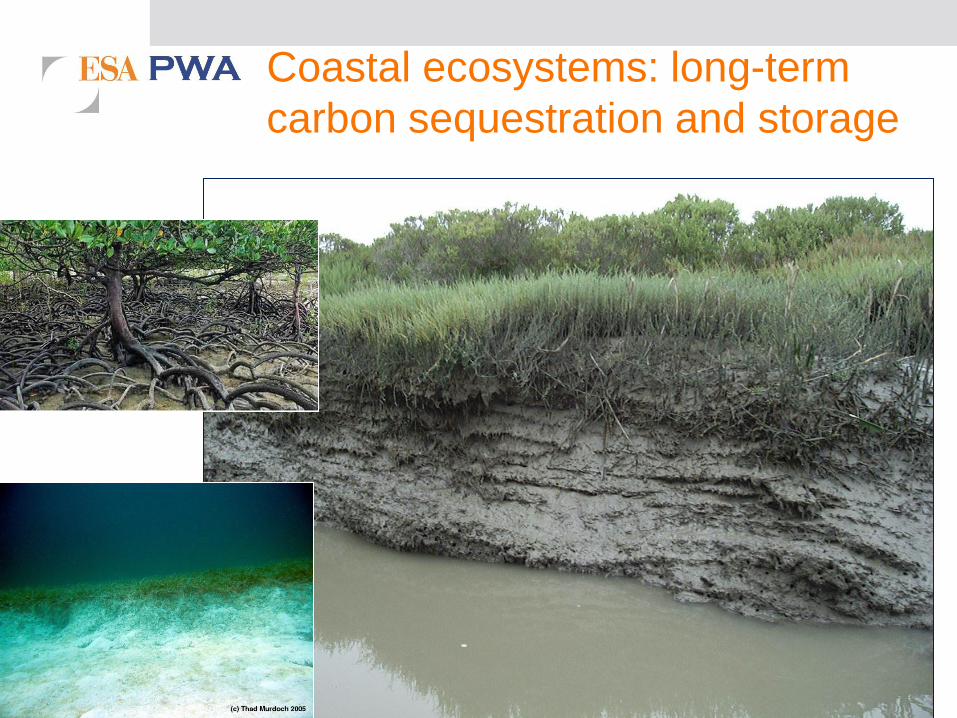
Coastal ecosystems: long-term
carbon sequestration and storage
5
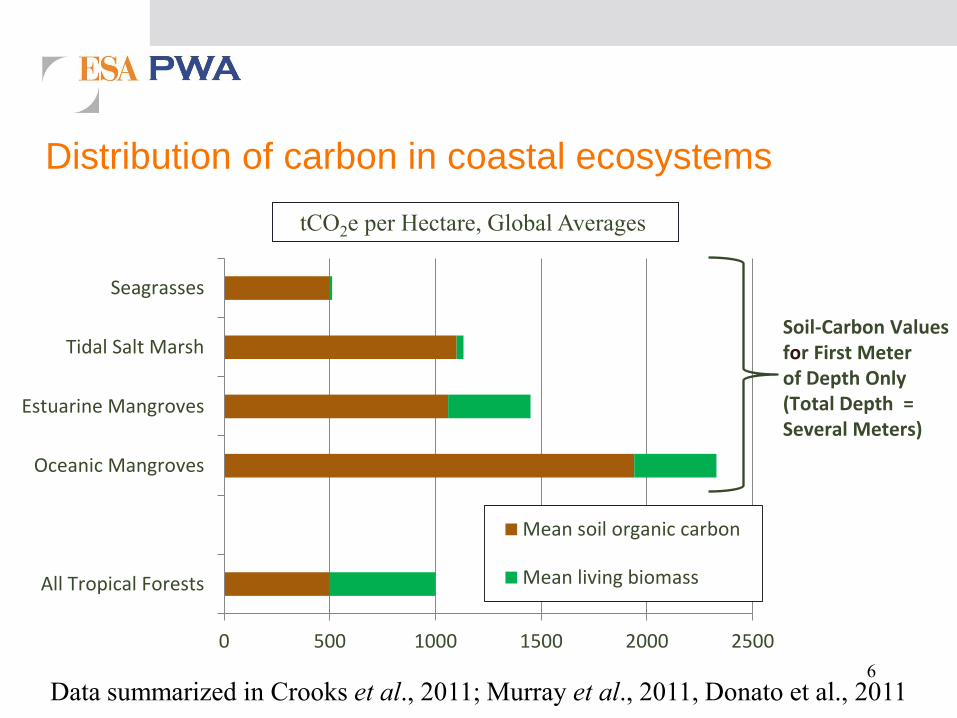
Distribution of carbon in coastal ecosystems
6
0 500 1000 1500 2000 2500
All Tropical Forests
Oceanic Mangroves
Estuarine Mangroves
Tidal Salt Marsh
Seagrasses
Mean soil organic carbon
Mean living biomass
Soil-Carbon Values for First Meter of Depth Only (Total Depth = Several Meters)
tCO2e per Hectare, Global Averages
Data summarized in Crooks et al., 2011; Murray et al., 2011, Donato et al., 2011

Photo by Cath Lovelock

Rates of Wetland Loss
Ecosystem Global
Extent
(km2)
Annual Rate
Of Loss (%)
Total Stock
(top meter)
Pg C
Reference
(stock estimates)
Tidal Marsh
400,000? 1 - 2 ?
Mangrove
160,000 1 - 2 14.7 - 73.0
Donato et al
2011
Seagrass 300-
600,000? 1 - 2 15.4 - 30.8
Fourqurean et
al. 2012
Estimate of global emissions 0.15 – 1.0 Pg CO2 / yr (Pentleton et al. in press)

9
405 km of levees
870 km2 of drained wetlands
C deposition >99% decrease
Release of historic carbon Andrews et al., 2000, 2006
The Humber Estuary
Extensive diked wetlands
Post industrial estuary
Agricultural run-off
Pre-Mediaeval
Now
Progressive change of our coastlines

Long-term release of carbon from organic soils
Sacramento - San Joaquin Delta

Emissions from One Drained Wetland: Sacramento-San Joaquin Delta
Area under agriculture 180,000 ha
Rate of subsidence (in) 1 inch
5 million tCO2/yr released from Delta
1 GtCO2 release in c.150 years
4000 years of carbon emitted Equiv. carbon held in 25% of
California’s forests
Accommodation space: 3 billion m3
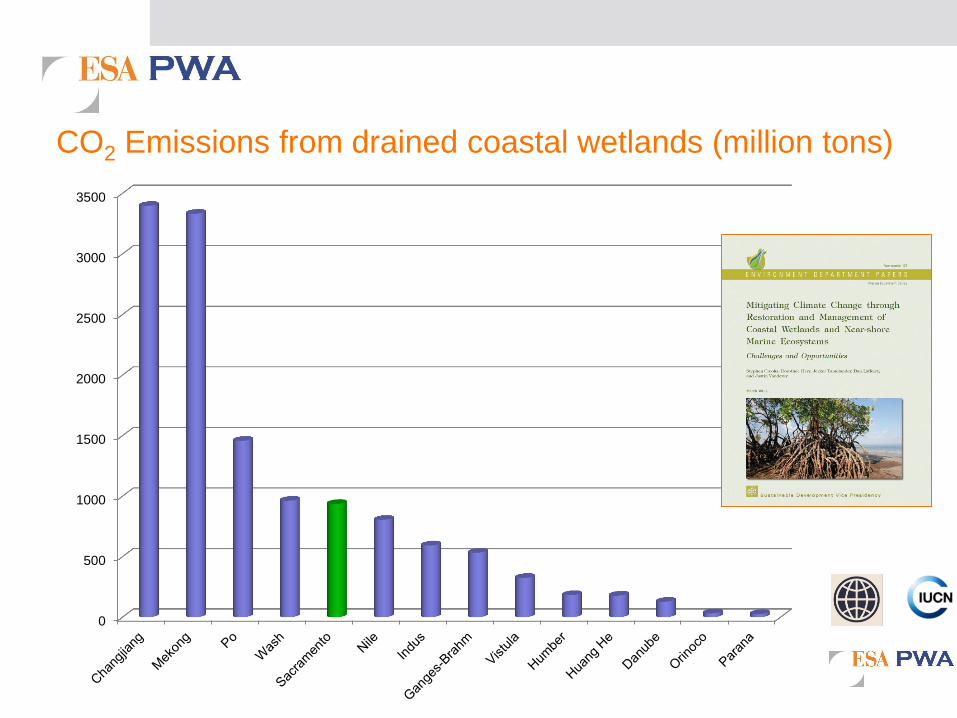
CO2 Emissions from drained coastal wetlands (million tons)
0
500
1000
1500
2000
2500
3000
3500

Emissions from drained wetlands organic soils
Ecosystem Modification CO2 efflux
t/ ha / a
Method Reference
Mangrove
(Belize)
Cleared 29 CO2 efflux Lovelock et al.
2011
Mangrove
(Honduras)
Forest damaged
by hurricane
15 Inferred from peat
collapse
Cahoon et al.
2003
Mangrove
(Australia)
Drained for
agriculture
32 Peat collapse and
CO2 efflux
Couwenburg et
al. 2010
FWT marsh
(California)
Drained for
agriculture
6-40 Peat collapse and
CO2 efflux
Rojstaczer &
Deverel 1993;
Deverel &
Leighton 2010;
Hatala et al. 2011
FWT marsh
(Po Delta)
Drained for
agriculture
92 ± 55 Peat collapse and
CO2 efflux
Camporese et al.
2008; Zanello et
al.2011

What about remaining wetlands?

Low Marsh Response to SLR for
Ranging Sediment Availability
SLR Scenario: NRC-III
Organic sedimentation rate: 1.0 mm/yr
SSC: 300 mg/L
(very high)
SSC: 150 mg/L
(high)
SSC: 50 mg/L (low)
Modeled with Marsh98

Stralsburg et al. 2011

Large-scale Emissions, or not? Wetland loss: 100 km2 /yr If top 50 cm erodes then 27.5TgCO2 Released in to circulation But what is its fate???
Information needs - quantification
CO2, CH4 and N2O fluxes in wetlands across salinity
gradients and under ranging conditions of nitrogen
loading.
GHG fluxes for undisturbed, converted and restoring
wetlands
Wetland carbon stocks - better global coverage
Fate of C & N released from eroding wetlands
Contribution of DOC to global warming

Information needs - models
GHG emissions / reductions with landscape change –
wetland migration, conversion.
Process-based models to understand science of C&N
cycling (e.g. DNDC)
Simplified monitoring approaches / indicators
Default factors of emissions and removals with activities.

Information needs - mapping
Intact and degraded salt marsh and seagrasses
Subclasses of coastal wetlands (can we connect to
cover to geomorphology and below ground processes?)
Drained wetlands, soil classification (C%)

Information needs - technology
Near surface atmospheric GHG monitoring
High resolution surface elevation mapping
Less costly monitoring equipment

22
Stephen Crooks
Director Climate Change Services
ESA PWA
+1 415 272 3916