The Randolph-Sheppard Business Enterprise Program ... · concluded that, when dark on dark...
15
The Randolph-Sheppard Business Enterprise Program: Illumination and Color Contrast Monograph 3: Studies of the Randolph-Sheppard Program John H. Maxson, M.S., Project Director Robert C. Staats, Jr., B.S., Graduate Assistant Susan Smith, M.S., Graduate Assistant Mississippi State University Rehabilitation Research and Training Center on Blindness and Low Vision P.O. Drawer 6189, Mississippi State, MS 39762 March, 1992
Transcript of The Randolph-Sheppard Business Enterprise Program ... · concluded that, when dark on dark...

The Randolph-Sheppard Business Enterprise Program:
Illumination and Color Contrast
Monograph 3: Studies of the Randolph-Sheppard Program
John H. Maxson, M.S., Project Director
Robert C. Staats, Jr., B.S., Graduate Assistant
Susan Smith, M.S., Graduate Assistant
Mississippi State University
Rehabilitation Research and Training Center
on Blindness and Low Vision
P.O. Drawer 6189, Mississippi State, MS 39762
March, 1992

Copyright © 1992
All Rights Reserved
Mississippi State University
Rehabilitation Research and Training Center
on Blindness and Low Vision
P.O. Drawer 6189, Mississippi State, MS 39762
Development of this document was supported by the Rehabilitation Research and Training
Center Grant G0086C3502 from the National Institute on Disability and Rehabilitation
Research, Department of Education, Washington, D.C. Opinions expressed in this document
are not necessarily those of the granting agency.
Mississippi State University does not discriminate on the basis of race, color, religion, marital
status, national origin, sex, age, handicap, or veteran status.

1
THE RANDOLPH-SHEPPARD BUSINESS ENTERPRISE PROGRAM:
ILLUMINATION AND COLOR CONTRAST
John H. Maxson, M.S., Robert C. Staats, Jr., B.S., & Susan Smith, M.S.
Rehabilitation Research and Training Center on Blindness and Low Vision
Mississippi State University
ABSTRACT: In this study, researchers sought to determine whether or not snack bars operating under
the Randolph-Sheppard Business Enterprise Program meet recommended illumination standards and use
color schemes to achieve proper mood and maximum production when applicable. The demonstrated
impact of color and illumination on perception, mood, emotion, appetite, and customer satisfaction in
dining facilities strongly suggests that these factors should be considered in the design of BEP facilities.
Through measurement and observation, the researchers sought to establish lighting and color guidelines
for BEP dining facilities.
Fifty-one snack bars operated under the Randolph-Sheppard BEP were visited in the states of Alabama,
Arkansas, Mississippi, and Tennessee. Segments of the Work Environment Visual Demands Protocol
which measure light and color where used to secure measurements in food service areas, food preparation
areas, dining areas, operator work areas, and storage areas. Only dining and storage areas were found to
meet or surpass recommended illumination levels. None of the snack bars surveyed used the
recommended colors in their dining areas.
Results of this study suggest that a review and possible improvement of light and color in existing
facilities might enhance sales and profits for blind entrepreneurs. If an appropriation of funds for
remodeling and renovating existing facilities is sought, lighting and color considerations could be
included. State Licensing Agency personnel can include understandings regarding lighting and color in
proposed facilities under negotiation. Information regarding the use of light and color shared with the
Elected Committee of Vendors could ensure their understanding of its importance in optimizing sales and
profit.
INTRODUCTION
The purpose of this study was to determine if
the existing illumination levels in snack bars
operating under the Randolph-Sheppard Business
Enterprise Program (BEP) meet recommended
lighting standards (Illumination Engineering
Society of North America, 1981) and if these dining
facilities utilize color schemes suggested by
researchers in psychology and/or the food service
industry to achieve proper mood and maximum
production when applicable.
The passage of the Randolph-Sheppard Act in
June, 1936 (P.L. 74-732) and its subsequent
amendments was designed to provide business
opportunities for blind and visually impaired
Americans. The 1936 Act and its amendments
delineated a Vending Facility Program (now
commonly referred to as the Business Enterprise
Program) which provided a priority for persons who
are legally blind in the establishment of businesses
in federal property locations. Today many states
have locations in state, local, and private facilities in
addition to the federal sites. Most of the state-
federal rehabilitation agencies which serve persons
who are blind or visually impaired administer a
Randolph-Sheppard Business Enterprise Program.
There are more than 3,200 sites located in local,
county, state, and private facilities.
The program has provided employment for
more than 20,000 individuals with visual
impairments. The Business Enterprise Program
ranks among the 50 largest food corporations in

2
America (Rehabilitation Services Administration,
1988).
Administration of the BEP in each state is
located in the state-federal rehabilitation agency,
which is designated as the State Licensing Agency
(SLA). The state may, under contract, designate a
nominee organization to provide daily supervision,
although the responsibility for the program
operation remains with the SLA. As established by
the 1974 amendments to the Randolph-Sheppard
Act, an elected Committee of Vendors (operators)
advises the SLA on program operations including
promotion, assignment of locations, training, and
various other program operations (Weston & Spann,
1985).
In most states a BEP director, who is
responsible to the SLA director, and a staff of BEP
counselors (job titles vary by state) work directly
with blind and visually impaired business operators
in the daily operation of the program. The BEP
staff have on-going contact with the business
operators and provide technical assistance and
consultation, provide training, develop and
implement new business locations, and coordinate
financial reporting.
Since its passage, the Randolph-Sheppard
program has operated without a program
appropriation from the federal government. Funds
for program operations in most states are derived
from a portion of the federal vocational
rehabilitation funds (section 110 funds), from a
"set-aside" fund levied against the net profits of the
individual business operators, or from a
combination of funds from these and other sources.
Therefore, there is a historic paucity of funds
available for the establishment of new BEP
facilities, purchase of new equipment, repair and/or
replacement of existing equipment, and for
remodeling of existing business locations.
Review of the Literature
Most patrons and employees of food
establishments rarely give consideration to the
lighting levels and color configurations of the
establishment. Often designers have spent a great
deal of time and effort through research and
planning to ensure that the lighting and color of
food areas elicit the proper mood and arouse the
appetite.
Although there has been no agreement as to
whether a great deal of light, a moderate amount of
light, or minimal light is preferred, there are ample
data to support all three arguments. As early as the
1920's and 30's, studies conducted at the Hawthorne
Works of Western Electric Company concluded that
as illumination levels approach natural illumination
levels people are more positively stimulated,
resulting in an elevation in mood and greater
productivity (Roethlisberger & Dickson, 1947).
Similarly, Hughes & McNelis (1978) concluded
that among normally sighted clerical workers,
increased illumination levels resulted in greater
productivity as well as higher acceptability ratings,
especially by older workers. Boyce (1973)
observed that older workers are notably more
vulnerable to imperfections in lighting conditions,
such as glare. According to Miles, Cook, Huertas,
and Lyon (1984), in studies including visually
impaired people, most fully and partially sighted
people benefit from increased illumination levels.
Given that the average age of the American
worker is increasing and older workers are shown
statistically to be inclined toward some degree of
visual impairment (Sekuler, Kline, & Dismukes,
1982), observations concerning older workers take
on greater significance. The possible ramifications
of proper illumination levels in the work
environment warrant further study. In the present
study of illumination and color contrast at Business
Enterprise Program locations, the mean age of the
BEP operators was 47.6 years.
A related psychological malady which is
drawing interest from researchers is Seasonal
Affective Disorder (SAD), which is directly related
to the amount of light in a person's environment.
Studies conducted recently on low or shortened

3
periods of daylight or artificial daylight support
theories that the length and level of light in the
environment can lead to Seasonal Affective
Disorder in some persons, as indicated by
symptoms of depression, decreased energy,
hypersomnia, increased appetite, and carbohydrate
cravings (Lam, Buchanan, & Remick, 1989). These
symptoms usually become evident during the winter
and go into remission during the summer.
According to Winton, Corn, Huson, & Franey
(1989), McIntyre, Armstrong, Norman, & Burrows,
(1989), and Lam (1989), SAD symptoms are
reduced significantly by exposing individuals to
increased levels of artificial daylight for as little as
two hours per day. The research concludes that
providing proper levels of full spectrum lighting (or
artificial daylight) in the work environment can
minimize the likelihood of employees developing
SAD.
Generally, an esthetics approach has dominated
the application of color by architects and interior
designers (Biren, 1972a). According to Mahnke &
Mahnke (1987), appetite depends on the sense of
sight just as greatly as it does on smell. In their
psychological studies on sensory perception, which
included the effects of color on appetite, they
concluded that warm reds such as flamingo and
coral, certain oranges such as peach and pumpkin,
warm and light yellows, and clear greens are true
appetite stimulating colors (see Color Plate 1).
Negative enhancement colors are also shown on
Color Plate 1.
Studies into the effects of white and gray in the
environment yield some interesting results.
According to Mahnke & Mahnke (1987), white
colors create a sterile environment and thus cause
the restaurant patron to be uncomfortable during the
dining experience. They offer an example of a new
restaurant where the walls were light gray accented
with shades of bluish-gray and the tablecloths and
upholstery were snow white; the customers felt cold
and unstimulated and the business failed. The gray
made the meats appear gray, dark, and
unappetizing.
Biren (1979) proposed that white is emotionally
negative and rates last or near-last in any color
preference test. In an early article (1972a) he
postulates that, at high levels of illumination,
trendy/modern walls that lack color other than white
may actually cause eye damage. White glare
(caused by the reflection of bright light off of white
walls and ceilings) can provoke a form of artificial
snow blindness.
Biren (1972b) also reports that exposing an
organism to a monotonous sensory environment can
cause disorganization of brain function similar to,
and in some respects as great as, that produced by
drugs or lesions. Additionally, Gregory (cited in
Biren, 1972b) states that in the absence of sensory
stimulation the brain can produce fantasies which
parallel hallucinations. Biren (1972b, 1982) reports
that when surrounded by blank walls, research
subjects have even been observed to emit behavior
similar to that of schizophrenics.
Other studies have shown how color in the
environment can have negative effects on people.
According to Goldstein (1942), words written in red
lettering perceptually indicate different sizes and
distances between letters than do other colors, such
as green. People who suffer from micropsia and
macropsia (visual distortions of shape and size),
while under conditions of either red lighting or red
print, reported more errors of judgement in size and
distance than did people suffering from the same
affliction under conditions of green lighting or
green print.
A report in the Los Angeles Times
demonstrated how improper color selection can
destroy one's appetite (Dreyfuss, cited in Allen,
1977). A meat market in Chicago which was
painted bright yellow lost business. The owner was
told that the yellow walls left a blue after-image,
causing the meats to appear purplish, old, and
spoiled. By repainting the walls bluish-green, a red
after-image was created which enhanced the color
of the meat. Sales increased. This after-image

4
phenomenon is due to iconic memory and should be
addressed when color schemes are designed.
In his studies of color contrast, Crouch (1967)
concluded that, when dark on dark relationships
exist which emit low reflectance as well as low
contrast, the relationship of dark colors elicits a
much higher level of illumination for the perception
of visual stimuli than a contrasting relationship such
as black words on a white background.
Providing lighting that is neither too bright nor
too dark is the first rule of good lighting ambience
in eating establishments, according to Mahnke and
Mahnke (1987). Bright lights do not elicit an
intimate setting; dim lights do not permit the
patron's appetite to be enhanced through visual
stimulation. Bright yellows, yellow-orange, yellow-
green, purple-violet, purplish-reds, gray tones, and
whites decrease appetite and should be avoided (see
Color Plate 1). Snack bars are not restaurants nor
cafeterias and may not necessarily follow the same
rules for lighting and color. They may be a bit
brighter, but should still follow the same color
schemes to enhance the working and dining
environment.
Given the impact of color and illumination on
perception, mood, emotion, appetite, and customer
satisfaction in dining facilities, BEP food facilities
should reflect consideration of these factors in their
designs. Through measurement and observation of
illumination levels and color schemes in BEP
facilities and by comparing these data against
lighting standards and suggested color
configurations, this study purports to establish
lighting and color standards which BEP operators
can use to enhance their dining facilities.
METHOD
Subjects
With the cooperation of the State Licensing
Agency BEP directors, staff, and the Elected
Committee of Vendors, site visits were made during
a four month period to snack bars operated under
the Randolph-Sheppard BEP. Sites visited were in
the states of Alabama, Arkansas, Mississippi, and
Tennessee. Fifty-one sites were visited;
participation in the research study by the operators
was voluntary. All of the dining facilities were
operated in either city/county, state, federal, or
private locations. Data from two sites was
unusable.
Instrument
The Work Environment Visual Demands
Protocol or WEVD (Graves, Maxson, & McCaa,
1987), an instrument designed to gather information
on the workplace, was adapted for use in this study.
Sections of the WEVD which measure light and
color were used to secure measurements in five
discrete areas: food service area, food preparation
area, dining area, operator work area, and storage
areas. The instrument was also adapted to gather
information about the blind business person and the
location of the snack bar enterprise.
Pilot Study
Prior to utilization of the instrument at the
locations selected, the modified WEVD protocol
was field tested at a snack bar location in Jackson,
Mississippi and the results were reviewed with the
business operator and the director of the BEP of
Mississippi Vocational Rehabilitation for the Blind.
The observations and recommendations of these
individuals resulted in some modification of the
instrument.
Data Analysis
The lighting data in this study are reported
under one of the five categories, food service area,
food preparation area, dining area, operator work
area, and storage area, for purposes of comparison.
Using SPSS-PC+, the data were tabulated in
frequency tables and means in an effort to
determine tendencies and describe composite
findings.
5
RESULTS
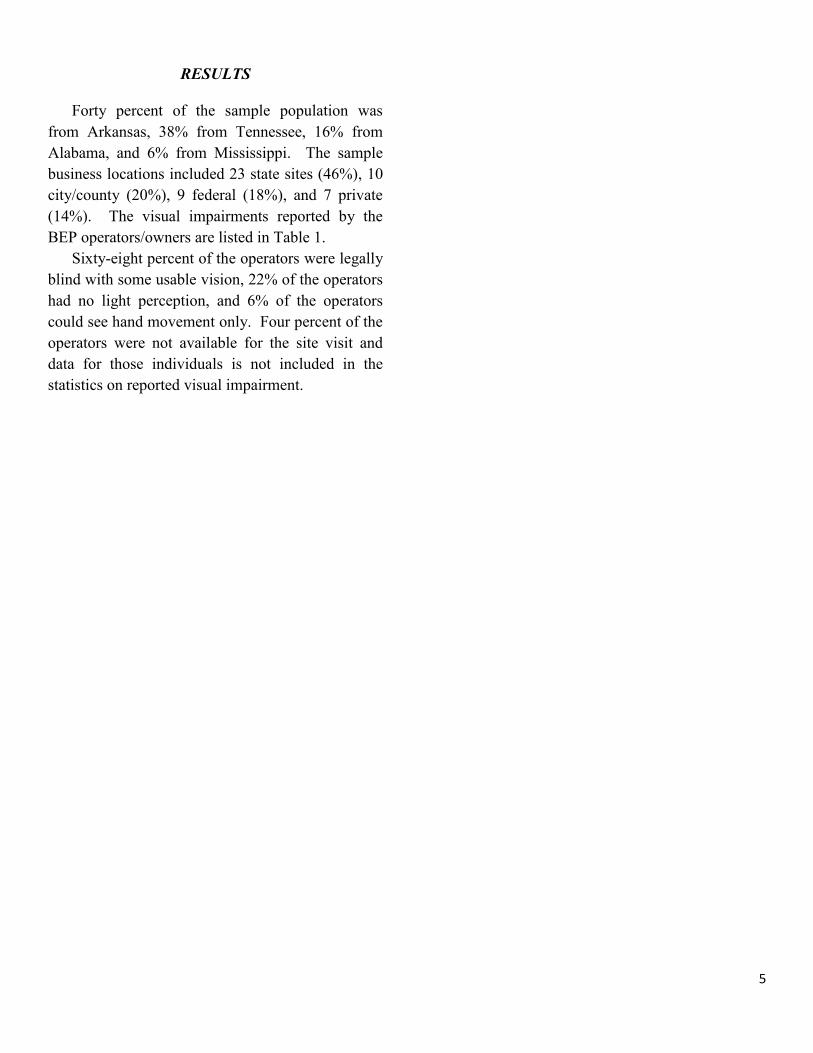
Forty percent of the sample population was
from Arkansas, 38% from Tennessee, 16% from
Alabama, and 6% from Mississippi. The sample
business locations included 23 state sites (46%), 10
city/county (20%), 9 federal (18%), and 7 private
(14%). The visual impairments reported by the
BEP operators/owners are listed in Table 1.
Sixty-eight percent of the operators were legally
blind with some usable vision, 22% of the operators
had no light perception, and 6% of the operators
could see hand movement only. Four percent of the
operators were not available for the site visit and
data for those individuals is not included in the
statistics on reported visual impairment.

6

7

8
9

10
Table 1 Visual impairments reported by BEP operators Percentage Visual impairment 16% Retinitis pigmentosa
16% Glaucoma
8% Unknown
6% Retinal detachment
6% Retrolental fibroplasia
6% Optic nerve problems
6% Nystagmus
4% Diabetic retinopathy
4% Macular degeneration (senile),
unspecified
4% Other dystrophies primarily
involving the sensory retina
4% Congenital cataract, unspecified
4% Artificial eyes
16% Other
The areas that were evaluated for illumination
and color in each snack bar were:
(1) Food Service Area: service line, counters,
machine banks;
(2) Dining Area: tables, chairs;
(3) Operator Work Area: cash register, separate
offices;
(4) Food Preparation Area: kitchen or food
preparation counter;
(5) Storage Area: A separate room or area from the
food service or preparation area, not including
under counter or cabinet storage.
Evaluation of Lighting in the Snack Bars
The percentages of sites that met the
recommended illumination levels in each area are
graphically represented in Figure 1.
Food service areas. As a group, the sites failed
to meet the recommended lighting standards by
28% (thus the areas were too dark). Individually,
10% met the recommended levels at city sites, 9%
at state, 14% at private, and none at federal sites.
Dining areas. As a group, the sites exceeded
the recommended lighting standards by 72% (thus
the areas were too bright). Individually, 60% met
the recommended levels at city sites, 91% at state,
89% at federal, and 100% at private sites.
Work areas. As a group, the sites failed to meet
the recommended lighting standards by only 6%
(thus the areas were close to the proper lighting
level). Individually, 70% met the recommended
levels at city sites, 65% at state, 78% at federal, and
71% at private sites.
Food preparation areas. As a group, the sites
failed to meet the recommended lighting standards
by 15% (thus the areas were a little on the dark
side). Individually, 10% met the recommended
levels at city sites, 13% at state, 11% at federal, and
none at private sites.
Storage areas. As a group, the sites exceeded
the recommended lighting standards by 10% (thus
the areas were a little on the bright side).
Individually, 50% met the recommended levels at
city sites, 57% at state, 56% at federal, and 43% at
private sites.
Group Means: Service=10, Dining=86, Work=70,
Preparation=10, Storage=50
0%
20%
40%
60%
80%
100%
120%
City/County State Federal Private
Figure 1: Percentage of Food
Ares that Recommend
Illumination Standards
Service Dining Work Preparation Storage

11
Color
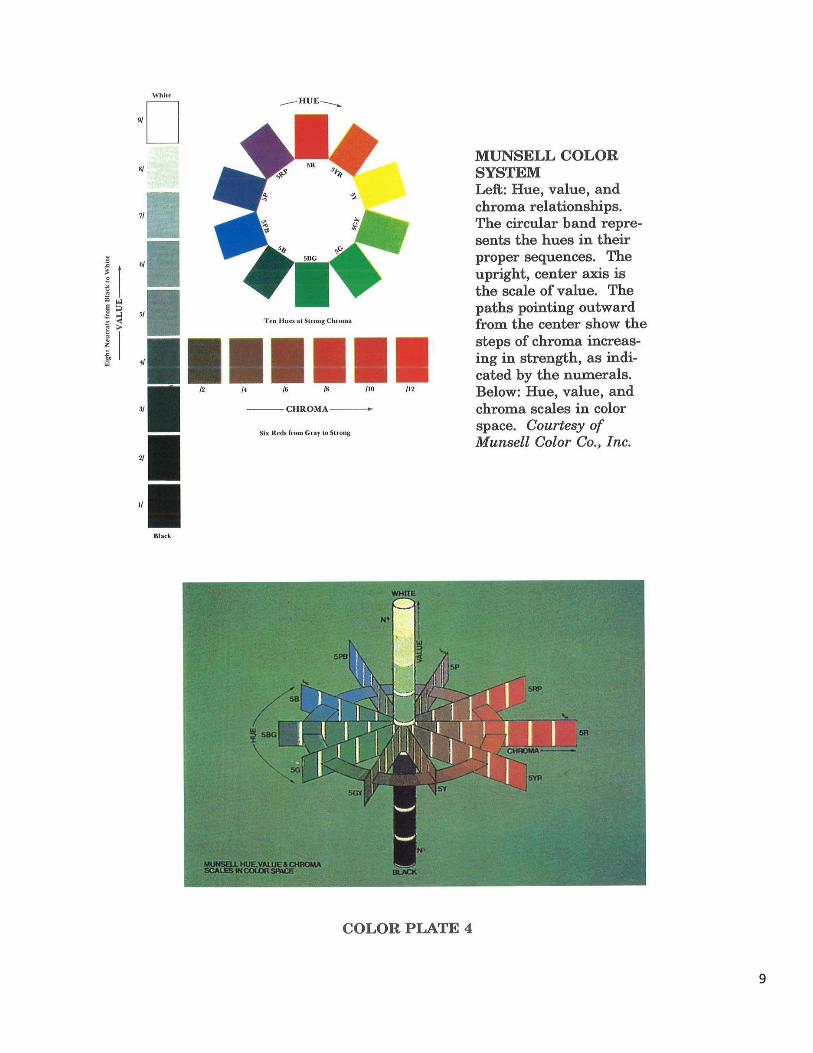
Because color is a three dimensional
phenomenon, Albert H. Munsell described color
through numbers for clarification and classification.
According to Allen (1977), the Munsell System of
Color Notation (1976) is a scientific concept of
describing color in terms of these dimensions: Hue,
value, and chroma (see Color Plate 4).
Munsell notations thus appear as "H v/c". Hue
is indicated by the capital letter(s), i.e., R = red and
YR = yellow-red. Hue is the circular band or color
wheel shown in Color Plate 4. Value is indicated
by increments of one along the central vertical axis,
where black is #1, gray is #5, and white is #9.
Chroma is indicated by the horizontal axis
extending away from the central axis and denotes
the degree of hue.
Frequencies and percentages of leading colors
found in existing BEP snack bar locations are listed
in Table 2. The leading colors are shown in Color
Plate 2. Colors recommended by Mahnke and
Mahnke (1987) to maintain or enhance mood and
appetite are shown in Color Plate 3 for comparison.
Conclusions
Lighting and color play an important role in
the dining environment. Too much or too little light
can affect the color perception of the patron.
Certain warm colors can enhance the mood and
appetite and certain bright colors can diminish the
mood and appetite. Combinations of bright light
and white colors can cause headaches and nausea
(Biren, 1979).
Of the five areas where light levels were
measured in BEP locations, only dining and storage
areas met or surpassed the recommended
illumination levels within the facilities. Because
customers most often select their food items in
serving lines in snack bars, the food service areas
should meet the lighting recommendations.
Improper lighting and color could very well affect
the quantity purchased by the snack bars' patrons.
In this survey, lighting in the dining areas was
Table 2
Leading colors found in snack bar locations*
_______________________________________
Munsell
Item Notation Frequency Percentage
Tables 5YR9/2 15 30%
N9.5/ 4 8%
Chairs 5YR4/2 10 20%
5B3/6 3 6%
Walls 5Y9/2 21 42%
5YR9/2 5 10%
N9/ 5 10%
Floors 5YR7/2 7 14%
5Y8/2 5 10%
5Y7/2 5 10%
Ceiling 5Y9/2 19 38%
N9.5/ 19 38%
N9/ 5 10%
Counters 5YR9/2 14 28%
N9.5/ 7 14%
_______________________________________
*Colors recommended that maintain or enhance
appetite: 5R7/8, 5YR7/8, 5Y9/4, 10GY9/2,
7.5R5/12, 5YR8/4, 5Y9/6, 10R8/4.
Wall colors recommended that maintain or enhance
mood and/or appetite: 5R7/8, 5YR7/8, 5YR8/6.
Accent colors recommended that maintain or
enhance mood and/or appetite: 7.5B6/6,
5BG7/4.
found to be quite bright. Given the choice of colors
provided for the operators, the blind business
men/women may find that customer purchases
could be affected. It should be noted that the bright
dining areas were, in several instances, the result of
large window areas which permitted natural light.
None of the snack bars surveyed met the

12
recommended colors for the dining area. This could
result in dissatisfied customers and a business with
lower profits. The lowered lighting in the work and
food preparation areas should be noted. As a result,
production may decrease, while the possibility of
injury increases with lower lighting levels in these
areas.
The survey did ask the blind business
men/women operating the snack bars if they would
change anything in their location should they have
the opportunity to do so. Ninety percent of the
respondents indicated that they did not perceive the
need to change anything in their existing location.
In one of the states surveyed, the SLA is proactive
in remodeling of existing locations and the results
of this program are dramatic because the BEP staff
and blind entrepreneurs work cooperatively.
As anticipated, the SLA and the blind business
men/women are seldom consulted prior to its
availability for bid on either the configuration of the
snack bar area or for recommendations regarding
color and illumination. Most often, the property
manager will designate a location and, in some
instances, delineate the color scheme and lighting.
This, of course, inhibits the considerations which
might be given by the BE Program staff and blind
entrepreneurs to issues of color and lighting.
Conflict between property managers and BEP
operators regarding constraints needs some
resolution or flexibility. Taking these constraints
into consideration, along with limited availability of
funds for program operations, considerations of
light and color in the BE Program are most
appropriate in remodeling and renovation of
existing facilities.
Recommendations
The results of this study suggest several
recommendations related to policy or development
of in-state programs.
(1) Review use of light and color in existing food
service locations. Improvement, if necessary,
could enhance sales and profits for blind
entrepreneurs.
(2) Consider consultation from the faculty of a
local university with a Department of
Architecture to review the utilization of light
and color in existing food service operations.
The SLA could also consider a review of
similar private food service operations in their
states which have demonstrated success to
determine the use of light and color in the
business.
(3) Consider seeking an appropriation of funds
for remodeling and renovation of existing
facilities, and in such renovations include light
and color upgrading as necessary.
(4) In negotiation for new locations, SLA
personnel should be sure to include
understandings regarding light and color in
the proposed facilities. Negotiation of these
issues with the building managers prior to
operation by the blind vendor could improve
the opportunity for profit.
(5) Share the information regarding use of light
and color with the Elected Committee of
Vendors to ensure their understanding of its
importance in optimizing sales and profit.
REFERENCES
Allen, P. (1977). Beginnings of interior
environment, (rev. ed.). Provo, UT: Brigham
University Press.
Biren, F. (1972a, September). Color and man-
made environments: Reactions of body and eye.
Journal of the American Institute of Architects,
pp. 35-39.
Biren, F. (1972b, October). Color and man-made
environments: Reactions of mind and emotion.
Journal of the American Institute of Architects,

13
pp. 37-40.
Biren, F. (1979, July). Human response to color
and light. Hospitals, pp. 93-96.
Biren, F. (1982). Light, color and environment
(rev. ed.). New York: Van Nostrand Reinhold
Co.
Boyce, P. R. (1973). Age, illuminance, visual
performance and preference. Lighting Research
and Technology, 5, 125-139.
Crouch, C. L. (1967). Veiling reflection studies
and their effect on school and office lighting
systems. Illumination Engineering, 62(6), 360-
364.
Goldstein, K. (1942). Some experimental
observations concerning the influence of colors
on the function of the organism. Occupational
Therapy and Rehabilitation, 21, 147-151.
Graves, W. H., Maxson, J. H., & McCaa, C. (1987).
Work environment visual demands protocol
(Final Report). Mississippi State: Mississippi
State University, Rehabilitation Research and
Training Center on Blindness and Low Vision.
Hughes, P. C., & McNelis, J. F. (1978). Lighting,
productivity, and the work environment.
Lighting Design and Application, 8(12), 32-40.
Illumination Engineering Society of North America.
(1981). IES lighting handbook: Reference
volume. New York: Author.
Lam, R. (1989). Light therapy for seasonal
bulimia. American Journal of Psychiatry, 146,
1640-1641.
Lam, R., Buchanan, A., & Remick, R. (1989).
Seasonal affective disorder: A Canadian sample.
Annals of Clinical Psychiatry, 1(4), 241-245.
Mahnke, F., & Mahnke, R. (1987). Color and light
in man-made environments. New York: Van
Nostrand Reinhold Co.
McIntyre, I., Armstrong, S., Norman, T., &
Burrows, G. (1989). Treatment of seasonal
affective disorder with light: Preliminary
Australian experience. Australian and New
Zealand Journal of Psychiatry, 23(3), 369-372.
Miles, S. M., Cook, D., Huertas, V., & Lyon, S.
(1984). Productivity and comfort of the visually
impaired worker as a function of low vision aid
usage and illumination/color contrast
modifications (Technical Report). Mississippi
State: Mississippi State University,
Rehabilitation Research and Training Center on
Blindness and Low Vision.
Munsell Book of Color. (1976). Baltimore, MD:
Munsell Color; Macbeth, A division of
Kollmorgen Corp.
Randolph-Sheppard Act of 1936, P.L. 74-732,
amended 1974 as P.L. 93-516 Sect. 202, 88 Stat.
1623, 20 U.S.C. Sect. 107(b) (1976).
Rehabilitation Services Administration. (1988).
Randolph-Sheppard Vending Facility Program:
Annual report, fiscal year 1987 (RSA-IM-88-
36). Washington, DC: U.S. Department of
Education, Office of Special Education and
Rehabilitation Services.
Roethlisberger, F., & Dickson, W. (1947).
Management and the worker. Cambridge, MA:
Harvard University Press.
Sekuler, R., Kline, D., & Dismukes, K. (Eds).
(1982). Aging and visual function of military
pilots: A review. Aviation, Space, and
Environmental Medicine, 53(8), 747-758.
Weston, E., & Spann, V. (1985). Understanding
the Randolph-Sheppard law (Grant No.
G038200016). Dunbar: West Virginia Research
and Training Center.
Winton, F., Corn, T., Huson, L., & Franey, C.
(1989). Effects of light treatment upon mood
and melatonin in patients with seasonal affective
disorder. Psychological Medicine, 19(3), 585-
590