The Ram Fund Presentation Spring, 2013 - NKD Group · The Ram Fund Presentation Spring, 2013 I....
73
The Ram Fund Presentation Spring, 2013 I. Introduction II. Performance III. Investment Approach IV. Companies Analyzed V. Portfolio Composition VI. Class Highlights VII. Questions From The Audience
Transcript of The Ram Fund Presentation Spring, 2013 - NKD Group · The Ram Fund Presentation Spring, 2013 I....

The Ram Fund Presentation Spring, 2013
I. Introduction II. Performance
III. Investment Approach
IV. Companies Analyzed
V. Portfolio Composition
VI. Class Highlights
VII. Questions From The Audience

Welcome As the faculty advisor for the Ram Fund (the University of Rhode Island’s Student-Managed Investment Fund), I get to have a number of great experiences each and every semester. First, I get to work with a class populated by our very best students. Second, I get to observe them make an incredible amount of progress in a relatively short time. They enter the class with excellent academic backgrounds but little or no practical experience: While they know the basics of security valuation from their previous classes, their exposure is limited to “book learning”, where all the examples and problems are neat, clear, and well-defined. However, by the end of a relatively short semester, they have learned not only that real-world financial data is complicated, ambiguous, and messy, but also how to organize and analyze these data and use them to value firms. They have also learned how to succinctly and clearly present their findings, and how to function in a team environment where they must both give and respond to peers’ criticism. Finally, because much of their analysis and questions take place outside of the regular one-hour class time, I get to spend a significant amount of time with these exceptional students outside the regular classroom at almost any hour of the day. The fund has had another very good semester and year. The fund hit a high-water mark of $223,000 at the end of March, and finished the semester at slightly over $216,000 - up 10.9% year to date, and 15.11% over the last 12 months (since 4/30/2011). Its performance shined, whether compared to the S&P 500, the S&P 400 or the S&P 600. The following pages present the results of their labors for the Spring, 2013 Ram Fund. I hope you find them and their work as impressive as I do. Peter J. DaDalt Ph.D Ram Fund Faculty Advisor The College of Business The University of Rhode Island Voice: 401.932.7004 Email: [email protected]

Ram Fund Management Team Name Sector Covered
Mark Albanese Consumer Staples
Michael Giancaspro Basic Materials
Stephen Gross Services
Park Guo Technology
Peter Hathaway Consumer Discretionary
John Kashmanian Industrials
Benjamin Kupa Healthcare
Jared Moreau Utilities
Bryan Poston Financial Services
Luis Rondon Energy

Ram Fund Portfolio Holdings
(All figures as of 4/19/2013)
Ticker Sector Shares Price Value
ARLP Alliance Resource Partners 75 66.01 4,950.75 AVGO Avago Technologies LTD 400 31.26 12,504.00 CHE Chemed Corp 150 78.70 11,805.00 CPK Chesapeake Utilities Corp 200 50.82 10,164.00 STZ Constellation Brands Inc 250 48.52 12,130.00 CLB Core Laboratories NV 100 139.50 13,950.00 XRAY Dentsply International 225 41.56 9,351.00 DSX Diana Shipping Inc. 600 9.34 5,604.00 HLF Herbalife Ltd. 250 35.78 8,945.00 IJJ iShares S&P Midcap Value Index Fund 150 97.39 14,608.50 IJS iShares S&PSmallcap Value Index Fund 150 78.93 11,839.50 IPGP IGP Photonics Corp.* 200 62.29 12,458.00 KEYN Keynote Systems Inc 500 11.08 5,540.00 PEZ Powershares Dynamic Cons. Discr ETF 350 32.86 11,501.00 PWR Quanta Services LTD. 100 27.31 2,731.00 RS Reliance Steel and Aluminum Corp* 200 65.69 13,138.00 SWX Southwest Gas Corp 250 49.47 12,367.50 UAL United Continental Holdings 400 30.60 12,240.00 URS URS Corp 200 44.90 8,980.00 WPP Wasau Paper Corp. 800 10.19 8,152.00
Cash 11,909.99 Total 216,061.74 Change last presentation (11/30/2012) 23,311.15

4/21/2013
1
Spring, 2013
• Mark Albanesea ba ese• Michael Giancaspro• Stephen Gross• Park Guo• Peter Hathaway• John Kashmanian• Benjamin Kupa• Jared Moreau• Bryan Poston• Luis Rondon
4/21/2013
2
Performance Analysis
Since 4/30/2012Analysis
Return Sharpe Ratio
Ram Fund Portfolio 15.11% 24.38%
S&P 500 11.03% 16.17%
S&P 400 Mid Cap 10.55% 13.51%
S&P 600 Small Cap 11.17% 15.40%
End of Fall, 2012 4/19/2013
Portfolio Beta 1.15 1.11
Fundamental Analysis
Economic Analysis
Sector Analysis
Industry Analysis
Discounted Cash Flow Analysisy
Sensitivity Analysis
Buy/Sell Recommendations

4/21/2013
3
Ratio Analysis Ratio Analysis
Valuation and Profitability
Competitive Environment
Porter’s 5 Forces
Major risk and profitability drivers
Profitability & Relative Valuation
Discounted Cash Flow Analysis
Sensitivity Analysis

4/21/2013
4
S&P’s Research Insight
Multiples
Fi i l R ti Financial Ratios

4/21/2013
5

4/21/2013
6
Household Applience
Construction & Farm Equip. Industrials
Consumer Goods
AGCOCO.
iRobots Corp.
Staples:
Processed & pkg. Omega Protein
Corp
Electronic Equipment,
Instruments, & Components
IPG Photonics Corporation
Technology
SectorCompany Selection
IndustrySector
Company SelectionIndustry
Economy
GoodsCorp.
Bio TechUnited
TherapeuticsHealthcare
Education &
Basic MaterialsPaper & Paper
Products Orient Paper Inc.
ServicesEducation & Training
DeVry Inc.
EnergyOil & Gas Drilling
Rowan Companies Plc.
Financial Services
Specialized Finance KKR Financials
UtilitiesAtmos Energy
Corp Gas Utilities
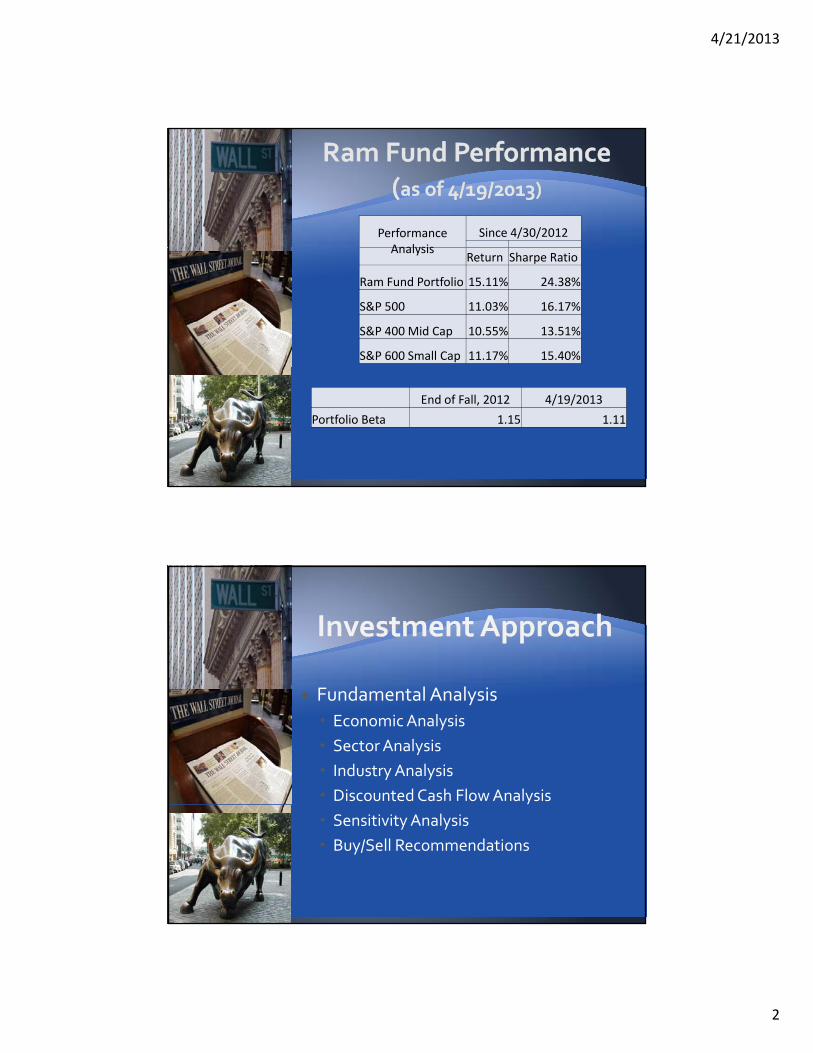
Target Price: $59.69
Manufacture and distribute variety of agricultural products
and replacement parts worldwide
Offer a comprehensive line of tractors, combines, sprayers,
implements and hay toolsimplements and hay tools
Strong global presence with factories around the world and
2,600 independent dealers and distributors in 140
countries

4/21/2013
7
Market to Book: 1.536ROI: 13 135
2012 Revenue: $9962 million
+13 5%ROI: 13.135Beta: 2.16
+13.5%
2012 Net Income: $600 million
+11.1%
T t P i $ 8 Target Price: $49.82
Segments: Natural Gas Distribution, Regulated
Transmission & Storage, Non‐regulated
Nation’s largest natural gas provider
h l b d h f d Geographical breadth of operations provides
diversity

4/21/2013
8
Price to Book: 1.60ROI: 4 38%
2012 Revenue: $2114 million
2012 Net Income: $217 millionROI: 4.38%Beta: .5
2012 Net Income: $217 million
Annual Dividend Yield: 3.4%
For‐Profit College Of Secondary Education And o o t Co egeO Seco da y ducat o dTraining Medical/Healthcare/Health Sciences Business/Management Engineering Accounting and Finance Training
8 % G th R t F Th N t Y 8.95% Growth Rate For The Next 5 Years
Risks: Regulations

4/21/2013
9
Key Statistics Price (11/26/2012) – 32 81
Recent Acquisitions
ATC International (2011) Price (11/26/2012) – 32.81
Market Cap – 2.07B
52 Week Range – 18.15 – 3.32
EPS (ttm) – 2.39
Beta – 1.6
Multiples
ATC International (2011) A Subsidiary Of Becker
Professional Education
Professional Finance And Accounting Training
American University Of The Caribbean (2011)
d l h lMultiples P/E = 13.73 P/B = 1.47 P/S = 1.01
Medical School
Devry Brasil (2009) & Fanor Expanding Business

4/21/2013
10
Global manufacturer of fiber lasers, fiber amplifiers, and d d ldiode lasers Cheaper, smaller, more powerful, more efficient Fully vertically integrated
Highest quarterly revenue growth amongst direct
competitors (17.4%)
Highest ROE & ROA in industry (small/mid‐cap)g y ( / p)
Highest gross margin amongst competitors
#2 in Boston Globe 100 in 2012
2012 Net Income: $147.7 million 22% Growth
2011 R&D: $31.4 million 33% of op. exp.
ROE: IPGP: 23.97% Industry: 6.05%
EPS (ttm): IPGP: $2.81 Industry: $0.05
Op. Margin: IPGP: 37% Industry: 7%

4/21/2013
11
Target Price $24 47 Current Price $24 31Target Price $24.47 ‐Current Price $24.31
Recommendation: Strong Hold
Company & Industry Information
iRobot is in the Household Appliance industry and builds advanced robots.
Contract products: Used by Military and police for bomb detection and donationUsed by Military and police for bomb detection and donation.
Household products:Robotic household cleaning devices, such as vacuums, floor cleaners, etc. Recently iRobot has moved into the medical robotics field.

4/21/2013
12
IRBT• Gross Margin: 40%• P/S: 1.56• Beta: 1.38• ROA: 5.02%• ROE: 6.07%• ROI: 6.53%
Industry • Gross Margin: 20%• P/S: 1.24• Beta: 1.05• ROA: 2.58%• ROE: 4.36%• ROI: 3.48%
• iRobot has been working to change its business focus recently, moving from primarily government contract revenue to consumer products.
The chart above compares iRobot Corporation to the S&P 500 and the Appliance Companies over the past six months
H ld ti T t P i f $ Hold rating –Target Price of $7.72
Specialty finance company
Investment portfolio composed of high yield
securities and commercial real estate
Recent acquisition of Colonie Center, a 1.3 million
square foot regional mall

4/21/2013
13
Key Statistics
Price (04/19/2013) – $10.18
Market Cap 1 81B
P/E (ttm) ‐ 5.45
P/B ‐ .98 Market Cap – 1.81B
52 Week Range ‐ $7.95 ‐ 11.93
Beta – 1.12
/ 9 P/S = 3.6
EPS (ttm) – $1.87
Omega Protein is a vertically integrated producer of omega‐3 fish oil and specialty fish meal
d d i i l i di products, and nutritional ingredient company.
Fish oil is directly approved by the FDA as the only marine source of long‐chain Omega‐3’s.
Recent human nutrition acquisitions, which produce dietary & health supplements.

4/21/2013
14
Omega Protein
Valuation
Price to Book = .92
Price to Sales = .81
Profitability
Industry
Valuation
Price to Book = 1.39
Price to Sales = 1.09
Profitability
ROI = 1.6%
EBIT = 5.36%
NPM = 1.72%
ROI = 2.86%
EBIT = 7.69%
NPM = 6.93%

4/21/2013
15
Target price $41.20
Global Offshore Contract Drilling Company
L di i Hi h S ifi ti J k il Ri Leading in High‐Specification Jack‐up oil Rigs
Currently operates 31 rigs
Key Statistics Price (04/19/2013) – 31 24 Price (04/19/2013) – 31.24
Market Cap ‐ 3.88B
52 Week Range – 28.62‐39.40
EPS (ttm) – 1.46
Beta – 1.77
Debt to equity‐44.35
Multiples P/E = 21.44 P/B = 0.94 P/S = 2.79

4/21/2013
16
Recommendation: Hold
Address the unmet needs of patients with chronic
and life‐threatening conditions
Offers 3 products that treat pulmonary arterial Offers 3 products that treat pulmonary arterial
hypertension
Market Cap of 3.02B – Larger Biotech Firm
UTHR: Industry:
P/B: 2.76 16.2
P/E 10.55 86.30
Net Profit: 34.15% 10.10%
ROE: 14.73% 8.8%
Debt/Equity: 25.37 103.6

4/21/2013
17
35.00%
10.00%
15.00%
20.00%
25.00%
30.00%
Ram Fund
S&P 400
S&P 600
0.00%
5.00%
Real Estate
Consumer Defensive
Healthcare
Utilities
Communication Services
Energy
Industrials
Technology
Dow Jones US Total Market
Portfolio
0 5 10 15 20
Basic Materials
Consumer Cyclical
Financial Services

4/21/2013
18
Practical applications Practical applications
Access to large scale financial databases
Team orientationTeam orientation
Exposure to & preparation for the CFA exam
Stock: AGCO Corporation (AGCO) April 20, 2013 Spring 2013
______________________________________________________________________________ Analyst: John Kashmanian Page 1
AGCO Corporation (NYSE:AGCO)
Industrials: Construction and Farm Machinery www.agcocorp.com
Company Overview: AGCO was established in 1990 with the purchase of Deutz Allis Corporation from German-based Kloeckner-Humboldt-Deutz AG. Since then, AGCO has become a worldwide farm machinery company through market growth, strategic acquisitions and cutting edge agricultural solutions. They manufacture and distribute agricultural equipment and related replacement parts worldwide, and are currently the world’s largest manufacturer focused purely on agricultural equipment. AGCO offers a comprehensive line of tractors, combines, sprayers, implements and hay tools. They have a strong global presence with factories around the world and 2,600 independent dealers and distributors in 140 countries.
Recent Developments:
• December 18, 2012 – AGCO celebrates the production of its first Massey Ferguson tractor in North Africa, a significant step in the growth strategy for the African Continent.
• November 27, 2012 – AGCO launches AGCOMMAND®, a global mobile application designed for the increasing demands of farmers and the dealers that support them. The app focuses on
fleet management, vehicle health and overall machine uptime. • December 1, 2011 – AGCO announces that it has completed its acquisition of GSI Holdings Corp.
for $928 million. GSI is a leading global manufacturer of grain storage and protein production systems.
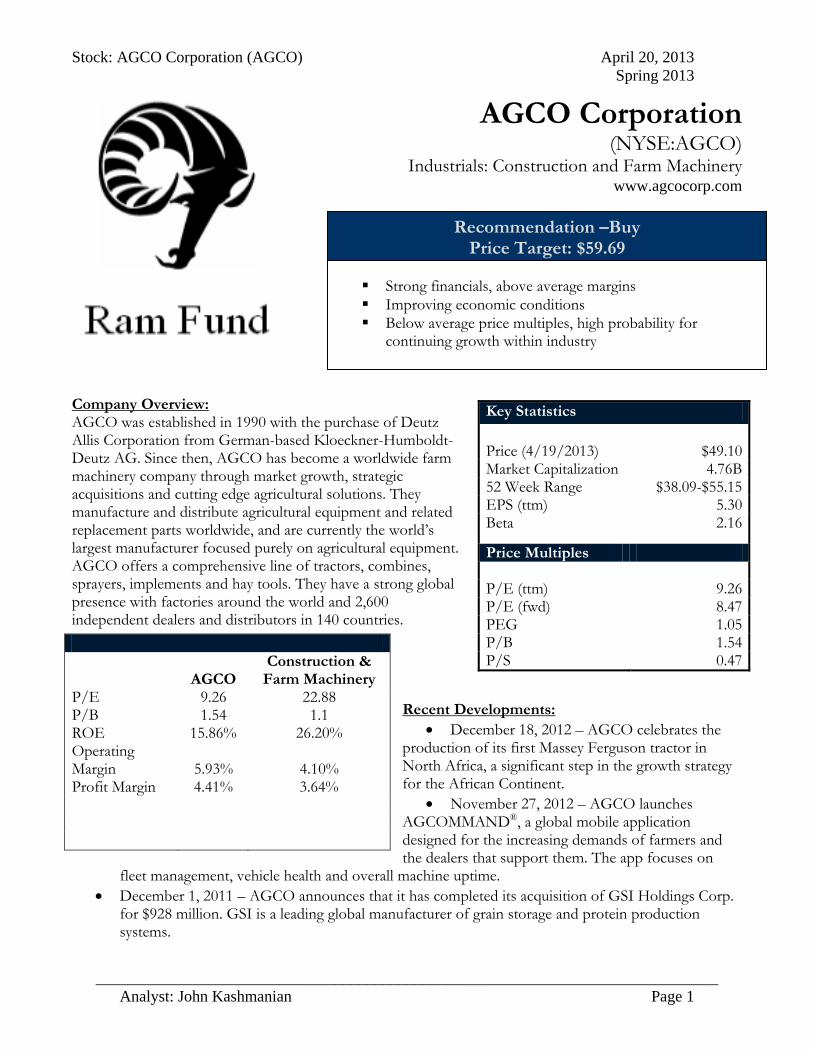
Key Statistics Price (4/19/2013) $49.10 Market Capitalization 4.76B 52 Week Range $38.09-$55.15 EPS (ttm) 5.30 Beta 2.16
Price Multiples P/E (ttm) 9.26 P/E (fwd) 8.47 PEG 1.05 P/B 1.54 P/S 0.47
AGCO
Construction & Farm Machinery
P/E 9.26 22.88 P/B 1.54 1.1 ROE 15.86% 26.20% Operating Margin Profit Margin
5.93%
4.41%
4.10%
3.64%
Recommendation –Buy Price Target: $59.69
Strong financials, above average margins Improving economic conditions Below average price multiples, high probability for
continuing growth within industry
Stock: AGCO Corporation (AGCO) April 20, 2013 Spring 2013
______________________________________________________________________________ Analyst: John Kashmanian Page 2
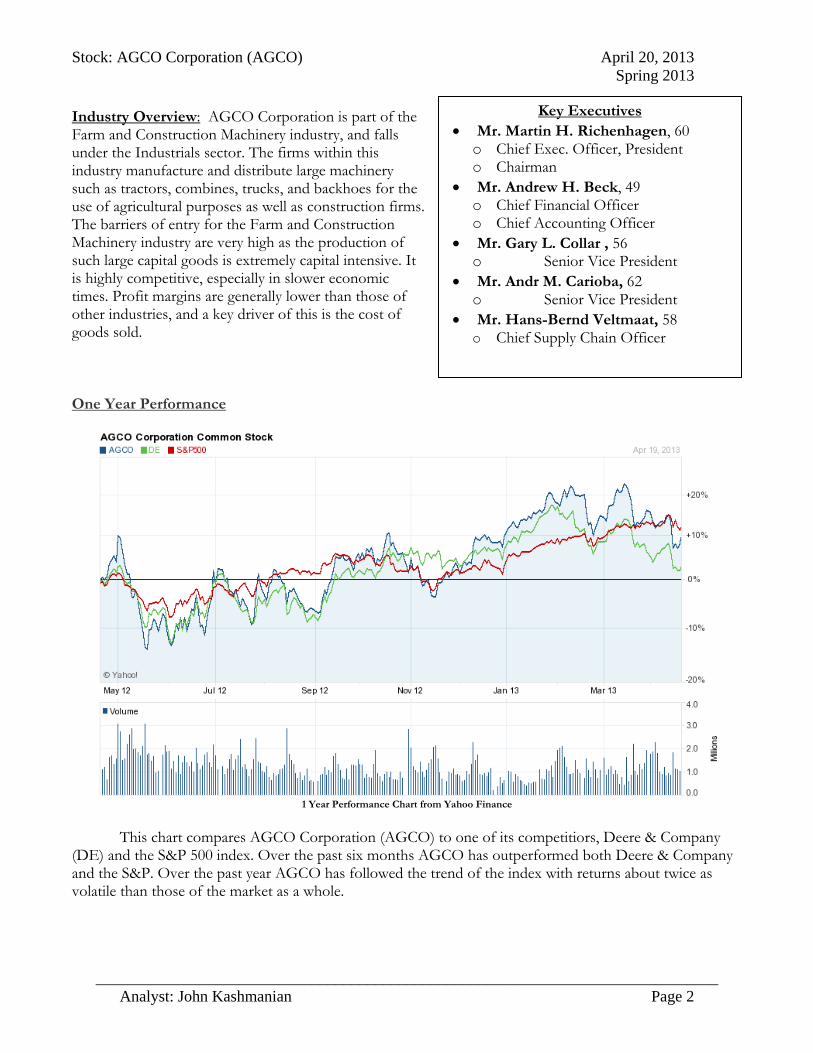
Industry Overview: AGCO Corporation is part of the Farm and Construction Machinery industry, and falls under the Industrials sector. The firms within this industry manufacture and distribute large machinery such as tractors, combines, trucks, and backhoes for the use of agricultural purposes as well as construction firms. The barriers of entry for the Farm and Construction Machinery industry are very high as the production of such large capital goods is extremely capital intensive. It is highly competitive, especially in slower economic times. Profit margins are generally lower than those of other industries, and a key driver of this is the cost of goods sold. One Year Performance
1 Year Performance Chart from Yahoo Finance
This chart compares AGCO Corporation (AGCO) to one of its competitiors, Deere & Company
(DE) and the S&P 500 index. Over the past six months AGCO has outperformed both Deere & Company and the S&P. Over the past year AGCO has followed the trend of the index with returns about twice as volatile than those of the market as a whole.
Key Executives • Mr. Martin H. Richenhagen, 60 o Chief Exec. Officer, President o Chairman
• Mr. Andrew H. Beck, 49 o Chief Financial Officer o Chief Accounting Officer
• Mr. Gary L. Collar , 56 o Senior Vice President
• Mr. Andr M. Carioba, 62 o Senior Vice President
• Mr. Hans-Bernd Veltmaat, 58 o Chief Supply Chain Officer

Stock: AGCO Corporation (AGCO) April 20, 2013 Spring 2013
______________________________________________________________________________ Analyst: John Kashmanian Page 3
Factors that Affect the Industry: The major driver of the Farm and Construction industry is the overall health of the economy.
Strong health will generally translate into higher corporate and government spending, both a necessity for the growth and sustainability of the industry. It has been hit by slow economic growth following the global financial crisis, which took a particular toll on global construction activity. Things seem to be finally turning around for the industry though, as an improving global economy and rising food prices are allowing farmers to spend more money on machinery. Company Outlook: AGCO Corporation is continually growing with expanding operations in North America, South America, Europe, Asia and Australia. They are also finally breaking ground in Africa in which there are tremendous growth possibilities. The population of Africa is expected to grow to 2 billion by 2050 which translates into enormous future agricultural needs. With frequent acquisitions AGCO is also proving that is can expand into different specialized markets with growing market share. With healthy financials, positive growth potential and a bullish stance on the overall economy the future outlook for AGCO is bright. Current valuation puts AGCO at an intrinsic value of $59.69 per share, about 20% higher than current market value. This indicates a recommendation of strong buy. Free Cash Flow Projections:
Shares Outstanding 96.04 Initial Growth 8.70% Terminal Growth 2.5% Expected P/E 9.0 Req. Rate of Return 12% Debt Ratio 55% Depreciation/Sales 1.8% CapEx/Sales 5.6% NWC/Sales 18.0%
Year
2012 2013 2014 2015 2016 2017 Net Income
$809.45 $938.73 $1,084.37 $1,248.25 $1,432.44
Depreciation
$194.92 $211.88 $230.31 $250.35 $272.13 CAP. Expenditures
$606.42 $659.18 $716.53 $778.86 $846.62
NWC
$1,741.10 $1,949.20 $2,118.78 $2,303.12 $2,503.49 $2,721.29 Change In NWC
$208.10 $169.58 $184.33 $200.37 $217.80
Free Cash Flow
$637.83 $321.85 $413.82 $519.37 $640.14 Terminal Value
$6,906.79
Total Cash Flow
$637.83 $321.85 $413.82 $519.37 $7,546.93 Discount Factor
1.12 1.25 1.40 1.57 1.76
PV of CF
$569.49 $256.57 $294.55 $330.07 $4,282.33 Intrinsic Value $5,733.02
Value Per share $59.69

Stock: AGCO Corporation (AGCO) April 20, 2013 Spring 2013
______________________________________________________________________________ Analyst: John Kashmanian Page 4
Terminal Growth
59.69 2.0% 2.5% 3.0% 3.5% 4.0% 4.5% Initial
Growth 6% 56.64 58.81 61.21 63.89 66.91 70.34
7% 56.99 59.18 61.61 64.33 67.38 70.85
8% 57.29 59.50 61.96 64.71 67.80 71.30
9% 57.53 59.77 62.25 65.03 68.16 71.70
10% 57.73 59.99 62.50 65.30 68.45 72.02
11% 57.87 60.15 62.68 65.50 68.68 72.28
12% 57.96 60.25 62.79 65.64 68.84 72.47
13% 57.98 60.29 62.85 65.71 68.93 72.57
14% 57.94 60.26 62.83 65.70 68.94 72.60
15% 57.84 60.16 62.74 65.62 68.86 72.54
16% 57.66 59.99 62.57 65.46 68.71 72.39
17% 57.41 59.74 62.32 65.21 68.46 72.15
18% 57.08 59.40 61.99 64.87 68.12 71.80
19% 56.67 58.99 61.57 64.45 67.69 71.36
20% 56.18 58.48 61.05 63.92 67.14 70.80

Stock: AGCO Corporation (AGCO) April 20, 2013 Spring 2013
______________________________________________________________________________ Analyst: John Kashmanian Page 5
Analysts Recommendations:

Stock: Atmos Energy Corp (ATO) April 19th, 2013 Spring 2013
______________________________________________________________________________ Analyst: Jared Moreau Page 1
Atmos Energy Corp. (NYSE:ATO)
Utilities: Gas Utilities
http://atmosenergy.com/
Company Overview: Headquartered in Dallas, Texas, Atmos Energy Corp. is the nation’s largest natural gas provider with 3 million customers in 12 states. Atmos operates in three segments: Natural Gas Distribution, Regulated Transmission & Storage, and Non-regulated, which provides natural gas management and marketing services to municipalites, local gas distribution companies, and industrial customers.
Recent Developments: April 2nd – Robert W. Best, who was serving as executive chairman, retired form the company effective April 1, 2013. Best joined the company in March 1997 and served as chairman, president and chairman and CEO from October 2008 to October 2010.
March 31st —Despite natural gas charges falling, Atmos upped its monthly customer charge from $7.50 to $17, a 136% increase. Money is needed to help cover cost of $400 million in capital projects.
Key Statistics Price (04/19/2013) $43.176 Market Cap. $3.95B 52 Week Range $31.56-43.86 EPS (ttm) 2.50 Beta 0.5
Price Multiples P/E (ttm) 17.48 P/E (fwd) 16.61 PEG 2.93 P/B 1.60 P/S 1.15 P/CF 5.56
Key Ratios
ATO Industry Gross Margin 31.59% 41.44% Op. Profit Margin 13.8% 14.24%
ROA 3.74% 3.09% ROI 4.38% 5.61% ROE 8.83% 9.80% Current Ratio 0.71 0.95 Debt/Equity 114.99 55.1 EBITDA (millions) $713.4M $371.36M
Recommendation – Hold Price Target: $49.82
Geographical breadth of operations provide diversity in
economic conditions, weather patterns, gas supplies, and regulatory climates
Highest annual dividend yield in utilities sector, 3.4% Non-regulated operations ranked as one of leading domestic
natural gas marketers

Stock: Atmos Energy Corp (ATO) April 19th, 2013 Spring 2013
______________________________________________________________________________ Analyst: Jared Moreau Page 2
Industry Overview:
Atmos Energy Corp. is part of the natural gas industry in the utilities sector. The industry includes domestic companies that provide distribution service to residential, commercial, and industrial customers. Wide variations in weather and swings in the economy have an impact on performance. The capital-intensive businesses are subject to federal, state, and sometimes local regulations; which determine maximum rates of return they may earn. Investors look for high dividend yield from these mature, low-growth companies with relatively stable and consistent returns. The utilities sector generally tends to outperform when the economy is weak and underperform when the economy is rallying. Investors look to this defensive sector to combat decreasing portfolio values in weak times.
The chart above shows 1-year returns for Atmos Energy Corp. (ATO), the S&P 500, and rival companies Oneok Inc. (OKE) and Xcel Energy Inc. (XEL). Over the past year Atmos has outperformed the S&P 500 and has beaten both competitors with strong earnings. In the past two months, Atmos has begun to separate itself as its returns have gained more rapidly than competitors. Company Outlook:
Atmos’ yearly revenues have been steadily decreasing at a constant rate, but its net income has not suffered. Analysts estimate growth over the next 5 years to be 6%. Atmos continues to fund new projects for expansion every year, to maintain this growth. Their geographic breadth renders the firm less exposure to certain risks relative to competitors who may operate in small segments. A sizeable portion of Atmos’ customer base has no other option for energy supply, eliciting the firm a competitive advantage of customer loyalty.

Stock: Atmos Energy Corp (ATO) April 19th, 2013 Spring 2013
______________________________________________________________________________ Analyst: Jared Moreau Page 3
Appendix A: Discounted Cash Flow Results
2013E 2014E 2015E 2016E 2017E EBIT $259,899.15 $272,894.11 $286,538.81 $300,865.75 $315,909.04 Depreciation $15,593.95 $16,373.65 $17,192.33 $18,051.95 $18,954.54 Cap Ex $23,390.92 $24,560.47 $25,788.49 $27,077.92 $28,431.81
Net Working Capital $15,593.95 $16,373.65 $17,192.33 $18,051.95 $18,954.54 Change in NWC $306,480.95 $779.70 $818.68 $859.62 $902.60 Free Cash Flow $67,673.82 $273,303.45 $286,968.62 $301,317.05 $316,382.90
NPV Shares Share Price Constant Growth $5,397,274 90,500 $ 59.64
P/E $4,509,120 90,500 $ 49.82
Sensitivity Analysis
Appendix B: Analyst Coverage
Price Initial Growth 49.82 3.00% 4.00% 5.00% 6.00% 7.00% 8.00% 9.00% 10.00% 12.50 36.92 38.59 40.32 42.12 43.97 45.90 47.89 49.95 13.50 39.08 40.85 42.70 44.61 46.59 48.63 50.76 52.95 14.50 41.23 43.12 45.07 47.10 49.20 51.37 53.62 55.95 15.50 43.39 45.38 47.45 49.59 51.81 54.10 56.48 58.95 16.50 45.55 47.65 49.82 52.08 54.42 56.84 59.35 61.95 17.50 47.71 49.91 52.20 54.57 57.03 59.58 62.21 64.94 18.50 49.87 52.18 54.58 57.06 59.64 62.31 65.08 67.94 19.50 52.02 54.44 56.95 59.55 62.25 65.05 67.94 70.94 20.50 54.18 56.71 59.33 62.04 64.86 67.78 70.80 73.94 21.50 56.34 58.97 61.70 64.54 67.47 70.52 73.67 76.94 22.50 58.50 61.24 64.08 67.03 70.08 73.25 76.53 79.93
P/E

Stock: Atmos Energy Corp (ATO) April 19th, 2013 Spring 2013
______________________________________________________________________________ Analyst: Jared Moreau Page 4
Via NASDAQ
Analyst Firms Making Recommendations
BANK OF AMERICA ML ARGUS RESEARCH
BARCLAYS CAPITAL EDWAR JONES J.J.B. HILLIARD
US CAPITAL ADV UBS
GOLDMAN SACHS
Stock: DeVry Inc. (DV) April 23rd, 2013 Spring 2013
______________________________________________________________________________ Analyst: Stephen Gross Page 1
DeVry Inc. (NYSE:DV)
Services: Education & Training Services
http://www.DeVry.edu/
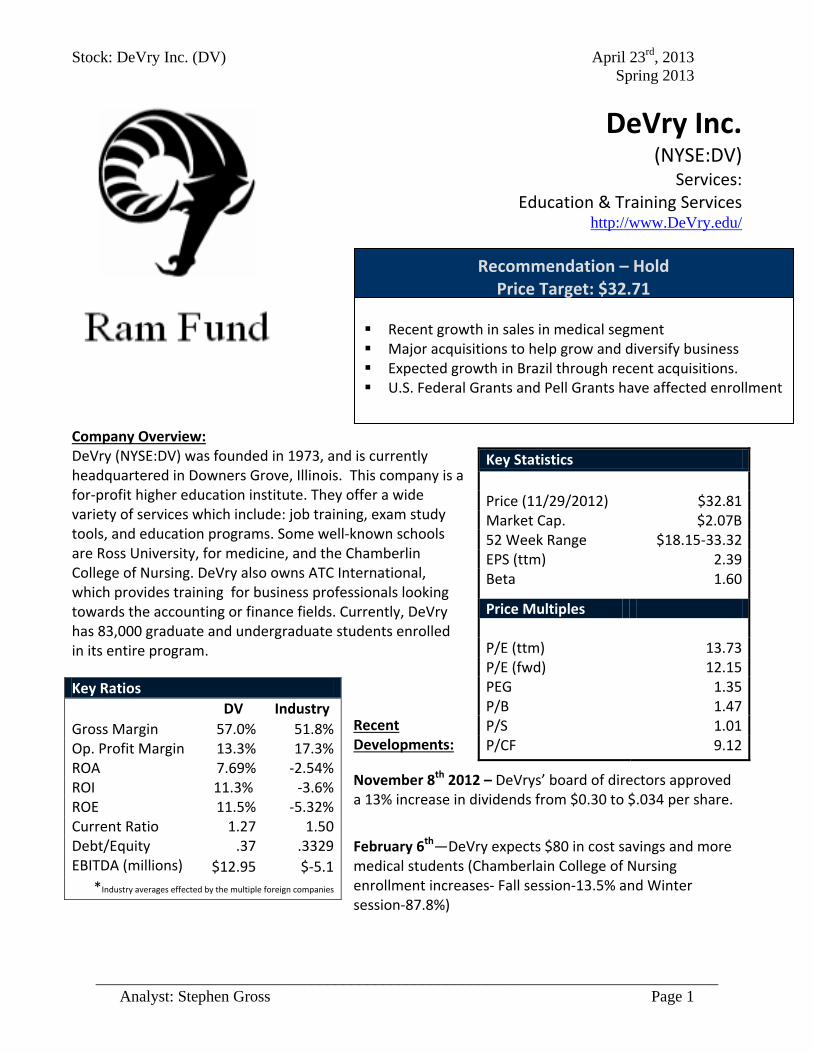
Company Overview: DeVry (NYSE:DV) was founded in 1973, and is currently headquartered in Downers Grove, Illinois. This company is a for-profit higher education institute. They offer a wide variety of services which include: job training, exam study tools, and education programs. Some well-known schools are Ross University, for medicine, and the Chamberlin College of Nursing. DeVry also owns ATC International, which provides training for business professionals looking towards the accounting or finance fields. Currently, DeVry has 83,000 graduate and undergraduate students enrolled in its entire program.
Recent Developments:
November 8th 2012 – DeVrys’ board of directors approved a 13% increase in dividends from $0.30 to $.034 per share.
February 6th—DeVry expects $80 in cost savings and more medical students (Chamberlain College of Nursing enrollment increases- Fall session-13.5% and Winter session-87.8%)
Key Statistics Price (11/29/2012) $32.81 Market Cap. $2.07B 52 Week Range $18.15-33.32 EPS (ttm) 2.39 Beta 1.60
Price Multiples P/E (ttm) 13.73 P/E (fwd) 12.15 PEG 1.35 P/B 1.47 P/S 1.01 P/CF 9.12
Key Ratios
DV Industry Gross Margin 57.0% 51.8% Op. Profit Margin 13.3% 17.3% ROA 7.69% -2.54% ROI 11.3% -3.6% ROE 11.5% -5.32% Current Ratio 1.27 1.50 Debt/Equity .37 .3329 EBITDA (millions) $12.95 $-5.1
*Industry averages effected by the multiple foreign companies
Recommendation – Hold Price Target: $32.71
Recent growth in sales in medical segment Major acquisitions to help grow and diversify business Expected growth in Brazil through recent acquisitions. U.S. Federal Grants and Pell Grants have affected enrollment
Stock: DeVry Inc. (DV) April 23rd, 2013 Spring 2013
______________________________________________________________________________ Analyst: Stephen Gross Page 2
Industry Overview:
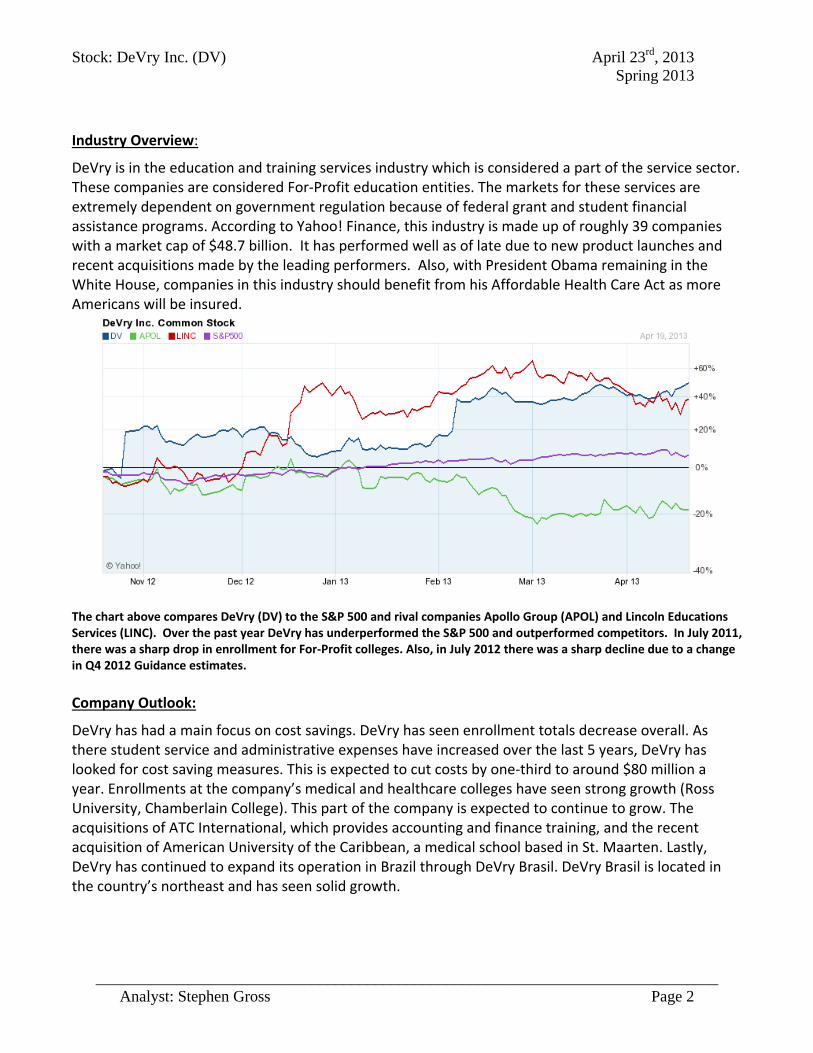
DeVry is in the education and training services industry which is considered a part of the service sector. These companies are considered For-Profit education entities. The markets for these services are extremely dependent on government regulation because of federal grant and student financial assistance programs. According to Yahoo! Finance, this industry is made up of roughly 39 companies with a market cap of $48.7 billion. It has performed well as of late due to new product launches and recent acquisitions made by the leading performers. Also, with President Obama remaining in the White House, companies in this industry should benefit from his Affordable Health Care Act as more Americans will be insured.
The chart above compares DeVry (DV) to the S&P 500 and rival companies Apollo Group (APOL) and Lincoln Educations Services (LINC). Over the past year DeVry has underperformed the S&P 500 and outperformed competitors. In July 2011, there was a sharp drop in enrollment for For-Profit colleges. Also, in July 2012 there was a sharp decline due to a change in Q4 2012 Guidance estimates. Company Outlook:
DeVry has had a main focus on cost savings. DeVry has seen enrollment totals decrease overall. As there student service and administrative expenses have increased over the last 5 years, DeVry has looked for cost saving measures. This is expected to cut costs by one-third to around $80 million a year. Enrollments at the company’s medical and healthcare colleges have seen strong growth (Ross University, Chamberlain College). This part of the company is expected to continue to grow. The acquisitions of ATC International, which provides accounting and finance training, and the recent acquisition of American University of the Caribbean, a medical school based in St. Maarten. Lastly, DeVry has continued to expand its operation in Brazil through DeVry Brasil. DeVry Brasil is located in the country’s northeast and has seen solid growth.

Stock: DeVry Inc. (DV) April 23rd, 2013 Spring 2013
______________________________________________________________________________ Analyst: Stephen Gross Page 3
Appendix A: Discounted Cash Flow Results
Assumptions
Sales Growth 8.95% Debt 12% NWC % 8%
P/E 13.4 Terminal Sales Growth 0% CapEx % 6%
P/S .78
Free Cash Flow (000’s) 2012 2013 2014 2015 2016 2017 Net Income 152,007 165,612 180,434 196,583 214,177
+ Depreciation 68,499 74,629 81,309 88,586 96,514 ∆ NWC 46,031 182,145 198,447 216,208 235,559 256,642 + Depreciation 136,114 16,302 17,761 19,351 21,083
- Capital Expenditures 145,984 159,050 173,285 188,793 205,691 Free Cash Flow*(1-Debt
Ratio=12%) 145,984 159,050 173,285 188,793 205,691
Sensitivity Analysis
Price Initial Growth
$
32.71 5% 6% 7% 8% 9% 10% 11% 12%
P/E 8 18.09 18.83 19.61 20.41 21.20 22.10 22.99 23.91
9 19.86 20.70 21.56 22.45 23.33 24.34 25.33 26.36
10 21.64 22.56 23.51 24.50 25.47 26.58 27.68 28.81
11 23.41 24.42 25.46 26.54 27.61 28.82 30.02 31.27
12 25.19 26.28 27.41 28.59 29.74 31.06 32.37 33.72
13 26.97 28.14 29.37 30.63 31.88 33.30 34.71 36.17
14 28.74 30.01 31.32 32.68 34.01 35.55 37.06 38.62
15 30.52 31.87 33.27 34.72 36.15 37.79 39.40 41.07
16 32.29 33.73 35.22 36.77 38.29 40.03 41.75 43.53
17 34.07 35.59 37.17 38.81 40.42 42.27 44.09 45.98
18 35.85 37.46 39.12 40.86 42.56 44.51 46.44 48.43
19 37.62 39.32 41.08 42.90 44.70 46.75 48.78 50.88
20 39.40 41.18 43.03 44.95 46.83 48.99 51.13 53.34
Stock: DeVry Inc. (DV) April 23rd, 2013 Spring 2013
______________________________________________________________________________ Analyst: Stephen Gross Page 4
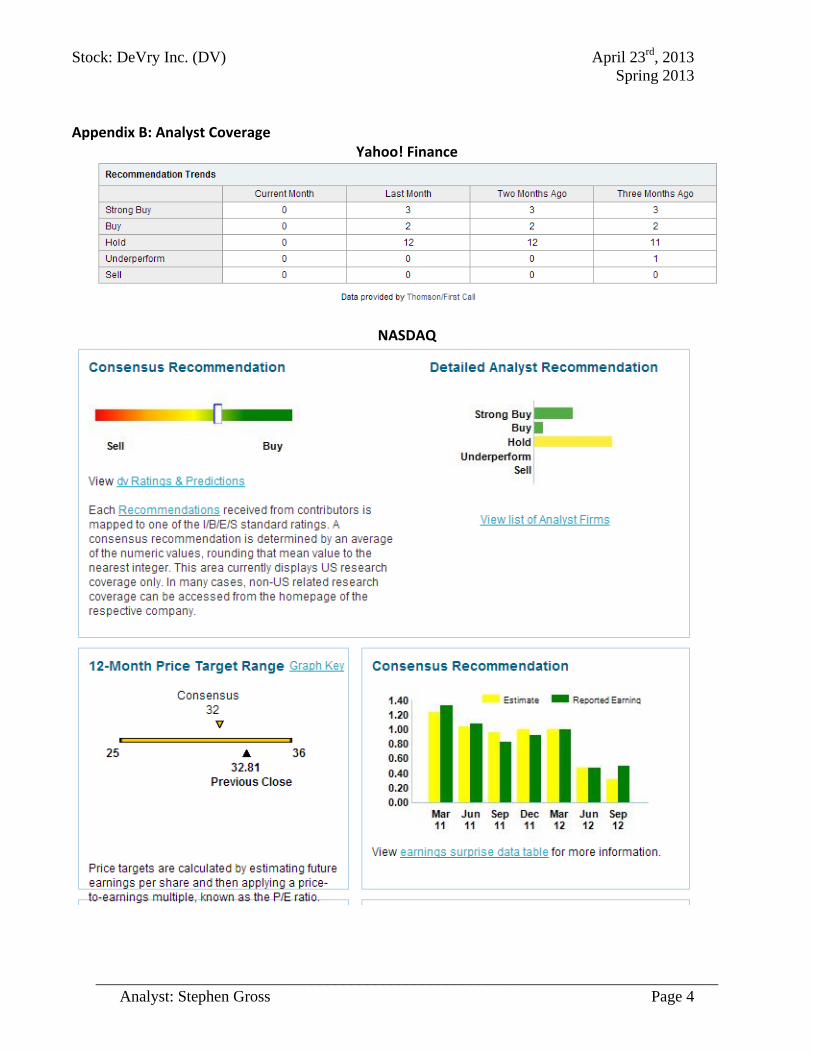
Appendix B: Analyst Coverage
Yahoo! Finance
NASDAQ

Stock: IPG Photonics Corporation April 23, 2013 Spring 2013
______________________________________________________________________________ Analyst: Park Guo Page 1
IPG Photonics Corporation (Nasdaq:IPGP) Technology: Semiconductor-Integrated Circuits
http://www.ipgphotonics.com/
Company Overview: Founded in 1990 in Russia, IPG Photonics is a leading provider in fiber lasers and fiber amplifiers. The company is currently headquartered in Oxford, Massachusetts and operates internationally with a wide range of customers. It now has sales offices in thirteen countries including the United States, China, and Russia as well as seven materials processing application centers. As of 2012, IPGP had over 1,900 customers worldwide and no one customer represents more than 7% of their total sales. IPGP maintains a strong market presence by selling do diverse customer base. Materials processing represents a large portion of their income and includes titanium air frame welding in the aerospace sector to credit card marking for consumers. IPGP has been increasing expenditures in acquiring businesses and facilities to expand its business even more.
Recent Developments • 04/17/2013- Michael Klosof IPGP became board member for Mi-Light, a non-profit organization in Michigan for supporting and promoting the growth of photonics in the US • 04/09/2013- New US patent has been issued to IPGP for “Wavelength stabilized light emitter and system for protecting emitter from backreflected light.” • 09/04/2012- Expanded integrated laser systems offerings with the acquisition of JP Sercel Associates Inc.
Key Statistics Price (04/18/2013) $61.60 Market Capitalization
3.18 B
52 Week Range $37.58-70.11 EPS (ttm) 2.81 Beta 1.67
Price Multiples Price/Earnings (ttm) 22.04 Price/Earnings (fwd) 16.96 PEG Ratio 0.92 Price/Book 4.28 Price/Sales 5.66
Key Ratios
IPGP Industry
Net Profit Margin 25.78% 11.8% ROA (ttm) 19.65% 2.74% ROE 23.97% 10.6% Current Ratio 5.3 2.56 Debt/Equity P/E Ratio
2.3 22.17
33.24 39.33
Recommendation –Hold Fair Value: $72.69
• Capital expenditures increased approximately 28% during 2012
• Increasing growth in sales and reduction of cost of sales
• Increased diverse customer base by 11.7% to 1,900 worldwide
customers

Stock: IPG Photonics Corporation April 23, 2013 Spring 2013
______________________________________________________________________________ Analyst: Park Guo Page 2
Industry Overview: The semiconductor industry can be viewed as the backbone of all modern day technology. Within the technology sector, semiconductors are further divided into broad line, integrated circuits, specialized, equipment and materials, and memory chips. Each individual division provides the essential foundation for the technology we have today. The focus of this analysis is based on the integrated circuits of the semiconductor industry. The growth of this industry is dependent on the capital expenditure of customers, especially manufacturers in the materials processing market. Revenues are generated through the sales of its products, primarily fiber lasers, to various end-users. The industry is subject to risks such as environmental regulations, certificate requirements, seasonal reduction in business activities, etc. During the past year, the economy has improved marginally and the improvement will lead to increased consumer spending. Increased spending will cause manufacturers to invest in capital expenditures in order to preserve and improve their efficiency.
The chart above compares the performance of IPG Photonics (IPGP)totwo close competitors as
identified by Yahoo! Finance: Coherent, Inc. (COHR)and FANUC Corporation (FANUY), as well as the S&P 500(^GSPC)market index over thepast five years. Company Outlook: Since the economic slowdown, IPG Photonics has been steadily increasing their sales and driving up their share price. Acquisitions of bright startup companies as well as vertically integrating their manufacturing processes makes them the top performing firm within the industry. Capital expenditures have also been increasing in recent years which show the desire to expand their reach to even more countries. Their expertise in the field of fiber lasers coupled with the expansion facilities allows IPG Photonics to expand their business into more diverse market segments.

Stock: IPG Photonics Corporation April 23, 2013 Spring 2013
______________________________________________________________________________ Analyst: Park Guo Page 3
Appendix A: Discounted Cash Flow Results and Sensitivity(Dollar figures in thousands)

Stock: IPG Photonics Corporation April 23, 2013 Spring 2013
______________________________________________________________________________ Analyst: Park Guo Page 4
Appendix B: Analyst Coverage Via NASDAQ
`
iROBOT (NASDAQ: IRBT)
Consumer Discretionary: Household Appliance
http://www.irobot.com/us/
Company Overview: Founded in 1990 by Massachusetts Institute of Technology, iRobot was created to make practical robots a reality. Headquartered in Bedford, Massachusetts iRobot designs and builds some of the world’s most important robots. Product range from robots designed to investigate and detonate explosives which are used by police and military, to household vacuum cleaners and household robots. iRobot’s revenues come from two primary sources – product and contract revenue. It sells its robots through chain stores and other national retailers, as well as through its on-line store.
Recent Developments:
March 11th – Alison Dean added as executive vice president and Chief Financial Officer. He formerly worked for Whirlpool Corp.
January 28th—FDA approves IRobot’s RP-VITA remote presence robot allowing physicians to communicate with patients remotely.
Key Statistics Price (4/18/2013) $24.34 Market Cap. $687.20M 52 Week Range $27.16-16.25 EPS (ttm) 0.61 Beta 2.01
Price Multiples P/E (ttm) 41.08 P/E (fwd) 28.11 PEG 3.55 P/B 2.47 P/S 1.57
Key Ratios
IRBT Industry Gross Margin 40% 20% Op. Profit Margin 7% 16% ROA 5.02% 2.58% ROI 6.53% 3.48% ROE 6.67% 4.36%
Recommendation – hold Price Target: $24.4
Recent growth in consumer product sales and earnings. 28% increase in revenue from household product in the last
year.
`
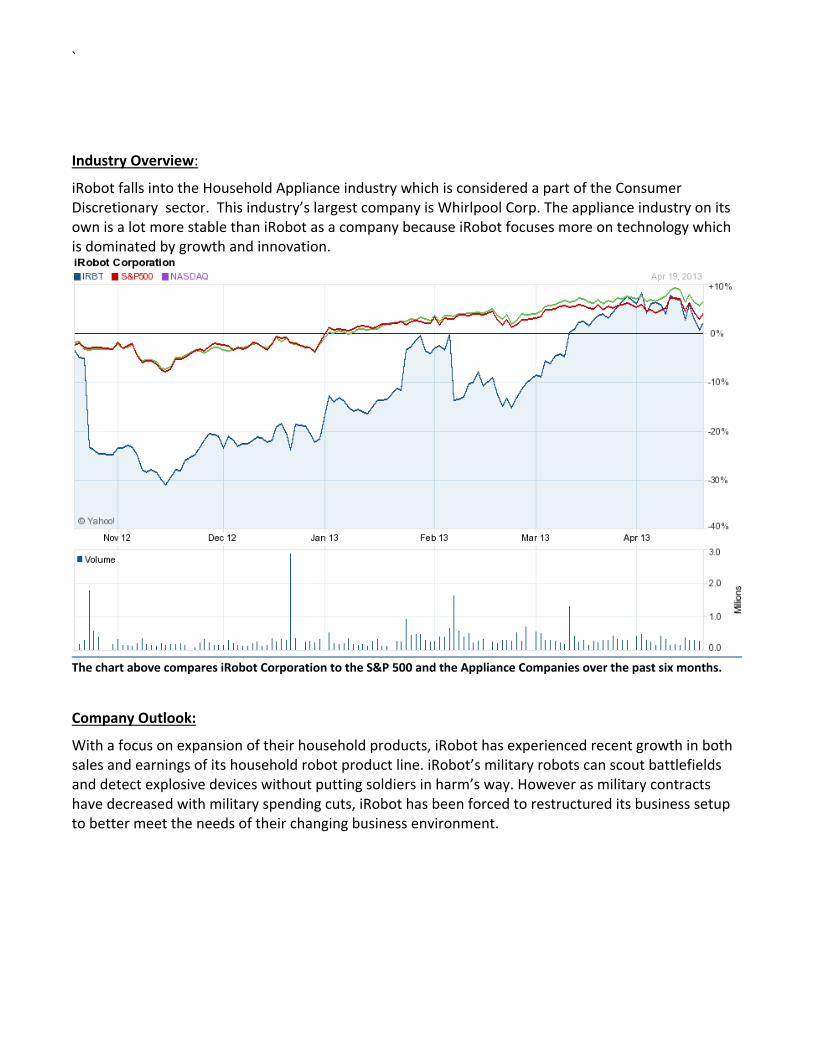
Industry Overview:
iRobot falls into the Household Appliance industry which is considered a part of the Consumer Discretionary sector. This industry’s largest company is Whirlpool Corp. The appliance industry on its own is a lot more stable than iRobot as a company because iRobot focuses more on technology which is dominated by growth and innovation.
The chart above compares iRobot Corporation to the S&P 500 and the Appliance Companies over the past six months. Company Outlook:
With a focus on expansion of their household products, iRobot has experienced recent growth in both sales and earnings of its household robot product line. iRobot’s military robots can scout battlefields and detect explosive devices without putting soldiers in harm’s way. However as military contracts have decreased with military spending cuts, iRobot has been forced to restructured its business setup to better meet the needs of their changing business environment.

`
Appendix A: Discounted Cash Flow Results
Discounted Cash Flow Results:Debt Ratio 23%CapX/Sales 3%DEPREC/SALES 3%NWC/Sales 40.0%Sales Growth 12.0%PE 40.0RROR 12.0%Shares Outstanding 27.9
Year 2012 2013E 2014E 2015E 2016E 2017ENet income 18939 21186 23699 26509 29653Depreciation 12703.43 14228 15935 17847 19989.1Net Working Cap 160,395 195437.3 218890 245157 274575 307524Change in NWC 35,042 23,452 26,267 29,419 32,949Cap EX 14657.8 16417 18387 20593 23064.3FCF -6626.66 4714.5 5250.6 5847.4 6512.02Year for PV calculations: 1 2 3 4 5Terminal Value (PE) 1186129Total CF -6626.66 4714.5 5250.6 5847.4 1192641Discount Factor 1.12 1.2544 1.4049 1.5735 1.76234PV of CF -5916.66 3758.4 3737.2 3716.2 676737Intrinsic Value 682031.7725Value per Share 24.47$
Growth
Terminal P/E 24.47 0.08 0.09 0.1 0.11 0.12 0.13 0.14 0.1535 22.41 22.18 21.95 21.70 21.45 21.19 20.93 20.6536 23.01 22.79 22.55 22.31 22.06 21.80 21.53 21.2537 23.62 23.39 23.15 22.91 22.66 22.40 22.13 21.8638 24.22 23.99 23.76 23.52 23.26 23.00 22.74 22.4639 24.82 24.60 24.36 24.12 23.87 23.61 23.34 23.0640 25.43 25.20 24.97 24.72 24.47 24.21 23.94 23.6741 26.03 25.80 25.57 25.33 25.08 24.82 24.55 24.2742 26.64 26.41 26.17 25.93 25.68 25.42 25.15 24.8743 27.24 27.01 26.78 26.53 26.28 26.02 25.76 25.4844 27.84 27.62 27.38 27.14 26.89 26.63 26.36 26.0845 28.45 28.22 27.98 27.74 27.49 27.23 26.96 26.6946 29.05 28.82 28.59 28.35 28.09 27.83 27.57 27.2947 29.65 29.43 29.19 28.95 28.70 28.44 28.17 27.8948 30.26 30.03 29.80 29.55 29.30 29.04 28.77 28.50
P/E

Stock: KKR Financial Holdings LLC (KFN) April 2013 Spring 2013
______________________________________________________________________________ Analyst: Bryan Poston Page 1
KKR Financial Holdings LLC (NYSE:KFN) Specialized Finance
Company Overview: KKR Financial Holdings LLC is a specialized finance company founded in 2004 in San Francisco, California. KKR typically invests in a large range of financial assets. These assets range anywhere from high yield bonds to corporate loans to other debt securities. Just recently, KKR has begun to invest in the retail real estate market, acquiring a few shopping malls across the United States in partnership with some other investment firms. In these types of investments, KKR usually works as the majority owner of the commercial real estate, working as both owner and general manager of the asoociated property. KKR Financial also has a Natural Resources segment, which invests in both oil and natural gas properties, mostly located in the continental United States.
Current Developments • Earnings call May 1, 2013 • March 11, 2013 - Dividends/share of $.05 paid • Diluted Earnings per share of $1.87 • Enterprise Value of 8.01B
Key Statistics Price (04/19/2012) 10.18 Market Capitalization 1.81B 52 Week Range 7.95 - 11.93 EPS (ttm) 1.87 Beta 1.12 Price Multiples P/E (ttm) 5.45 P/B 0.98 P/S 3.6 P/CF 6.93
Key Ratios (04/19/2013)
KFN Industry ROA
3.68%
0.93%
ROE (ttm) 18.98% 8.21% ROI P/E (ttm)
3.76% 7.05
4.58% 18.18
P/B 0.98 1.46 Dividend Yield 5.95% 3.06%
Recommendation – Hold Price Target: $7.72
• Diverse portfolio of financial assets • Recent entry into commercial real estate • Inconsistent cash flows and investment related income • High yield investments

Stock: KKR Financial Holdings LLC (KFN) April 2013 Spring 2013
______________________________________________________________________________ Analyst: Bryan Poston Page 2
Industry Overview: Specialty finance companies typically invest in a broad range of financial assets. This includes but is not limited to bonds, loans, debt securities, equity related investments, and real estate. The executive management of each firm determines an investment strategy for analysts and investors to follow. Due to the high diversity of investment options that are available for firms to pick from, each firm is highly unique within its industry. Many firms are categorized further based on the nature of their major investments. In context, KKR Financial Holdings LLC is now considered a mortgage investment firm more than anything else. This categorization is available largely to aid in comparison between companies in the industry.
6 Month Performance Chart from Google Finance
The above chart provides a comparison of KKR Financial Holdings LLC (KFN) to the S&P 500 and a competitor, Prospect Capital Corporation. KKR has largely outpaced both the S&P and Prospect Capital Corporation since last September.
Factors that Affect the Industry: The financial sector is strongly affected by interested rates as well as government regulation. Especially in regards to KKR Financial, financial assets are often acquired using debt or other financial instruments. Due to this factor, firms in this industry have a tendency to alter their investment strategies based on changes in interest rates. On top of that, the government plays a major role in the regulation and management of the industry. Each investment firm encounters a significant amount of cost with respect to staying in line with current regulations. With the high volume of investment related transactions throughout the year, firms must work extremely diligently in order to follow proper reporting procedures. Company Outlook:
Recent Acquisition • Colonie Center (04/9/2013)
o 1.3 million square foot super-regional mall with over 113 stores in Albany, New York
o Made in conjunction with Colonie Pacific
o Rennovated in 2007 attracting L.L. Bean, P.F. Chang's, and The Cheesecake Factory
o Addition of a 13 screen cinema and a Whole Foods location to be completed in 2014
Stock: KKR Financial Holdings LLC (KFN) April 2013 Spring 2013
______________________________________________________________________________ Analyst: Bryan Poston Page 3
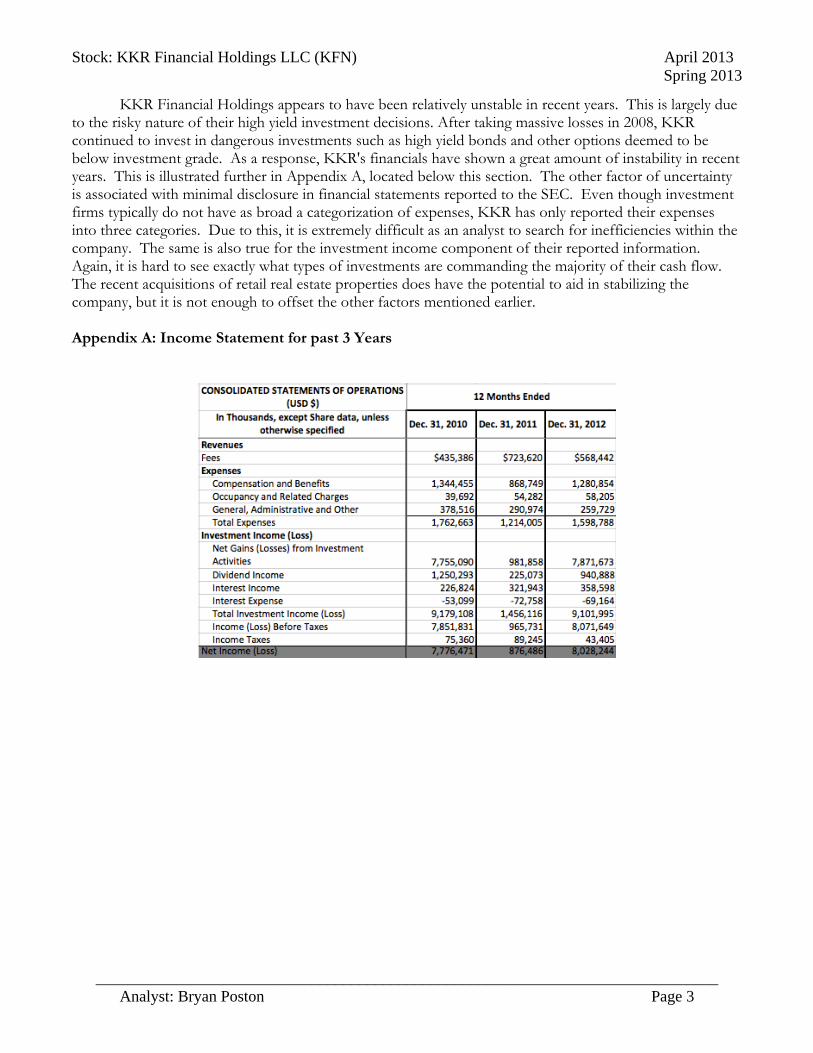
KKR Financial Holdings appears to have been relatively unstable in recent years. This is largely due to the risky nature of their high yield investment decisions. After taking massive losses in 2008, KKR continued to invest in dangerous investments such as high yield bonds and other options deemed to be below investment grade. As a response, KKR's financials have shown a great amount of instability in recent years. This is illustrated further in Appendix A, located below this section. The other factor of uncertainty is associated with minimal disclosure in financial statements reported to the SEC. Even though investment firms typically do not have as broad a categorization of expenses, KKR has only reported their expenses into three categories. Due to this, it is extremely difficult as an analyst to search for inefficiencies within the company. The same is also true for the investment income component of their reported information. Again, it is hard to see exactly what types of investments are commanding the majority of their cash flow. The recent acquisitions of retail real estate properties does have the potential to aid in stabilizing the company, but it is not enough to offset the other factors mentioned earlier. Appendix A: Income Statement for past 3 Years

Stock: KKR Financial Holdings LLC (KFN) April 2013 Spring 2013
______________________________________________________________________________ Analyst: Bryan Poston Page 4
Appendix B: Analyst Coverage
http://www.nasdaq.com/symbol/kfn/analyst-research

Stock: Omega Protein Corp. April 20, 2012 Spring 2013
______________________________________________________________________________ Analyst: Mark Albanese Page 1
Omega Protein Corp. (Nasdaq:OME) Consumer Staples: Processed & Packaged Goods
www.omegaprotein.com
Company Overview: Omega Protein is a vertically integrated producer of omega-3 fish oil and specialty fish meal products, and nutritional ingredient company. The company was founded in 1913 and is headquartered in Houston, Texas. Omega Protein operates in two business segments, Animal Nutrition and Human Nutrition. The Animal Nutrition segment products include fish meal, which is a nutritional animal feed additive, fish solubles, and crude fish oil. Fish solubles are processed into organic fertilizer to aid vegetation growth. Additionally, fish oil products are used in the production of food, animal feed, industrial applications, and dietary supplements. Omega Protein is currently expanding its operations within the Human Nutrition segment. Acquisitions include Cyvex, InCon, and Wisconsin Specialty Protein, which provide ingredients to the nutraceutical industry, concentrate Omega-3 fish oil compounds, and produce whey protein, respectively.
Recent Developments • 02/27/2013: Omega Protein acquires Wisconsin Specialty Protein, a whey protein producer for $27 million. • 12/31/2012: The Company recorded anticipated future legal fees associated with the U.S Attorney’s Office for the Eastern District of Virginia investigation, totaling $7.7 million. • 12/31/2012: The Atlantic States Marine Fisheries Commission voted to reduce the Total Allowable Catch in New Jersey, South Carolina, Texas, and Virginia.
Key Statistics Price (11/27/2012) $9.55 Market Cap. 19.8 M 52 Week Range $5.88-11.21 EPS (ttm) .20 Beta 2.02
Price Multiples Price/Earnings (ttm) 47.23 Price/Earnings (fwd) 9.95 PEG Ratio 1.21 Price/Book .92 Price/Sales .81
Key Ratios
OME Industry
EBIT Margin 5.36 % 7.69 % Net Profit Margin 1.72 % 6.9 3 % ROA 1.42 % 2.09 % ROI 1.6 % 2.86 % ROE 2.02 % 7.26 % Current Ratio 3.8 1.71 Debt/Equity 13.41 121.98
Recommendation – Hold Price Target: 10.99
• Capital expenditures for operations, excluding acquisitions are expected to be between $20 and $22 million in 2013.
• Fish oil yields for 2012 were 29% below the five year average, increasing per unit product costs.
• Received $44.8 million from litigation settlements in 2010 and 2011.

Stock: Omega Protein Corp. April 20, 2012 Spring 2013
______________________________________________________________________________ Analyst: Mark Albanese Page 2
Industry Overview: The Processed & Packaged Goods sub-industry represents a significant portion of the Consumer Goods sector. This sector consists of 351 firms of which 109 firms are categorized under the Processed & Packaged Goods sub-industry. This sub-industry focus is to process foods, and sell these finished goods to retail outlets for distribution. Depending on whether or not the firm has its own warehouse operation, it may or may not incur significant transportation costs. However, the Processed & Packaged sub-industry does benefit from its differentiated products, which unlike commoditized products result in higher gross margins. Growth in this industry is primarily driven by population growth, wealth, consumer preferences, demographics, and supply. Consumer Staples maintain stable demand year to year, because its products are essential for day to day living. As a result, population growth is directly related to demand for food products, which increases sales revenue for Processed & Packaged Goods firms. During the past few years Consumer Staples have experienced higher trading volume due to their defensive nature.
The chart above compares the performance of Omega Protein Corp. (OME) to its closest
competitor, Darling International Inc. (DAR), and the S&P 500 index over the past year.
Factors that Affect the Industry: There are two important drivers that affect the performance of the consumer staples sector. The
first driver that determines the performance of this industry is the state of the economy. In depressed economies interest rates decline and firms are able to finance capital expenditures with debt at a lower cost. Second, sentiment drivers, such as branding allow firms to offset inflationary price increases, raising cost of goods with higher pricing strategies, and maintain sales.

Stock: Omega Protein Corp. April 20, 2012 Spring 2013
______________________________________________________________________________ Analyst: Mark Albanese Page 3
Company Outlook: When evaluating Omega Protein’s previous years’ financial investors will conclude that management is committed to expanding its Human Nutrition segment. Over the past three years the Human Nutrition segment has acquired three new subsidiaries. Management believes that this product mix diversification will allow the company to offset declining fish oil yields. Also, these three acquisitions have experienced higher gross margins than the Animal Nutrition segment. Once these operations have been completely immersed into Omega Protein’s business model, its net profit will have a greater percentage attributable to the Human Nutrition segment than the Animal Nutrition segment. Appendix A: Discounted Cash Flow Results and Sensitivity
Inputs Initial Revenue Growth 0.10 Terminal Revenue Growth 0.04 CapEX % Rev 0.13 Depreciation & Amortization 0.08 Cost of Equity 0.14 P/E Multiple 9.95 P/S Multiple .81 Number of Shares Outstanding 19,827,780
Free Cash Flow 2013 2014 2015 2016 2017 Total Revenue 259,202,900 285,123,190 313,635,509 344,999,060 379,498,966
% Change Revenue 10.00% 10.00% 10.00% 10.00% 10.00%
Net Income 8,879,439 9,767,383 10,744,121 11,818,533 13,000,387
Capital Expenditures 32,400,363 29,937,935 32,931,728 36,224,901 39,847,391
CapEx % Rev 12.50% 10.50% 10.50% 10.50% 10.50%
FCFE 11,180,518 7,651,269 8,416,396 9,258,035 10,183,839
Final Terminal Value(P/S)
307,394,162
Cash Flow 11,180,518 7,651,269 8,416,396 9,258,035 10,183,839
PV Cash Flows 11,180,518 6,704,582 6,462,531 6,229,218 187,242,038
No. of Shares 19,827,780 Stock Price 10.99
P/SInitial Growth 10.99$ 0.11 0.21 0.41 0.61 0.81 1.01 1.21 1.41 1.61 1.81
5% 2.94 3.84 5.62 7.41 9.20 10.99 12.78 14.57 16.36 18.146% 2.97 3.91 5.78 7.66 9.53 11.41 13.28 15.16 17.03 18.917% 3.00 3.98 5.95 7.91 9.88 11.84 13.81 15.77 17.74 19.708% 3.03 4.06 6.11 8.17 10.23 12.29 14.35 16.41 18.47 20.539% 3.06 4.13 6.29 8.45 10.60 12.76 14.92 17.07 19.23 21.38
10% 3.09 4.21 6.47 8.73 10.99 13.24 15.50 17.76 20.01 22.2711% 3.12 4.30 6.66 9.02 11.38 13.74 16.11 18.47 20.83 23.1912% 3.15 4.38 6.85 9.32 11.79 14.26 16.73 19.20 21.67 24.1413% 3.18 4.47 7.05 9.64 12.22 14.80 17.38 19.96 22.55 25.1314% 3.21 4.56 7.26 9.96 12.66 15.36 18.06 20.75 23.45 26.1515% 3.25 4.66 7.48 10.30 13.11 15.93 18.75 21.57 24.39 27.2116% 3.28 4.76 7.70 10.64 13.59 16.53 19.47 22.42 25.36 28.3017% 3.32 4.86 7.93 11.00 14.07 17.15 20.22 23.29 26.36 29.4418% 3.36 4.96 8.16 11.37 14.58 17.78 20.99 24.19 27.40 30.6119% 3.39 5.07 8.41 11.75 15.10 18.44 21.79 25.13 28.47 31.8220% 3.43 5.17 8.66 12.15 15.64 19.12 22.61 26.10 29.58 33.07
Stock: Omega Protein Corp. April 20, 2012 Spring 2013
______________________________________________________________________________ Analyst: Mark Albanese Page 4
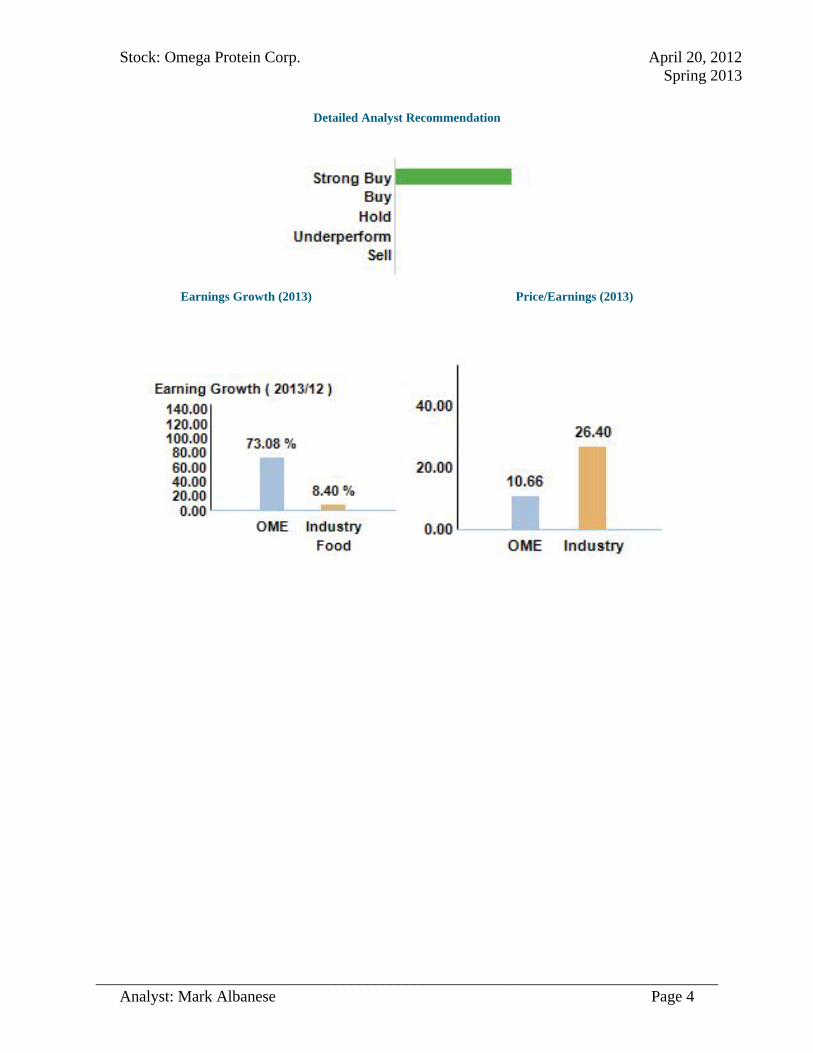
Detailed Analyst Recommendation
Earnings Growth (2013) Price/Earnings (2013)

Stock: Orient Paper, Inc. April 18th, 2013 Spring 2013
Analyst: Michael Robert Giancaspro
Orient Paper, Inc (NYSE:ONP)
Basic Materials: Paper Products
http://www.orientpaperinc.com/
Company Overview: Orient Paper Inc. is a leading paper manufacturer in North China. The Company initially manufactured packaging paper when it was founded in 1996. Since then the Company has expanded its product capacities to include higher quality paper products. In 2003, the Company began producing printing paper with diverse specifications and, beginning in early 2010, the Company began producing digital photo paper. Orient Paper has two locations within Xushui County, Baoding City, Hebei Province and serves over 100 packaging and printing companies and paper products distributors with three types of paper, including packaging paper, printing paper and digital photo paper. In January 2013, the company announced its business expansion plans into tissue paper operations.
Allegations of Fraud: In 2010, Muddy Waters, a short-selling firm run by Carson Block & Sean Reagan published a report, some but not all allegations follow
• Around $30 million has been misappropriated since Oct. 2009 • ONP overstated 2008 revenue by 27x. • ONP overstated 2009 revenue by 40x. • ONP overvalues its assets by at least 10x.
Since the allegations, ONP’s stock price has artificially fallen from as high as $15 in the beginning of 2010 to $1.70 in 2013. Two years later, the company is still a going concern and has taken measures to disprove the allegations through an independent investigation and outright denial of all Carson Block’s claims.
Recommendation – Strong Buy Price Target: $5.79-$6.64 -Recently cleared of all fraud allegations by Deloitte -Expected expansion into tissue paper business -Capacity increased with recent investments in new production lines, Sales growth expected as a result
Key Statistics
Price 4/18/2013 $1.70
Market Cap. $31.00 M
52 Week Range $1.64 - 3.53
EPS .79
Beta 2.97
Dividend Yield %2.90
Price Multiples
P/E 2.08
Earnings Yield 42.98
P/B .299
P/S .287
Key Ratios
ONP Industry
GPM %24.62 %20.82
NPM %14.36 %2.79
ROA 14.93 3.32
ROI 16.25 4.45
ROE 16.97 7.93
Current Ratio 1.964 2.165
EBITDAM %23.12 %13.51

Stock: Orient Paper, Inc. April 18th, 2013 Spring 2013
Analyst: Michael Robert Giancaspro
Orient Paper’s Response to Fraud allegations Orient Paper has taken pains to show the independence of its investigation and noted that the company had not previously hired the involved professionals, who included the law firms Loeb & Loeb and TransAsia Lawyers, as well as the accountants Deloitte & Touche Financial Advisory Services. The financial statements of ONP were validated and cleared of fraud later that year in 2010. Liu Zhenyong, the CEO of ONP, has reiterated this charge on several occasions: that the Muddy Waters researchers had demanded a large sum of money and equity in exchange for a positive report, and had then put out the June sell recommendation when Liu refused. Muddy Waters has denied Liu’s shakedown allegation. However this version of events coincides with an eyewitness account of Rick Pearson, a well-credentialed American analyst who specializes in small-cap Chinese stocks. He toured ONP’s facilities alongside Carson Block and Sean & Reagan. In an article he wrote on 07/01/10 on thestreet.com, he describes their conduct during the tour to be “amateurish”, as they did not ask many questions, and at one point Rick Pearson watched as one of the partners of Muddy Waters “jumped around in the recycled paper piles like a child” when he asked about the presence of his former classmates, the company stated: “The purpose of Carson Block & Sean Reagan’s trip was to pitch a “paid for” research report that would recommend the stock as a strong buy” Muddy Waters held significant short-selling interests, and would profit (and has profited) financially during ONP’s decline in value. Within their report they claimed no responsibility to its accuracy, and those that use it do so at their own risk. Recent Developments: 04/04/13 8:30 AM EDT Orient Paper Declares First Quarter 2013 Dividend of $0.0125 per Share - PR Newswire This is part of a recently instated reoccurring dividend. The company expects the reoccurring dividend to continue well into the future 04/03/13 Orient Paper: A Safe Play For Investors Once Again Seeking Alpha: Orient Paper Inc (ONP) is a name that may seem quite familiar to investors. The leading producer of paper products in northern China was the subject of negative press and fraud reports dating back to 2010… 03/22/13 8:30 AM EDT Orient Paper to Present at the John Tumazos Very Independent Research Metals and Mining Conference in New York - PR Newswire 11/29/10, 4:35 P.M. EDT Audit Committee Clears Orient Paper, http://blogs.barrons.com/stockstowatchtoday/2010/11/29/audit-committee-clears-orient-paper/ Industry Overview:

Stock: Orient Paper, Inc. April 18th, 2013 Spring 2013
Analyst: Michael Robert Giancaspro
Orient Paper, Inc is a Chinese firm that manufactures paper products. According to Research Insight, the Paper Products industry is made up of 24 companies. In the U.S. and other developed markets, the industry is expected to decline. However, overseas the market is just beginning in developing countries like China and India. Paper production and consumption is mostly seen in developed nations like the U.S.A, Japan, and Western Europe who alone make up 70% of worldwide paper production.
The chart above compares Orient Paper, Inc. to the Dow Jones, and rival companies Buckeye Technologies Inc (BKI), and China Paper Holdings (CPPHF). In 2010, there was a sharp decline due to the report of Muddy Waters, a short-selling firm who claimed the company was a fraud. Orient Paper responded to the allegations by outright denying them, and initiating an independent audit, which included the accounting firm Deloitte. The independent audit has since cleared ONP of all fraud allegations, but has yet to even remotely recover the stock price to pre-allegation levels. Company Outlook: Having recently expanded their production capacities and product lines in 2009-2012, Orient Paper expects growth in both sales and earnings. Early in 2013 ONP announced of its planned expansion into the Tissue Paper business. The company’s stock price has yet to recover to pre-fraud-allegation levels and is trading roughly 3x below its intrinsic value. It is one of the most profitable and well run companies in its industry, and is THE leading paper production firm in Northern China. Appendix A: Discounted Cash Flow Results

Stock: Orient Paper, Inc. April 18th, 2013 Spring 2013
Analyst: Michael Robert Giancaspro
Assumptions Expansion reduced Shares Outstanding 18460000 Initial Growth 5% Expected P/E 2 RROR 10% Debt Ratio 12.15% Depreciation to NI 50.42% Capital expenditures decreasing at an average rate (1+-42.84%) NWC / Sales 14.47%
Free Cash Flow
2012 2013ex 2014ex 2015ex 2016EX 2017EX net income 14,672,663 17,138,799 17,995,738 18,895,525 19,840,302 20,832,317 depreciation 8,382,859 8,640,852 9,072,894 9,526,539 10,002,866 10,503,009 net working capital 21,866,644 22,959,976 24,107,975 25,313,374 26,579,042 27,907,995 change in net working capital 10,542,928 1,093,332 1,147,999 1,205,399 1,265,669 1,328,952 Capital expenditures 11,915,693 7,727,564 4,417,149 2,524,885 1,443,248 824,974 Free Cash flow 3,325,218 24,686,318 22,179,550 25,144,943 27,463,336 29,443,063
NPV Shares Share Price
P/E $122,217,135 18460000 $ 6.64
Sensitivity Analysis Initial
Growth
Terminal P/E 6.64 0.03 0.04 0.05 0.06 0.07 0.08 0.09 0.1 1 5.66 5.80 5.94 6.09 6.24 6.39 6.55 6.71 2 6.29 6.46 6.64 6.82 7.01 7.20 7.40 7.60 3 6.93 7.13 7.34 7.56 7.78 8.01 8.24 8.48
4 7.56 7.80 8.04 8.29 8.55 8.81 9.08 9.37 5 8.20 8.47 8.74 9.03 9.32 9.62 9.93 10.25
6 8.84 9.14 9.44 9.76 10.09 10.43 10.77 11.13 7 9.47 9.80 10.14 10.49 10.86 11.23 11.62 12.02 8 10.11 10.47 10.84 11.23 11.63 12.04 12.46 12.90 9 10.75 11.14 11.55 11.96 12.40 12.85 13.31 13.79 10 11.38 11.81 12.25 12.70 13.17 13.65 14.15 14.67 11 12.02 12.48 12.95 13.43 13.94 14.46 15.00 15.56 12 12.66 13.14 13.65 14.17 14.71 15.27 15.84 16.44 13 13.29 13.81 14.35 14.90 15.48 16.07 16.69 17.32 14 13.93 14.48 15.05 15.64 16.25 16.88 17.53 18.21 Appendix B: Discounted Cash Flow Results Assumptions

Stock: Orient Paper, Inc. April 18th, 2013 Spring 2013
Analyst: Michael Robert Giancaspro
Expansion into Tissue Paper Shares Outstanding 18460000 Initial Growth 5% Expected P/E 2 RROR 10% Debt Ratio 12.15% Depreciation to NI 51.42% Capital to sales -4.98% NWC / Sales 14.47%
Free Cash Flow
2012 2013EX 2014EX 2015EX 2016EX 2017EX net income 14,672,663 17,138,799 17,995,738 18,895,525 19,840,302 20,832,317 depreciation 8,382,859 8,640,852 9,072,894 9,526,539 10,002,866 10,503,009 net working capital 21,866,644 22,959,976 24,107,975 25,313,374 26,579,042 27,907,995 change in net working capital 10,542,928 1,093,332 1,147,999 1,205,399 1,265,669 1,328,952 Capital expenditures 11,915,693 7,727,564 4,417,149 2,524,885 1,443,248 824,974 Free Cash flow 3,325,218 24,686,318 22,179,550 25,144943 27,463,336 29,443,063
NPV Shares Share Price
P/E
$$106,972,855 18460000 $ 5.79
Sensitivity Analysis 2
Initial Growth Terminal P/E 5.79 0.03 0.04 0.05 0.06 0.07 0.08 0.09 0.1 1 4.89 4.99 5.09 5.20 5.31 5.43 5.54 5.66 2 5.52 5.66 5.79 5.94 6.08 6.23 6.39 6.54 3 6.16 6.32 6.50 6.67 6.85 7.04 7.23 7.43 4 6.80 6.99 7.20 7.41 7.62 7.85 8.08 8.31 5 7.43 7.66 7.90 8.14 8.39 8.65 8.92 9.20 6 8.07 8.33 8.60 8.88 9.16 9.46 9.76 10.08 7 8.70 9.00 9.30 9.61 9.93 10.27 10.61 10.97 8 9.34 9.66 10.00 10.35 10.70 11.07 11.45 11.85 9 9.98 10.33 10.70 11.08 11.47 11.88 12.30 12.73 10 10.61 11.00 11.40 11.81 12.24 12.69 13.14 13.62 11 11.25 11.67 12.10 12.55 13.01 13.49 13.99 14.50 12 11.89 12.34 12.80 13.28 13.78 14.30 14.83 15.39 13 12.52 13.00 13.50 14.02 14.55 15.11 15.68 16.27 14 13.16 13.67 14.20 14.75 15.32 15.91 16.52 17.15

Stock: Rowan Companies Plc. (RDC) April 24th, 2013 Spring 2013
______________________________________________________________________________ Analyst: Luis Rondon Page 1
Rowan Companies plc (NYSE: RDC)
Energy: Oil & Gas Drilling
www.Rowancompanies.com
Company Overview: Rowan Companies PLC was founded in 1923 by brothers Charlie and Arch Rowan as a contract drilling business. They started with a small land-based steam rig powered by two 45-horsepower boilers. Today Rowan Companies plc is a major provider of global offshore contract drilling service with leading high-specification Jack-up rigs. Currently operating a fleet of 31 Jack-up rigs worldwide, including the North Sea, Gulf of Mexico, Middle East, Trinidad and South East Asia. In 2013 the company will enter the ultra-deepwater market with high-specification drill ships expected to be delivered starting in late 2013.
Recent Developments:
• April 4, 2013: RDC announces first quarter earnings beating expectation.
• March 7, 2013: Announces Thomas P. Burke as President
• March 14, 2013: Release Fleet contracts status update
Key Statistics Price (04/19/2013) $31.24 Market Capitalization 3.88B 52 Week Range $28.62 - 39.40 EPS (ttm) 1.46 Beta 1.77
Price Multiples P/E (ttm) 21.44 P/E (fwd) 7.99 PEG .62 P/B .94 P/S 2.76
RDC Oil & Gas Drilling Industry
P/E 21.08 12.1 P/B .94 1.3 Net Profit Margin
14.60% 11.5%
ROE 4.59% 8.7% Div. Yield N/A 2.8%
Recommendation –Hold Price Target: $41.90
Recent growth in contract and earning Improving economic conditions Undervalued shown in discounted cash flow analysis. Improving equipment that are in high demand

Stock: Rowan Companies Plc. (RDC) April 24th, 2013 Spring 2013
______________________________________________________________________________ Analyst: Luis Rondon Page 2
Industry Overview: Rowan Companies plc, falls under the Oil and Gas Drilling industry within the energy sector. Firms in the oil and gas drilling industry own and operate rigs responsible for the exploration and production of gas and oil. The main customers for the oil and gas drilling industry are public and privately owned oil and gas explorers and producers. Oil and gas drilling firms tend to have diverse rig fleets that can fall into one of two classification: land or offshore rigs. Rowan Companies Plc. is classified under the offshore rigs, having 31 Jack-up oil rigs. In recent years Rowan Companies Plc. sold off their land rig side of the business to focus on offshore rigs. Oil and Gas drilling firms’ main business is contract drilling. Firms in the oil and gas drilling industry typically follow one of two growth strategies: organic and through acquisition. Rowan Companies Plc. is currently trying to grow organically by investing on new equipment to be able to meet high demand of ultra-deepwater rigs.
One Year Performance
1 Year Performance Chart from Yahoo Finance
The chart above compares Rowan Companies Plc. (RDC) to the S&P 500 and rival company Transocean Ltd. (RIG). Over the past year RDC has had some month overperforming both the S&P500 and its rival RIG but over the past 6 months it has underperform.
Company Outlook: Rowan Companies Plc. is currently expanding their rig’s fleet. In 2013 they are entering the ultra-deepwater market with the delivery of the first of four high-specification drill ships. They have most of their rigs currently operating under contract for 2013 and 2014. They want to expand into the Southeast Asian market with high-specification oil rigs. This recent quarter EPS was $0.57 beating expectation of $0.44.
Key Executives Chief Executive Officer W. Matt
Ralls President & Chief Operating Officer
Thomas P. Burke
Executive Vice President, Chief Financial Officer & Treasurer
J. Kevin Bartol
Executive Vice President, Legal
John L. Buvens

Stock: Rowan Companies Plc. (RDC) April 24th, 2013 Spring 2013
______________________________________________________________________________ Analyst: Luis Rondon Page 3
Assumptions
Growth 23% Debt
41.14%
NWC % 56.30%
P/E 21.3 Ke 11%
CapEx % 51.30%
Free Cash Flow Projections:
Free Cash Flow 2013 2014 2015 2016 2017 EBIT $251,319 $311,805 $385,805 $478,013 $592,258 ∆ NWC $187,385 $232,170 $287,659 $356,409 $441,591 + Depreciation $350,609 $434,405 $538,228 $666,864 $826,245 "- Capital Expenditures
$883,943 $1,095,205 $1,356,959 $1,681,273 $2,083,097
Free Cash Flow $-28,628 $-581,585 $-720,825 $-892,804 $-1,105,850
Sensitivity Analysis

Stock: Rowan Companies Plc. (RDC) April 24th, 2013 Spring 2013
______________________________________________________________________________ Analyst: Luis Rondon Page 4
Consensus Recommendation
Analyst Firms Making Recommendations
B OF A M L BARCLAYS CAPITA CAP ONE SOUTHCO COWEN SECURITIE CREDIT AGRICOLE DEUTSCHE BK SEC FBR CAP MARKETS GABELLI & COMPA GLOBAL HUNTER S GOLDMAN SACHS J.P. MORGAN JEFFERIES & CO. JOHNSON RICE MACQUARIE CAPIT MORGAN STANLEY RAYMOND JAMES RBC CAPITAL SANFORD BERNSTE SIMMONS & CO. SOCIETE GENERAL STEPHENS INC UBS WELLS FARGO SEC WILLIAMS FINANC

Stock: United Therapeutics (UTHR) April 20th, 2013 Spring 2013
______________________________________________________________________________ Analyst: Benjamin Kupa Page 1
United Therapeutics (NYSE:UTHR)
Healthcare: Biotechnology www.unither.com
Company Overview: Founded in 1996, United Therapeutics Corporation is a biotechnology firm that develops and manufactures drugs for patients that have life-threatening disorders. Currently, UTHR has 3 patented drugs that treat Pulmonary Arterial hypertension; high blood pressure in the arteries of the lungs.
Recent/Upcoming Developments:
April 25th, 2013 – UTHR will announce First Quarter 2013 financial results in a half-hour teleconference.
April 15th, 2013–UTHR gained approval for phase 1 study of Pulmonary Arterial Hypertension treatment using Pluristem Therapeutic’s PLX-PAD cells (Placental Expanded Cells
Key Statistics Price (4/20/2013) $60.26 Market Cap. $3.02B 52 Week Range $41.42-63.11 EPS (ttm) 5.71 Beta 1.4
Price Multiples P/E (ttm) 10.55 P/E (fwd) 8.58 PEG .29 P/B 2.76 P/S 3.28
Key Ratios
UTHR Industry P/E 10.55 86.3 P/B 2.76 16.2 Net Profit Margin 34.15% 10.1%
ROE 14.73% 8.8% Debt/Equity 25.37 103.6
Recommendation –Hold Price Target: $70.66
Growth in revenues and income 3 products in “Phase III” in the pharmaceutical pipeline (2 as
treatment for PAH, 1 for Neuroblastoma)

Stock: United Therapeutics (UTHR) April 20th, 2013 Spring 2013
______________________________________________________________________________ Analyst: Benjamin Kupa Page 2
Industry Overview:
United Therapeutics is a biotechnology firm, a relatively large offshoot of the Healthcare sector. According to data available through Research Insight, the biotechnology industry includes 306 firms, including United Therapeutics. The biotechnology industry has an average market capitalization of $23B, and an average price to book of 16.2. Most recently, the industry has been characterized by the premier biotech firm, Amgen. Much of the success of biotech firms relies upon FDA review panels and introductions of new products for clinical testing.
The Chart above, obtained from Yahoo! Finance displays the one year performance of United Therapeutics Corporation, as well as UTHR’s main competitor Gilead Sciences Inc., and the top performing biotechnology firm, Amgen. While United Therapeutics has been outperformed by Gilead and Amgen recently, it is also a much smaller firm, with a 3.02B market cap, compared to GILD & AMGN’s 80.95B & 83.36B respectively. United Therapeutics Corp. has consistently outperformed the S&P 500 over the past year. In late October, UTHR took a hit when they received an unfavorable response letter from the FDA regarding their oral new drug application, Remodulin. In late March, UTHR received a second unfavorable response from the FDA. Company Outlook:
United Therapeutics has seen recent growth in revenues and profits, from its three patented PAH products. The company has recently begun collaborations with Pluristem Therapeutic, in order to create new products using Pluristem’s PLX-PAD cells. United Therapeutics is focused on creating and acquiring new patents in order to grow, and currently has 9 products at different stages of the pharmaceutical pipeline.

Stock: United Therapeutics (UTHR) April 20th, 2013 Spring 2013
______________________________________________________________________________ Analyst: Benjamin Kupa Page 3
Appendix A: Discounted Cash Flow Results
Sensitivity Analysis
P/E
Growth

Stock: United Therapeutics (UTHR) April 20th, 2013 Spring 2013
______________________________________________________________________________ Analyst: Benjamin Kupa Page 4
Appendix B: Analyst Coverage Via NASDAQ

Mark Albanese 3 Maze Road, Montvale, NJ 07645 | (201) 414-2358| [email protected]
EDUCATION University of Rhode Island Kingston, RI Bachelor of Science in Business Administration: Accounting Expected May 2013
Cumulative GPA: 3.74
Honors: o Honors Program with the College of Business at URI o Frederick & Karen Buchsbaum Scholarship o G & M McKowen Scholarship
o Beta Gamma Sigma o Golden Key National Honor Society
o Dean’s List – Every Semester
PROFESSIONAL EXPERIENCE
International Business Machines Corporation Armonk, NY IBM Global Finance Consolidation Accounting Intern June – August 2012
Valued assets which were either sold or remaining in inventory, aiding the performance of eliminations.
Reconciled general ledger reports for capital lease accounts, such as equipment, depreciation, and indirect costs.
Branded returning lease equipment to various inventory accounts within the Global Asset Recovery System to assist with the process of estimating reserve value.
Analyzed quarterly receivables collected against billings for investment portfolios.
Reclassified cash flow from operations to investments.
Utilized the general ledger to efficiently locate tables containing loan payment structures of individual clients.
Collaborated with leading business professionals to better understand IBM’s leasing practice.
Abercrombie & Fitch Paramus, NJ Sales Associate June – August 2011
Worked part time during the summer assisting with preparation and maintenance of the sales floor.
Upheld a high standard of customer service while assisting customers with purchase decisions.
Became extremely efficient in using database software such as PeopleSoft to operate the cash register.
Reconciled ending cash amount to check for discrepancies.
Was recognized by management staff for my dedication, positive attitude, and quick learning curve.
LEADERSHIP AND EXTRACURRICULARS
Beta Gamma Sigma Student Leadership Forum St. Louis, MO University of Rhode Island Representative November 1 – November 4, 2012
Explored challenging issues, such as ethical decision making and career planning to foster personal growth.
Networked with peers having similar future career goals, and gained new perspectives of successful leadership.
Tau Epsilon Phi Fraternity Kingston, RI Treasurer September 2011 – December 2012
Managed collections of payments from within the fraternity, but also secured funding for events, which included the active brotherhood and elder members.
Organized an online banking account for the organization to manage the budget more efficiently.
Assisted the fraternity in raising funds for philanthropy events to donate to local charities, such as the Rhode Island American Cancer Society.
Habitat for Humanity Birmingham, AL Volunteer March 20 – March 27, 2011
Volunteered with a team of students completing urban renewal field projects during Spring Break.
INTERESTS AND SKILLS Software: Lotus Notes, SQL, Excel, Word, PowerPoint Interests: Swimming, Snowboarding, Reading, Baseball, Hiking, Cooking

5 James Street, Westerly, RI 02891 [email protected]
401.742.3576
Michael R. Giancaspro Education University of Rhode Island, Kingston, RI • Bachelor of Science in Business Administration, December, 2013. • GPA: 3.67/4.00. • Major: Accounting.
Related Coursework Upper Level Business Courses Intermediate Accounting 1&2, Financial Management, Organizational Behavior, Supply Chain Management, Business Law. Notable Accomplishments • Deans list • First Degree Black belt; Shorin-ryu Shorinkan Karate
Work Experience Seafood Haven Westerly RI 05/05-Present Senior Cook: • Investigated theft and notified owner of findings of theft exceeding 1000 dollars • Retrieved change from bank, restaurant deposit box and closed out cash register
• Resolved customer disputes and complaints in a fair and effective manner
• Managed opening and closing shifts which consisted of:
o Stocking all areas of the restaurant
o Inspection and preparation of food – raw and 'ready to eat food'
o Managed 4-5 high school teenagers
o Trained new employees regardless of their position
o Coordinating all kitchen and front end activities
o Performed any necessary job function not being fulfilled on a given day
Janco Company / Burger King Westerly, RI 02/13-Present
Team member:
• Prepared Food according to State/Store health and sanitation policies
• Cleaned the restaurant according to State/Store standards and regulations
• Trained new employees in food preparation and sanitation procedures according to State/Store regulations

Stephen Gross School: 2 Gardenia Lane • Narragansett, RI • 02882
Home: 1646 Rogers Court • Wall, NJ • 07719 [email protected] • [email protected] • 732-272-7311
OBJECTIVE To obtain a position in the accounting field in which I can apply my strong analytical and communication skills.
EDUCATION University of Rhode Island, Kingston, RI
• Masters of Science in Accountancy expected in December 2013 University of Rhode Island, Kingston, RI
• Bachelor of Science in Business Administration, Summa Cum Laude, December 2012 • Major: Accounting GPA: 3.89 • Academic Honors: Centennial Scholarship, Dean’s List (7), Beta Gamma Sigma, Beta Alpha Psi
RELATED EXPERIENCE Aetna Inc., Dental & Vision Finance Summer Associate, Hartford, CT Summer 2012
• Identified and corrected the various weaknesses in the competitive intelligence process • Outlined and streamlined the processes used in creating the financials for the Strategic Plan • Created and implemented multiple Microsoft Access databases to identify and resolve monthly
membership variances • Participated in, and contributed to, a cross functional group capstone project
Rogers Corporation, Accounting Operations Intern, Rogers, CT Summer & Winter 2011 • Assisted with the Month-end and Year-end Closing Process • Constructed budgeting and forecasting templates using Host Analytics software • Updated and analyzed the weekly sales report • Researched, corrected, and explained variances to supervisors • Audited travel and expense reports • Reviewed and streamlined accounting processes
Global Spectrum, Finance Intern, Kingston, RI Fall 2011 • Prepared files and reports for both internal and external auditors • Audited ticket sales reports for amounts of $1 million or more • Investigated and reconciled daily deposit slips • Created an inventory list of the company’s assets
Loeb & Haas, LLC, Unpaid Intern, South Amboy, NJ Winter 2010 • Assisted a small tax preparation service located in New Jersey • Worked with clients to produce accurate federal and state tax returns • Performed monthly bank reconciliations and made adjusting/closing entries into the
general ledger
LEADERSHIP URI 101 Mentor, College of Business, University of Rhode Island, Kingston RI Fall 2012
• Co-teach a class of 16 freshmen, assisting in their transition from high school to college VP Service Events, Beta Alpha Psi, University of Rhode Island Spring 2012 – Present
• Organized community service events and coordinated with other student leaders Treasurer, Sailing Club, University of Rhode Island Fall 2010 – Present Referee, Soccer, Monmouth Ocean Soccer Association (MOSA) 2004 – 2013
ADDITIONAL EXPERIENCE PricewaterhouseCoopers Xtax, Team Member, University of Rhode Island Fall 2010 & Fall 2012
• Collaborated with peers to form a creative solution to a tax research question SKILLS
Computer: MS Office, Peoplesoft, Nvision, Host Analytics, Datawarehouse, QuickBooks, Drake Other skills: Six Sigma Yellow Belt LEAN Class

PARK HING GUO
32 Debbie Road ▪ Middletown, RI 02842 ▪ (401)-855-5481 ▪ [email protected]
EDUCATION
University of Rhode Island, Kingston, RI Master of Science in Accounting Expected December 2013
University of Rhode Island, Kingston, RI
Bachelor of Science in Business Administration, Summa Cum Laude December 2012 Major: Accounting Grade Point Average: 3.72/4.00 Beta Gamma Sigma, Dean’s List—Every semester Anderson Family Trust Scholarship, Andrew Hoban Memorial Scholarship, Hedison Family Scholarship and T J
& M E Sullivan Scholarship
EDUCATIONAL HIGHLIGHTS
RAM Fund February 2013- Present Utilized Excel to analyze raw data relating to the information technology sector
Kugel Mesh Advanced Audit Project February 2013-March 2013
Tested a sample of attorneys’ claimed expenses related to a multi-district litigation Documented findings within a formal report to district court judge
PricewaterhouseCoopers URI xTax Competition October 2012
Outlined solutions for fictitious company to achieve greatest long-tem benefit with peers Delivered a professional oral presentation supplemented by PowerPoint to PwC partners
RELATED EXPERIENCE
Ryan Center, Audit Intern, Kingston, RI January 2012-May 2012 Audited box office’s daily sales reports to ensure accuracy and compliance Assisted supervisor in box office’s cash audit Created audit manual in accordance to set procedures for future intern reference
VITA Program, Volunteer Tax Preparer, Newport, RI February 2012- April 2012 Enrolled in IRS tax preparation training and passed mandatory examination Utilized Taxwise program to prepare federal and state tax returns for taxpayers Greeted taxpayers and answered general inquiries regarding their tax situations
OTHER EXPERIENCE
Ching Tao Chinese Restaurant, Customer Attendant/Food Packer, Middletown, RI June 2007-Present Collected payment from customers and provided change Operated restaurant’s POS system to serve customers Packed and ensured food is cooked to customer specification
Rhode Island Department of Transportation, Student Office Assistant, Tiverton, RI May 2012-August 2012
Created, updated, and revised files related to government-funded contracts Handled copying and scanning of documents for office and upper management use Assisted in miscellaneous field work related to contracts
LEADERSHIP EXPERIENCE
URI 101, Mentor, University of Rhode Island, Kingston, RI September 2012-December 2012 Co-taught a class of twenty-one freshmen with a focus of transition to college life Created and implement lessons pertaining to campus involvement, utilizing campus resources, and time
management
SKILLS
Computer: Microsoft desktop applications, Taxwise, Minitab, basic SQL functions

Peter J. Hathaway Education University of Rhode Island, Kingston, RI • Bachelor of Science in Business Administration, May, 2014. • GPA: 3.99/4.00. • Major: Finance.
Related Coursework Upper Level Business Courses Intermediate Accounting, Financial Management, Security Analysis, Financial Institutions & Markets, Organizational Behavior, Marketing Principles, Supply Chain Management Notable Accomplishments • Awarded seat on College of Business Student Advisory Council. • Awarded spot in the College of Business’s Investing RamFund as Junior. • Served on URI Student Senate.
Work Experience Deer Brook Development Corporation, Warwick, RI May 2007–2013 Contractor & Assistant Project Coordinator • Coordinated 14 contractor crews to ensure home construction specifications and deadlines were met. • Assisted in the construction of homes in Exeter, RI which sold on average for $400,000. • Managed material shipments and deliveries. • Prepared finished homes for showings and closings. High School Team Policy Debate Case Consultant & Coach October 2008–2010 • Served as coach for five high school debaters from New Jersey & Massachusetts, four of whom went
on to finish in the top 25 nationally; served as ad hoc consultant to 20 other debaters. • Presented a series of lectures for 70+ students at a three-day high school debate seminar held at the
Foundation for Economic Education in Irvington-on-Hudson, NY. Law Office of David B. Hathaway, Esq., Warwick, RI June 2005–2012 Legal Assistant to the Attorney • Assisted attorney in processing client personal information to prepare cases for federal court filing. • Answered calls and interacted with clients to assist in meeting their legal counsel needs. Leadership Experience URI 101 Business Mentor • URI 101 mentor with an influential role in helping a class of 25 freshmen in their transition to college. URI Football Manager • Worked as manager for URI football under Quarterbacks’ coach Liam Coen for spring camp 2012. Finance & Accounting Tutor • Serves as a paid tutor for the College of Business for Financial Management. Debate club instructor • Taught high school NCFCA debaters at biweekly club meetings. Oversaw group research projects and
critiqued debate cases and presentations.
165 Tripps Corner Road, Exeter, RI 02822 [email protected]
401.369.1440

John Kashmanian 60 Connors Farm Drive, Smithfield, Rhode Island 02917
Home: 401-232-3508 Cell: 401-480-8568 [email protected]
EDUCATION: University of Rhode Island, Kingston, RI Bachelor in Science of Business Administration, May 2013 Major: Finance 3.2 Cumulative GPA BUSINESS EXPERIENCE: The Virtus Group, Providence, RI Wealth Management Intern January, 2013-Present
• Produce portfolio reviews to show performance and project future prospects • Assemble Excel worksheets for clients and update for current market values of accounts • Ensure that advisor is operating under compliance regulations of broker/dealer • Assist in the advisor marketing process through the creation of prospecting letters, e-
mails, and planning client events Ram Fund Equity Portfolio, University of Rhode Island, Kingston, RI Student Manager January, 2013-Present
• Co-manage $200,000 small/mid-cap value-based portfolio • Build discounted cash flow valuation models using Excel • Investigate potential hedge fund applications using options and futures contracts • Present results to experienced industry professionals
Ocean State Financial Services, East Providence, RI Volunteer Assistant to Financial Advisor December, 2011-February, 2012
• Organized documents and files in preparation for meetings with clients • Helped to complete documents used to analyze financial needs of clients • Performed administrative work such as answering client calls, printing screens, making
copies, faxes, etc. OTHER EXPERIENCE: Chelo’s Restaurant on the Waterfront, East Greenwich, RI Customer-Order Interaction, May, 2011- September, 2012 LEADERSHIP/ACTIVITIES:
• University of Rhode Island Baseball Team Pitcher, September, 2009-February, 2011
• Curtis Corner Middle School Baseball Team Assistant Coach, March, 2012-Present

Benjamin R. Kupa 155 Austin Farm Rd. ▪ Exeter, RI 02822 ▪ (401) 263-1159
[email protected] EDUCATION University of Rhode Island, Kingston, RI College of Business Administration Masters of Science, Accounting, May 2014 Bachelor of Science Degree in Business Administration, December 2012, Summa Cum Laude
• GPA: 3.86, Accounting GPA: 3.96 HONORS Beta Gamma Sigma International Honor Society National Society of Collegiate Scholars Phi Eta Sigma National Honor Society Dean's list 7 semesters ACADEMIC HIGHLIGHTS MSA Advanced Audit Project
• Tested a sample obtained using monetary unit sampling of attorneys' claimed expenses in a multi-district litigation
• Communicated findings to the district court judge using a formal report consisting of written portions, and pivot tables created in excel
Ram Fund (Student Investment Fund)
• Utilized various Microsoft excel functions to create usable financial information from raw data
PWC xTAX Competition
• Collaborated with peers to create innovative solutions to tax research questions • Formally communicated solutions to PWC partners and faculty
EXPERIENCE University of Rhode Island, Kingston, RI Graduate Assistant January 2013 to Present
• Tutored Freshman to Senior level accounting students in Financial, Managerial, Intermediate, Cost, and Tax accounting
• Scheduled volunteer tutors • Performed data entry and analysis for accounting faculty to assist with research projects
Student Assistant (Dean's Office) August 2009 to December 2012
• Mastered knowledge required to respond to real-time questions and needs of students and faculty
• Supported faculty and administrative staff with diverse routine and non-routine tasks
SPECIAL SKILLS Technical
• Proficient with a wide range of Windows based software, such as Microsoft Word, Excel, PowerPoint, Minitab 14, and PeopleSoft

Jared Moreau 28 Valley View Drive Cell: 401-862-2783 Smithfield, Rhode Island 02828 [email protected]
Education University of Rhode Island - Kingston, RI Bachelor of Science in Business Administration: Finance May 2013 GPA: 3.5 (Fall 2012) Dean’s List, Cumulative GPA: 3.0 Organization Ram Fund Student Managed Investment Fund Spring 2013
10 hand-selected seniors engage in equity portfolio management of $100,000 contributed by alumni. Students function as research analysts ranking all firms in a given industry by valuation and profitability ratios. Investment analysis uses Microsoft Excel to employ various financial models and project financial statements five years into future. Analyst reports are presented before industry professionals at Fidelity Investments in Smithfield, Rhode Island.
Professional Classes to Masses– Newport, Rhode Island Experience Consulting Intern February 2013-Present
• Endorsed communication skills, door-to-door marketing requesting interviews • Perform detailed analysis of data collected and determine how to modify various aspects of
business to maximize profit and/or reduce costs • Research database to find professionals that will provide best quality service to client • Develop resource presentation to ascertain their service is best fit for business • Connect business client and resource, follow up to analyze resource’s service
Citizens Wealth Management – East Providence, Rhode Island Operations Specialist/Intern June-August, 2012
• Managed account maintenance, analyzed client investment forms to assure goals were parallel with investment choices, and established new accounts
• Exemplify interpersonal abilities conveying with Financial Consultants and management resolving time-sensitive issues and customer transactions
• Worked with Fidelity’s National Financial programs Streetscape and FBSI Volunteer Income Tax Assistance Program (VITA) May 2010 IRS-certified to provide clients assistance with basic income tax preparation. Comprehend various tax forms and described information to clients. Collected and organized client information to prepare tax returns. Clients were informed of tax credits for which they qualified. Skills Personal: Detail-oriented and organized, proficient multi-tasking ability, excellent written and verbal communication, extensive analytical and quantitative experience Excel (Intermediate): Pivot tables, data tables, nested if-statements, VLOOKUPS, etc…
Objective: To secure a position that enables me to use my financial and interpersonal skills, education, and experience
in finance that creates opportunity for advancement.

BRYAN P. POSTON 43 AUBURN DRIVE, CHARLESTOWN, RI 02813 - (401) 258-5490 - [email protected]
EDUCATION University of Rhode Island - Kingston, RI Expected May 2014 College of Business Administration (AACSB Accredited)
Bachelor of Science: Finance 3.77 GPA (Honors Program)
Honors/Awards Phi Kappa Phi Omicron Delta Kappa Beta Gamma Sigma Phi Eta Sigma member - Freshman Honor Society based on service and GPA University College Scholar - Awarded to 10 URI students of the previous year's freshman class.
Chosen from approximately 3000 students. URI College of Business Research Center Scholarship for Excellence in Finance
WORK EXPERIENCE URI Ram Fund - Kingston, RI September 2012 - Present Student Analyst
Co-managed a $220,000 real-money small/mid cap value based portfolio Used Fundamental analysis to generate buy, hold, and sell recommendations Presented and pitched potential industries/securities for investment in the basic materials sector Analyzed a market sector and researched companies for potential investments
GTECH Corporation - Providence, RI May 2011 - Present Intern - Corporate Financial Planning and Analysis
Assisted in preparing financial reports and projections for the executive committee Analyzed profitability (EBITDA), capital expenditures, and cash flow for Lottomatica Group Aided the Vice President in presentation duties and the Director of Finance for data analysis
URI Academic Enhancement Center - Kingston, RI September 2011 - Present Business/Mathematics Tutor
Worked with students to review course material, develop effective study methods, and reduce academic anxiety
VOLUNTEER EXPERIENCE Angel Ride Charitable Trust - Old Lyme, CT January 2013 - Present Intern/Volunteer
Documented the organization and preparation for the 10th annual Angel Ride, benefiting young children with debilitating diseases in the state of Connecticut
Coordinated with race planners in order to document and solidify the race preparation process
ATTRIBUTES Computer Systems
SAP Business Warehouse - Data input, reporting, and analysis of financial data SAP Business Objects Planning and Consolidation - Reporting and Administration (Power User) Proficient in Microsoft Office including advanced excel functions such as pivot tables, vlookups,
and nested if statements.
Other Awards Boy Scouts of America Eagle Scout - Silver Palm
LUIS RONDON 107 BEACON AVENUE PROVIDENCE, RI 02903 (401) 527-5214
Education University of Rhode Island Kingston, RI
Bachelor of Science: Business Administration (Finance) Anticipated 05/14
GPA: 3.27
Community College of Rhode Island Warwick, RI
Associates in Science: General Business Conferred 05/12
Associates in Arts: General Studies Conferred 05/12
GPA: 3.01
Work Experience Community College of Rhode Island CCRI Bookstore Student Manager September 2009 to May 2012
• Served as a supervisor for college work-study students employed with the bookstore. • Balanced cash drawer and receipts; documented discrepancies. • Accepted cash or bankcards for payment; completed cash and bankcard transactions according to procedure. • Maintained sufficient amounts of change in cash drawers. • Established or identified prices of goods, services or admission, and tabulate bills using calculators, cash
registers, or optical price scanners. • Answered customer questions, and provided information on procedures or policies. • Calculated discounts; requested customer identification for certain discounts and receipts as required. • Assisted in other areas of store, such as clean-up, shelf-stocking, or keeping merchandise displayed in an
orderly manner. • Resolved customer Issues. • Trained new college work-study students.
Leadership and Organizational Activities • Tutoring, University of Rhode Island, Financial Management February 2013 to May 2013
• Member, Community College of Rhode Island, Student Leadership Team September 2010 to May 2012 • President of the Latino American Student Organization, Community College of Rhode Island, 2012
Computer Skills • Microsoft Office Software 2010 (PowerPoint, Excel, Word, Front Page), Windows Vista and 7. • Efficient at learning and implementing new computer programs.
Languages
• Fluent in Spanish with both speaking and in writing.