“The Racial Wealth Divide in Baltimore” - Prosperity Now · Baltimore has 30,000 vacant homes...
16
JANUARY 2017 Baltimore
Transcript of “The Racial Wealth Divide in Baltimore” - Prosperity Now · Baltimore has 30,000 vacant homes...
JANUARY 2017
Baltimore
The Racial Wealth Divide in Baltimore
For more information, visit www.cfed.org/rwd2 JANUARY 2017
Dear Reader,
The racial wealth divide is broad and deep in thousands of communities across the United States. The issue of wealth inequality has a multitude of ramifications for communities and families.
The Racial Wealth Divide Initiative at CFED developed this profile to better understand how racial economic inequality affects Baltimore. This profile is also one of the first steps taken under the Building High Impact Nonprofits of Color project, funded by JPMorgan Chase. This project aims to advance best practices and strengthen resources for nonprofits of color.
How do I use this data profile?The following profile presents data on the economic inequalities within Baltimore. These statistics may seem overwhelming. However, we know with more information about the challenges of racial economic inequality, there is greater opportunity to identify best practices and policies that can address the racial wealth divide.
Baltimore and the rest of the nationRacial economic inequality in Baltimore is very similar to the nation. In Baltimore Blacks have a median household income that is 54% of that of Whites, while nationally Blacks have 60% of White income. The small Latino community in Baltimore has 70% of the income of Whites compared to Latinos having 72% of White income nationally. The very small Asian community in Baltimore sees the biggest difference in national racial inequality trends. In Baltimore Asians have 84% the income of Whites whereas nationwide Asian Americans have a much higher income making 124% of what Whites on average make.
What’s next?CFED’s Racial Wealth Divide Initiative is working in Baltimore to build the capacity of nonprofits of color (see pages 14 & 15 for more information) so that they are better positioned in their field to further their impact in the communities that need them most. We believe that in order to address the significant financial insecurity facing families and communities of color, we must strengthen the local organizations of color that are on the frontlines addressing these communities needs and concerns and providing greater economic opportunity.
Sincerely,
Dedrick Asante-MuhammadDirector, Racial Wealth Divide Initiative, CFED
The Racial Wealth Divide in Baltimore
POPULATION
MEDIAN INCOME
ZERO NET WORTH
UNEMPLOYMENT RATE
The average White household makes nearly
the income of the average Black household
the rate for White workers
The unemployment rate of workers of color in Baltimore is
of households of color in Baltimore have zero net worth
For more information, visit www.cfed.org/rwd
3X
The Racial Wealth Divide in Baltimore
BALTIMORE HIGHLIGHTS
RACIAL WEALTH DIVIDE INITIATIVE For more information, visit www.cfed.org/rwd
1/3
2X
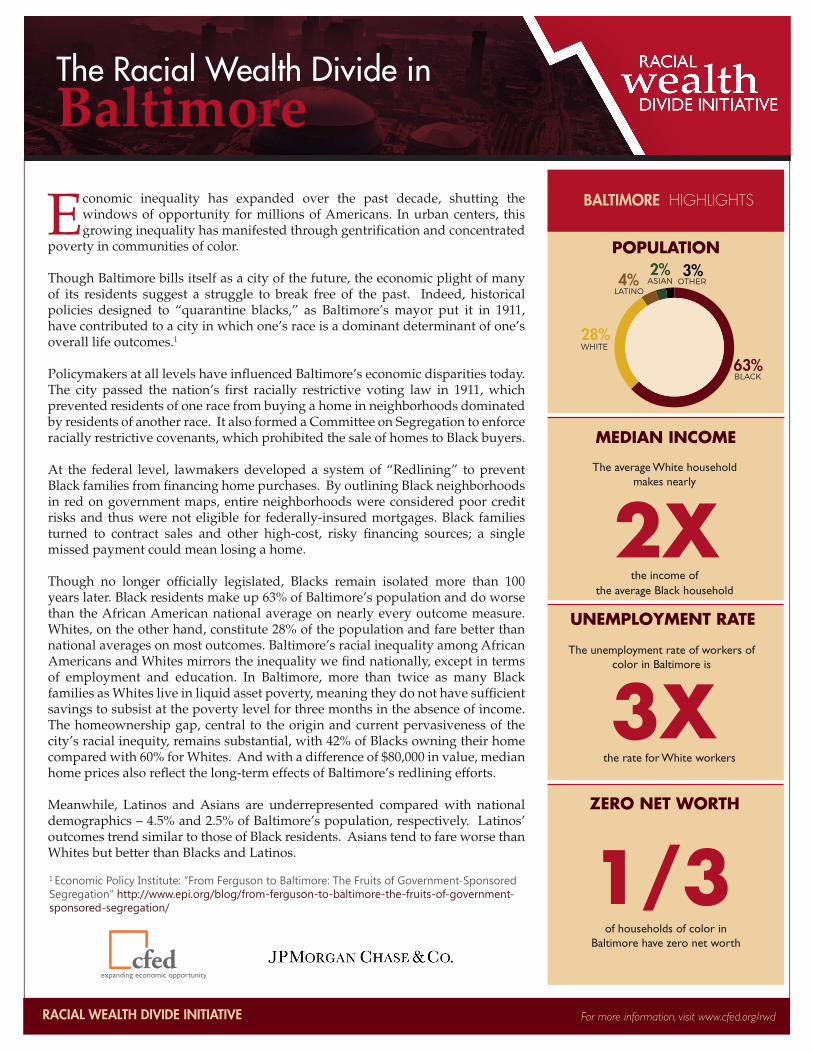
Economic inequality has expanded over the past decade, shutting the windows of opportunity for millions of Americans. In urban centers, this growing inequality has manifested through gentrification and concentrated
poverty in communities of color.
Though Baltimore bills itself as a city of the future, the economic plight of many of its residents suggest a struggle to break free of the past. Indeed, historical policies designed to “quarantine blacks,” as Baltimore’s mayor put it in 1911, have contributed to a city in which one’s race is a dominant determinant of one’s overall life outcomes.1
Policymakers at all levels have influenced Baltimore’s economic disparities today. The city passed the nation’s first racially restrictive voting law in 1911, which prevented residents of one race from buying a home in neighborhoods dominated by residents of another race. It also formed a Committee on Segregation to enforce racially restrictive covenants, which prohibited the sale of homes to Black buyers.
At the federal level, lawmakers developed a system of “Redlining” to prevent Black families from financing home purchases. By outlining Black neighborhoods in red on government maps, entire neighborhoods were considered poor credit risks and thus were not eligible for federally-insured mortgages. Black families turned to contract sales and other high-cost, risky financing sources; a single missed payment could mean losing a home.
Though no longer officially legislated, Blacks remain isolated more than 100 years later. Black residents make up 63% of Baltimore’s population and do worse than the African American national average on nearly every outcome measure. Whites, on the other hand, constitute 28% of the population and fare better than national averages on most outcomes. Baltimore’s racial inequality among African Americans and Whites mirrors the inequality we find nationally, except in terms of employment and education. In Baltimore, more than twice as many Black families as Whites live in liquid asset poverty, meaning they do not have sufficient savings to subsist at the poverty level for three months in the absence of income. The homeownership gap, central to the origin and current pervasiveness of the city’s racial inequity, remains substantial, with 42% of Blacks owning their home compared with 60% for Whites. And with a difference of $80,000 in value, median home prices also reflect the long-term effects of Baltimore’s redlining efforts.
Meanwhile, Latinos and Asians are underrepresented compared with national demographics – 4.5% and 2.5% of Baltimore’s population, respectively. Latinos’ outcomes trend similar to those of Black residents. Asians tend to fare worse than Whites but better than Blacks and Latinos.
BLACK
LATINOASIAN
WHITE
63%
4%2%
28%
OTHER3%
1 Economic Policy Institute: “From Ferguson to Baltimore: The Fruits of Government-Sponsored Segregation” http://www.epi.org/blog/from-ferguson-to-baltimore-the-fruits-of-government-sponsored-segregation/
For more information, visit www.cfed.org/rwd
The Racial Wealth Divide in Baltimore
For more information, visit www.cfed.org/rwd4 JANUARY 2017
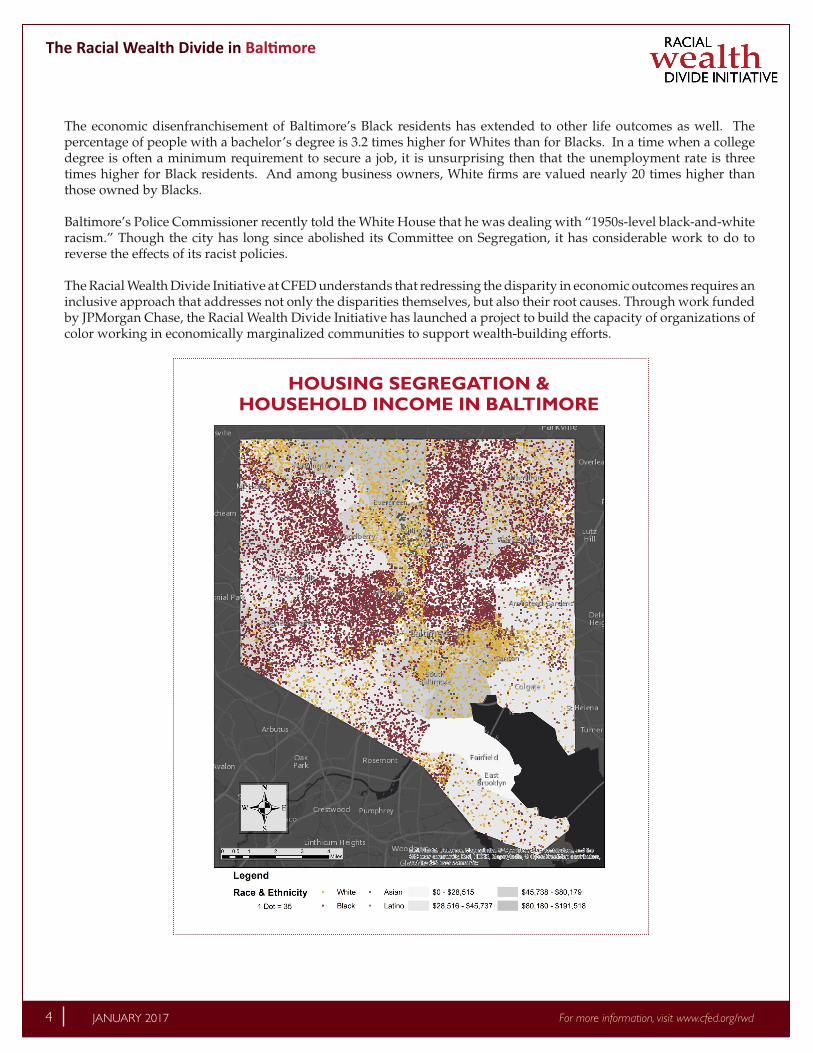
The economic disenfranchisement of Baltimore’s Black residents has extended to other life outcomes as well. The percentage of people with a bachelor’s degree is 3.2 times higher for Whites than for Blacks. In a time when a college degree is often a minimum requirement to secure a job, it is unsurprising then that the unemployment rate is three times higher for Black residents. And among business owners, White firms are valued nearly 20 times higher than those owned by Blacks.
Baltimore’s Police Commissioner recently told the White House that he was dealing with “1950s-level black-and-white racism.” Though the city has long since abolished its Committee on Segregation, it has considerable work to do to reverse the effects of its racist policies.
The Racial Wealth Divide Initiative at CFED understands that redressing the disparity in economic outcomes requires an inclusive approach that addresses not only the disparities themselves, but also their root causes. Through work funded by JPMorgan Chase, the Racial Wealth Divide Initiative has launched a project to build the capacity of organizations of color working in economically marginalized communities to support wealth-building efforts.
HOUSING SEGREGATION & HOUSEHOLD INCOME IN BALTIMORE
5
5
The Racial Wealth Divide in Baltimore
For more information, visit www.cfed.org/rwd For more information, visit www.cfed.org/rwd 5 JANUARY 2017For more information, visit www.cfed.org/rwd
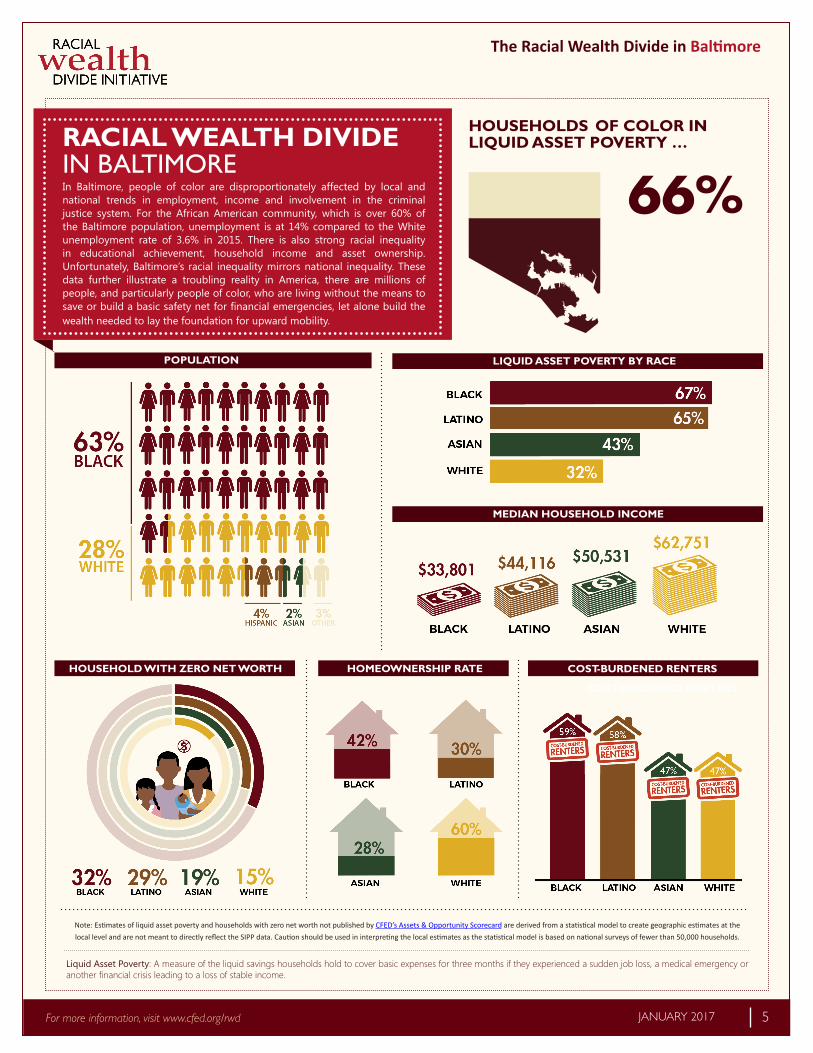
RACIAL WEALTH DIVIDE IN BALTIMOREIn Baltimore, people of color are disproportionately affected by local and national trends in employment, income and involvement in the criminal justice system. For the African American community, which is over 60% of the Baltimore population, unemployment is at 14% compared to the White unemployment rate of 3.6% in 2015. There is also strong racial inequality in educational achievement, household income and asset ownership. Unfortunately, Baltimore’s racial inequality mirrors national inequality. These data further illustrate a troubling reality in America, there are millions of people, and particularly people of color, who are living without the means to save or build a basic safety net for financial emergencies, let alone build the wealth needed to lay the foundation for upward mobility.
POPULATION
Note: Estimates of liquid asset poverty and households with zero net worth not published by CFED’s Assets & Opportunity Scorecard are derived from a statistical model to create geographic estimates at the local level and are not meant to directly reflect the SIPP data. Caution should be used in interpreting the local estimates as the statistical model is based on national surveys of fewer than 50,000 households.
HOUSEHOLD WITH ZERO NET WORTH
66%
HOUSEHOLDS OF COLOR IN LIQUID ASSET POVERTY …
MEDIAN HOUSEHOLD INCOME
LIQUID ASSET POVERTY BY RACE
HOMEOWNERSHIP RATE
COST-BURDENED RENTERS
COST-BURDENED RENTERS
Liquid Asset Poverty: A measure of the liquid savings households hold to cover basic expenses for three months if they experienced a sudden job loss, a medical emergency or another financial crisis leading to a loss of stable income.
For more information, visit www.cfed.org/rwd
The Racial Wealth Divide in Baltimore
For more information, visit www.cfed.org/rwd6 JANUARY 2017
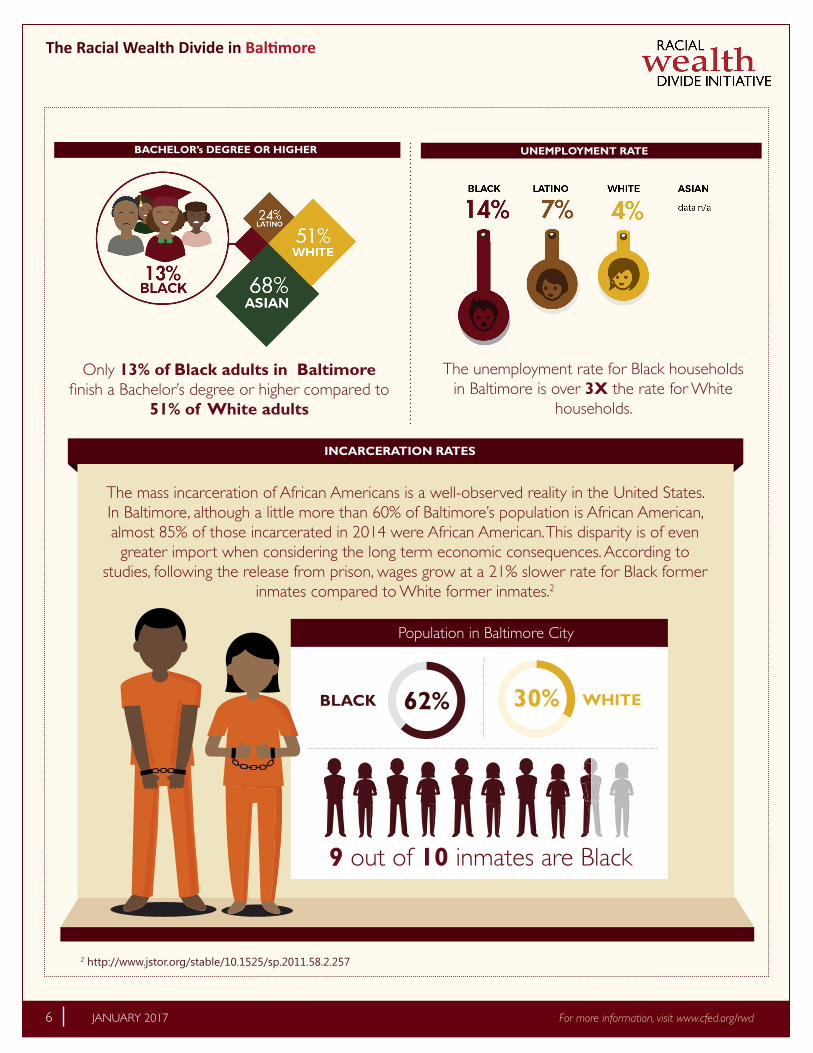
BACHELOR’s DEGREE OR HIGHER UNEMPLOYMENT RATE
INCARCERATION RATES
Only 13% of Black adults in Baltimore finish a Bachelor’s degree or higher compared to
51% of White adults
The mass incarceration of African Americans is a well-observed reality in the United States. In Baltimore, although a little more than 60% of Baltimore’s population is African American, almost 85% of those incarcerated in 2014 were African American. This disparity is of even
greater import when considering the long term economic consequences. According to studies, following the release from prison, wages grow at a 21% slower rate for Black former
inmates compared to White former inmates.2
The unemployment rate for Black households in Baltimore is over 3X the rate for White
households.
62% 30% WHITEBLACK
9 out of 10 inmates are Black
Population in Baltimore City
2 http://www.jstor.org/stable/10.1525/sp.2011.58.2.257
7
7
The Racial Wealth Divide in Baltimore
For more information, visit www.cfed.org/rwd For more information, visit www.cfed.org/rwd 7 JANUARY 2017For more information, visit www.cfed.org/rwd
UNEMPLOYMENT RATE
2 http://www.jstor.org/stable/10.1525/sp.2011.58.2.257
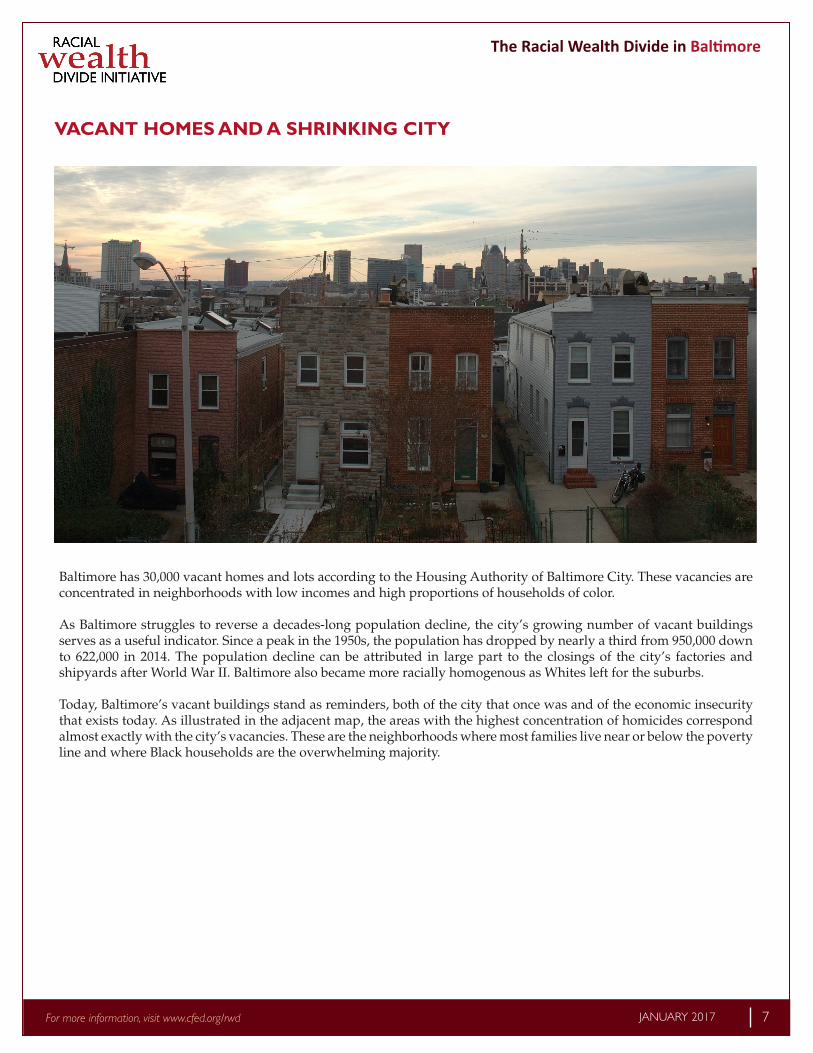
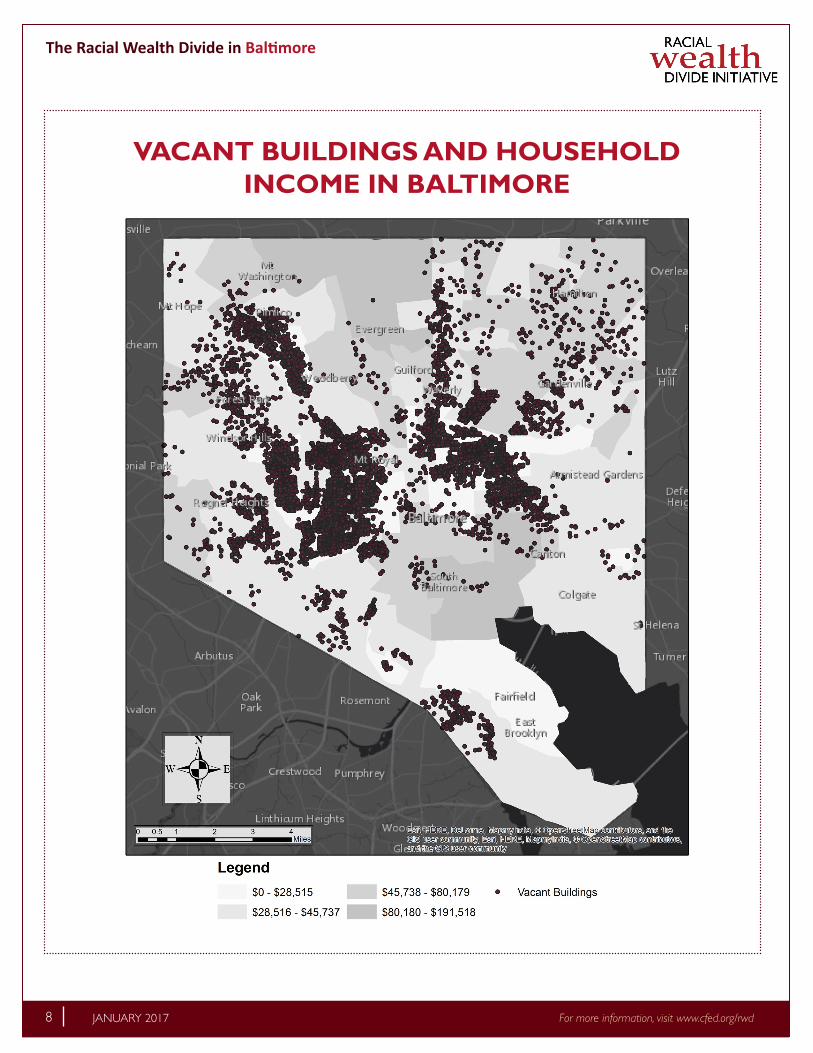
VACANT HOMES AND A SHRINKING CITY
Baltimore has 30,000 vacant homes and lots according to the Housing Authority of Baltimore City. These vacancies are concentrated in neighborhoods with low incomes and high proportions of households of color.
As Baltimore struggles to reverse a decades-long population decline, the city’s growing number of vacant buildings serves as a useful indicator. Since a peak in the 1950s, the population has dropped by nearly a third from 950,000 down to 622,000 in 2014. The population decline can be attributed in large part to the closings of the city’s factories and shipyards after World War II. Baltimore also became more racially homogenous as Whites left for the suburbs.
Today, Baltimore’s vacant buildings stand as reminders, both of the city that once was and of the economic insecurity that exists today. As illustrated in the adjacent map, the areas with the highest concentration of homicides correspond almost exactly with the city’s vacancies. These are the neighborhoods where most families live near or below the poverty line and where Black households are the overwhelming majority.
The Racial Wealth Divide in Baltimore
For more information, visit www.cfed.org/rwd8 JANUARY 2017
VACANT BUILDINGS AND HOUSEHOLD INCOME IN BALTIMORE
9
9
The Racial Wealth Divide in Baltimore
For more information, visit www.cfed.org/rwd For more information, visit www.cfed.org/rwd 9 JANUARY 2017
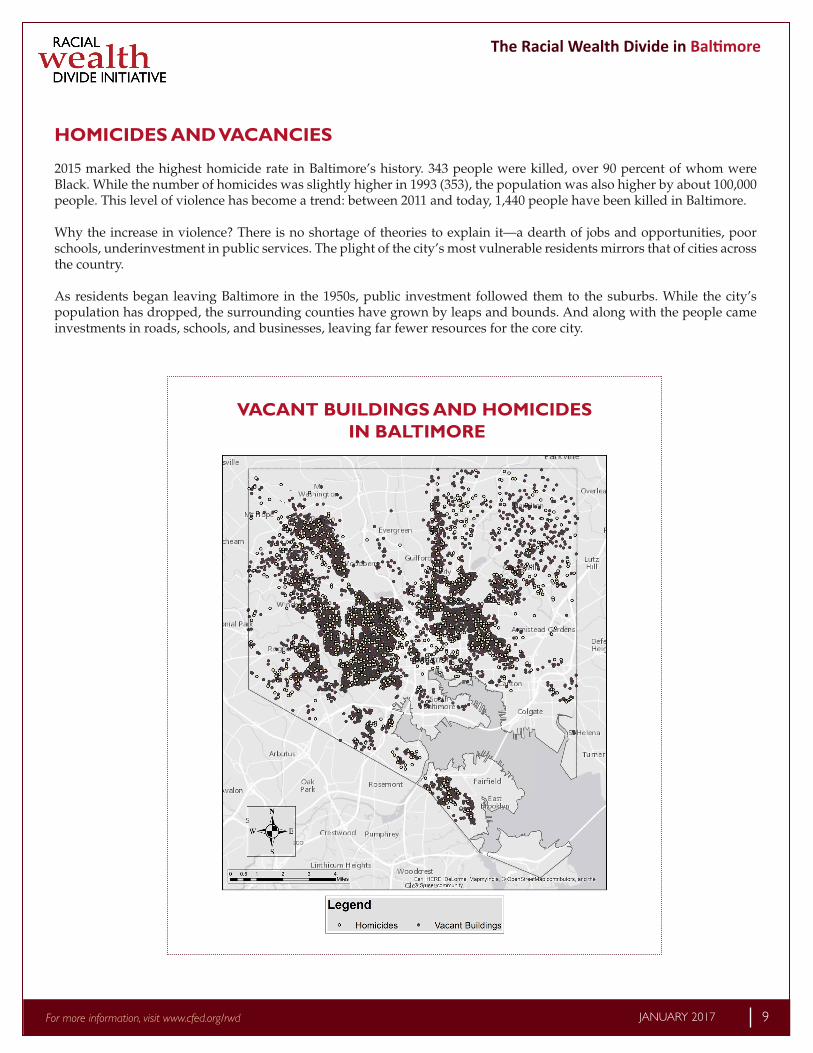
HOMICIDES AND VACANCIES
2015 marked the highest homicide rate in Baltimore’s history. 343 people were killed, over 90 percent of whom were Black. While the number of homicides was slightly higher in 1993 (353), the population was also higher by about 100,000 people. This level of violence has become a trend: between 2011 and today, 1,440 people have been killed in Baltimore.
Why the increase in violence? There is no shortage of theories to explain it—a dearth of jobs and opportunities, poor schools, underinvestment in public services. The plight of the city’s most vulnerable residents mirrors that of cities across the country.
As residents began leaving Baltimore in the 1950s, public investment followed them to the suburbs. While the city’s population has dropped, the surrounding counties have grown by leaps and bounds. And along with the people came investments in roads, schools, and businesses, leaving far fewer resources for the core city.
VACANT BUILDINGS AND HOMICIDES IN BALTIMORE
For more information, visit www.cfed.org/rwd
The Racial Wealth Divide in Baltimore
For more information, visit www.cfed.org/rwd10 JANUARY 2017
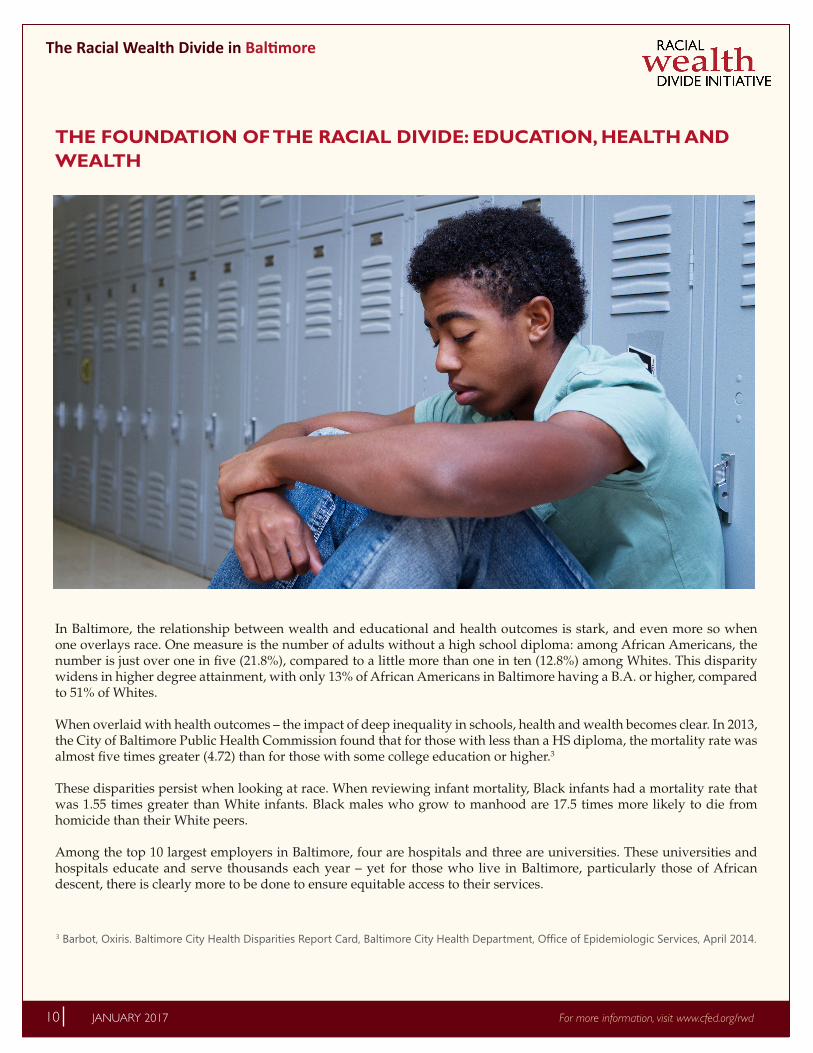
THE FOUNDATION OF THE RACIAL DIVIDE: EDUCATION, HEALTH AND WEALTH
In Baltimore, the relationship between wealth and educational and health outcomes is stark, and even more so when one overlays race. One measure is the number of adults without a high school diploma: among African Americans, the number is just over one in five (21.8%), compared to a little more than one in ten (12.8%) among Whites. This disparity widens in higher degree attainment, with only 13% of African Americans in Baltimore having a B.A. or higher, compared to 51% of Whites.
When overlaid with health outcomes – the impact of deep inequality in schools, health and wealth becomes clear. In 2013, the City of Baltimore Public Health Commission found that for those with less than a HS diploma, the mortality rate was almost five times greater (4.72) than for those with some college education or higher.3
These disparities persist when looking at race. When reviewing infant mortality, Black infants had a mortality rate that was 1.55 times greater than White infants. Black males who grow to manhood are 17.5 times more likely to die from homicide than their White peers.
Among the top 10 largest employers in Baltimore, four are hospitals and three are universities. These universities and hospitals educate and serve thousands each year – yet for those who live in Baltimore, particularly those of African descent, there is clearly more to be done to ensure equitable access to their services.
3 Barbot, Oxiris. Baltimore City Health Disparities Report Card, Baltimore City Health Department, Office of Epidemiologic Services, April 2014.
11
11
The Racial Wealth Divide in Baltimore
For more information, visit www.cfed.org/rwd For more information, visit www.cfed.org/rwd 11 JANUARY 2017For more information, visit www.cfed.org/rwd
“-“ indicates that no data is available
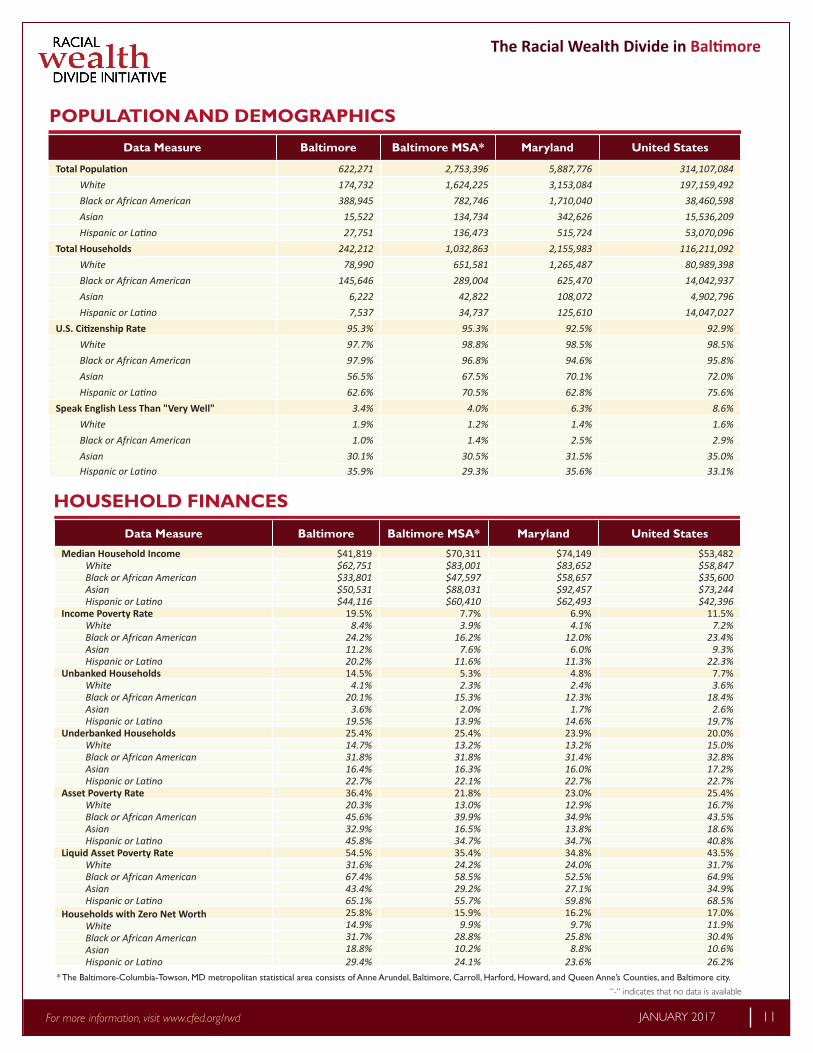
POPULATION AND DEMOGRAPHICS
HOUSEHOLD FINANCES
Data Measure Baltimore Baltimore MSA* Maryland United States
Total Population 622,271 2,753,396 5,887,776 314,107,084White 174,732 1,624,225 3,153,084 197,159,492Black or African American 388,945 782,746 1,710,040 38,460,598Asian 15,522 134,734 342,626 15,536,209Hispanic or Latino 27,751 136,473 515,724 53,070,096
Total Households 242,212 1,032,863 2,155,983 116,211,092White 78,990 651,581 1,265,487 80,989,398Black or African American 145,646 289,004 625,470 14,042,937Asian 6,222 42,822 108,072 4,902,796Hispanic or Latino 7,537 34,737 125,610 14,047,027
U.S. Citizenship Rate 95.3% 95.3% 92.5% 92.9%White 97.7% 98.8% 98.5% 98.5%Black or African American 97.9% 96.8% 94.6% 95.8%Asian 56.5% 67.5% 70.1% 72.0%Hispanic or Latino 62.6% 70.5% 62.8% 75.6%
Speak English Less Than "Very Well" 3.4% 4.0% 6.3% 8.6%White 1.9% 1.2% 1.4% 1.6%Black or African American 1.0% 1.4% 2.5% 2.9%Asian 30.1% 30.5% 31.5% 35.0%Hispanic or Latino 35.9% 29.3% 35.6% 33.1%
Data Measure Baltimore Baltimore MSA* Maryland United States
Median Household Income $41,819 $70,311 $74,149 $53,482White $62,751 $83,001 $83,652 $58,847Black or African American $33,801 $47,597 $58,657 $35,600Asian $50,531 $88,031 $92,457 $73,244Hispanic or Latino $44,116 $60,410 $62,493 $42,396
Income Poverty Rate 19.5% 7.7% 6.9% 11.5%White 8.4% 3.9% 4.1% 7.2%Black or African American 24.2% 16.2% 12.0% 23.4%Asian 11.2% 7.6% 6.0% 9.3%Hispanic or Latino 20.2% 11.6% 11.3% 22.3%
Unbanked Households 14.5% 5.3% 4.8% 7.7%White 4.1% 2.3% 2.4% 3.6%Black or African American 20.1% 15.3% 12.3% 18.4%Asian 3.6% 2.0% 1.7% 2.6%Hispanic or Latino 19.5% 13.9% 14.6% 19.7%
Underbanked Households 25.4% 25.4% 23.9% 20.0%White 14.7% 13.2% 13.2% 15.0%Black or African American 31.8% 31.8% 31.4% 32.8%Asian 16.4% 16.3% 16.0% 17.2%Hispanic or Latino 22.7% 22.1% 22.7% 22.7%
Asset Poverty Rate 36.4% 21.8% 23.0% 25.4%White 20.3% 13.0% 12.9% 16.7%Black or African American 45.6% 39.9% 34.9% 43.5%Asian 32.9% 16.5% 13.8% 18.6%Hispanic or Latino 45.8% 34.7% 34.7% 40.8%
Liquid Asset Poverty Rate 54.5% 35.4% 34.8% 43.5%White 31.6% 24.2% 24.0% 31.7%Black or African American 67.4% 58.5% 52.5% 64.9%Asian 43.4% 29.2% 27.1% 34.9%Hispanic or Latino 65.1% 55.7% 59.8% 68.5%
Households with Zero Net Worth 25.8% 15.9% 16.2% 17.0%White 14.9% 9.9% 9.7% 11.9%Black or African American 31.7% 28.8% 25.8% 30.4%Asian 18.8% 10.2% 8.8% 10.6%Hispanic or Latino 29.4% 24.1% 23.6% 26.2%
* The Baltimore-Columbia-Towson, MD metropolitan statistical area consists of Anne Arundel, Baltimore, Carroll, Harford, Howard, and Queen Anne’s Counties, and Baltimore city.
The Racial Wealth Divide in Baltimore
For more information, visit www.cfed.org/rwd12 JANUARY 2017
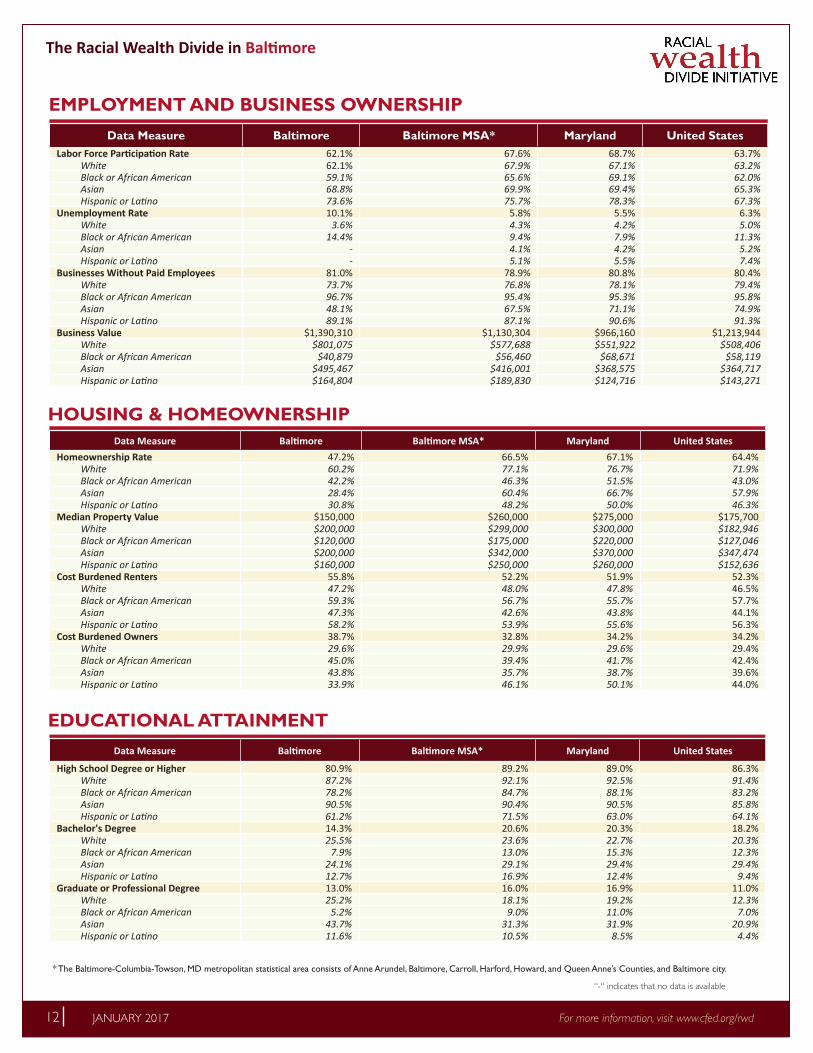
“-“ indicates that no data is available
EMPLOYMENT AND BUSINESS OWNERSHIP
HOUSING & HOMEOWNERSHIP
EDUCATIONAL ATTAINMENT
* The Baltimore-Columbia-Towson, MD metropolitan statistical area consists of Anne Arundel, Baltimore, Carroll, Harford, Howard, and Queen Anne’s Counties, and Baltimore city.
Data Measure Baltimore Baltimore MSA* Maryland United StatesLabor Force Participation Rate 62.1% 67.6% 68.7% 63.7%
White 62.1% 67.9% 67.1% 63.2%Black or African American 59.1% 65.6% 69.1% 62.0%Asian 68.8% 69.9% 69.4% 65.3%Hispanic or Latino 73.6% 75.7% 78.3% 67.3%
Unemployment Rate 10.1% 5.8% 5.5% 6.3%White 3.6% 4.3% 4.2% 5.0%Black or African American 14.4% 9.4% 7.9% 11.3%Asian - 4.1% 4.2% 5.2%Hispanic or Latino - 5.1% 5.5% 7.4%
Businesses Without Paid Employees 81.0% 78.9% 80.8% 80.4%White 73.7% 76.8% 78.1% 79.4%Black or African American 96.7% 95.4% 95.3% 95.8%Asian 48.1% 67.5% 71.1% 74.9%Hispanic or Latino 89.1% 87.1% 90.6% 91.3%
Business Value $1,390,310 $1,130,304 $966,160 $1,213,944White $801,075 $577,688 $551,922 $508,406Black or African American $40,879 $56,460 $68,671 $58,119Asian $495,467 $416,001 $368,575 $364,717Hispanic or Latino $164,804 $189,830 $124,716 $143,271
Data Measure Baltimore Baltimore MSA* Maryland United StatesHomeownership Rate 47.2% 66.5% 67.1% 64.4%
White 60.2% 77.1% 76.7% 71.9%Black or African American 42.2% 46.3% 51.5% 43.0%Asian 28.4% 60.4% 66.7% 57.9%Hispanic or Latino 30.8% 48.2% 50.0% 46.3%
Median Property Value $150,000 $260,000 $275,000 $175,700White $200,000 $299,000 $300,000 $182,946Black or African American $120,000 $175,000 $220,000 $127,046Asian $200,000 $342,000 $370,000 $347,474Hispanic or Latino $160,000 $250,000 $260,000 $152,636
Cost Burdened Renters 55.8% 52.2% 51.9% 52.3%White 47.2% 48.0% 47.8% 46.5%Black or African American 59.3% 56.7% 55.7% 57.7%Asian 47.3% 42.6% 43.8% 44.1%Hispanic or Latino 58.2% 53.9% 55.6% 56.3%
Cost Burdened Owners 38.7% 32.8% 34.2% 34.2%White 29.6% 29.9% 29.6% 29.4%Black or African American 45.0% 39.4% 41.7% 42.4%Asian 43.8% 35.7% 38.7% 39.6%Hispanic or Latino 33.9% 46.1% 50.1% 44.0%
Data Measure Baltimore Baltimore MSA* Maryland United States
High School Degree or Higher 80.9% 89.2% 89.0% 86.3%White 87.2% 92.1% 92.5% 91.4%Black or African American 78.2% 84.7% 88.1% 83.2%Asian 90.5% 90.4% 90.5% 85.8%Hispanic or Latino 61.2% 71.5% 63.0% 64.1%
Bachelor's Degree 14.3% 20.6% 20.3% 18.2%White 25.5% 23.6% 22.7% 20.3%Black or African American 7.9% 13.0% 15.3% 12.3%Asian 24.1% 29.1% 29.4% 29.4%Hispanic or Latino 12.7% 16.9% 12.4% 9.4%
Graduate or Professional Degree 13.0% 16.0% 16.9% 11.0%White 25.2% 18.1% 19.2% 12.3%Black or African American 5.2% 9.0% 11.0% 7.0%Asian 43.7% 31.3% 31.9% 20.9%Hispanic or Latino 11.6% 10.5% 8.5% 4.4%
13
13
The Racial Wealth Divide in Baltimore
For more information, visit www.cfed.org/rwd For more information, visit www.cfed.org/rwd 13 JANUARY 2017
* The Baltimore-Columbia-Towson, MD metropolitan statistical area consists of Anne Arundel, Baltimore, Carroll, Harford, Howard, and Queen Anne’s Counties, and Baltimore city.
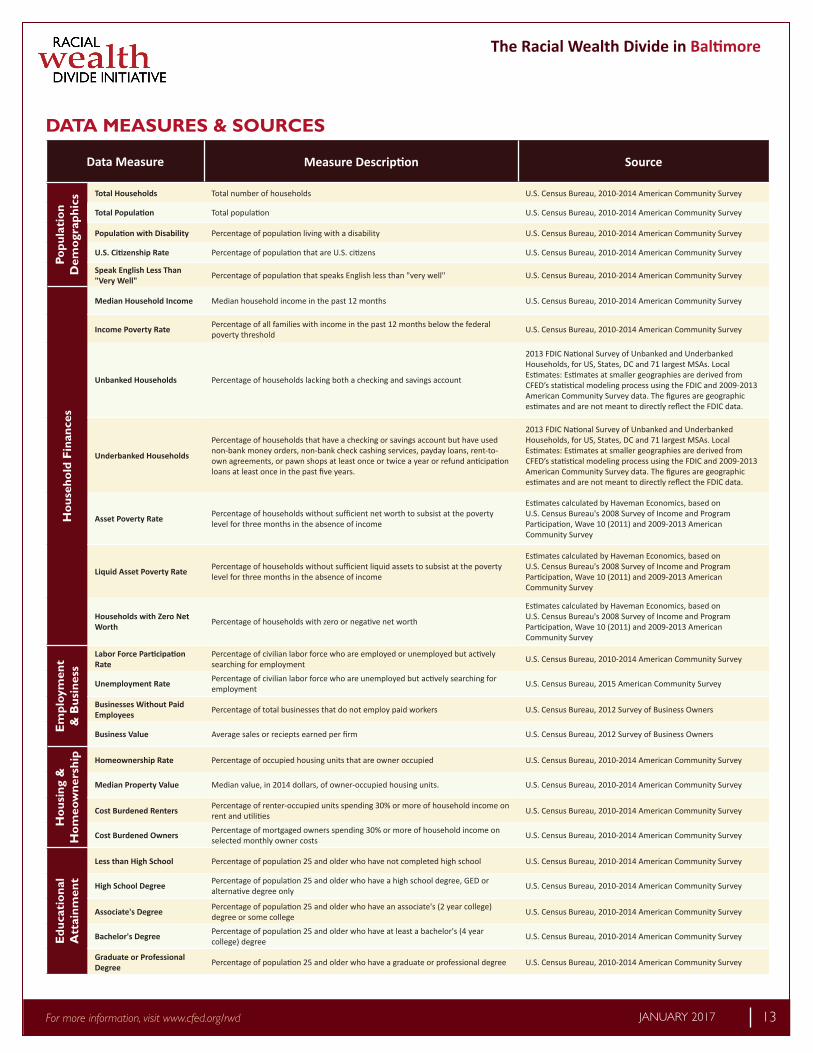
DATA MEASURES & SOURCES
Data Measure Measure Description Source
Popu
lati
on
Dem
ogra
phic
s Total Households Total number of households U.S. Census Bureau, 2010-2014 American Community Survey
Total Population Total population U.S. Census Bureau, 2010-2014 American Community Survey
Population with Disability Percentage of population living with a disability U.S. Census Bureau, 2010-2014 American Community Survey
U.S. Citizenship Rate Percentage of population that are U.S. citizens U.S. Census Bureau, 2010-2014 American Community Survey
Speak English Less Than "Very Well" Percentage of population that speaks English less than "very well" U.S. Census Bureau, 2010-2014 American Community Survey
Ho
useh
old
Fin
ance
s
Median Household Income Median household income in the past 12 months U.S. Census Bureau, 2010-2014 American Community Survey
Income Poverty Rate Percentage of all families with income in the past 12 months below the federal poverty threshold U.S. Census Bureau, 2010-2014 American Community Survey
Unbanked Households Percentage of households lacking both a checking and savings account
2013 FDIC National Survey of Unbanked and Underbanked Households, for US, States, DC and 71 largest MSAs. Local Estimates: Estimates at smaller geographies are derived from CFED’s statistical modeling process using the FDIC and 2009-2013 American Community Survey data. The figures are geographic estimates and are not meant to directly reflect the FDIC data.
Underbanked Households
Percentage of households that have a checking or savings account but have used non-bank money orders, non-bank check cashing services, payday loans, rent-to-own agreements, or pawn shops at least once or twice a year or refund anticipation loans at least once in the past five years.
2013 FDIC National Survey of Unbanked and Underbanked Households, for US, States, DC and 71 largest MSAs. Local Estimates: Estimates at smaller geographies are derived from CFED’s statistical modeling process using the FDIC and 2009-2013 American Community Survey data. The figures are geographic estimates and are not meant to directly reflect the FDIC data.
Asset Poverty Rate Percentage of households without sufficient net worth to subsist at the poverty level for three months in the absence of income
Estimates calculated by Haveman Economics, based on U.S. Census Bureau's 2008 Survey of Income and Program Participation, Wave 10 (2011) and 2009-2013 American Community Survey
Liquid Asset Poverty Rate Percentage of households without sufficient liquid assets to subsist at the poverty level for three months in the absence of income
Estimates calculated by Haveman Economics, based on U.S. Census Bureau's 2008 Survey of Income and Program Participation, Wave 10 (2011) and 2009-2013 American Community Survey
Households with Zero Net Worth Percentage of households with zero or negative net worth
Estimates calculated by Haveman Economics, based on U.S. Census Bureau's 2008 Survey of Income and Program Participation, Wave 10 (2011) and 2009-2013 American Community Survey
Em
ploy
men
t &
Bus
ines
s
Labor Force Participation Rate
Percentage of civilian labor force who are employed or unemployed but actively searching for employment U.S. Census Bureau, 2010-2014 American Community Survey
Unemployment Rate Percentage of civilian labor force who are unemployed but actively searching for employment U.S. Census Bureau, 2015 American Community Survey
Businesses Without Paid Employees Percentage of total businesses that do not employ paid workers U.S. Census Bureau, 2012 Survey of Business Owners
Business Value Average sales or reciepts earned per firm U.S. Census Bureau, 2012 Survey of Business Owners
Ho
usin
g &
H
om
eow
ners
hip Homeownership Rate Percentage of occupied housing units that are owner occupied U.S. Census Bureau, 2010-2014 American Community Survey
Median Property Value Median value, in 2014 dollars, of owner-occupied housing units. U.S. Census Bureau, 2010-2014 American Community Survey
Cost Burdened Renters Percentage of renter-occupied units spending 30% or more of household income on rent and utilities U.S. Census Bureau, 2010-2014 American Community Survey
Cost Burdened Owners Percentage of mortgaged owners spending 30% or more of household income on selected monthly owner costs U.S. Census Bureau, 2010-2014 American Community Survey
Edu
cati
ona
l A
ttai
nmen
t
Less than High School Percentage of population 25 and older who have not completed high school U.S. Census Bureau, 2010-2014 American Community Survey
High School Degree Percentage of population 25 and older who have a high school degree, GED or alternative degree only U.S. Census Bureau, 2010-2014 American Community Survey
Associate's Degree Percentage of population 25 and older who have an associate's (2 year college) degree or some college U.S. Census Bureau, 2010-2014 American Community Survey
Bachelor's Degree Percentage of population 25 and older who have at least a bachelor's (4 year college) degree U.S. Census Bureau, 2010-2014 American Community Survey
Graduate or Professional Degree Percentage of population 25 and older who have a graduate or professional degree U.S. Census Bureau, 2010-2014 American Community Survey
The Racial Wealth Divide in Baltimore
For more information, visit www.cfed.org/rwd14 JANUARY 2017
BUILDING HIGH IMPACT NONPROFITS OF COLOR PROJECT
In order to address the national challenge of a broad and deep racial wealth divide, communities of color need nonprofits of color with high-impact asset-building services. CFED’s Racial Wealth Divide Initiative aims to strengthen the capacity of nonprofits of color to support economic opportunity through the work of the Building High Impact Nonprofits of Color project.
The project has three key goals: to build leadership and organizational capacity, improve organizations’ understanding of the connection between assets and the racial wealth divide, and provide networking and convening opportunities so organizations of color can build strong relationships within and across networks.
By the end of 2017, this project will equip more than 20 organizations with strategies and skills to launch, expand or improve wealth-building initiatives for communities of color across the country. CFED’s Racial Wealth Divide Initiative will continue partnering with organizations to support their growth and development, share CFED resources and analysis and continue learning about best practices for addressing racial economic inequality at the local level.
Below are the six nonprofit organizations of color that the Racial Wealth Divide Initiative is working with in Baltimore, MD. Each of these organizations is working within their respective communities to help bridge the racial wealth divide and promote financial literacy and capability in their communities. Despite the widening of the racial wealth gap, these organizations and others like them are developing, piloting, managing and replicating primer programs and best practices to address the inequalities in Baltimore and the nation.
Baltimore, MD: Building High Impact Nonprofits of Color
Bon Secours Community Works (https://bonsecours.com/baltimore/our-services/community-services/family-support-center) Bon Secours Community Works’ (Community Works) mission is to enrich West Baltimore communities with programs and services that contribute to the long-term economic and social viability of neighborhoods. Community Works provides family support services, workforce development, and economic education. Community Works impacts low-income residents of southwest Baltimore, 93% of whom are African American and 69% are women. In 2016, Community Works worked with approximately 2,400 low-income area residents, helping 104 clients gain employment; 207 families avoid homelessness through their Eviction Prevention Assistance Program; 60 clients earn their Certified Nursing Assistant (CNA) or Geriatric Nursing Assistant (GNA) certification; employed and trained 32 youth in the 8-week summer work and career prep program; and enrolled 212 clients in the Re-Entry Life Skills Training Program. Community Works addresses racial wealth inequality by providing multiple services to address the wraparound needs of low-income families in Baltimore.
Center for Urban Families (www.cfuf.org)Center for Urban Families’ (CFUF) mission is to disrupt poverty in Baltimore and across the country. CFUF strengthens urban communities by helping fathers and families achieve stability and economic success. CFUF is changing kids’ lives one adult at a time. CFUF primarily serves low-income African American parents and more than half have been previously incarcerated. CFUF is located in and anchors West Baltimore. CFUF provides a host of community development and economic empowerment services. Between, 2010 and 2015, 60,000 children and their parents have been impacted by CFUF. 27,006 individuals have received services through program activities, and 3,543 members have gained full-time job placements. CFUF strategies to address racial economic inequality include providing individuals with a safe space to heal from past trauma, while also creating sustainable change by providing ongoing wraparound services. Additional, CFUF emphasizes responsible fatherhood as Baltimore’s primary anti-poverty strategy, changing the outcomes for multiple generations of disenfranchised Baltimore citizens.
15
15
The Racial Wealth Divide in Baltimore
For more information, visit www.cfed.org/rwd For more information, visit www.cfed.org/rwd 15 JANUARY 2017
Druid Heights Community Development Corporation, Inc (www.druidheights.com) Druid Heights Community Development Corporation, Inc.’s (Druid Heights) mission is to cause, encourage and promote community self-empowerment through the development of economic, educational, employment and affordable housing opportunities. Druid Height’s service area is Central West Baltimore. Druid Heights provides various community development and economic empowerment programs including: HUD certified housing counseling, affordable and market rate housing developments, after-school homework assistance and tutoring, re-entry services, financial literacy classes, and job readiness training. Annually, Druid Heights provides housing counseling services to over 450 individuals and serves over 200 youth. To date, Druid Heights has built 213 housing units, removed blight and demolished 214 vacant buildings, which created community green space and reduction of open air drug markets. Druid Heights seeks to narrow the racial economic divide by increasing income and asset building opportunities for families and youth through education, employment and housing services.
Latino Economic Development Center (www.ledcmetro.org) Latino Economic Development Center’s (LEDC) mission is to drive the economic and social advancement of low- to moderate- income Latinos and other underserved communities in the Washington, D.C. and Baltimore Metropolitan Area by equipping them with the skills and tools to achieve financial independence. LEDC’s bilingual and multicultural staff support clients in purchasing homes, building businesses and advocating to preserve the integrity of their communities. LEDC has four core program areas: small business development; small business lending; homeownership; and affordable housing preservation. In 2015, through these program areas LEDC has trained over 700 entrepreneurs, helped 130 families avoid foreclosure, organized and educated 3,000 tenants to preserve 60 buildings with affordable rents and helped in the creation of 60 new businesses. LEDC’s strategies to address the racial wealth divide include financing and educating entrepreneurs and microenterprises, helping aspiring homeowners purchase homes and those with homes avoid foreclosure, and organizing tenants to preserve affordable housing in quickly changing communities.
Muse 360 Arts (www.muse360.org) Muse 360 Arts’ mission is to provide Baltimore youth of diverse backgrounds with high quality artistic training and experiences that inspires them to reach their full potential in life. Muse 360 Arts serves over 400 youth annually in Baltimore City. Muse 360 Arts manages three core programs which use the arts to educate, build confidence, instill discipline, and drive cultural awareness while creating and empowering leaders. Muse 360 Arts’ vision is to guide people in their pursuit of cultural arts and personal development to ultimately facilitate change in their community. Muse 360 Arts serves over 1,000 people annually and provides financial literacy, business skills, arts and entrepreneurship workshops to 60 youth annually. Muse 360 Art’s strategy to address racial wealth inequality is to build intellectual competencies in critical thinking and empowered leadership and expose youth to a broader perspective of the world to be leaders in their communities and globally.
Urban Alliance (http://theurbanalliance.org) Urban Alliance’s (UA) mission is to empower under-resourced youth to aspire, work and succeed through paid internships, formal training and mentorship. UA serves economically disadvantaged high school students who are on the verge of graduation, but are at high risk of not connecting to continued education or sustainable work. Program activities include: professional paid internships, job skills training and professional “soft skills” development training, career mentorship, financial literacy training, case management, alumni follow up services, early college and dual enrollment, and curriculum outreach. 100% of UA interns graduate from high school on time, 80% of alumni connect to work or education pathways that lead to economic self-sufficiency within one year post program. UA’s strategies to address racial economic inequality are to help under-resourced youth transition into the workplace through comprehensive programs; to advocate and promote pathways to employment by encouraging career training and job experiences and providing structure through links between high schools and employers. In addition, collect and publicize data on positive results of high-quality interventions and outcomes for young people involved in early work development programs.
The Racial Wealth Divide in Baltimore
For more information, visit www.cfed.org/rwd16 JANUARY 2017
BUILDING HIGH IMPACT NONPROFITS PROJECT PARTNERS
CFED’s work makes it possible for millions of people to achieve financial security and contribute to an opportunity economy. We scale innovative practical solutions that empower low- and moderate-income people to build wealth. We drive responsive policy change at all levels of government. We support the efforts of community leaders across the country to advance economic opportunity for all. Established in 1979 as the Corporation for Enterprise Development, CFED works nationally and internationally through its offices in Washington, DC; Durham, North Carolina, and San Francisco, California.
Racial Wealth Divide Initiative (RWDI) at CFED works to strengthen the ability of all CFED’s programs to proactively address racial wealth inequality and deepen analysis of asset poverty challenges impacting communities of color. RWDI launches and implements projects that highlight best practices for eradicating racial wealth inequality, including collaborating with local and regional organizations. RWDI supports the efforts of CFED and its partners to drive policy solutions that reduce racial economic inequality at the national, state and local levels.
JPMorgan Chase & Co. is a leading global financial services firm with assets of $2.4 trillion and operations worldwide. The firm is a leader in investment banking, financial services for consumers and small businesses, commercial banking, financial transaction processing and asset management. A component of the Dow Jones Industrial Average, JPMorgan Chase & Co. serves millions of consumers in the United States and many of the world’s most prominent corporate, institutional and government clients under its JPMorgan and Chase brands. The firm uses its global resources, expertise, insights and scale to address some of the most urgent challenges facing communities around the world, including the need for increased economic opportunity.
The Center for Public & Nonprofit Leadership at Georgetown University’s McCourt School of Public Policy is a leading education, research and training center dedicated to the development of public, nonprofit and philanthropic leadership. Our programs for students, practitioners and policymakers increase their capacity to work across organizations, communities and sectors to address public needs, tackle public problems and, above all, promote the public good.
cfed.org/rwd soundcloud.com/rwdpodcast
Bridging the Racial Wealth Divide
facebook.com/racialwealthdivide/
FOLLOW US ON SOCIAL MEDIA!